
In a world where economic certainties are increasingly rare, the Federal Reserve’s latest rate cut announcement and the so-called “agreement” between the U.S. and China offer only temporary relief from deeper, long-term challenges. The markets may cheer short-term wins, but beneath the surface, unprecedented monetary stimulus, fragile global supply chains, and a rapidly evolving data center financing boom are reshaping the landscape for investors and policymakers alike. As history reminds us, the most creative financial engineering often emerges in the late stages of a cycle. This week we look at the tangled web of central bank policy, the big picture behind the US vs China trade war, and the $800 billion debt wave powering the AI revolution, asking: are we prepared for what comes next?
Fed Delivers, Sort of
There was a 100% chance (according to the futures market) that the Fed would cut rates at their meeting last week. The Fed delivered on that one.
Going into the meeting there was an 85% chance the Fed would also cut rates in December. That probability is down to 50% after Fed Chair Jerome Powell repeatedly pushed back on the "certainty" of another cut this year.
One Fed member voted against the cut. Another wanted a 50 bp cut instead of the 25 bp that was approved. This cut was classified as more of a maintenance cut. Like all of us, the Fed doesn't have much data to go on with the government shutdown. We do have the individual state unemployment claims. Firms who have looked at all of the states weekly filings are reporting the labor market is still stable. The Fed surveys show businesses are still on the fence when it comes to raising their prices due to tariffs. Most are still taking a 'wait and see' approach, which is sort of what the Fed is doing – give the markets what they wanted over the short-term and see where we land in December.
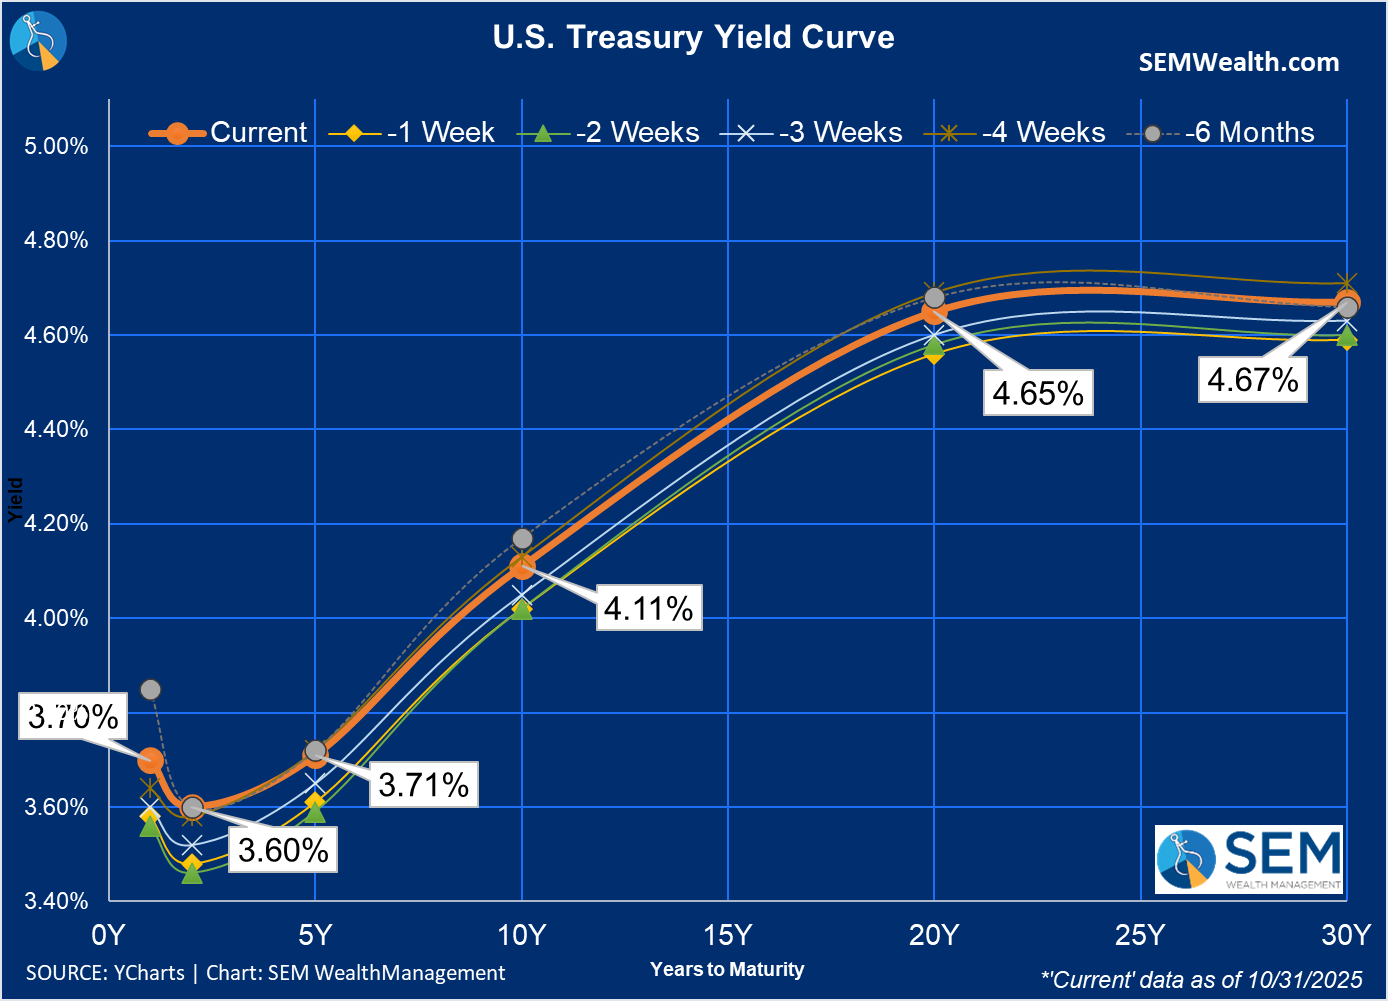
The market was obviously positioned for more and didn't like the 'wait and see' message. Most rates INCREASED last week, nearing 6 month highs. Remember, the Fed sets SHORT-TERM rates it uses with banks. The MARKET sets all other interest rates.
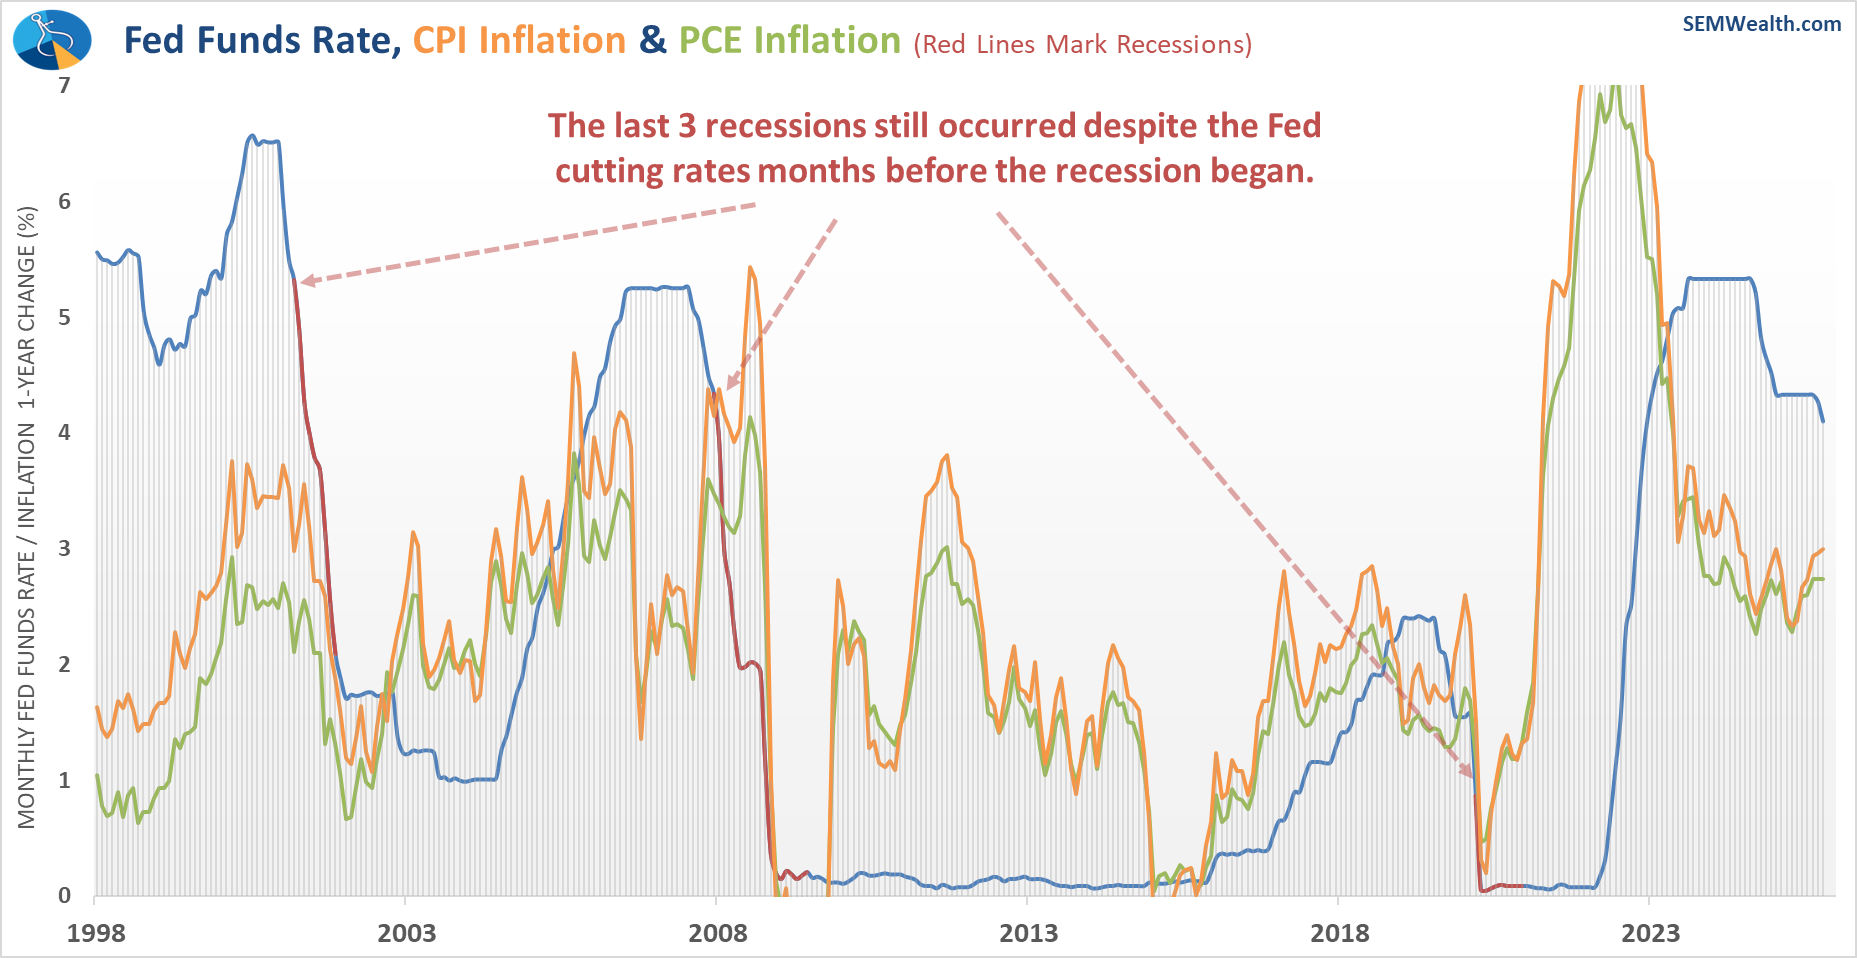
Here's the updated Fed funds and inflation chart. I will again remind everyone the fact the Fed is cutting rates does not mean we won't have a recession. In fact, in nearly every case, the Fed cut rates ahead shortly before we entered a recession. Of course this time is unprecedented as we've never seen as much stimulus flood the economy as we did during COVID, which left the Fed going from 0% rates to over 5% in a very short time.
Speaking of unprecedented, the Fed's Balance Sheet is apparently close to "equilibrium" according to the Fed. This means that as soon as December they will no longer simply let the bonds they own "roll off" at maturity, but will instead reinvest in Treasury Bills. This program was called "quantitative tightening".
Before the financial crisis "equilibrium" for the Fed was around $1 Trillion on their balance sheet. After the financial crisis when they finally attempted to unwind the various "QE" programs, they stopped at $4 Trillion. Now it appears the Fed will keep around $6.5 Trillion on their balance sheet, including $4 Trillion of Treasury securities.
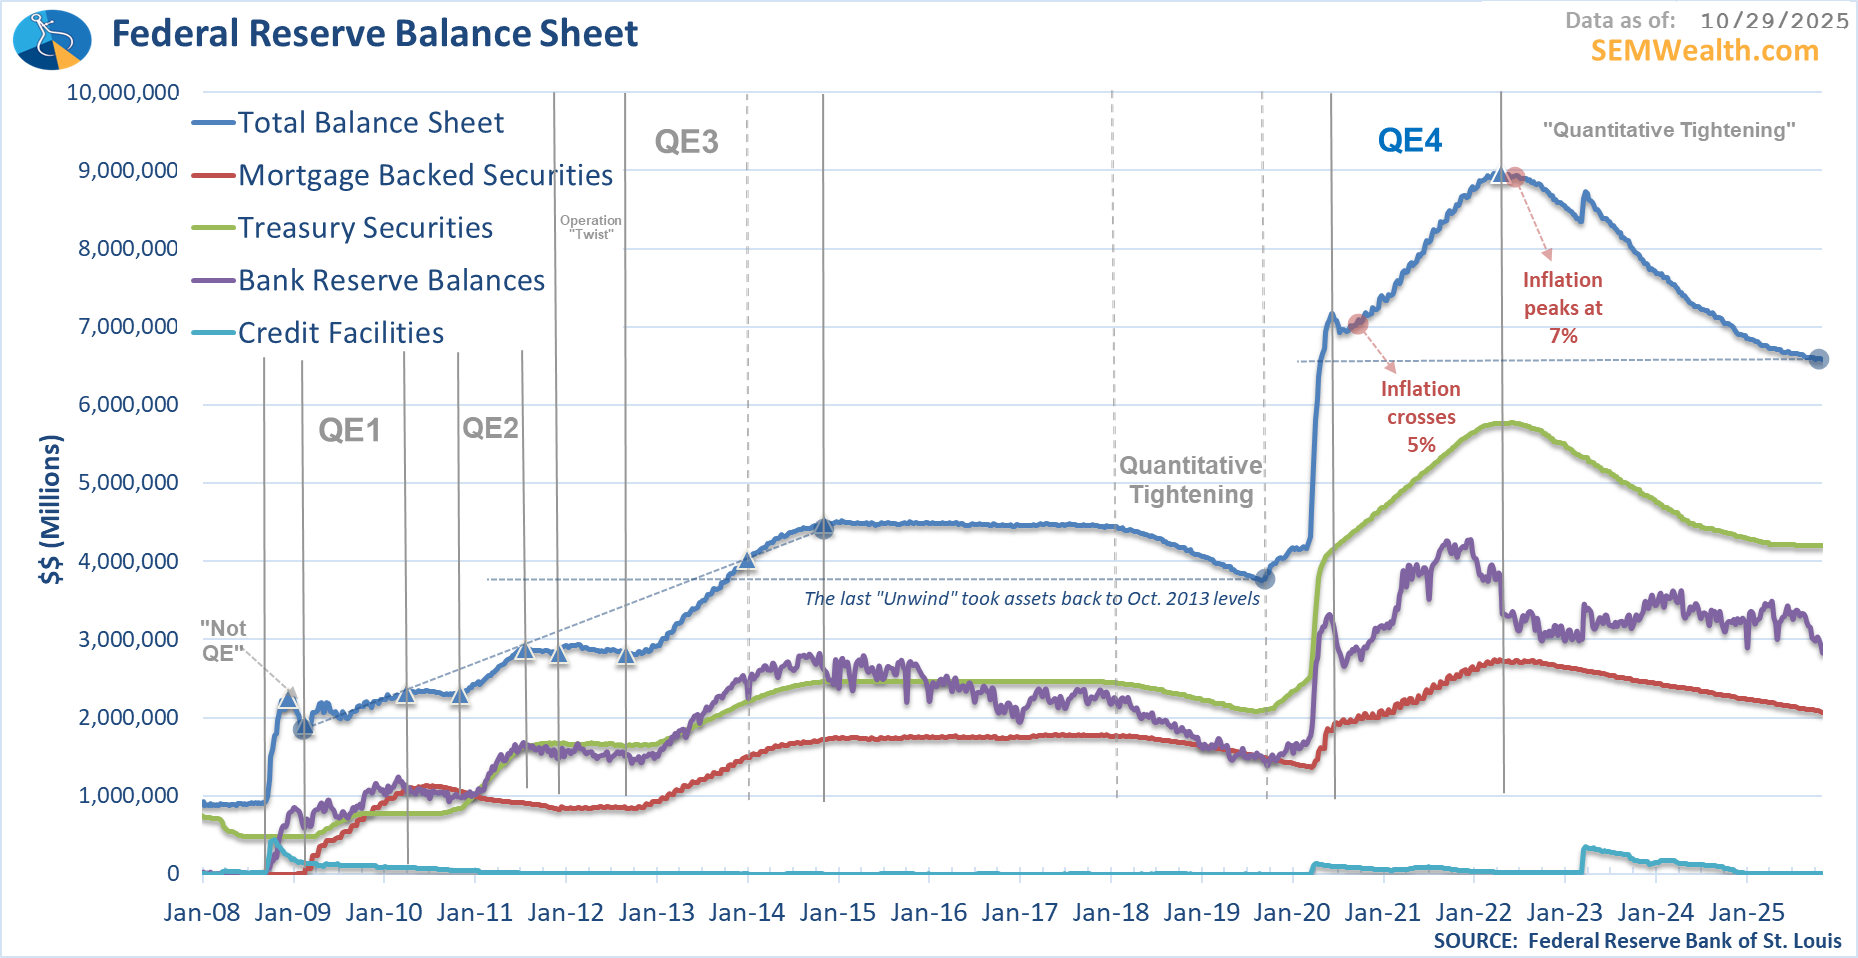
Not showing up in the chart, but something to keep your eye on – the last 4 weeks has seen usage of the Fed's "Repo" program, which is typically used by banks facing excess liquidity needs. Last week it was 'only' $10 Billion, but it was at $0 a month ago. I'll keep updating the Balance Sheet data each week and report back if we see continued increases in usage.
Agreement or Truce?
The markets cheered the latest trade "agreement" last week as it was between the two biggest players in the global economy – the US and China. While anybody watching should be relieved the rhetoric has toned down, the "agreement" was limited to just a few areas. More importantly it's just a 1-year agreement. Many articles I read over the weekend described it more of a "truce" or "cease fire" than an actual path forward.
Essentially what this is doing is buying both sides time. The US is attempting to diversify our supply chain away from China as quickly as possible. COVID highlighted the risks to our economy if we rely on China for every piece of the supply chain. As the US has gained ground this year through tariffs and agreements with other trading partners, China decided to remind us the clout they have behind the driver of the stock market since 2023 — AI. The increasing use of "rare earth" in the advanced chips needed for our data centers and other computers behind this fledging advancement in technology gives China an advantage as 70% of all mining of rare earth metals and 90% of the processing of these models occurs in China. The US over the past few weeks as announced deals with Japan and Australia for rare earth exports. Several US based miners are exploring the possibility that we may have them in our own US based mines. This "agreement" gives us a year to solidify our rare earths supply chain.
China, despite the strong front they push out via their "data" is struggling by all accounts. Their real estate market is imploding along with their nascent middle class. China NEEDS the US consumer, so quieting the rhetoric, agreeing to buy soy beans from us, and promising to curb chemicals used for fentanyl in order to hopefully remove the "liberation day" tariffs is all necessary. The hope is reduction in tariffs will increase China's exports to the US again to buy them time to stabilize their economy.
The Battle for Economic Dominance
The US has enjoyed an economic (and military) hegemony since the 1950s. During that time China has been planning on how they could at a minimum become a dual-power to the US with the hope of becoming the sole power (both economically and militarily). What is happening now is the result of DECADES of policies and decisions. This goes well beyond short-term "agreements" and what they do for stock prices. Some people have been frustrated with what they view as overly critical assessments of some of President Trump's decisions. As I try to remind people – I am offering data driven, historically researched analysis of what is happening. I won't go into the microdetails of the policies in question.
One thing I often say is, "at least this President is doing something." We NEED to produce more things in the US. We NEED to put more US workers to work. We NEED to not be reliant an one country for our supply chain. I've said that literally this entire century. No President has had the guts to stand up to China. I hope BOTH PARTIES realize this is a pressing issue and not a one-term focus that we can ignore.
China understands this and has been planning for decades to take over. The lines are being drawn. So far we have two clear sides:
China-Russia-Iran-North Korea
vs.
US - Japan - Australia
India is a wild card. They are trying to play both sides. India was at both the Chinese summit and their celebration of the 80th anniversary of their victory over Japan. India also has visited the White House and attended summits with the US.
I did not include Europe in this list because while we would like to believe Europe is on our side, it is not a given. They have increasingly relied on China for their own supply chain. China is also trying to put a wedge between us and them.
Too much is at stake for both sides. This 1-year "truce" is nice, but we also know that any of these agreements are especially fragile. This is a LONG-TERM situation that should be on everyone's list of "things that could go wrong" when they are planning for the future.
Side note: While at SEM we do not project any future event, we rely on what has been the key to our survival all of these years — data driven, quantitative strategies that focus on the TRENDS behind the market. While not needing to be used too often, we have "safe harbors" that could be deployed which 'should' be able to whether the storm while we wait for things to settle down. Past performance is not a guarantee of future results, but there are only so many things you can plan for without doing harm to your long-term financial prospects.
The Tangled Web of Data Center Financing
Matt Levine from Bloomberg's Money Stuff blog and podcast is a former investment banker who loves to break down the complex financial structures we see on Wall Street. Lately he has been talking a lot about the "financial engineering" in the AI space. One article last week discussed a few deals including Meta's Hyperion Data Center in Louisiana. It mirrors other deals we have been seeing although is much more simple than the web of deals being used to build some of Oracle's data centers. I put together this graphic to illustrate the accounting entries being used to build these data centers.
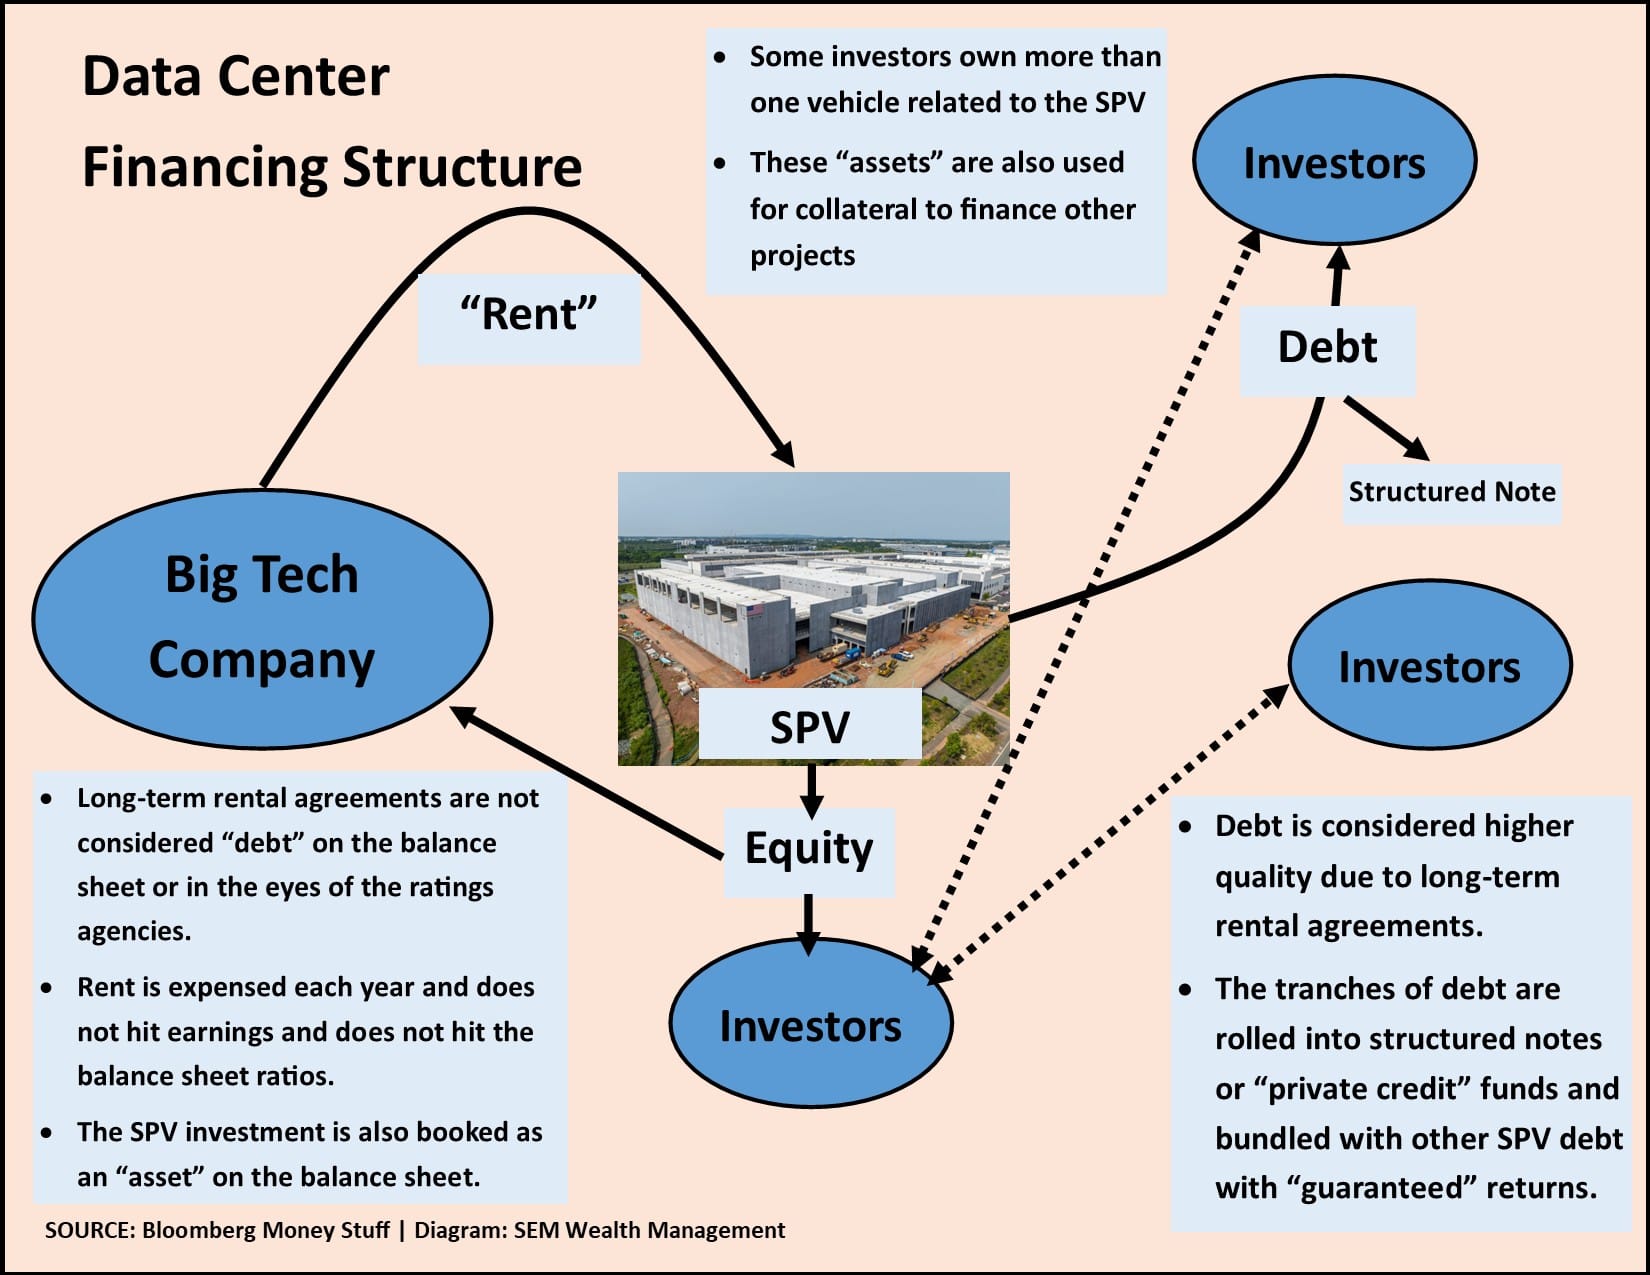
While it is misleading for the big tech companies to not take on debt to build data centers inside a Special Purpose Vehicle (SPV) that they partially own using the long-term "rent" contracts to secure the financing, the bigger issue remains in the companies selling and investing in both the equity, the debt, and the other vehicles tied to the debt. While this is not of the scale of the sub-prime mortgage market that nearly brought down the entire economy in 2008, it not only echoes the "creative" vehicles being used for the "high speed" internet buildout in the late 1990s it takes it much further.
Perhaps Wall Street is much smarter now and they learned their lesson. Perhaps AI will be bigger and more profitable than the nationwide network buildout and everyone investing in it will win. Perhaps we are still so early in the AI buildout there is so much upside the risks are mitigated. Perhaps I'm being overly cautious and may miss out on some "low risk, high return" investments in these private credit funds and the structured notes we are seeing being offered more and more each day.
Of course on the other side of the equation is the fact SEM's "caution" and "conservatism" in not investing in "new" or "unique" opaque "private" investments in the 1990s and mid-2000s kept our clients from losing significant amounts of money.
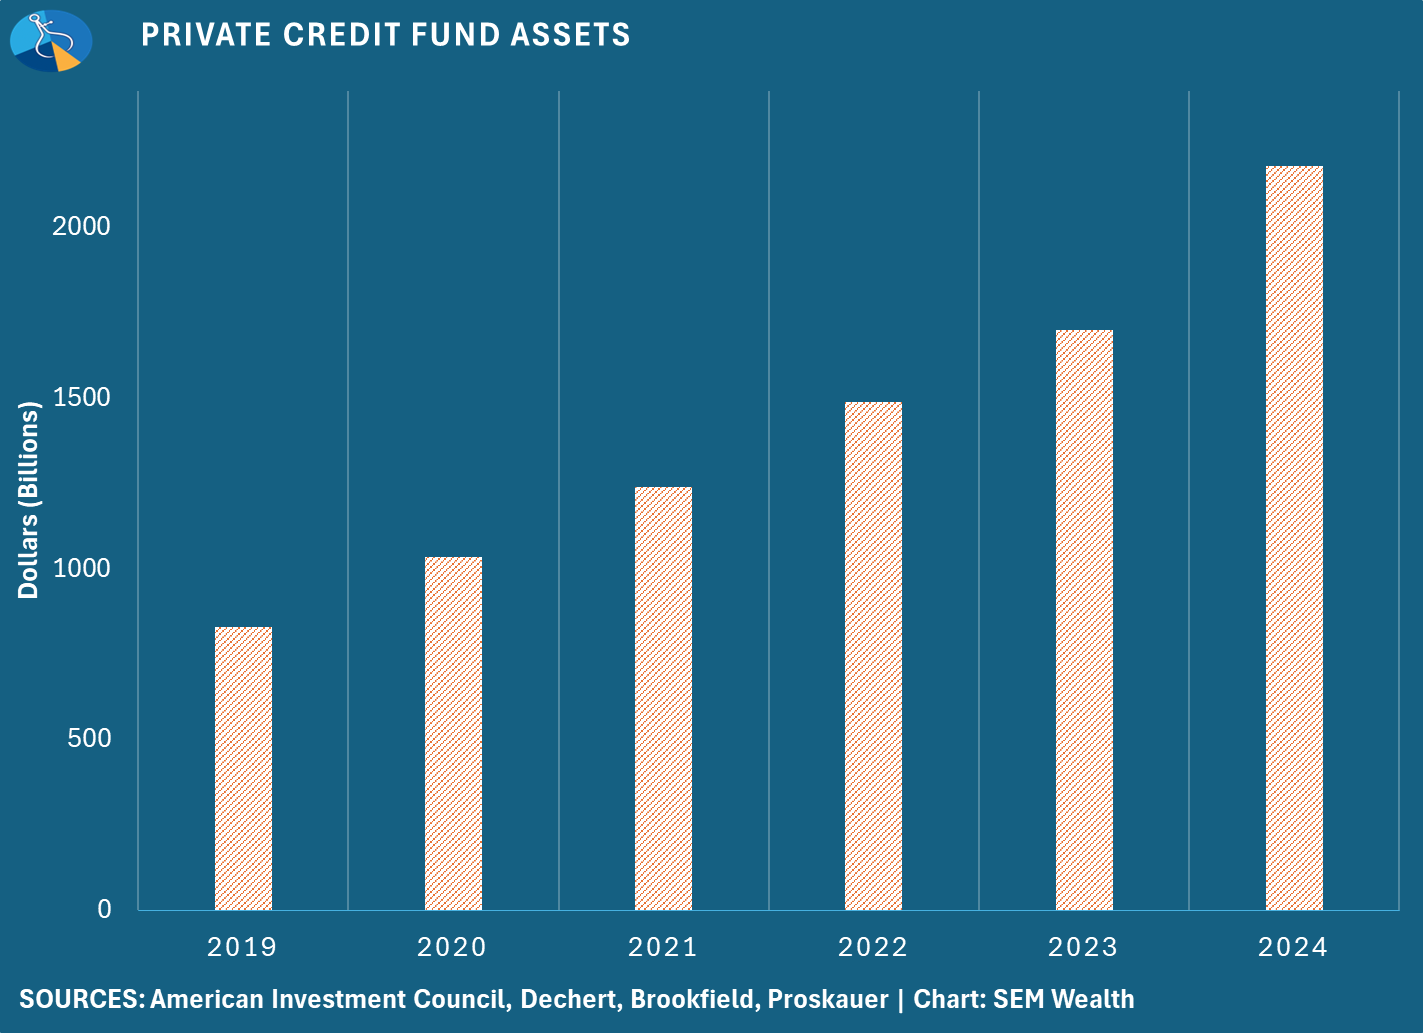
An $800B Debt Need
Morgan Stanley is estimating over the next 4 years an additional $800B will be necessary to fund the demand for new data centers. Almost all of that will be financed by debt. This does not include the necessary energy infrastructure build-out to power these data centers. Our power grid was already woefully behind. This will only create a bigger need to update all sections of the grid.
How will this be funded? Most likely via private credit. Is that a good thing? I guess time will tell, but historically the push into creative "low risk, high yield" investments leads to more and more "creativity" to offer the very highest yield. For now, there have been willing buyers from insurance companies and pension funds. President Trump wants to allow your 401K plan to invest in these funds as well.
Again, is this a good thing? Historically it has not been. History doesn't repeat, but it most certainly rhymes. We saw similar "creativity" occurring in the mid-to-late 90s and again in the mid-2000s. The vehicle names may be different but the structure is the same:
- A company needs to raise money to meet "historic" demand
- The public markets are unwilling to finance that demand, especially at "reasonable" rates
- Wall Street helps arrange private financing
- Investors love "low risk", "high yield" investments, especially in the later stages of the economic cycle
- The longer we go without any issues, the more "low risk" these vehicles become
- Eventually some of the later offerings cannot meet their promises and the "low risk" curtain is removed
- Investors try to cash out, creating liquidity issues up the chain and putting everything based on the "historic" opportunity in jeopardy.
- Lawsuits happen, Congressional hearings are held, (maybe) new laws are created.
- Time goes by without any incidents and we cycle back up to the top
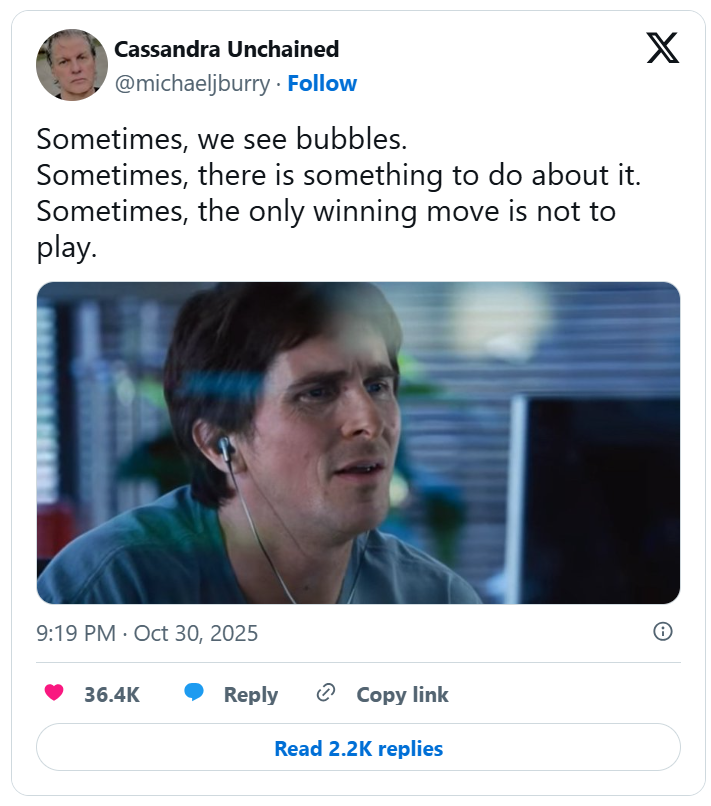
"Sometimes its better not to play"
Michael Burry, of "The Big Short" fame tweeted this out last week:
Given what we've seen the past few months, there are a few guesses about what he is talking about. The fact I have to keep writing about the "deals" happening in the AI space provides another clue.
Last week I asked the students in my class at Liberty University who had watched The Big Short. Out of 50+ students, only 3 had watched it. During my FPA Symposium presentation I asked the same. About 7 of the 65+ people in the audience had watched it.
Think about this — 20 years ago we were just getting to the "creative" part of the housing bubble. 15 years ago we were already recovering. This means if you are using 15 year's worth of data to evaluate your investment options, you no longer have the financial crisis as a measure of the actual risk in your portfolio. The "advertising rules" prevent us (and all SEC-registered advisors) from cherry picking specific dates so you have to use standardized periods (1, 3, 5, 10, 15, 20, 25 years, along with "since inception). Since most of the products I see people using do not have a 20 year track record, the LONGEST period being studied does not include any true recessionary bear market.
During periods of market stress, many "non-correlated" assets suddenly become correlated. This obviously can pose problems if your models assumed you would have "diversification" benefits.
I'm not saying we are approaching another financial crisis, but history, the data, and our models show that something is brewing. My experience finds me increasingly having uncomfortable thoughts as I read about the latest "creative" vehicle being used to "enhance" returns. Remember, history doesn't repeat, but it most certainly rhymes. Human nature, specifically our NATURAL fear-greed cycle of emotions is what drives this. The "what" may be different, but the "why" and "how" will be the same.
As Michael Burry said, "sometimes the only winning move is not to play," which has been our take on these "creative" vehicles we see emerging in the market place.
Toby's Take
10/27/2025 - Trump Reaches Trade Pacts With Southeast Asian Nations - WSJ
President Trump has reached trade agreements with Malaysia and Cambodia. He has also gotten frameworks for deals with Thailand and Vietnam. The deals with Malaysia and Cambodia will help the U.S. out with lower tariffs and regulations on vehicles and farm products. Trump's administration said that Malaysia and Cambodia would also buy more U.S. goods. This means that we can expect automobile companies sales to rise in turn likely raising their stock prices.
10/28/2025 - Trump’s Big Tariff Task on Asia Tour Is to Close the Deal - WSJ
President Trump's week in Asia is to hopefully bring many trade agreements with all countries to help with U.S. exports. The most important countries to watch for right now are South Korea and China. With South Korea they have many automobiles that are subject to tariffs and China has control over almost all of the world's rare-earth. These talks are set to happen in the next couple days. Depending on how they go the market could react quickly. As of right now things are stable with SEM's models going at similar rates as the S&P 500, but these talks could shake the table a bit.
10/29/2025 - White-Collar Jobs Vanish, Corporate Layoffs Continue as AI Starts to Bite - WSJ
There seems to be a trend of white collar workers losing their jobs with no other place to go. Due to growth in AI, many white collar workers are being laid off. This is going to be really dangerous for the job market causing a lot less consumer spending. It was a pretty down day in the markets, this possibly being one of the causes. If AI continues to grow, then we can assume the same will happen with this trend.
10/30/2025 - Trump Meets With China’s Xi, Declares Immediate Tariff Cut - WSJ
After many years, the United States and China have meet face-to-face! President Trump said in an interview after the meeting that if he had to rate it on a scale of 1-10, he said it was a 12! This is great news. What we know after the meeting is that President Trump agreed to lower tariffs 10% leaving them at 47% and China agreed to take "very strong action" on the chemicals used to produce fentanyl. Other agreements that came out were that China agreed to both ease up some of the restrictions on their rare-earth minerals for one year and to buy a very large amount of U.S. soybeans. This can possibly increase farm related stocks, computer/AI chip company stocks, and defense contractors.
10/31/2025 - More Home Purchases Are Falling Through in an Uncertain Economy - WSJ
The housing market is in a tough and confusing state. Sellers are looking at the current prices and wanting to sell for big profits, but buyers are not willing to pay that much for a house. The problem is that both sides are stubborn. If a seller isn't getting an offer that they like, they simply just take the house off listing. If a buyer gets an inspection back and sees any problems and the seller isn't willing to give big discounts for it, they won't buy it. This is causing the housing market to stall. In a difficult and confusing time, speaking as a person shopping for a home, getting professional help with finances is seeming more and more necessary.
Market Charts
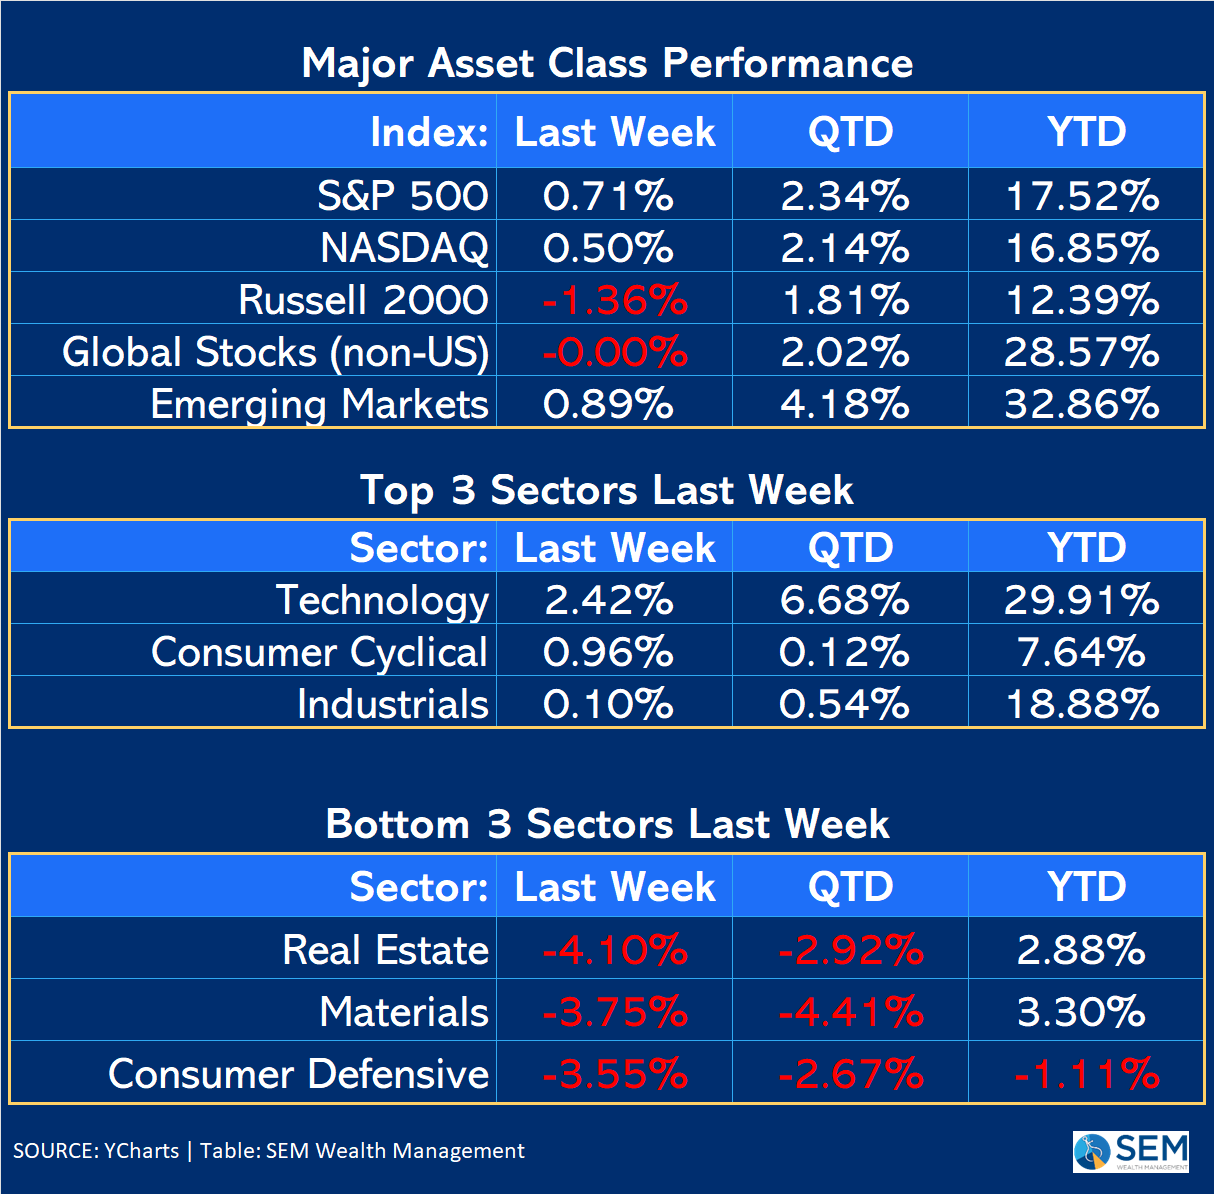
It was another technology driven week for stocks and small cap stocks falling for the week. All the gains came on Monday & Tuesday (technically Sunday night and early Monday given the "gap" up to start the week.
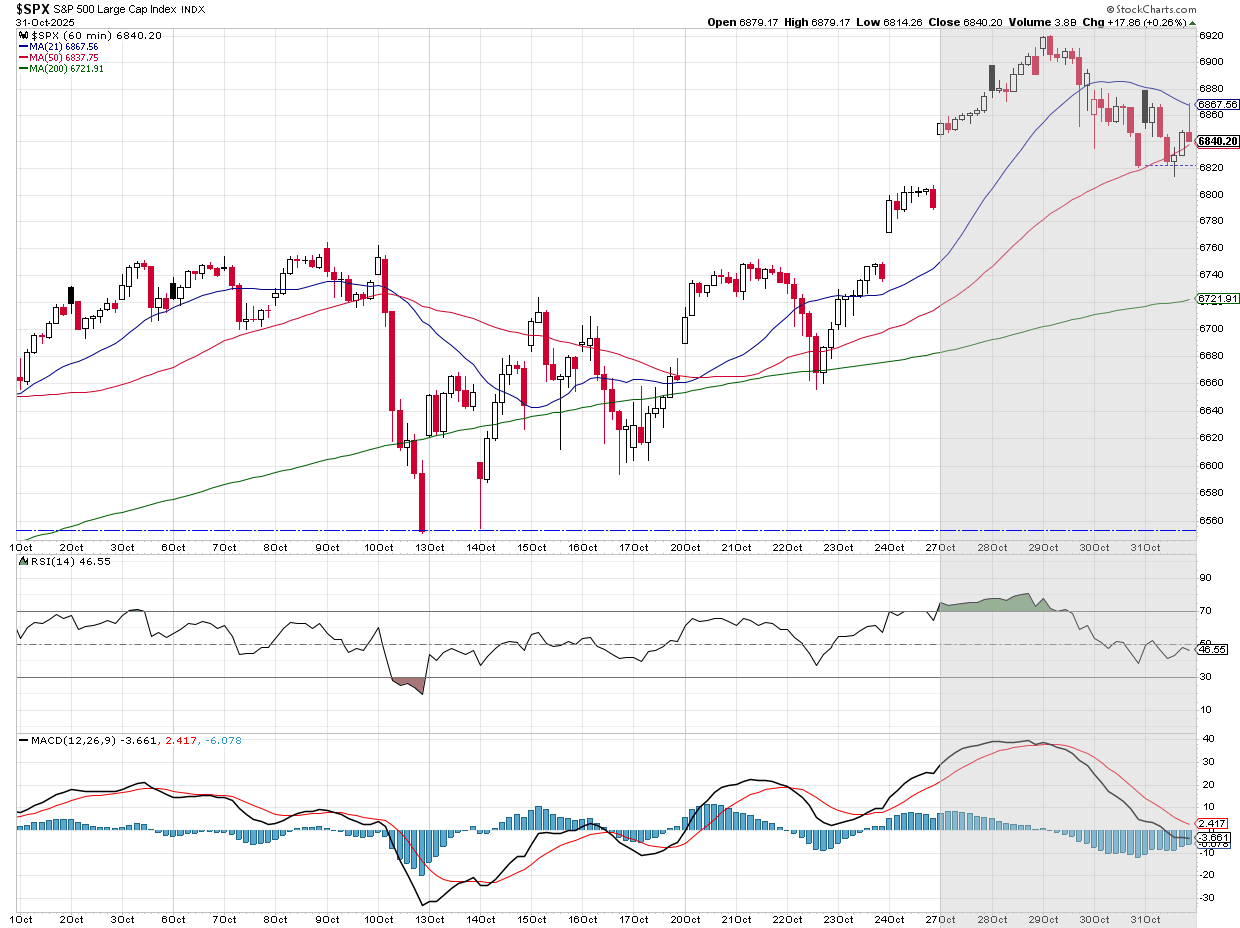
Since ending their rate hiking cycle 2 years ago, the S&P 500 has returned a whopping 68%. The only real blip was the 19% drop following "liberation week". The last time I saw the Fed cut rates with stocks at all time highs was in August 2007 well before the "sub-prime" crisis started hitting the economy. I'm not sure why I bring that up, but it could be an interesting tidbit if the "creative financing" we are seeing ends up cratering.
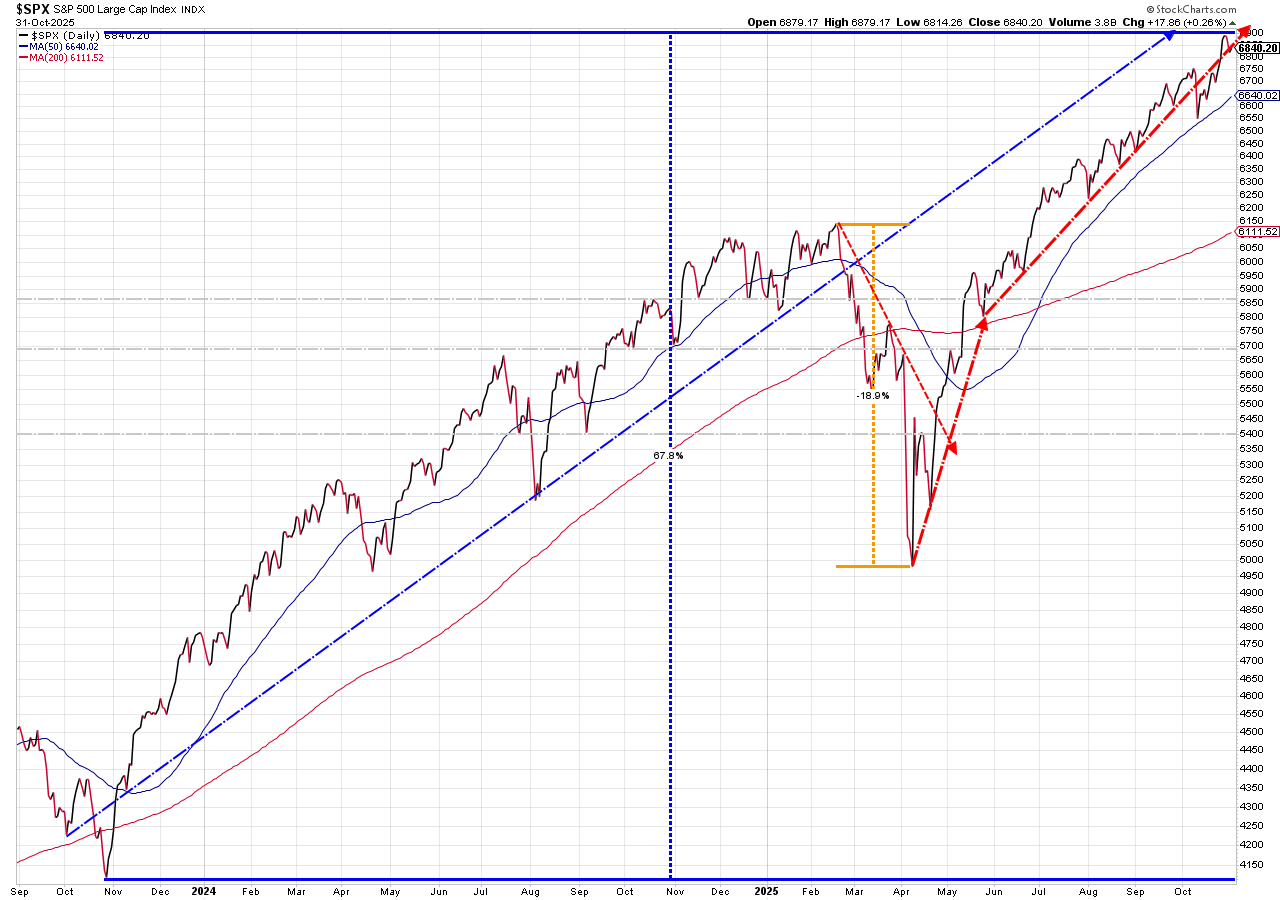
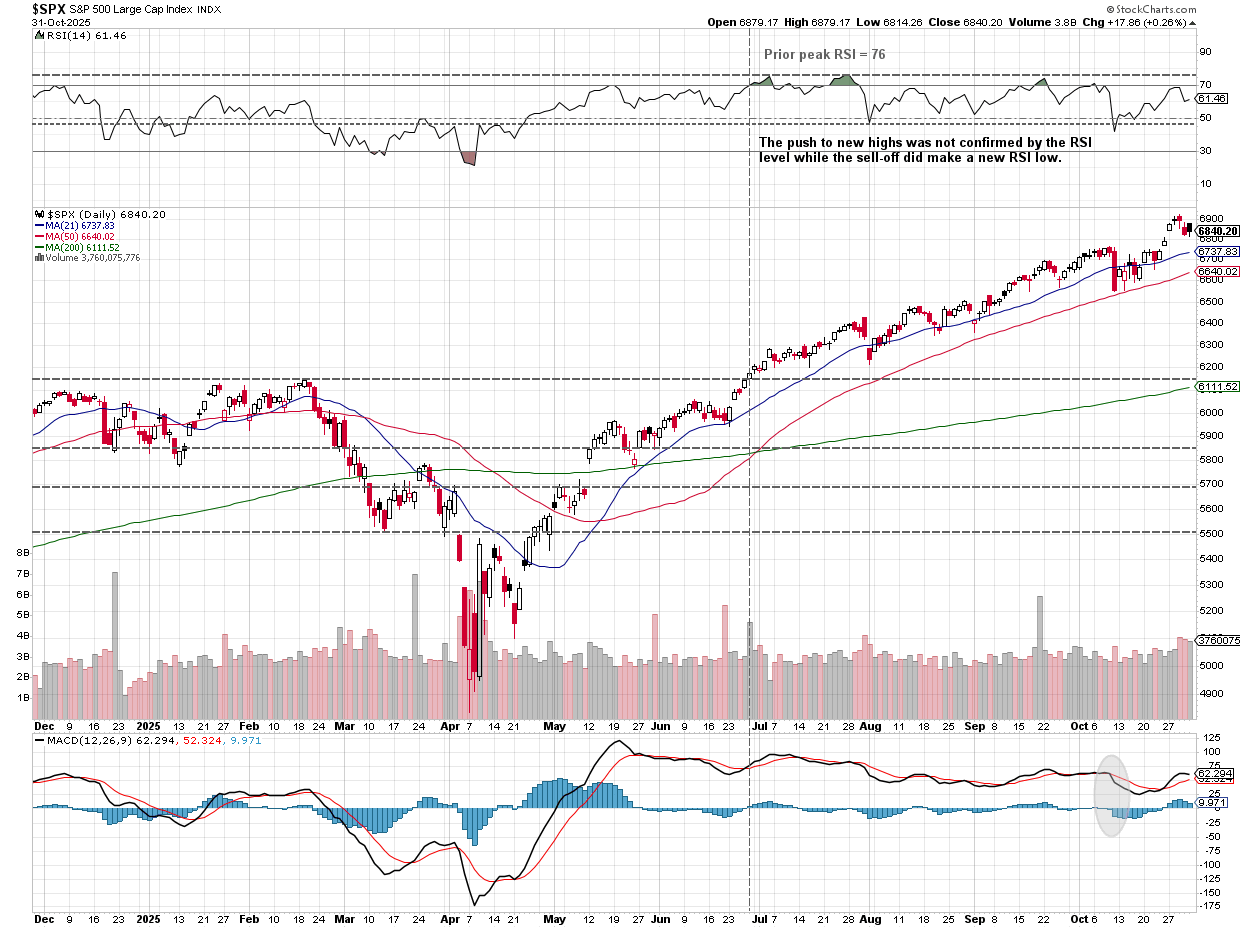
From a technical perspective the biggest concern remains the lack of follow-through from the rest of the market. Ever so slightly, the momentum seems to be fading with the RSI failing to confirm the all-time highs and then hitting a lower low on the sell-off a few weeks ago. This doesn't by itself end the rally, but it is a warning that without some solid buying into the market the rally is due for a pull-back.
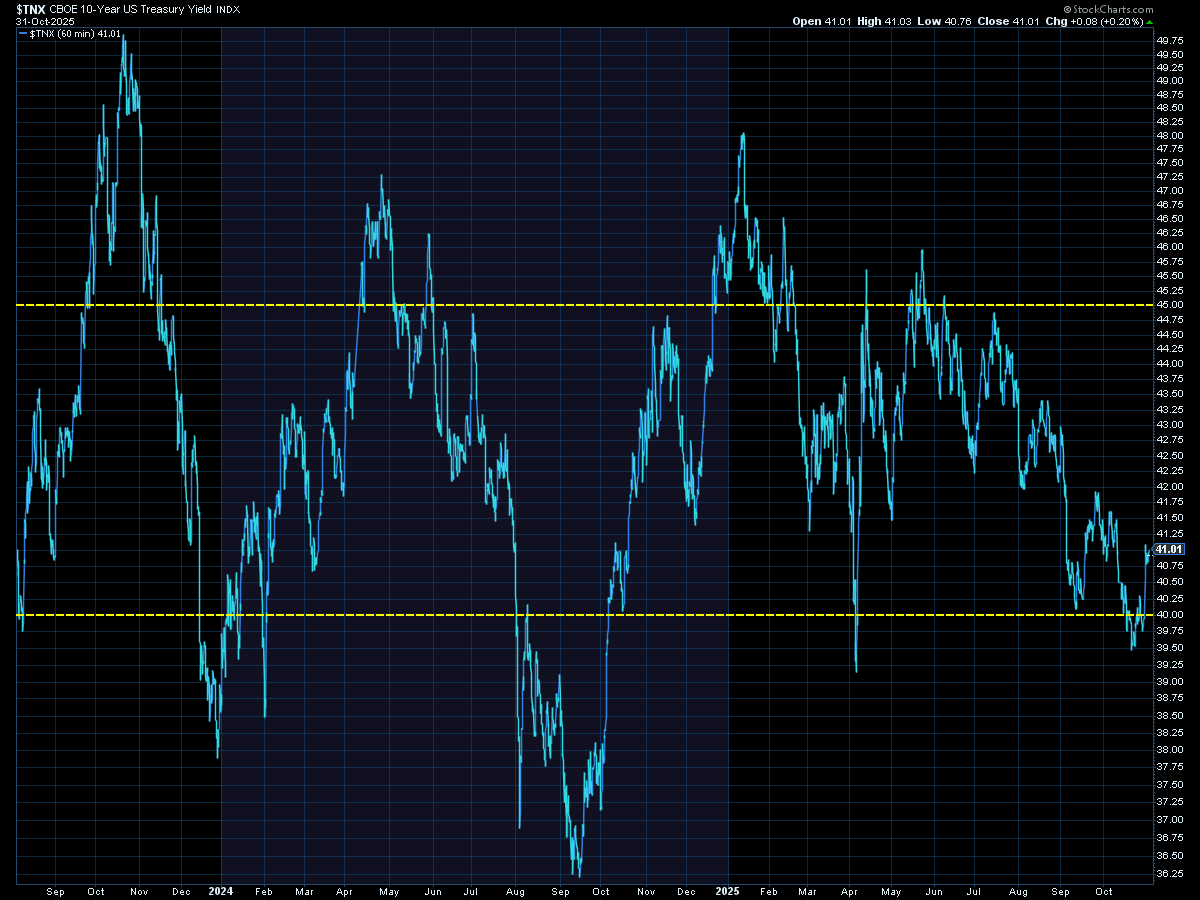
The 10-year just cannot seem to stay below the psychologically important 4% level. This presents a problem for the Fed in actually helping the economy.
SEM Market Positioning
| Model Style | Current Stance | Notes |
|---|---|---|
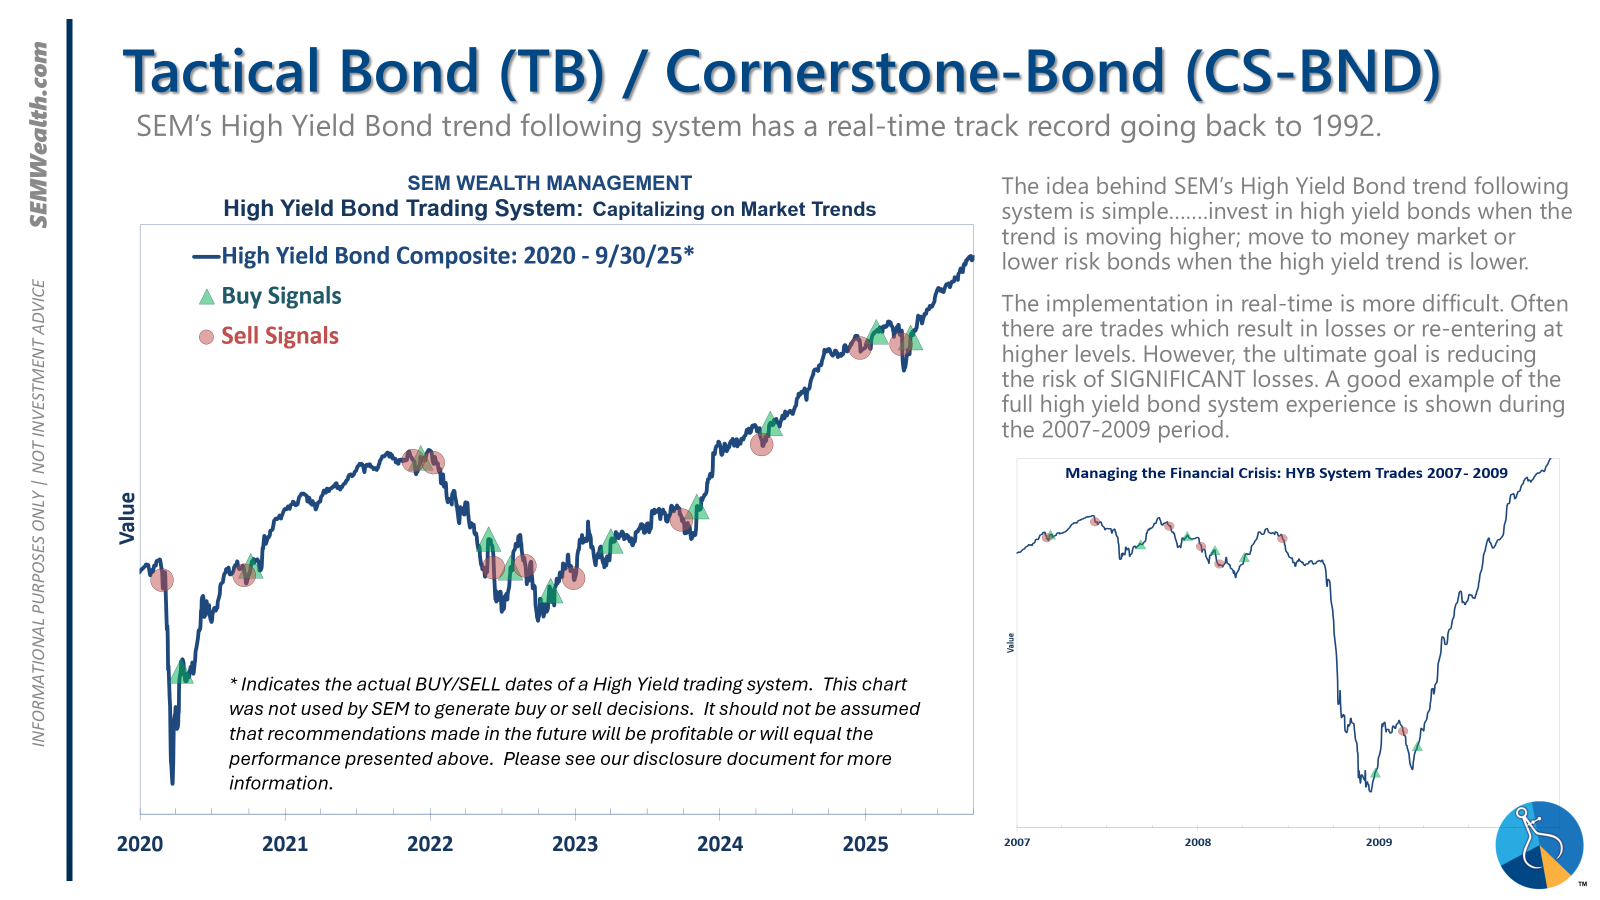
| Tactical | 100% high yield | High-yield spreads holding, but trend is slowing-watching closely |
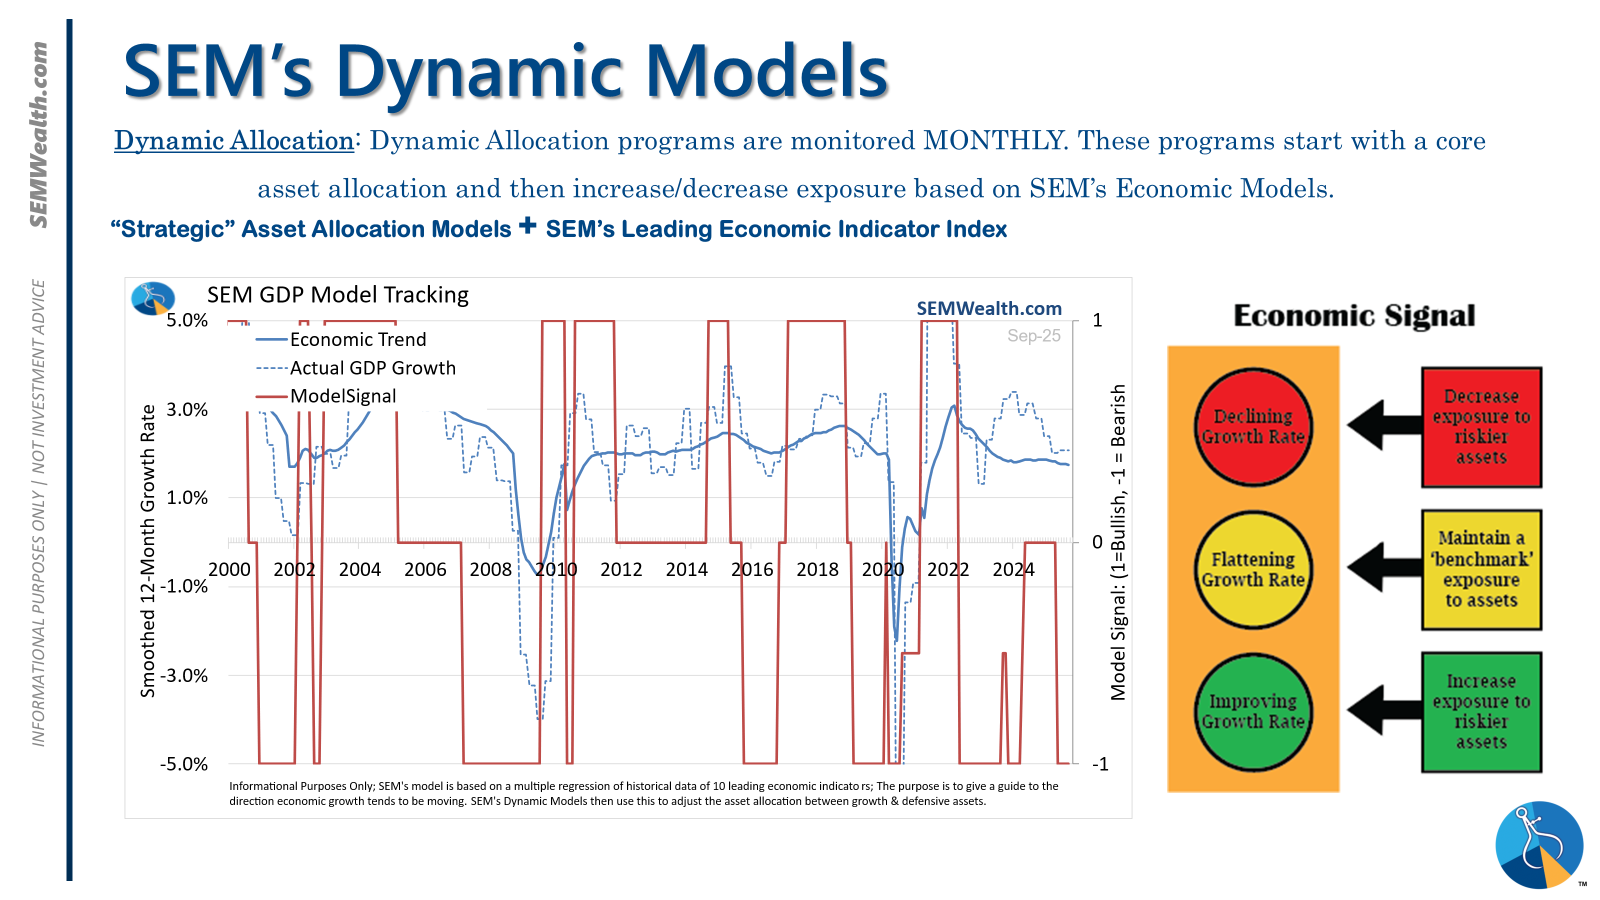
| Dynamic | Bearish | Economic model turned red – leaning defensive |
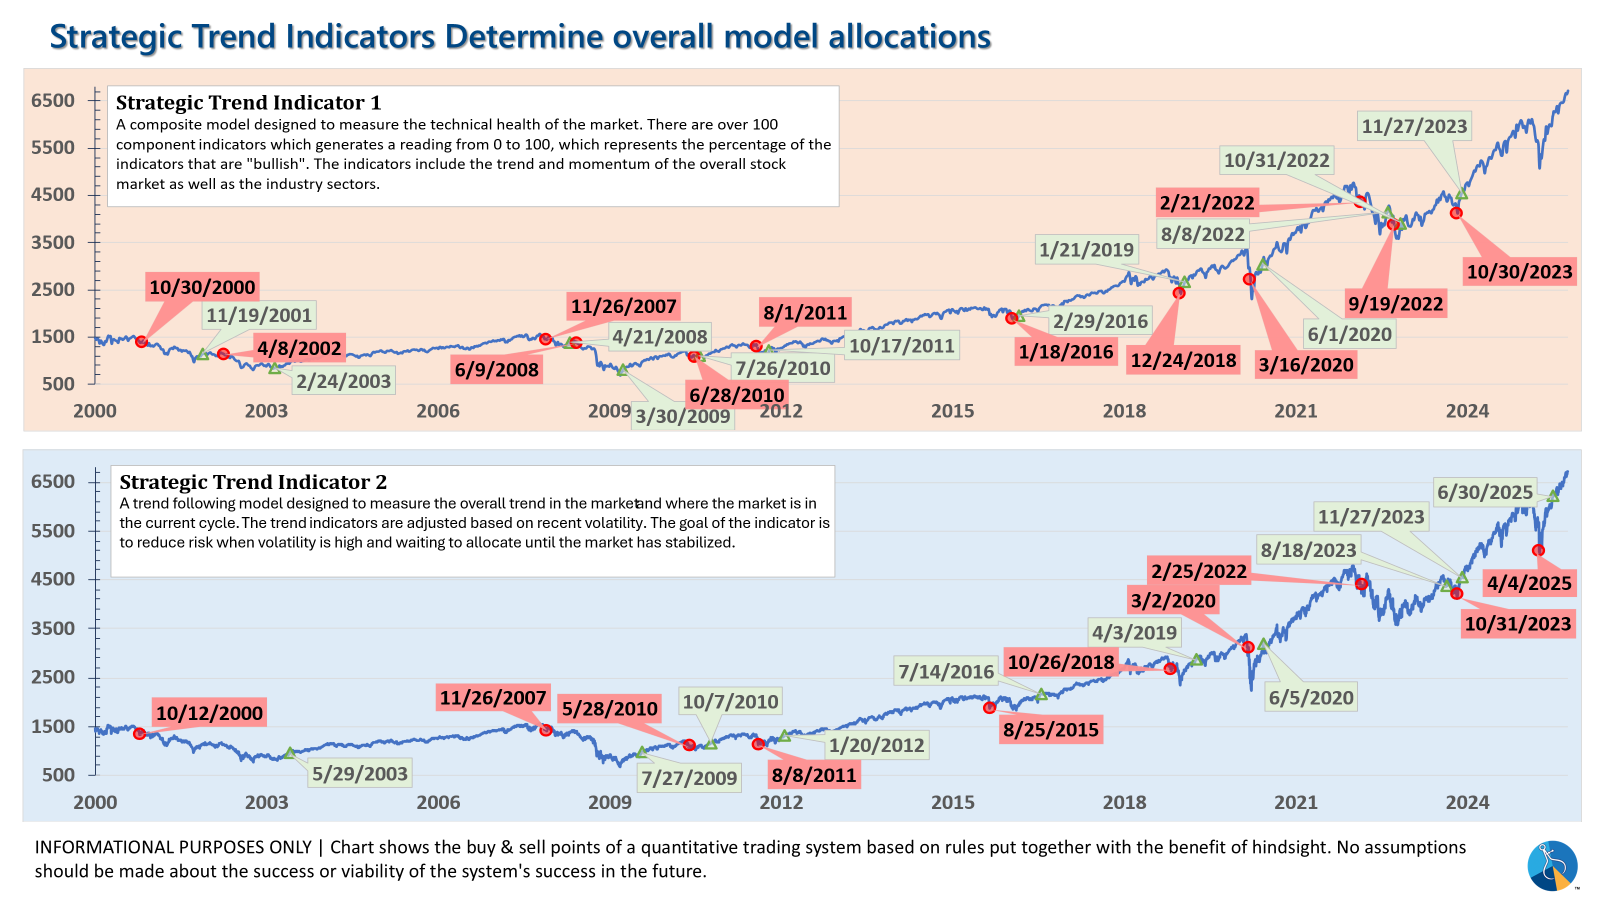
| Strategic | Slight under-weight | Trend overlay shaved 10 % equity in April -- added 5% back early July |
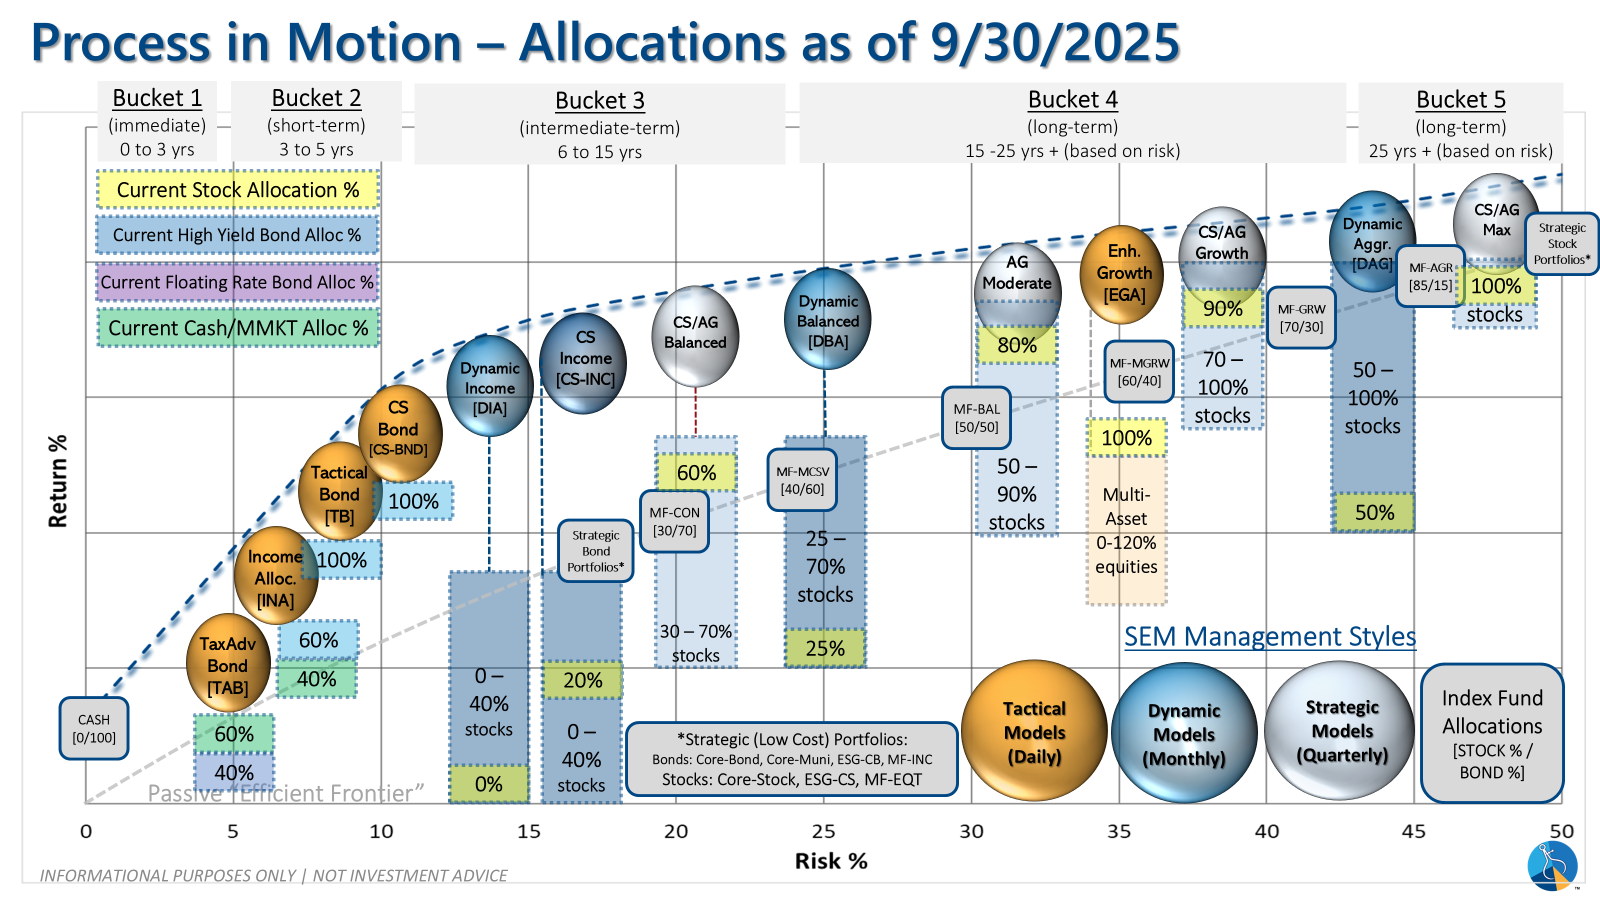
SEM deploys 3 distinct approaches – Tactical, Dynamic, and Strategic. These systems have been described as 'daily, monthly, quarterly' given how often they may make adjustments. Here is where they each stand.
Tactical (daily): The high yield system has been invested since 4/23/25 after a short time out of the market following the sell signal on 4/3/25.
Dynamic (monthly): The economic model went 'bearish' in June 2025 after being 'neutral' for 11 months. This means eliminating risky assets – sell the 20% dividend stocks in Dynamic Income and the 20% small cap stocks in Dynamic Aggressive Growth. The interest rate model is 'bullish' meaning higher duration (Treasury Bond) investments for the bulk of the bonds.
Strategic (quarterly)*: One Trend System sold on 4/4/2025; Re-entered on 6/30/2025
The core rotation is adjusted quarterly. On August 17 it rotated out of mid-cap growth and into small cap value. It also sold some large cap value to buy some large cap blend and growth. The large cap purchases were in actively managed funds with more diversification than the S&P 500 (banking on the market broadening out beyond the top 5-10 stocks.) On January 8 it rotated completely out of small cap value and mid-cap growth to purchase another broad (more diversified) large cap blend fund along with a Dividend Growth fund.
The * in quarterly is for the trend models. These models are watched daily but they trade infrequently based on readings of where each believe we are in the cycle. The trend systems can be susceptible to "whipsaws" as we saw with the recent sell and buy signals at the end of October and November. The goal of the systems is to miss major downturns in the market. Risks are high when the market has been stampeding higher as it has for most of 2023. This means sometimes selling too soon. As we saw with the recent trade, the systems can quickly reverse if they are wrong.
Overall, this is how our various models stack up based on the last allocation change:
Curious if your current investment allocation aligns with your overall objectives and risk tolerance? Take our risk questionnaire


