
“The intelligent investor is a realist who sells to optimists and buys from pessimists.”
― Benjamin Graham, The Intelligent Investor
This weekend while browsing the “Nerd Links” I came across the monthly update on valuations from Advisor Perspectives. I found myself thinking, “what’s the point, nobody cares about value any more.” Whenever I have thoughts like that I have to take a step back and go back to my core fundamentals.
Early in my academic life a finance professor made a statement, “value always beats growth over the long-run.” As with anything I did not take his word for it so began to research that statement myself. Several hours in the computer lab pulling data from the S&P Compustat database did show a distinct advantage of “value” over “growth”. A trip to the library revealed several books on Warren Buffett and his style of investing (this was in the early 1990s before the pundits had pre-maturely labeled him as ‘washed-up’). Read anything about Warren Buffett and you will find his fundamental core began with Benjamin Graham’s The Intelligent Investor.
While I spent a great deal of time studying everything Warren Buffett had to say (I still keep a very large binder of Mr. Buffett’s annual letter to shareholders), I wanted to start where Mr. Buffett started and first read The Intelligent Investor & then followed that up with Graham & Dodd’s Security Analysis. As my career has evolved away from individual security selection, one of my core beliefs remains ‘Value Matters’. I will dig deeper into how I have taken this core belief and worked it into everything we do at Strategic Equity throughout the week.
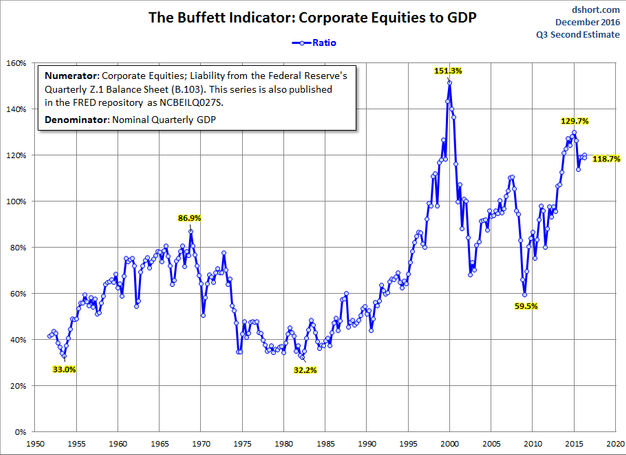
For today I will leave you with the latest update of the “Buffett Indicator” provided by Advisor Perspectives. A quick summary of how this indicator got its name — Mr. Buffett said the best measure of any market’s valuation is the ratio of market capitalization to its economy. This is based on basic economic fundamentals as over the long run a stock market cannot exceed the output of its economy. While the current valuation levels are off the highs of last summer, it still remains at a level we’ve only experienced during past market bubbles.
Tuesday, December 6
“Those who do not remember the past are condemned to repeat it.”
― Benjamin Graham, The Intelligent Investor
As stocks continue their march higher we continue to see disciplined investors throw away the discipline to chase higher returns. Yesterday I mentioned the “Buffett Indicator”, which is based on basic economic fundamentals. While there are times an overvalued market can become more overvalued (see the chart above), over the long-run value still matters.
The easiest way to see the relationship between value and returns is to look at a regression of the two. The chart below plots the 10 year annualized returns based on the starting valuation level.
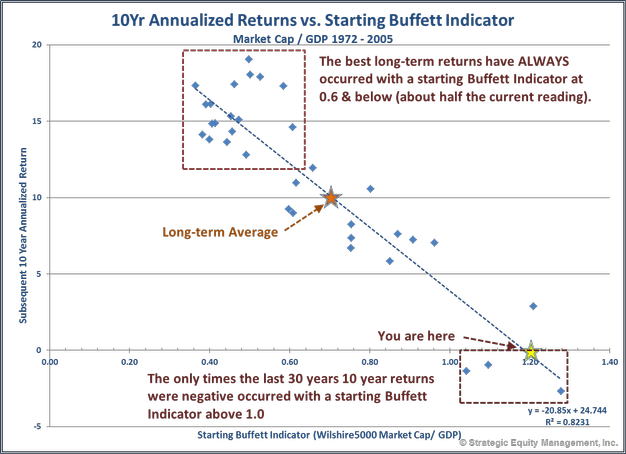
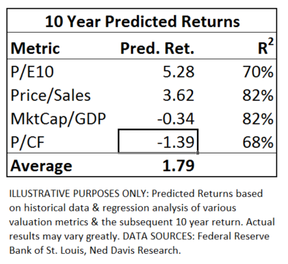
The best returns have come when valuations were low & the worst returns have tended to occur when valuations were high. As you can see, based on the current valuations we should expect returns to be quite low for buy & hold investors over the next 10 years. The “R^2” or R-squared is how well the relationship fits. In this case the Buffett Indicator explains about 82% of the long-term returns, which is a very strong relationship. I ran the regression for some other popular valuation metrics.
The more popular P/E ratio actually has the lowest R-squared at 44% (and is predicting a 6% return). The stronger relationships are not that optimistic.
Unfortunately, the returns are unlikely to be a smooth -1% to 6% for 10 years. Most of the time you see a correction in values to the other extreme. Whatever valuation metric you choose to use, the data is clear — based on historic relationships we should not expect strong returns for stocks on a buy & hold basis……unless you believe it’s “different this time.”
Wednesday, December 7
“While enthusiasm may be necessary for great accomplishments elsewhere, on Wall Street it almost invariably leads to disaster.”
― Benjamin Graham, The Intelligent Investor
Most major stock benchmarks are near their all-time highs. Over the short & intermediate-term, all-time highs tend to breed more all-time highs (just as new lows breed even lower new lows.) Momentum is infectious. Despite understanding deep down the adage “buy low, sell high”, the enthusiasm behind new highs tends to lead to market bubbles.
Back in September I wrote a series titled “Bubbles & Our Emotions“. (This also worked its way into our Fall Newsletter in a shorter, more client friendly version.) Without repeating everything I said back then, let’s look at how the CFA Institute defines & describes a market bubble:
Bubbles and crashes appear to be panics of buying and selling. A continuous rise in an asset price is fueled by investors’ expectations of further increase; asset prices become decoupled from economic fundamentals. A more objective modern definition specifies periods when a price index for an asset class trades more than two standard deviations outside its historic trend.
Bubbles and crashes are, respectively, periods of unusual positive or negative asset returns because of prices varying considerably from or reverting to their intrinsic value. Typically during these periods, price changes are the main component of returns. Bubbles typically develop more slowly relative to crashes, which can be rapid. Some bubbles and crashes will reflect rapid changes in economic prospects that investors failed to anticipate.
(SOURCE: CFA 2016 Level III Curriculum, Reading 7, How Behavioral Finance Influences Market Behavior)
When I say the market is in a bubble, it is not just my opinion based on 18 years of experience managing money at Strategic Equity, it is based on the CFA Institute objective definition. Once again, this chart from Advisor Perspectives shows we are not only in a bubble based on the 2 standard deviation criteria, but we are at valuation levels only experienced during past market bubbles.
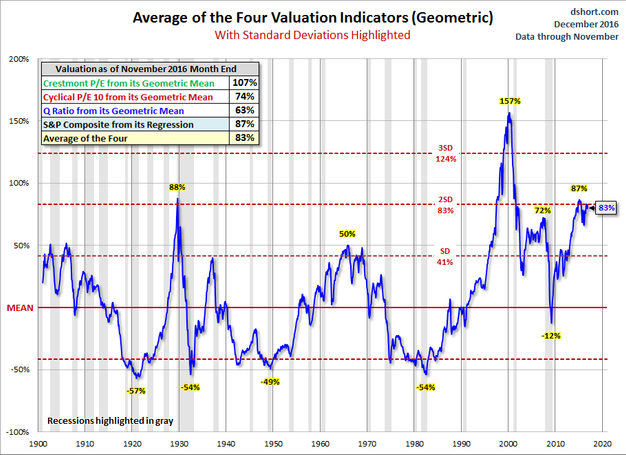
As some will note, an overvalued market can become even more overvalued as it did in the 1990s, but is that something you really want to count on? In looking at the current market it is easy to see the last sentence in the CFA excerpt above may be in play here as the EXPECTED “rapid changes in economic prospects” following the election of Donald Trump & a Republican majority in Congress has ignited enthusiasm for a return to the “Reagan years”.
That may be true and if that is the case our programs, especially our Dynamic programs and our Tactical Bond/Income Allocator options are well positioned to take advantage of this type of rapid growth. However, the key difference is if the market’s enthusiasm is misguided & we see valuations adjust to reality, those programs are also designed to provide lower risk than a buy & hold investment. It seems I’ve spent every week since the election talking about what we should expect from a Trump presidency (click here for my latest assessment.)
Thursday, December 8
“With every new wave of optimism or pessimism, we are ready to abandon history and time-tested principles, but we cling tenaciously and unquestioningly to our prejudices. ”
― Benjamin Graham, The Intelligent Investor
Despite being written in 1949, the quote above is still true of investors today. The “Trump Rally” is yet another example of investors letting their prejudices get in the way of sound thinking. As I said as I closed yesterday’s entry, if my OPINION on this is wrong, so be it. Our most popular investment programs are well positioned to take advantage of a push from already high valuations to even higher valuations. If I’m ultimately proven right and early next spring reality sets in for those speculators that were chasing stocks higher simply because their party is now in control of Washington, we are also well positioned given our risk management strategies.
Value matters. It always has, and it always will…….over the long-run. Earlier this week I mentioned some regression analysis I did on various valuation metrics with the conclusion of whatever your favorite metric, the odds are high long-term buy & hold investors will see well below average (if not negative returns) for the next 10 years. Yesterday Ned Davis Research updated some of their valuation charts & included one I’d also run a regression on — the Price / Sales ratio.
With the on-going manipulation of earnings by companies (especially the shift by Wall Street to use “Operating” earnings which exclude some very large expenses), earnings based valuation measures are less reliable. While sales can also be manipulated somewhat, the accounting tricks available (especially after the Enron & World Com scandals) are much smaller in nature. This leads me to pay much closer attention to sales based metrics than earnings based ones.
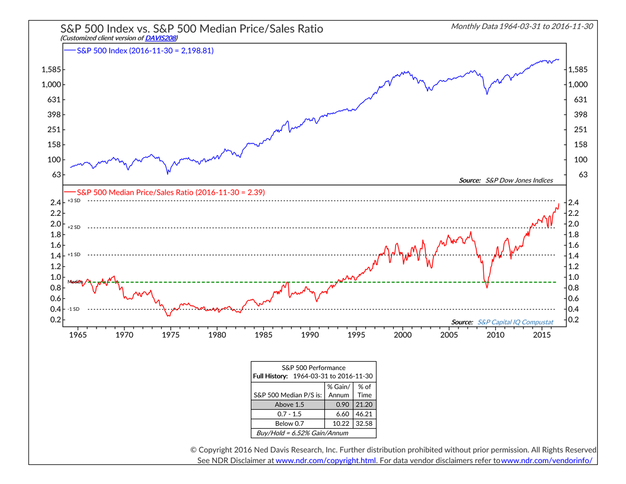
As you can see, the Price/Sales ratio has never been higher. There is SOME justification for this as higher profit margins allow for higher valuation levels (more revenue making it to the bottom line), but profit margins are cyclical and seem to have peaked for this cycle. Most importantly, the average annual return for the S&P 500 when the Price/Sales has been above 1.5 is a mere 0.90%. It is not until the Price/Sales ratio fell below 0.7 that buy & hold investors realized ABOVE AVERAGE returns (10.22%). Again, VALUE MATTERS!
The other thing Ned Davis included in his update yesterday tore into an argument I continue to hear constantly from the Wall Street pundits — all this “cash on the sidelines”. The idea is investors have been pessimistic so have left a great deal of money in savings and money market accounts despite interest rates near 0%. Looking at the NDR data the old adage of “never let the data get in the way of a good story” comes to mind.
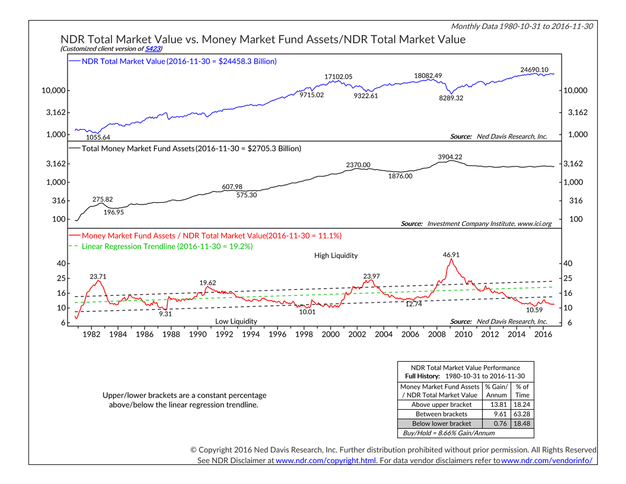
The ratio of money market fund assets to the overall market is at a level indicating the money that is waiting on the “sidelines” has already been put to work. Once again, based on this metric, the potential returns for buy & hold investors at this point are quite low.
Friday, December 9
“The psychologists Daniel Kahnerman and Amos Tversky have shown when humans estimate the likelihood or frequency of an event, we make that judgment based not on how often the event has actually occurred, but on how vivid the past examples are.”
― Benjamin Graham, The Intelligent Investor
Stocks continue to stampede higher with articles now circulating discussing “Dow 20,000 by year end.” That is certainly a possibility, but it is important as we enter the time of year where investors make plans for their investments for the year ahead to not be sucked into the euphoria. Too often the “assessment” is more of a “what have you done recently?” rather than “what is the overall risk & return potential GOING FORWARD & how does it match my LONG-TERM goals and risk tolerance?”
All week we’ve supplied data that shows the long-term potential for buy & holding stocks is low based on today’s values, which means the risks are extremely high. As the market has marched higher the expectations for more gains and the enthusiasm for stocks have increased significantly. Here’s yet one more piece of data warning about the potential for low returns (or losses) based on TODAY’s levels.
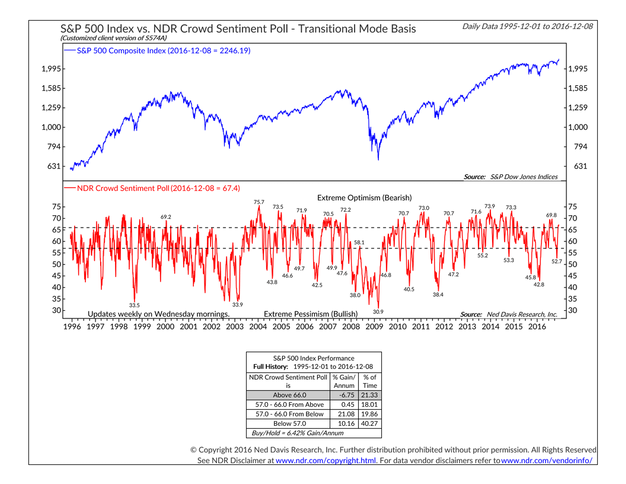
The “value” of a stock & therefore the entire market is highly subjective and based on how enthusiastic the market participants are for the future. It essentially turns into a supply/demand relationship. The more people buying, the faster stocks gain. When you run out of buyers, you lose some of the demand and have the potential of seeing sellers out numbering buyers, which leads to lower prices. The “crowd sentiment” numbers above shows we are running out of buyers.
None of this means the market is going to automatically go lower, but it is another piece of data warning about taking the returns of the last part of 2016 and projecting them out into 2017 and beyond.
For more on this, be sure to check out our Chart of the Week.


