
The Fed says the economic data has “not noticeably picked up.” I’m not quite sure what she is looking at or what I’m missing because my economic indicators are showing a strong escalation in the pace of economic growth. This week we take a look at these indicators & what they are saying about the direction of the economy.
I began developing my economic models back in 1995 while still in college. The indicators inside the model have not changed much over the years. They are based on years of research, economic logic, and most importantly DATA (not my opinion.) My economic models have served me well over the years in communicating expectations to our clients and advisors and last year became the basis for our Dynamic Allocation programs. With my models saying nearly the opposite of what the Fed chair said last Wednesday, I thought we’d take a look at the current trends in some of the top leading indicators inside my model.
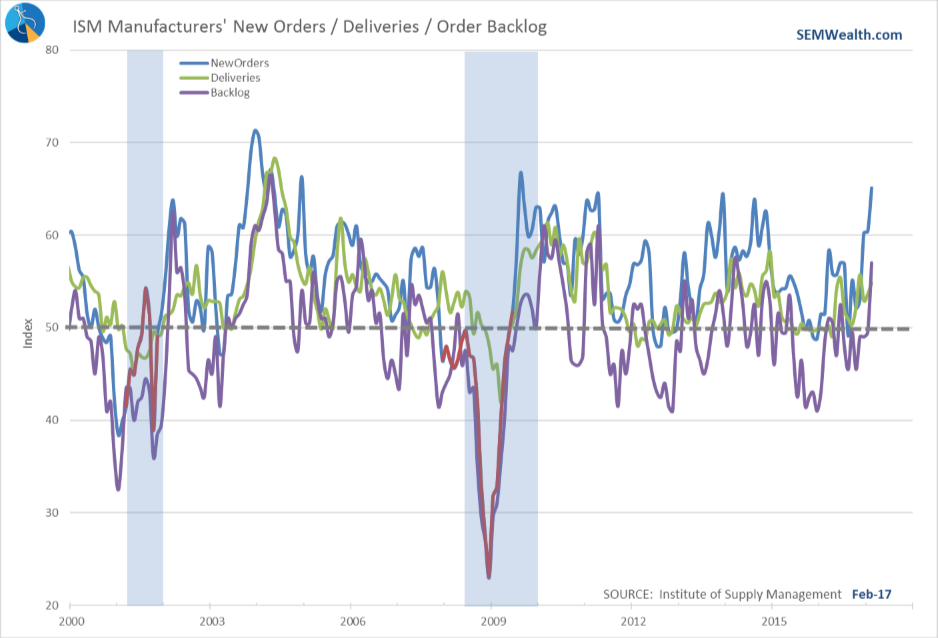
The first indicators are found inside the ISM Manufacturing Survey. While our country has shifted away from manufacturing and to services, watching the activity inside the manufacturing sector is still important. In particular the New Orders, Order Backlog, and Supplier Deliveries component of the index (how quickly suppliers can meet their orders — slower deliveries is a GOOD sign as they are struggling to keep up with demand.) If these leading manufacturing indexes are picking up, there is some underlying demand going on in the economy.
Since the election we have seen a NOTICEABLE increase in manufacturing activity.
A relatively recent addition to my models (around mid-2005) was the Non-Manufacturing (Service) Business Activity. This was added to keep a better reading on the rest of our economy. It too shows a NOTICEABLE increase in economic activity.

Two reasons I like both of these indicators — 1.) They are released the first week of the new month, giving us a quick reading of the just completed month & 2.) They are not subject to revisions.
Tuesday, March 21
While the market participants digest the Fed’s interest rate hike and the impact it might have on the economy and markets, my economic models continue to show an economy that is accelerating and should be able to handle a 1/4% increase in SHORT-TERM interest rates.
Yesterday we took a look at some leading manufacturing indices. With close to 80% of our economy based on consumer spending, some economists discount manufacturing (at their own risk) despite the logic and track record of these components in predicting underlying economic strength. Today we will look at consumer spending and more importantly the indicator that typically leads consumer spending — consumer sentiment.
The concept of consumer sentiment driving spending is simple — if consumers are felling better about the economy they are likely to loosen their budgets and spend more money. Since the election we’ve seen a sharp pick-up in consumer sentiment, eclipsing levels we have not experienced in over 12 years.
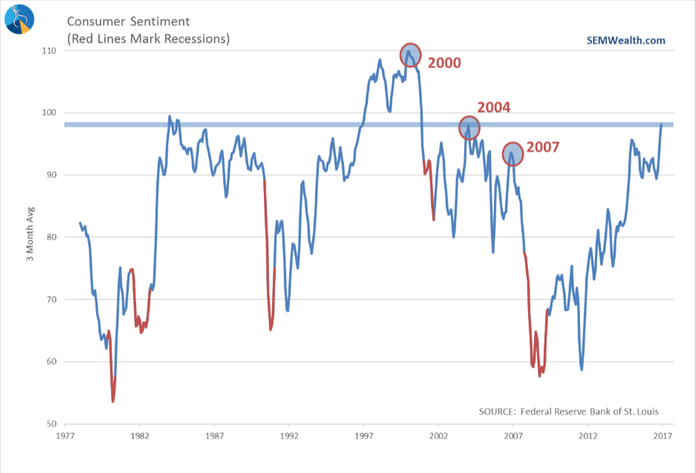
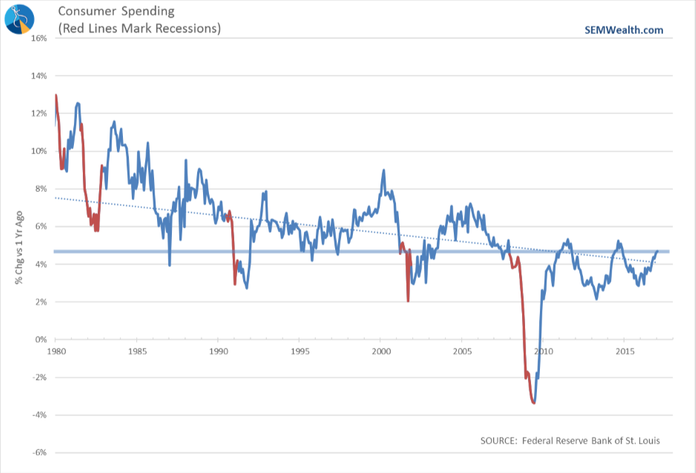
Consumer sentiment is another useful indicator because it is out early (typically near the end of the month the reading is for) and is not subject to revisions. Consumer spending, on the other hand is not released until the last week of the following month and can be revised significantly in the months ahead. That said, we can see the sentiment increase after the election has taken spending growth to levels we last saw in 2014. More importantly, it is threatening to reverse the secular downtrend we’ve been going through for the past few decades.
Thursday, March 23
Stocks calmed down a bit ahead of today’s House vote on the Republican Health Care reform bill. It is likely to be a long fight, but if the House cannot agree on a bill, the chances of them finding something in the near future is quite small. (Remember the Senate has their own bill & then the two must reconcile to pass the law.) This could cause issues with the more important legislation, tax reform.
The lull ahead of the vote gives us a chance to briefly return to the leading indicators that are showing signs of a surging economy. So far we’ve seen the strength building in Manufacturing, Service Business Activity and Consumer Sentiment (and Spending). Directly related to both of these is growth in the Payrolls.
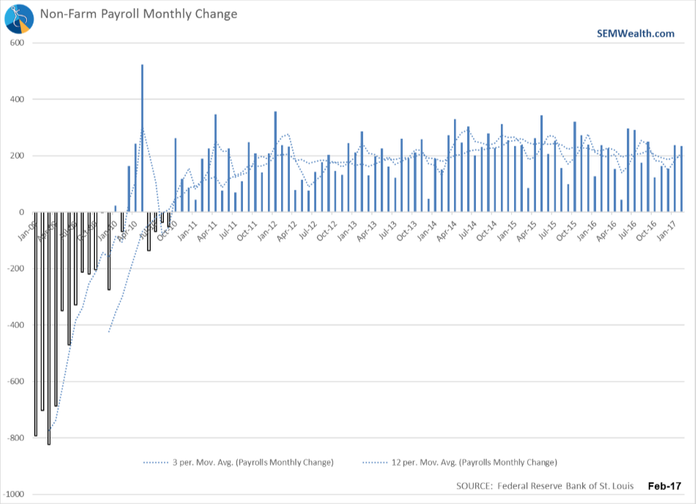
While the growth in the labor market is not surging, at this point in the economic cycle it is important that it is not slowing either. The current pace of job creation is still quite strong. Maintaining this strength will be important for overall economic growth.
Friday, March 24
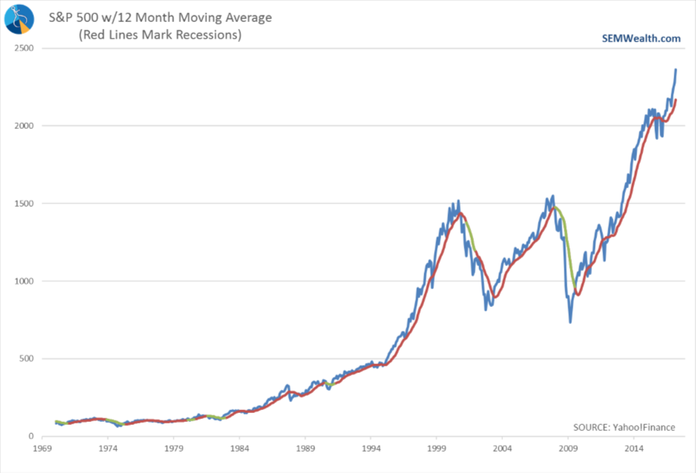
Today we wrap up the week and our look at my leading economic indicators that tell the opposite story of what the Fed is seeing. Today’s indicator really illustrates the struggle internally I have (and based on my conversations with the advisors I’m not alone). One of the better indicators for future economic growth is the stock market. From an academic perspective this makes sense. Stocks are supposed to be the “fair value” of all future streams of dividends. To calculate the fair value the market place must project both the future growth rate of earnings (that eventually will turn into dividends) as well as the riskiness of those forecasts. Since over the long-term it is mathematically impossible for all the companies inside the economy to do better than the overall economy, the price trend of the market becomes an indicator of future economic growth (assuming the market participants overall have a fairly accurate forecast).
Like the other indicators featured this week, stock prices have surged since the election.
Now the dilemma…….first off, the Fed sees this surge in stock prices and fears another bubble, so they may be more forceful in trying to slow things down. This could filter through to all the other leading indicators featured this week. Secondly, the market is pricing in a near perfect scenario where everyone of the “good” Trump policies become law with none of the “bad” Trump policies surviving. We already saw this week what happens when the prospect of that not happening smoothly is proposed (see “How 26 People Broke the Market).
This dilemma is actually one of the reasons we launched our Dynamic programs. Up until these unique options were offered to our clients and advisors, SEM was always at the mercy of the market cycles. By design, our tactical strategies cannot participate in all of the upside, otherwise they would have too much downside participation, which defeats their very purpose of reducing risk in the overall portfolio. Unfortunately, investor behavioral biases tend to cause clients to abandon tactical strategies during prolonged bull markets. From my perspective as a risk manager, I am fine with our tactical programs not having much exposure right now relative to their benchmarks, but that is a subjective opinion.
From a portfolio design perspective, I’m also appreciative of the role the Dynamic programs play in the overall portfolio. Based on these economic indicators, the Dynamic programs are in a “growth” mode, which means if the Fed is wrong (as they usually are) and the bull market continues, we have programs that will be participating. Yes these programs will participate more in the bear market — even leading indicators have some lag to them, especially when the market is as overpriced as it is right now. The key is the Dynamic programs give us CONSISTENT market exposure with superior return-risk ratios compared to the buy & hold options out there.


