
The Fed held their annual Monetary Policy Symposium late last week. The purpose of the meeting is to gather the “great minds” in economics to discuss economic theories. Over the last 7 years as long-discussed theories were put into practice, this meeting has carried more significance as often times the central bank leaders went back to their offices and put the theories to work in the real world. These central bankers have learned what any of us who have taken economics classes already knew — the real world of economics is often significantly different than their class room theories.
–
As has been the case throughout Janet Yellen’s reign as head of the Fed, the meeting left us with more confusion than anything else. I thought the Dash of Insight blog summarized the meeting best. There are 3 basic positions coming out of the meeting:
-
Negative rates. While discussed, both Yellen and Fischer made it clear that this was not a serious option – at least not right now.
-
Steady as she goes. Look for more economic strength before raising rates. Then move cautiously and slowly.
-
Adopt a higher inflation target. Some believe that the long end of the curve will increase only when inflation expectations move higher. This means that the Fed must commit to stimulative policy even if inflation moves above the current 2% target. (Click here for a description of how that might work).
There are many conflicting views inside the Fed and they all were made known at the conference.
-
Yellen: Fed may raise rates at the next meeting and again before the end of the year, but will be “data dependent”
-
Fischer (Vice Chair): Should be on a program of gradual rate increase, but can remain patient.
-
Powell: If economy performs well over next few weeks, Fed should raise rates in September.
-
Lockhart (Atlanta): If good economic data, would vote for September rate hike.
-
Bullard (St. Louis): Case for raising rates soon has been strengthened.
-
Kaplan (Dallas): See a gradual increase in rates as appropriate.
-
Mester (Cleveland): Safe to assume lower bound in rates is lower than previously assumed (below zero).
-
Kuroda (Bank of Japan): Negative rates work & are not extraordinary, immoral, or absurd [JH comment: say what????]
It looks like once again we are stuck guessing what the Fed might think of the economic data.
Tuesday, August 30
Stocks continue their low volatility see-saw action. It’s now 34 straight trading days without a move of 1% in either direction. This heavy focus on the Fed, what they might or might not do, as well as their perceived ability to prevent any sort of crisis is creating this mess we are in.
With the push towards zero and now negative interest rates, we’ve seen all kinds of new strategies emerge in the financial markets in an attempt to make money for low risk clients. Software programmers are creating complex financial models for the Wall Street banks that focus more on the results than paying attention to what assets are included in the portfolio. One of those is a ‘Risk Parity’ model.
A Risk Parity portfolio is one that targets a specific volatility (risk) level and throws all kinds of asset classes into the mix. They plug the correlations, volatilities, and returns of those assets into their model and create the “perfect” portfolio based on the output. They buy/sell when the numbers change.
This works fine in a “normal” environment, but when some outside event happens that throws the models off kilter, we see all kinds of forced selling by these models. Bank America Merrill Lynch was out with a report a few weeks back talking about this risk. They used the Chinese devaluation of their currency last August as an example of what happens when these risk parity models see a market that is “not normal.” They included this chart to illustrate when a “not normal” move becomes an issue for these models.
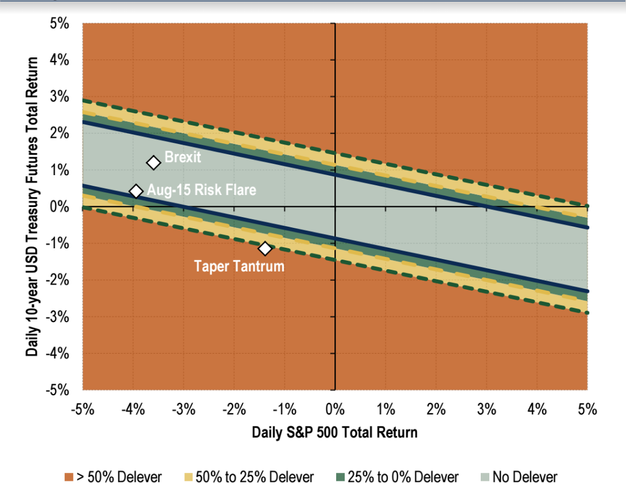
As long as the correlations between stocks and Treasuries remains “normal”, all is well. The problem will end up being those orange zones that occur when stocks and Treasuries move in the same direction. Notice the chart says “delever %”? Did I forget to mention these strategies do not invest in the underlying assets, but rather derivatives of the assets.
Wednesday, August 31
Barring a break of the 35 day sideways streak to the downside today, August should close with a slight gain. Considering the usual downward, volatile bias of August, we could call that a win. The myopic focus on what the Fed may or may not do with interest rates has kept both bulls and bears on the sideline, afraid to take any large positions on either side. They’ve had 7 years of the Fed’s market manipulation and have learned it’s not the fundamentals that matter, but how the Fed assess and reacts to the fundamentals.
Janus’ Bill Gross, is one who has learned the hard way. Several years ago he began vocally criticizing the Fed and their micro-focus on the short-term volatility of the markets. He dared to use longer-term fundamentals in his investment style and thus under-performed the bond market in sequential years, leading to his forced resignation from the fund he founded. He landed at Janus and despite being openly critical of the Fed, seemed to learn his lesson about straying too far from the benchmark in this short-term focused market. His 1 year return is essentially the same as the Aggregate Bond Index.
In his latest investment outlook, Mr. Gross again called out the Fed for their market manipulation.
“All have mastered the art of market manipulation and no – that’s not an unkind accusation – it’s one in fact that Ms. Yellen and other central bankers would plead guilty to over a cocktail at Jackson Hole or any other get together of Ph.D. economists who have lost their way.”
One of the primary topics at the Jackson Hole Symposium last week was the use of negative interest rates. What I find fascinating is there are no valuation models around that can have a negative sign in front of the ris-free rate. If negative enough or utilized long enough, these “models” of how to value assets, cash flows, and stock prices will generate a whole lot of extra commas and zeros at the end before hitting infinity. In other words, there is no way for anybody to value assets in a negative “risk free rate” world. Mr. Gross slams the use of negative rates in simple terms:
“Capitalism, almost commonsensically, cannot function well at the zero bound or with a minus sign as a yield. Factor that, Ms. Yellen into your asset price objective. You and your contemporaries have flipped $11 trillion from the left side to the right side of the global balance sheet.”
Thursday, September 1
The market was down just enough on Wednesday to post the first losing month since February. In the whole scheme of things, it’s not that bad. This monthly chart from Advisor Perspectives really tells the story. Stocks have essentially done nothing since QE3 ended in late 2014.

While this has left individual investors (and far too many of our clients and advisors) frustrated and leaving their risk managed accounts in the quest for higher returns, institutional investors are increasing their bets the 20 month sideways action in the market is going to resolve itself to the upside.
The net speculative long positions in the S&P 500 are at a 3 year high, while the bets on the Dow moving significantly higher is at an all-time high.

This does not necessarily mean the market is going to sell-off, but it does show how unwilling institutions are to actually INVEST in the market. In order to sustain current valuation levels, the market needs long-term investors, not a bunch of people betting on the market direction with vehicles that involve little commitment of capital.
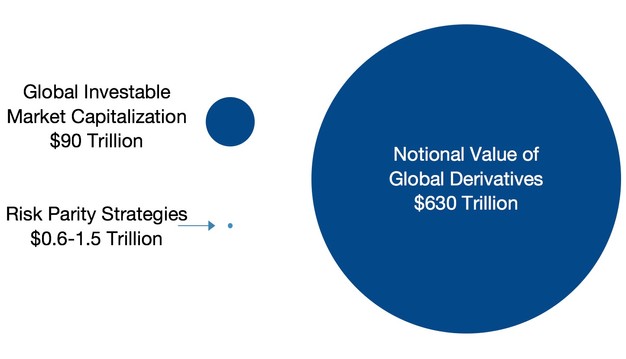
This brings up the real risk of the market over the more intermediate to long-term — the use of derivatives. Earlier this week I discussed the risks BAML sees in the “Risk Parity” trade. While the use of derivatives to implement this trade can create forced selling if the correlations in real-time differ from the computer models to implement them, the amount of money inside a risk parity model pales in comparison to the overall amount of derivatives in the financial system.
There are many problems with the use of derivatives, most of which are too complex to go into detail here. What most people do not understand is that most derivatives used by the large institutions are not traded on an exchange. They are customized swap contracts between two parties. There are models to price these contracts, but all assume “normal” volatility, “normal” interest rate movement, and “normal” price action. The Fed assumes all derivative exposure is “hedged” in their stress testing models, but they have no way to know for sure if that is the case.
When things go bad, they go bad VERY quickly as this article from Forbes pointed out when discussing the 2008 financial crisis.
The root cause wasn’t just the reckless lending and the excessive risk taking. The problem at the core was a lack of transparency.After Lehman’s collapse, no one could understand any particular bank’s risks from derivative trading and so no bank wanted to lend to or trade with any other bank. Because all the big banks’ had been involved to an unknown degree in risky derivative trading, no one could tell whether any particular financial institution might suddenly implode.
Warren Buffett has called derivatives “weapons of mass financial destruction.” Thanks to their lobbying efforts, there has essentially been zero reforms to the exposures the Wall Street banks have to derivatives. Worse, the bailouts of the largest banks have made the 4 largest banks 40% bigger. This is a timebomb that will once again blow-up and we have the Federal Reserve and Congress to thank for it.
Coincidentally, it was reported earlier in August that Buffet’s Berkshire Hathaway paid $195 million to get out of his remaining derivative exposure. These were contracts Berkshire had issued to insure defaults in municipal bonds. I guess time will tell if this was yet another prescient action by the “Oracle of Omaha.”
Friday, September 2
The reaction to today’s jobs report is a perfect example of the theoretical mess the Fed has put us in. Job growth was decent, but down slightly. Wage growth was decent, but down slightly and is still running at a 2.4% annual rate. The unemployment rate was flat and the average work week was down. So what does this mean for the Fed’s September meeting? Your guess is as good as mine.
When you combine this report with a very weak ISM Manufacturing Survey (which is one of my favorite leading indicators), you could argue the Fed should for sure leave rates unchanged and may even want to consider MORE stimulus.

When you take a step back and realize how much stimulus it has taken to give us the lackluster economic recovery (each job has cost over $700,000 in Fed & government “stimulus”) we begin to realize this Grand Experiment has the potential to go horribly wrong if the Fed does not push their policies back to a more “normal” position before the NEXT recession.

Of course the Fed is usually the cause of most recessions as they try to offset their recession fighting mechanisms that were causing the economy to overheat, creating imbalances they had to mitigate.
As it looks right now, the markets could be at the mercy of the various Fed speeches before their September meeting on the 20th and 21st.
Make sure to check out our Current Allocations tab for a summary of how our trading systems are positioned.


