
-
GDP Growth at a 2 Year High!
-
US GDP Growth Roars Back
-
US Finally Showing Its Strength
-
GDP Crushes Estimates
-
GDP Number Throws Wrench In Trump’s Economic Attacks
Those are all nice headlines, especially for those supporting the incumbent party. If you ignore my comments on the chart regarding the growth rate, the trend the “surge” looks great.
The problem is nobody seems to understand the actual data. You see the way the government calculates GDP growth is highly misleading:
((GDP Q3 / GDP Q2)^4)-1
For those of you that are not good with Excel formulas, the government is annualizing the change in the economy from last quarter to this quarter. They attempt to remove “seasonal” factors as growth will vary from quarter to quarter due to holidays, vacations, summer travel, etc. The problem with seasonal factors is they are not always the same and the government is constantly tweaking them.
A better way to measure the economy is to compare it to how it did a year ago. That removes all the “seasons” as the year would have the exact same months in the data. It’s the way most analysts evaluate corporate earnings and also the way most businesses, especially the cyclical ones evaluate their own growth. You can then compare the Year-to-year Percent Change of this quarter to the same number last quarter.
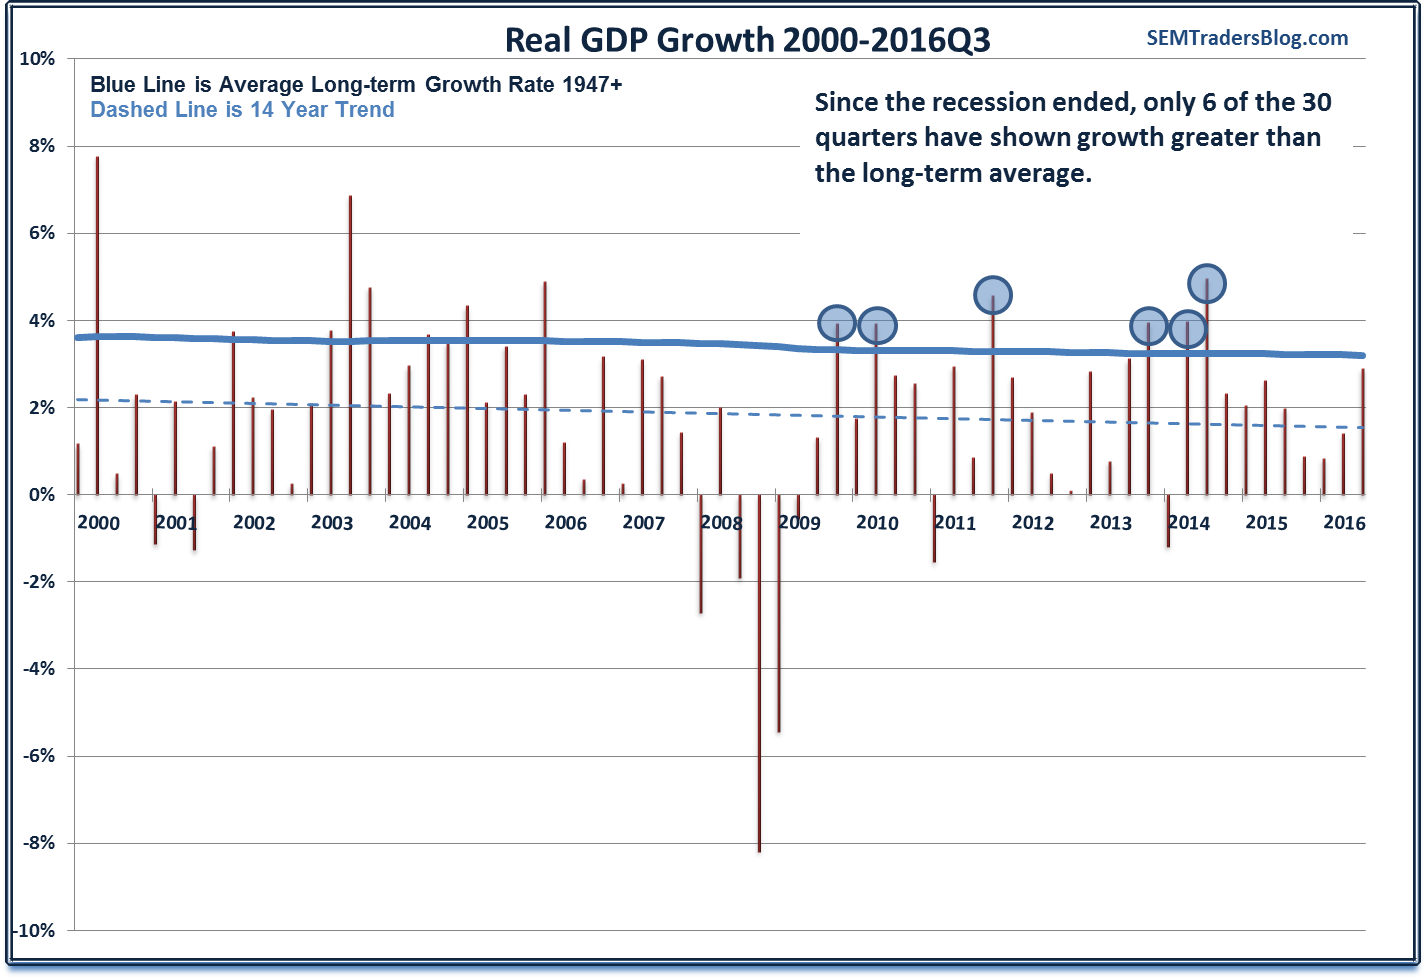
Here’s how that would look on a chart:
Now we start to see a completely different story. While the year-over-year growth rate did increase (from 1.3% to 1.5%, it is still below the 1.6% we saw in March & the 1.9% we closed the year at. The fastest year-over-year growth occurred in March 2015 at 3.3%. As shown on the chart that was the ONLY time GDP growth has exceeded the long-term average.
Today’s number does NOTHING to change the long-term story and the reason so many people are disenfranchised with the direction of our country. Despite unprecedented stimulus from the government and the Federal Reserve the fact remains this is the ABSOLUTE WORST RECOVERY on record.
Republicans like to blame the Democrats. Democrats like to blame the Republicans. The fact of the matter is we’ve essentially had 8 years of Republican leadership & 8 years of Democratic leadership, yet the last 16 years has seen some of the worst GDP growth in the history of our country.
The “Bush” recovery from 2003-2007 averaged 2.9%. The “Obama” Recovery has averaged 2.1%. Those numbers EXCLUDE recessions. The 21st Century average growth rate for our economy is 1.9%. During the 1990s we saw 3.2% growth — right in line with the long-term average.
It may be too late for this election, but sooner or later the leaders of our country need to wake up and realize their policies are not working. In order to change the leaders we all need to understand what is going on with our economy and not fall for these misleading headlines.
This is one of the primary missions of this blog, so share this post as often as possible with your social media followers. One by one we can change our country for the better.
For a deeper understanding of what is happening beneath the surface in our economy see:


