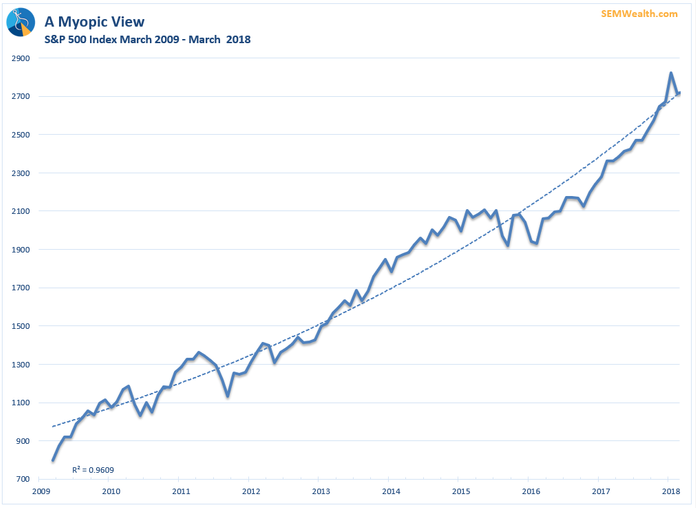
Today is the 9 year anniversary of the “bottom” of the financial crisis. The S&P 500 lost over 50% of its value during the crisis, falling to a level of 673. It has since rallied over 300% from the depths of the crisis. The only bump along the way was a 19% drop in the summer & fall of 2011. The recent 10% drop to start February barely registers on this monthly chart.

The dashed line on the chart is a “best fit” trendline. The R^2 is how well it fits (96% is a VERY GOOD fit. In order to find a good fit I had to switch to an “exponential” line (curved). An exponential trend by itself can be alarming, but over a 9 year run not necessarily a cause for concern. What should be concerning is the rate of change of the trend. Since the bottom in 2009, the S&P 500 has gained over 16% per year. Depending on what time frame you are looking at (including all the way back to 1924), the average long-term return for the S&P is 7 to 9%. Put another way, the US stock market has risen at a rate nearly double the long-term average over the past 9 years.
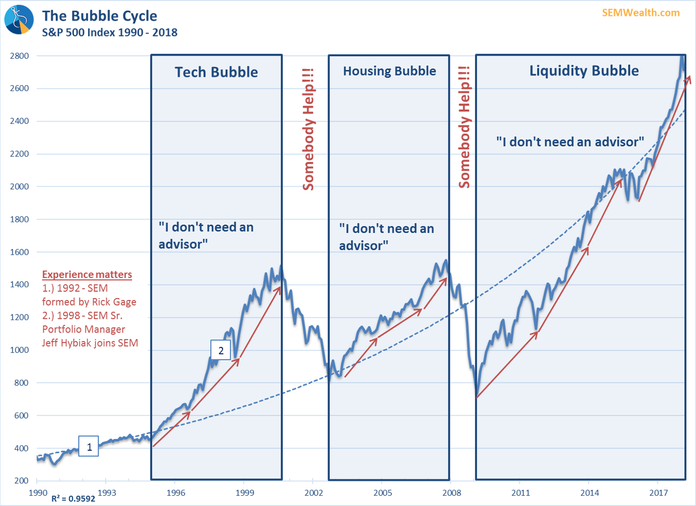
Throughout time the stock market has been a mean-reverting mechanism. What this means is the longer the stock market is above the mean (average), the more likely it is to spend significant time below the mean. The next chart steps back to look at the stock market since 1990.

The “best fit” trendline on this one is also exponential, but we’re talking about a span of nearly 3 decades. Over this span the S&P 500 has grown at an annualized 7.5% (this does not include dividends, which have averaged slightly over 2% per year during this time frame). Some people scoff at me when I call the current market a bubble, but notice how far above the long-term trend the market is currently. Given the length & trajectory compared to past bubbles I do not see how anybody could not call this a bubble.
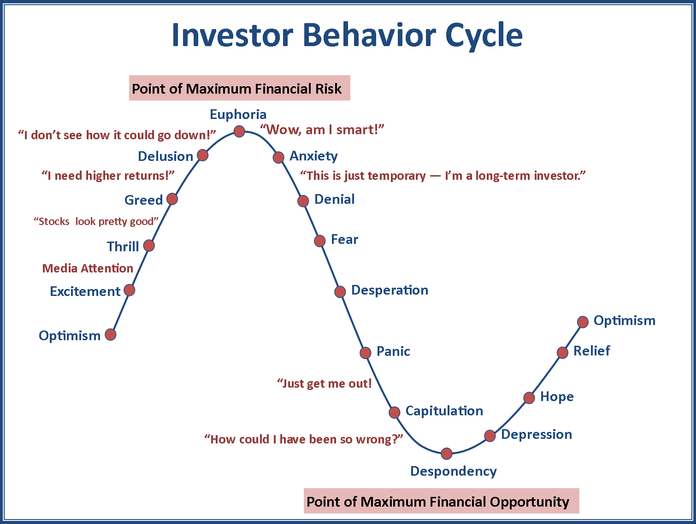
It is human nature to look at the first chart and believe if the market has gone up at a 16% annual rate for 9 years, it should be able to do that for the next 9 years. People believe any dips should be bought. With hindsight they can “clearly” see the market “always” comes back. What I think is lost in this mindset is what it is like actually experiencing the decline in real-time. I added some important text to the 2nd chart. The first is the consensus sentiment of investors we have seen during the phases of the market cycle. While investors don’t immediately declare they ‘don’t need an advisor’ at the bottom, psychologists have identified the cycle of investor emotions follows this pattern.

Likewise, they do not scream, ‘somebody help!’ at the top. They wait for it to begin falling and far too often capitulate and sell out of the investments they declared were “long-term holdings” shortly before the market actually bottoms. We’ve seen advisors do the same thing too many times as well. It’s human nature. Nearly everybody is susceptible to these emotions. Sometimes advisors are more prone to performance chasing than individual investors.
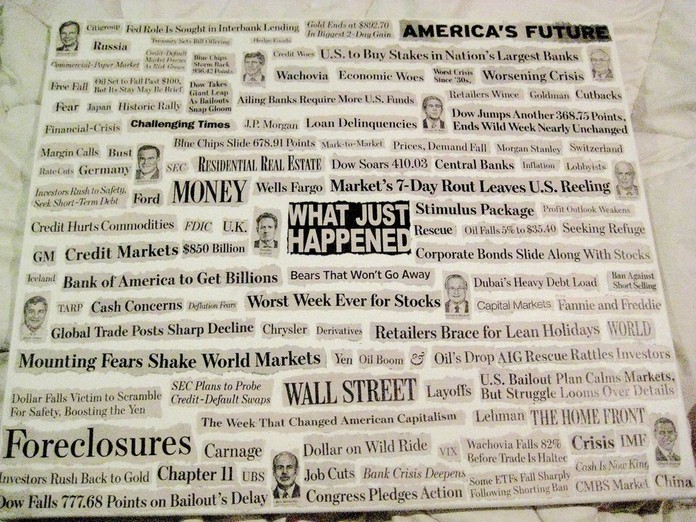
What is truly not understood at this point in the market cycle is the declines we should all be afraid of happen at the same time there are MAJOR underlying issues occurring in our economy. Losing money is bad enough, but seeing a constant barrage of negative headlines pushes our emotions even further out the spectrum. Most of the time when we begin to get emotional about something we tend to make poor choices. This picture from Business Insider illustrates some of the things we were inundated with in 2008-2009. The negative news only serves to further magnify our emotions. Is it any wonder few investors were interested in the market when it finally bottomed 9 years ago?

Going back to the bubble chart above, I added 2 key notes marking important dates. The first was 1992 — when SEM was founded, and the 2nd 1998, when I joined SEM. Experience truly matters. Rick Gage & I have sat in front of our trading terminals through great markets and scary markets. We navigated the tech bubble implosion, the 9/11 attacks, the financial crisis, the US debt downgrade in 2011 and all the “minor” events that seemed like a “crisis” in between. The ONLY thing that has allowed us to keep our emotions in check is the fact EVERY SYSTEM deployed by SEM is based on DATA. These systems were tested throughout all kinds of market cycles with a constant eye on how they work when there is a shift in the market environment. No system is perfect, which is why we utilize so many systems and advocate diversifying across SEM’s investment portfolios. With SEM’s TCA platform you can diversify across trading strategies, time horizons, and asset classes inside a single account. We help clients and advisors develop portfolios around each individual’s personal behavioral biases.
Experience matters. Too many advisors and investment managers have not managed money in even one bear market, let alone two. Worse, the number of investment managers out there using DATA driven systems that have the experience SEM does is quite small. By not using DATA these advisors and managers risk letting their own decisions becoming clouded by their own emotions. Even worse, if they are hearing from worried clients, their emotions will be pushed even further down the spectrum.
For what it’s worth, barring an escalation of a trade war (or real war) by our President, there is nothing on the horizon that indicates the bull market may not hit its 10-year anniversary. That said, you are living in a fantasy world if you believe the market will not go through a mean-reverting event at some point in the next few years. Think of all the developments (and set-backs) our country has gone through since 1924, yet the average return on the market is somewhere between 7-9%. There has been NOTHING that has developed the last 10 years in our country that would justify a shift to a “normal” return being 15%. This means it’s not “different this time”, which means soon we will have an event where having an unemotional, data driven investment manager will be critical to your long-term success.


