I shouldn’t be surprised how quickly the consensus changes in the market. 2 weeks ago I was at a CFA dinner and all but a handful of the 350 CFA’s in attendance expected the market to close 2018 higher. Surveys of individual and institutional investors alike agreed with the overwhelming majority expecting 2018 to be a repeat of 2017 (if not better). I hear numerous people say the record low volatility in 2017 was a ‘new normal’ given the Fed’s ability to protect the market and the pending stimulus coming from the tax cut bill.
After what is likely to be the worst week in 10 years, I’m already hearing guests on CNBC & Bloomberg saying we should expect this kind of volatility as the ‘new normal’. They point out the change in environment from Central Bank stimulus to Central Bank tightening, the prospects for higher inflation and thus higher interest rates, as well as the US and the rest of the world being in the late stages of a very long economic cycle. How could the old normal change in just two weeks?
Whenever I hear the phrase ‘new normal’ I just shake my head. The only thing that changes is the CAUSE of the bull market that ultimately leads to a bubble and the CAUSE of the bursting of that bubble. What doesn’t change is the fact we have humans involved in the buying and selling decisions. The “robo” advisors and most Wall Street firms are counting on the fact that investors are 100% rational, 100% of the time. If that were true we would not have weeks like this.
To understand what happened yesterday, let’s go back to what I identified as the cause of Monday’s sell-off:
-
Concern over inflation is causing re-allocations out of stocks
-
Fear the Fed will cause a recession (as they almost always do), especially with Janet Yellen no longer in charge.
-
Worry about the US Government’s ability to finance it’s debt
-
Capitulation
Yesterday the market all of these fears were front and center. The politicians living in their bubble in Washington were all smiles as they came up with a budget proposal that both sides in the Senate agreed upon. Essentially Republicans & Democrats all agreed to spend money on all of their ideologically important items. We already have the tax cuts increasing our debt at least $1 Trillion over the next 10 years (a 10% increase), but not the “bi-partisan” spending bill will add another $300-500 Billion to our debt.
This hit the top 3 concerns. The tax cuts were already the latest government stimulus on record in terms of the number of months after a recession ended. Stimulus is supposed to come during the recession and in the early months of the recovery. Adding stimulus this late could ignite run-away inflation. Adding even more spending from Congress is seen as throwing more fuel on the fire. Even more of an issue is the spending does very little in terms of adding to economic growth (we need infra-structure and job-training programs to elevate long-term potential economic growth, something Congress is not concerned about.)
So now we have even more debt that will need financed with little prospect of the spending increasing economic growth. Interest rates again went up and there continues to be fear investors will be unwilling to finance the growing US debt, especially as the Federal Reserve and other Central Banks (the Bank of England announced an end to their easing programs yesterday) will not be purchasers of this debt. Higher interest payments are not even considered in the budget deficit projections.
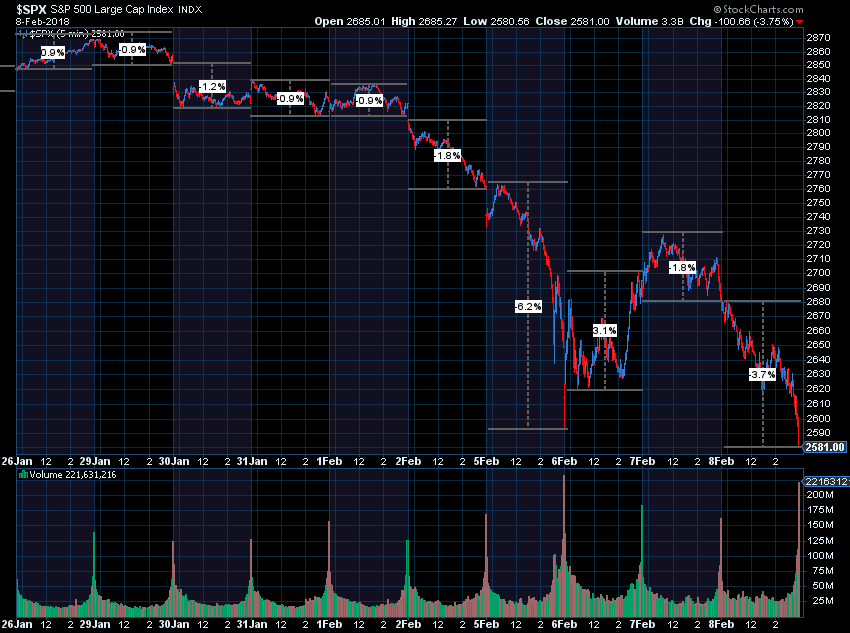
Finally, we again saw more capitulation yesterday (for more, check out my blog from earlier this week). How ugly was it? This chart shows the last 10 days of price moves in the S&P 500.

Our systems are designed to let this kind of noise play itself out. We did see a buy signal in our Price Divergence System inside Enhanced Growth & Enhanced Portfolio Allocators (increasing exposure about 10%). Volume was lighter and the selling was more focused in the futures & derivatives markets rather than the underlying stocks — a possible good sign. Our lower risk programs sold some high yield bonds earlier in the week, which made yesterday a minor irritant compared to the S&P 500’s nearly 4% loss.
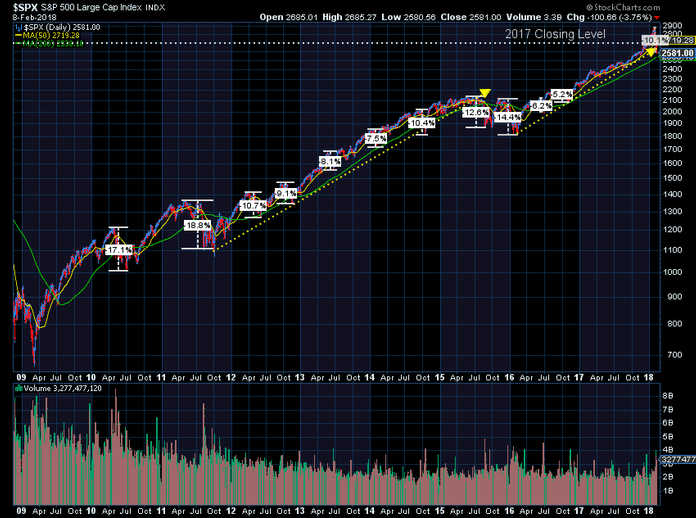
Zooming out to the bottom in 2009, I wanted to highlight that drops like this are NORMAL (maybe not this quickly, but it wasn’t normal to see the market shoot up 7% the first 3 weeks of January).

This is looking a little bit more like the 2015 sell-off. Note how the market broke the trend line off the lows in 2011. It rallied back before falling again late in the year. We haven’t had more than a 6% decline since then and hadn’t seen a 5% loss since the fall of 2016. Note how many 5-10% losses the market had from 2011-2015.
On the one hand I am pointing this out as I do not want investors to panic and sell just because the market went down. However, do not make the comparison to the 2015 sell-off bring you comfort either. To me this feels more like the 1998 correction. It came in the later months of the economic cycle and was simply a correction of some very large excesses. The market then went off to rally off the lows and sucked in a lot of low risk people that had been waiting for a sell-off to get into the market.
If you have felt any sort of unease in your portfolios (whether you are an advisor or client), now is the time to do a deep-dive into the overall structure of your portfolios. At SEM we can still put you in portfolios designed to participate in the upside if it does snap-back for another year or two (our recession indicators are nowhere close to triggering, which is when we REALLY need to be concerned about market losses). Keep in mind there are my OPINIONS. The reason you should consider SEM’s Scientifically Engineered Models is they are all based on DATA. No opinions, no emotions, no subjectivity — if the systems that make up each model say to buy or sell they buy or sell. In other words, our models have a pre-determined entry and exit strategy and can adapt to whatever the market gives us in the future.
To learn more about SEM’s models and how we can structure your portfolio, send me an email.


