
[Scroll to bottom for latest update]
Another Hollywood script was being written for Tom Brady & the New England Patriots. Down by 5 with under 3 minutes to play. Most people expected the Patriots to drive down the field, score a touchdown and claim their 6th Super Bowl victory. The Patriots did not punt the entire game, Brady had barely been touched the last 2 1/2 quarters, and had driven the field at will. Brady already had the record for most yards thrown in a Super Bowl. Then the unexpected happened — the Eagles got to Brady and knocked the ball loose. They would recover, kick a field goal and eventually bat away a Hail Mary attempt to win the game.
Last week, the stock market did something unexpected as well — it went down. Listening to the commentators on Friday and throughout the weekend, most market participants felt either a little like Tom Brady or the “Selfie Kid” who seemingly had no idea what was going on around him when Justin Timberlake grabbed him for an impromptu selfie.
In my calls with advisors and meetings with clients I’ve said the biggest concern I have is nobody seems to think the market can go down. We hadn’t had a 3% correction since before the election. That streak is now over — all in a few days. We’ve seen clients that were ultra-conservative being lured into the market with the seemingly unanimous prediction stocks would repeat 2017’s low-volatility 20%+ gains.
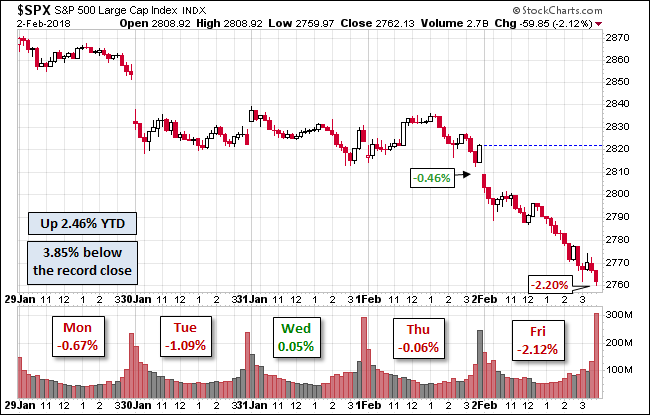
It’s been 15 months since the market had any kind of loss to write about. For new readers, this used to be a daily blog, but given the lack of volatility it migrated to just our weekly “Chart of the Week”. Back when I used to write every day I’d often turn to Advisor Perspective’s daily market recap charts to help frame the discussion. First last week’s loss was severe no matter which way you look at it.
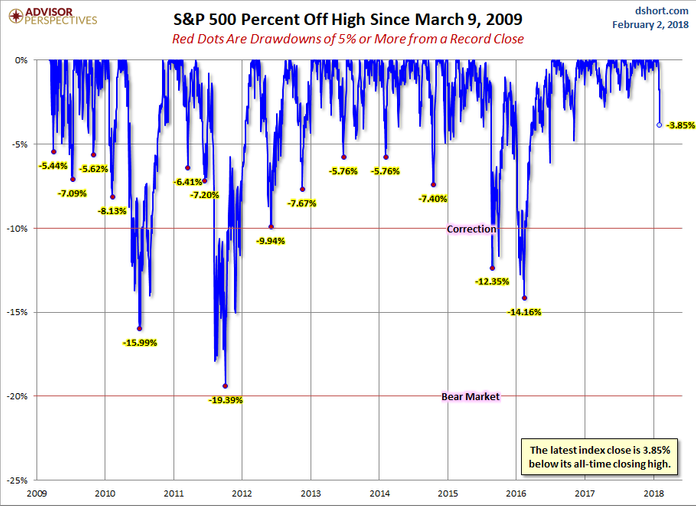
Looking at their Drawdown chart we can see both how long it’s been since the market lost 3%, but also how common those types of losses were before the election of Donald Trump.
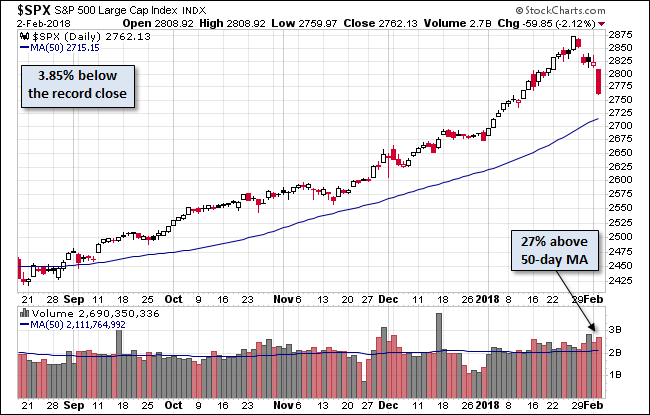
However, zooming back we can see the trend is still up. It could take quite a bit more selling before we should be concerned about a true correction in the market. For the most part our systems have not done much adjusting. Our Dynamic Income did short Treasury bonds (meaning the fund goes up as interest rates go up) and sold half our “dividend growth” position. Enhanced Growth & Enhanced Passive early last week got out of small cap and on Thursday lightened up a bit on our S&P 500 position. We are very close to seeing several sell signals in high yield bonds. We will keep you posted if we see more major sell signals.
On Saturday John Mauldin’s latest newsletter closed with a paragraph I think is important for all of our readers to take to heart —
Now is a good time to plan your de-risking strategy. You want to balance it with staying involved in growth assets, if they are part of your plan. Rather than trying to diversify asset classes, which are marching in lockstep both up and down, I would try to diversify trading strategies. Think about what you’re going to do when the market turns against you.
Hope is not a strategy. You need to have a plan, or you need to find somebody who has a plan that you feel comfortable with.
SEM’s platform at Trust Company of America allows you to do exactly that. Our longer-term models will indeed go down some, but they are simply a portion of an overall diversified portfolio. We offer dozens of trading strategies that can be combined into a single account. Each allocation can be customized to meet the overall risk & return objectives of the portfolio along with a structure the mitigates most behavioral biases we may exhibit at different times of the market cycle.
To learn more about our platform and how we can help, drop me a note and I’ll get you in touch with somebody in your area that can help you plan for whatever comes next for the market.
Tuesday, February 6 Update
The sell-off certainly escalated quickly. Most messages & calls to me yesterday centered around, “what in the world happened?” Here’s my summary:
-
Concern over inflation is causing re-allocations out of stocks
-
Fear the Fed will cause a recession (as they almost always do), especially with Janet Yellen no longer in charge.
-
Worry about the US Government’s ability to finance it’s debt
-
Capitulation
1.) Inflation: Friday’s jobs report showed a 2.9% increase in earnings. This is the highest in over a decade. At the CFA dinner two weeks ago, Blackrock’s Fixed Income CIO warned — “be careful what you wish for.” Inflation can erode so many things. Given the pent-up cash created by the Fed and the tax cuts that are just now hitting the markets this is a legitimate fear. What I think many people are missing is the fact over a dozen states, most of them large, had minimum wage increases kick in at the start of January.
2.) Fed Fears: Remember how everyone worried Janet Yellen would spark a recession? I do. I was one of those people. Instead she ended up keeping the status-quo, minus some very minor rate increases and a tiny fractional pull-back in the QE program instituted by Ben Bernanke. Instead, she has successfully pushed back the unwinding of Bernanke’s stimulus to Jerome Powell, the new Fed Chair. This is a tricky situation. On the one hand, Powell is a banker rather than an academic, so some believe he may err on the side of protecting the markets far more than even Yellen did. Of course that leads to a fear he’ll let things really get out of control before adjusting policies. On the other hand, bankers HATE inflation so he may move to stamp it out quicker than Yellen would have. This certainly is worth watching closely.
3.) US Government Debt Funding: Last week it was reported the US Government would have to borrow $1 Trillion this fiscal year, nearly double what they borrowed in 2017. This is at a time where both interest rates are increasing and the Fed is out of the business of buying US Government Debt for the first time in 10 years. In addition, they have plans to accelerate the unwinding of their unprecedented balance sheet. How much appetite will there be for this debt especially if the tax cuts do not spark the economic growth promised by the GOP?
4.) Capitulation: This to me is the most important one. Investors overwhelmingly gave up on risk management the past several months and poured money into passively managed funds. January fund flows set an all-time record. This to me was reminiscent to the capitulation into the market I saw in February 2000 and again in early 2017. These people weren’t convinced of the market’s upside potential, they just simply were tired of not enjoying the gains “everybody” seemed to be having. They were talked into it by the masses that overwhelmingly predicted a repeat of 2017. We hadn’t had a 3 or 5% correction since before the 2016 election. We haven’t seen a 10 or 15% correction since 2011. The longer things go up, the more our brains trick us into thinking things can’t go down. When we are proven wrong we see a massive (over) reaction to the downside.
Too many people were speeding
The analogy I often use is this. If you’re on a road trip, you may decide to push the speed limit. You push it up to 5 mph over the limit. You don’t see any cops or any accidents. People keep passing you so you go up to 10 mph over the limit. Again you see no cops or accidents and again people are still passing you. You then tend to reason with yourself, “everybody else is speeding,” or “I’m just keeping up with traffic.” The problem is you KNOW you shouldn’t be speeding. You KNOW it’s unsafe, but you’re brain has rationalized you violating these KNOWN rules.
However, the second you glimpse a car in the median, your brain immediately panics and causes you to hit the brakes. Whether it was a cop or not, your brain reacted back to what you KNEW you should have been doing. If too many people are speeding along and too many people hit the brakes, it could cause a chain reaction accident.
The past two trading days we saw the equivalent of a “car in the median” that may or may not been a cop. All the people that increased their speed 10, 15, 20 mph the last few miles immediately panicked.
Where are we at?
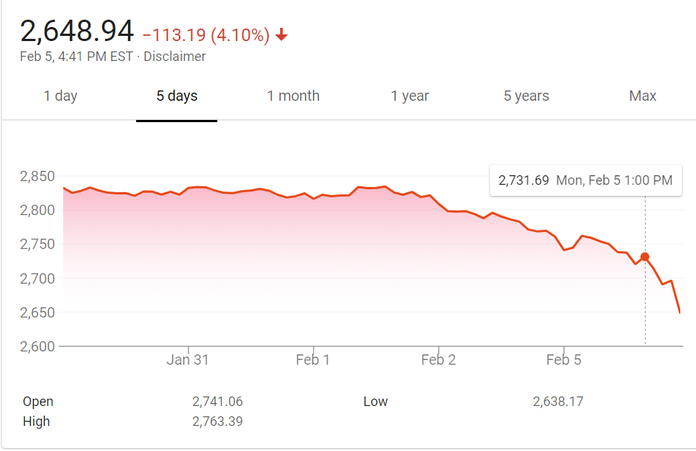
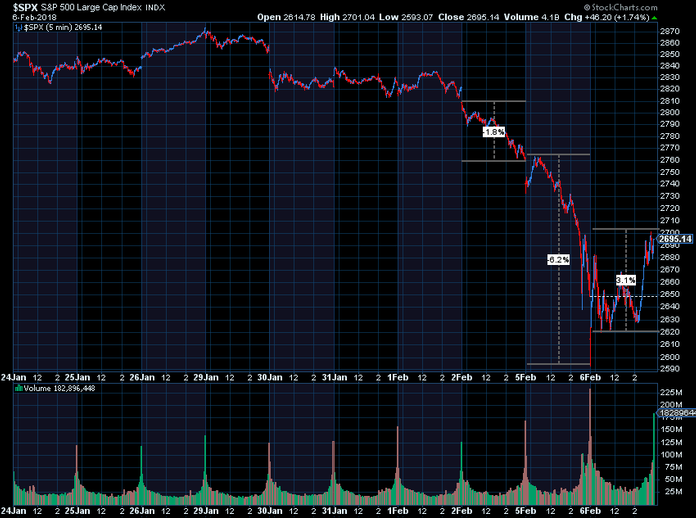
All we can do right now is look at where we are at and how quickly the “pile-up” happened. This 5-day chart shows the S&P 500 action. That drop from 1 pm ET into the close may look minor, but that was a 3% drop in 2 hours. ETF market makers report a massive spike in volume during the last hour of the day, with retail trading volume in ETFs rising 79% above the recent average.
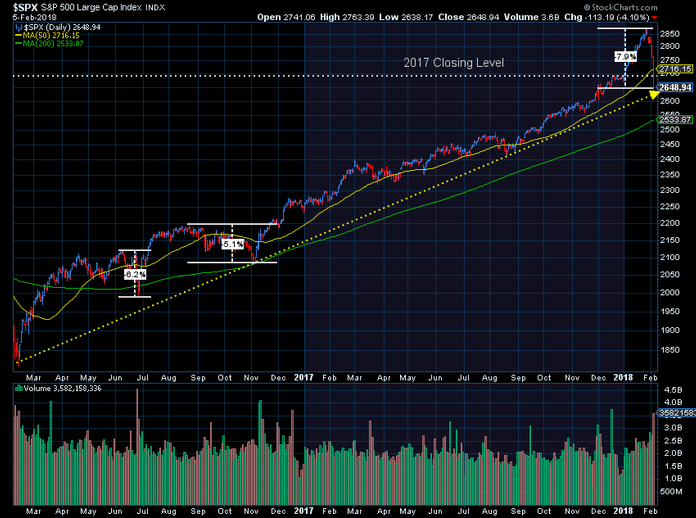
Scaling back a bit, I’ve drawn a trend line back to the lows and marked the 2017 year-end price. I’ve also noted some other corrections to put in perspective how quickly the market sold off. Note, however, the S&P 500 is just back to the trend. It’s given back its 2018 gains and a bit more, but nothing is broken. It could easily keep falling to the green line (200 day moving average) without generating any reversal in the up-trend.
SEM’s models are not designed to go from stocks to cash BEFORE a correction. Instead, most are trend following models. Our studies have proven this is the only way to keep up with the upside enough to not lose clients during long market rallies, but still keep them as clients when the market goes into the inevitable bear market. We cannot control what causes a correction or how quickly it happens.
We choose to focus on what we can control — structuring a portfolio that matches each individual client’s risk & return objectives as well as their behavioral profile. For the past 24 months we’ve seen those clients not in a well-rounded, diversified SEM portfolio lament the low returns in our more defensive strategies. Those strategies are designed to cushion any losses to the downside so clients can remain invested in more volatile, growth oriented strategies. A quick glance at our performance shows our most popular “Dynamic Defensive Growth” ENCORE model down 0.71% yesterday while the S&P 500 lost 4.1%. For the month of February, it is down 1.2% compared to the S&P’s 6.2% loss. Going all the way out the risk spectrum to our AmeriGuard portfolios, they are down between 4.3% – 5.3% in February (Balanced to Max). So while those losses are high, they are still showing the value of our active approach across the asset management spectrum.
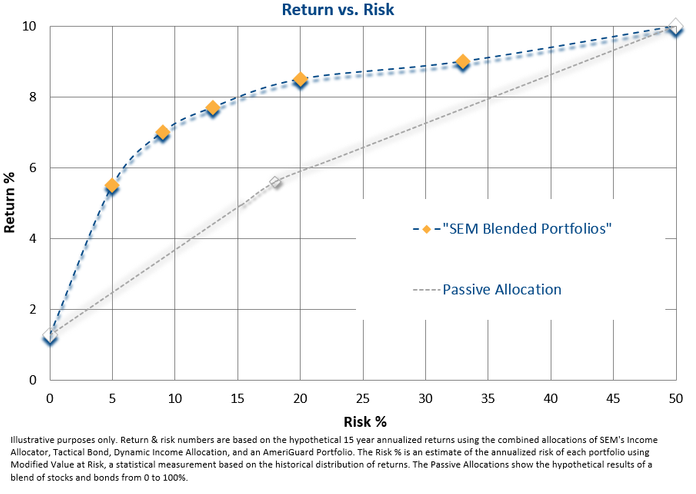
Most importantly, we have been working with our advisors to make sure they are positioning clients in the right mixture of SEM’s programs. Most investors only have a 10-20% risk tolerance, which means few have all of their money in our AmeriGuard portfolios and most have a high percentage in more heavily managed lower risk portfolios (such as Dynamic Defensive Growth). (see “Bending the Curve“)
As always we will be closely monitoring all of our models. Most are designed to let things settle out before making adjustments on the first leg down. We should expect a snap-back rally at which time they will be able to more clearly assess what is happening in the markets.
Wednesday, February 7 Update
Long-time readers will remember me discussing “turn-around Tuesday”. I don’t think I’ve had to mention this since the summer of 2011, the last time the market went through any sort of real volatility. This term was coined by Todd Harrison, a hedge fund trader and financial columnist who wrote for several websites. For whatever reason Todd observed over his long career, the market would tend to reverse large losses at some point on Tuesdays. Yesterday was clearly an example of what a turn-around Tuesday looks like.
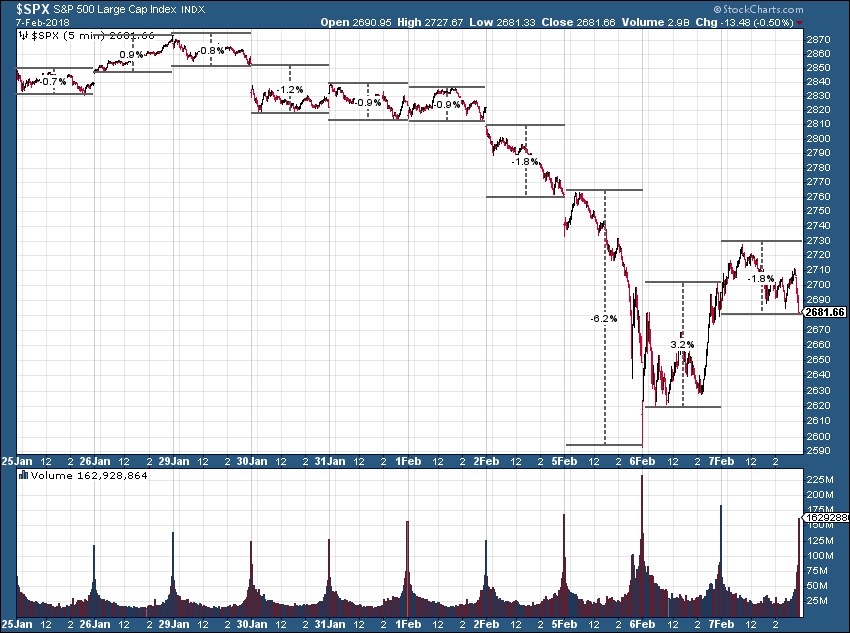
Here’s a 10 day chart of the S&P 500. I’ve added the ranges for the last 3 days.
Like the selling on Friday & Monday, there was literally nothing that sparked the big swings in the market. This is “normal” following a round of panic selling. We should expect more volatility in the days ahead. Our systems are still saying this is a short-term non-event. If normal patterns hold, we should expect a re-test of the lows in the next 5 days before the market is able to put in a more sustainable bottom (it needs to shake out more weak holders who bought into the rally today.)
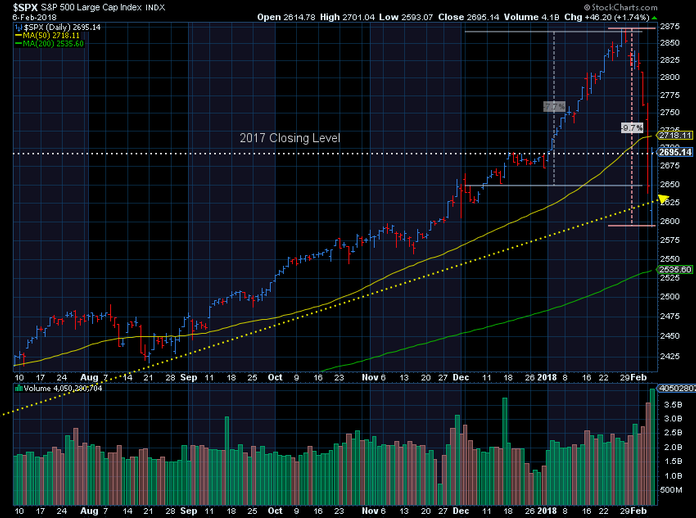
Zooming back out a bit, we can see the rally took the S&P back around the 2017 year-end level, a number that may be psychologically important for market participants. I’ve also added a marker showing the loss from the very high point last week to yesterday’s low — almost a 10% decline in a matter of days.
For our part, we did receive some sell signals in our high yield bond trend following systems. This reduced our exposure by 50-60% in Tactical Bond & around 25-30% in Income Allocator. As always, if the signals are false alarms we stand ready to get back in. High yields held up relatively well, which was refreshing given the extreme valuations in that market, but the volatility of late has been so low it did not take much to get a sell signal.
On the tactical growth side (EGA & EPA) we received some buys & some sells as the cross-currents in the market are not indicating any MAJOR issues lie ahead for the market. It looks like the net effect is a reduction in exposure by about 7-10% in EGA.
While our systems across the board are not indicating a severe decline is imminent, this does not mean you should be resting comfortably. This episode is a warning that the market can and will go down. It will go down far faster than anybody can anticipate. The only way to prepare for this is to move into a “risk-targeting” portfolio — a portfolio designed to hit a specific risk target rather than chasing the market with the hopes of higher returns with little attention applied to how much downside the portfolio may have.
Setting up an efficient, risk-targeted portfolio allows clients & their advisors to ignore the noise when the markets inevitably decline.
Thursday, February 8 Update
The roller-coaster continues, which is normal following a large drop in the market. Market participants are wrestling with the question of whether this was the start of something big or a temporary bump that is a buying opportunity. This is the problem with subjective management and why at SEM we deploy Scientifically Engineered Models. These models are actually designed to sit through this “damped oscillation” and wait for the next trend to develop. What is “damped oscillation”? Think of a rubber ball dropped off a table. Each bounce is progressively lower. If the ball didn’t drop straight down and there is a bit of spin on the ball, it can be unpredictable, but things eventually settle back down.
The 10-day chart of the S&P shows a “damped oscillation” pattern.
It would be healthy to see a re-test of the lows in the next several days. This should wash out the people that bought on the lows that thought it was the bottom. It could also bring in more solid buyers —– or it could bring in more wide-spread selling as market participants fear even deeper losses.
I read an article yesterday titled, “Leading robos go dark during market plunge” Apparently these low-cost platforms designed to put clients in a portfolio they don’t have to monitor were not prepared for how humans react to losses in their accounts. This is not a surprise to us at SEM. Our Behavioral Approach to Investing is specifically designed to combat these types of panic attacks from investors. If we can prevent clients from getting so emotional they become irrational they are likely to stick to their long-term financial plan.
While I like the idea of a “robo” portfolio for certain investors and certain account types, without having some Behavioral Coaching, most people cannot remain 100% rational, 100% of the time. Our AmeriGuard portfolios could be considered a “smarter” robo. The cost is just slightly more than the leading robo platforms, but AmeriGuard portfolios apply our Behavioral Approach to Investing by adjusting the allocation in the portfolios enough to take SOME money off the table during severe declines. Knowing the portfolios are designed to automatically do this helps overcome the human desire to DO SOMETHING when the market is falling. [To learn more about AmeriGuard, send me an email.]
Finally, in case you missed it, we recorded a Podcast while I was in Minnesota discussing the decline, what caused it, what we think will happen next, and whether or not any portfolio adjustments are needed. Click here to listen.
Check back tomorrow for additional updates.


