
There are a lot of opinions floating around about who caused what, when it changed, and what the future impacts will be. At SEM we choose to ignore those opinions and instead focus on the data. This week’s Chart of the Week will take a closer look at Consumer Sentiment.
ILLUSTRATIVE PURPOSES ONLY — PLEASE SEE DISCLAIMER AT BOTTOM OF PAGE
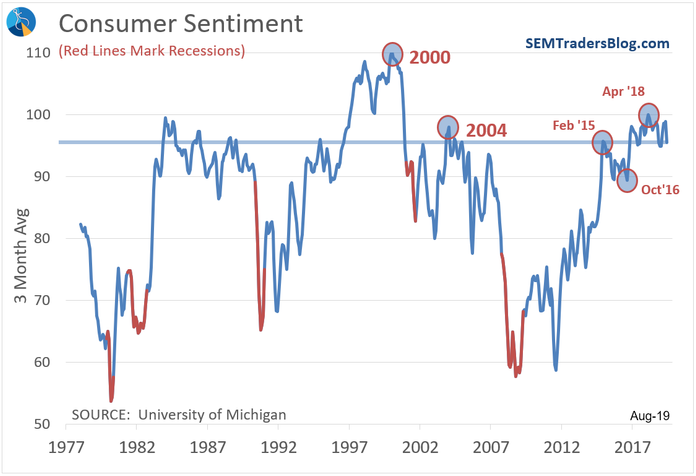
Here are some FACTS we can draw from the data:
-
Consumer optimism peaked in 2000. Even the Housing Bubble could not drive consumers to be as excited as they were at the end of the Tech Bubble.
-
Sentiment steadily climbed after the 2011 “Debt Ceiling Circus” and EU/Greek credit scare all the way through early 2015.
-
Even at its peak during the Obama years, sentiment could still not eclipse the highs from the Bush II administration in 2004.
-
Sentiment bottomed in October 2016 and climbed steadily following the election of Donald Trump to the highest levels since the Tech Bubble burst.
-
Sentiment peaked as the Trade War picked up in the Spring of 2018 and is now back to the February 2015 Obama peak (note I’ve found smoothing the data with a 3 month average helps take out some of the wilder fluctuations).
This isn’t an endorsement of any president or their policies. Right or wrong, it shows how Americans felt during the various phases. Remember, we are all humans and humans are emotional. These emotions influence how we all make decisions. As we know those emotions go in cycles. We’ve had a very prolonged recovery so we should expect sentiment to fall at some point.

The real issue is analysts, portfolio managers, and investors are also humans and therefore emotional. The last two weeks in the blog we’ve discussed how these market participants have priced in a very positive environment. If consumer sentiment continues to fall we could see their rosy expectations ratchet down rather quickly. This leads to a double whammy on stock prices as both future earnings growth and risk premium adjustments play a major role in the “intrinsic value” of stocks. Suddenly “cheap” stocks look expensive when sentiment changes.
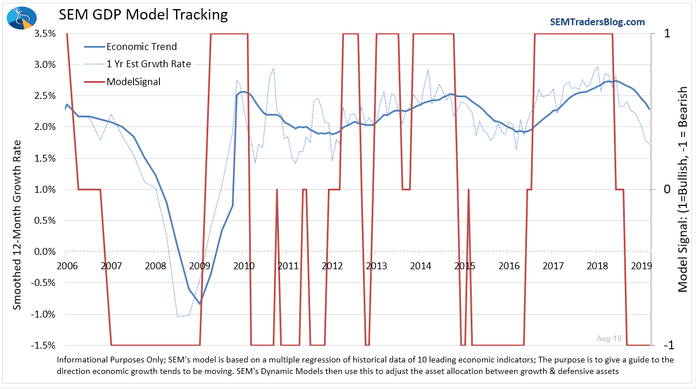
Consumer Sentiment is one of the leading indicators in the SEM Economic Model. As noted below, this model which drives the allocation to our “Dynamic” models was already negative, so this latest drop did not lead to any additional portfolio changes.
Bonus Chart of the Week
I posted the following on LinkedIn on Tuesday (click here to connect. I use LinkedIn as a place to post some short, often random thoughts that don’t always wind up in a blog or a newsletter.)
The Manufacturing data released this morning added to the growing list of data pointing to a looming recession. The New Orders component hit the lowest level since 2009. This is no surprise to those following our economic model, which continues to show a sharp deceleration in growth.
While our economy appears to be a cruise ship heading towards an iceberg, it is important to keep in mind we’ve seen pundits warning about recessions in 2010, 2011, & 2015. Our model reduced risky assets during those times, but never called for a recession, just a deceleration in the growth rate (which is bad for stocks and high risk bonds.)
The key is having a well thought out plan that removes emotions and relies on the data. Making judgements based on current headlines is almost always a losing strategy (as is banking on central banks being able to prevent a recession.)
ILLUSTRATIVE PURPOSES ONLY — PLEASE SEE DISCLAIMER AT BOTTOM OF PAGE


