The Oscars, the Grammys, the Emmys, the Tonys, and the Kansas City Fed Monetary Policy Symposium.......What do these annual events have in common? In each of their respective industries they have become THE annual event everyone looks forward to.
In the financial markets the Symposium is simply known as "Jackson Hole", the location where they typically host the event. This year it was a virtual event, but it still moved the markets. It wasn't always this way. Ben Bernanke started using it as the place he would announce new policy directives starting back in 2007, including deeper discussions of the idea of flooding the economy with money which gave him the nickname "Helicopter Ben". The markets took off following the event in 2010-2012 when Dr. Bernanke discussed the idea of QE2, 'Operation Twist', and QE3.
As we start week 25 of the Pandemic, let's take a quick look at my thoughts on the Fed's latest announcement.
What does an inflation target even mean?
In the 2011 Symposium, much discussion surrounded ways to make the Fed's policies easier for the markets to understand. The idea was if you knew the Fed would stay 'supportive' until some specific data points were reached, the markets would more willingly take on risk. In 2012 the Fed officially announced their target rate of inflation was 2%. I won't bore you with the research as to why this is considered the "sweet spot", but let's keep that target in mind.
First off, we all understand inflation means prices for things we are buying are going up. Theoretically we would want to see those prices going down, but the problem is if consumers see prices going down they won't have any urgency to spend money. They will just keep waiting for lower prices. Deflation or even low inflation is what keeps the Fed up at night because they need consumers spending money to support two of their mandates: full employment, but more importantly, ensuring the financial system and markets function properly. A weak economy means the banks not only will be dealing with defaults, but also will not be willing to lend. This also potentially creates liquidity issues in the banking system. The bottom line – the Fed wants inflation (just not too much inflation.)
So what did they really change last week? Only a few words. Instead of having a "target" rate that is seen as a hard stop, the shift in policy is to target AVERAGE inflation of 2%. They didn't define how long a period they would be averaging the inflation number, which gives them more flexibility. Going back to 1960 the average is 3.2%, but back to 1980 it's 2.6%. Even going back to the Alan Greenspan days, the average inflation rate is just 2.09%. Here's a great chart from WSJ illustrating the inflation since each Fed Chair took office and the rate of inflation we'd have to see to hit the 2% target.
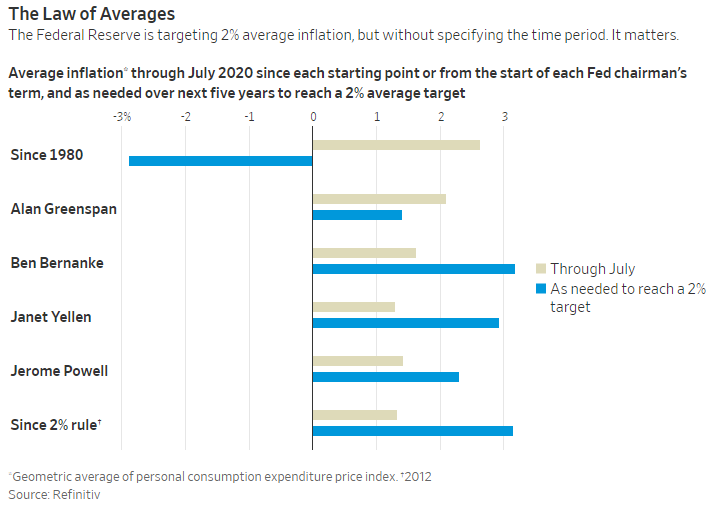
Looking at this data, the market took this as a sign the Fed will have the ability to essentially unleash unlimited stimulus. We've been conditioned that this is a good thing (the 'BRRR' in the graphic is the sound a money printer makes and has become a common phrase on Wall Street when somebody asked why stocks are going up - 'because the money printer goes brrr')
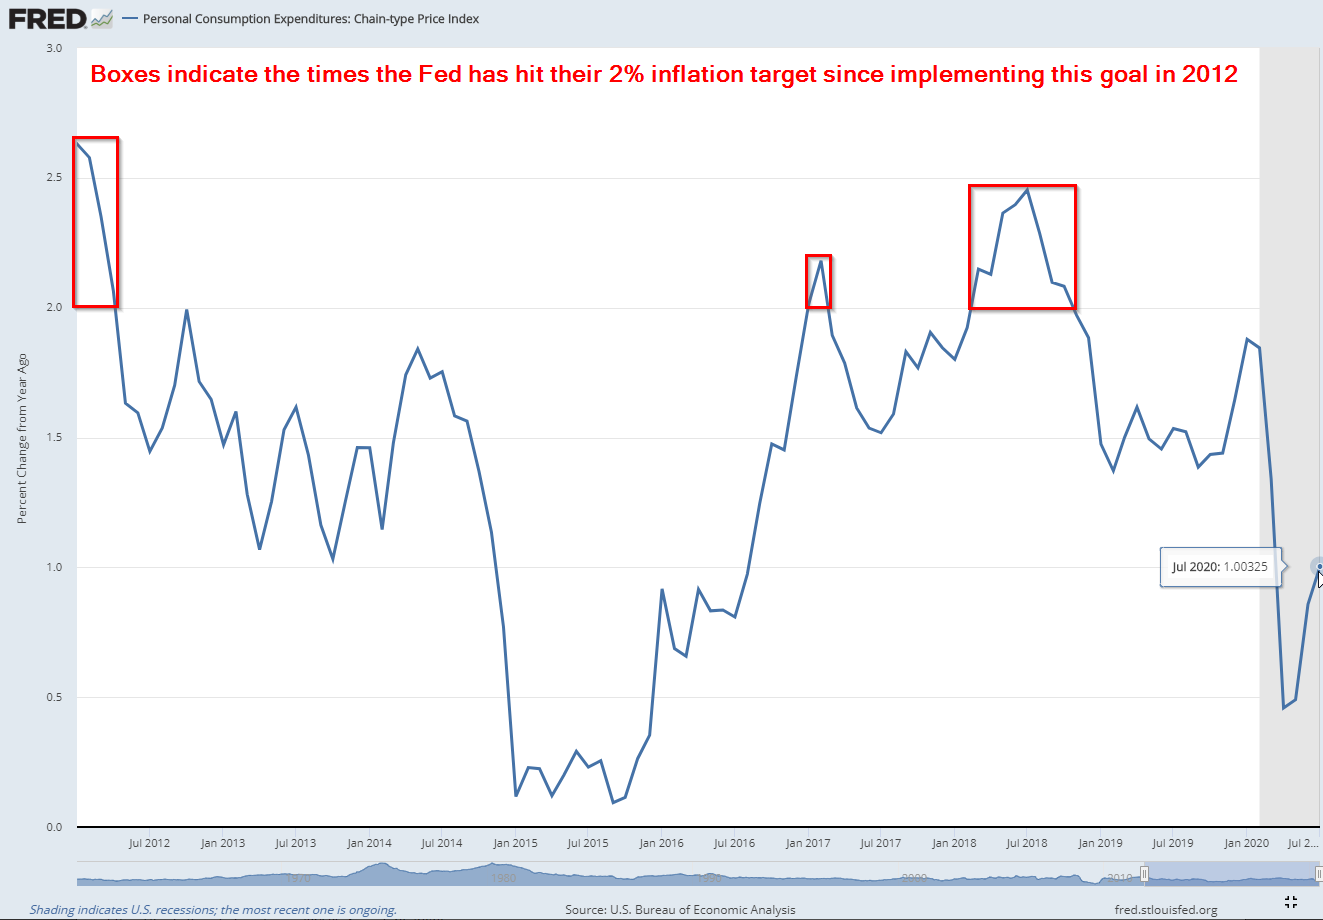
The question is at what point do we worry that the Fed has been woefully inept at hitting their 2% target inflation rate DESPITE unprecedented QE during an economic expansion.
I get it. It's exciting to think the Fed will NEVER let stocks go down, but over the long-run stocks appreciate at the rate of economic growth, inflation, and the dividend rate. The economy has struggled to grow at the long-term average of 3% even following the Trump tax cuts or all the Fed stimulus from 2009-2015. The reason the economy is struggling to grow is the same reason the Fed has struggled to hit their inflation target:
- A declining workforce
- Lower wages / lower quality jobs (fewer hours, benefits, etc.)
- The gigantic and increasing debt load of businesses, local, state, and federal governments
- The trade imbalance (which has not been solved with tariffs)
What the Fed is doing (encouraging use of debt to spend) is not going to help over the long-term. When we use debt to CONSUME, that money is gone. That's money that will have to be taken from future income to pay it back. In addition, our country has to find a way to pay all the promises made to the increasing number of retirees. Whether Social Security and Medicare or pensions, the growth the last 10 years has not been enough to generate what is needed to keep the "promises" made. The next 10 years could be even worse if the solution is to borrow even more money (or raise taxes) to give retirees money.
We need investment and the Fed is not doing it. The fact they are changing from a hard target to an 'average' is not something that matters until they prove they can even push inflation to 2%.
Not many tools
While the idea of "yield curve control" did not specifically make it into the new policy guidance, the Fed's primary tools remain finding ways to control interest rates. With rates already essentially zero, the Fed can either choose to go negative (which has proven to not work in Europe and has severe unintended
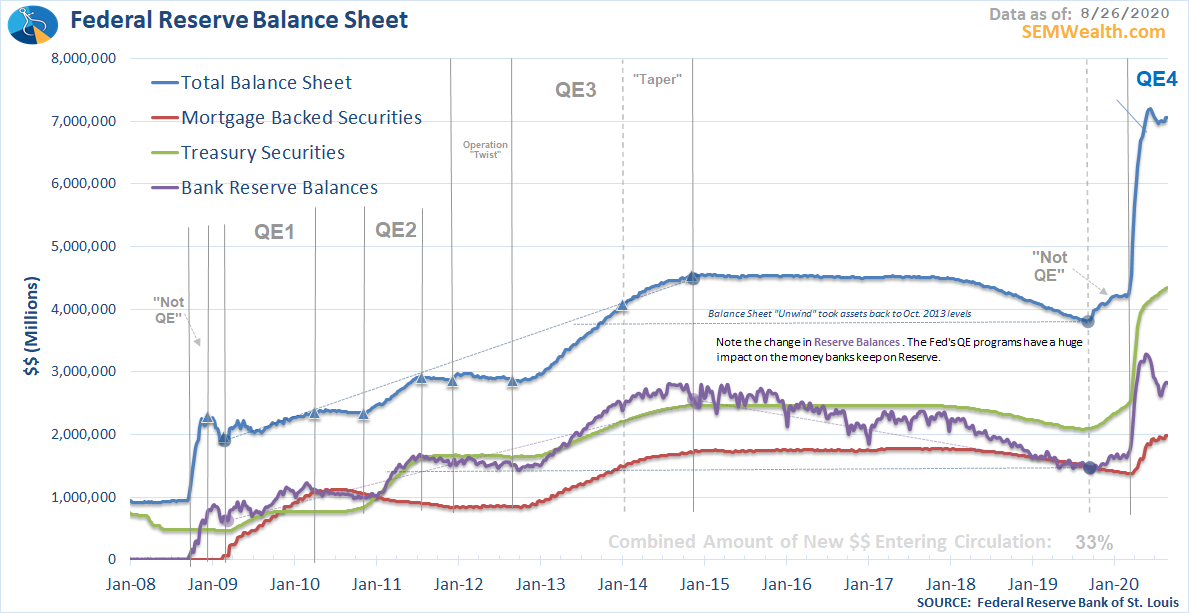
Following the spike in rates a few weeks ago, the Fed has increased their balance sheet slightly. This will continue to be the best snapshot of what the Fed is doing in the market. Remember, they create money to purchase assets from the banks. The banks can then essentially take that money and do whatever they want. In most cases, the banks choose to keep it on "reserve", which can then be used as collateral to calculate their leverage ratios. That money can flow into any of their divisions, including their investment arms.
Be careful making predictions on yields
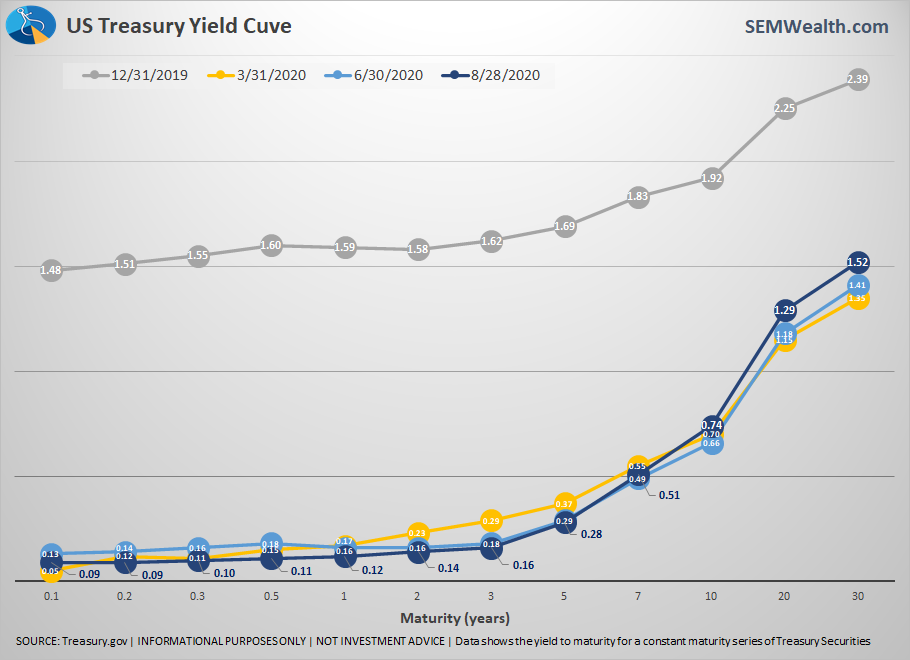
Since at least 2010 I've had to help clients and advisors justify owning bonds in a portfolio. This is when we first started hearing how bond yields had hit bottom and could only go higher. Time and time again we've seen those experts proven wrong. Remember, when yields go down, prices go up. The Fed's new policy saw longer-term Treasury bonds to sell-off last week, but when you take a step back and look at the yield curve, it doesn't look like a very big move in the grand scheme of things.
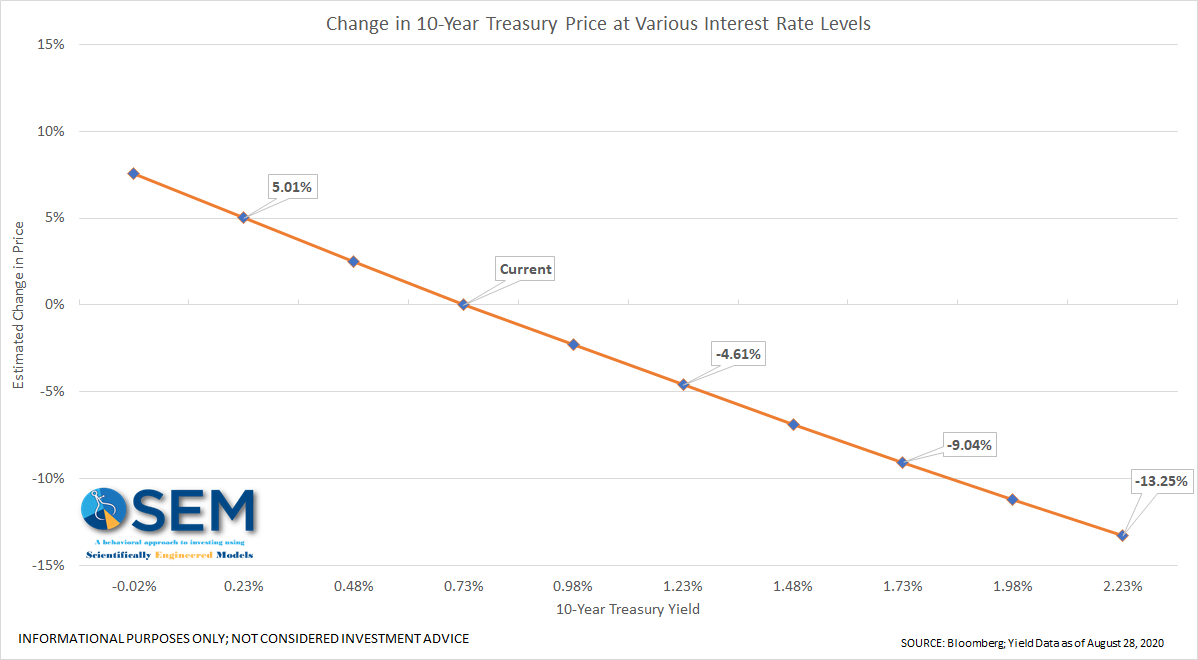
Granted, inflation is bad for bonds, but as I illustrated earlier, the Fed has failed miserably at generating inflation. It could be argued the spike in long-term rates is a buying opportunity. The closer we are to 0% interest rates, and the longer the maturity, the larger the price changes are for each change in interest rates. Looking at this chart, as yields go down (shift to the left), your returns go up. For example, a 1% drop in rates would lead to a 5% gain, a 1% increase in rates would lead to a 4.6% loss.
Given all I've discussed above, I wouldn't be so quick to sell your bonds. The Fed is going to try to push interest rates DOWN. The only place they have room to do this is 5 years and longer.
If you are in a buy and hold bond portfolio (or are retired or retiring in the next 10 years), I would certainly recommend you talk to SEM about your positions. We may have better options for you.
Risks followed by opportunities
The Fed has already pushed yields on short-term bonds close to zero, which punishes savers as well as pensions and insurance companies trying to find ways to meet promises that are becoming close to fantasies. The average return on investments in American pensions is just over 7% per year. State pensions are a little lower at 6.4%. Most plans are estimating 8-10% from stocks and 4-5% from bonds. If you believe those levels are attainable in the next 10 years, great. Just keep in mind if they don't hit those returns they are going to have to either cut benefits or find additional income streams to cover the gaps. Neither will be good for the economy or heavily indebted borrowers (or the banks and investors who lent them money).
When that happens is anybody's guess, but the Fed's actions do not change the daunting math facing pension funds and insurance companies. Again, the Fed actually making their problems worse. It will force these plans into higher risk assets, which means they are more likely to endure significant losses, only further compounding their math problem.
Especially on the fixed income side, being focused on risk management by applying an unemotional, data-driven process is going to be very valuable to those relying on their investments over the next 10 years. I've heard too many people advocate the use of dividend paying stocks to replace bonds in portfolios. This could be devastating to a retiree. There will be a time where valuations are so attractive in both bonds and stocks a buy and hold approach may work again, but we are at the opposite side of that position right now.
What I love about SEM's wide array of strategies, is all are close to fully invested, which means as the market celebrates the money printer going 'brrrr" our clients are making money. The key is we have methods to capture those gains and move to more defensive investments when the trading systems indicate danger is near.
(Keep in mind our systems are designed to allow the markets to fluctuate so we will never get out at the top. We typically structure our client's portfolios with a wide range of investment models. Let's talk if you'd like to learn more.)
Positive trends, but what will fall bring?
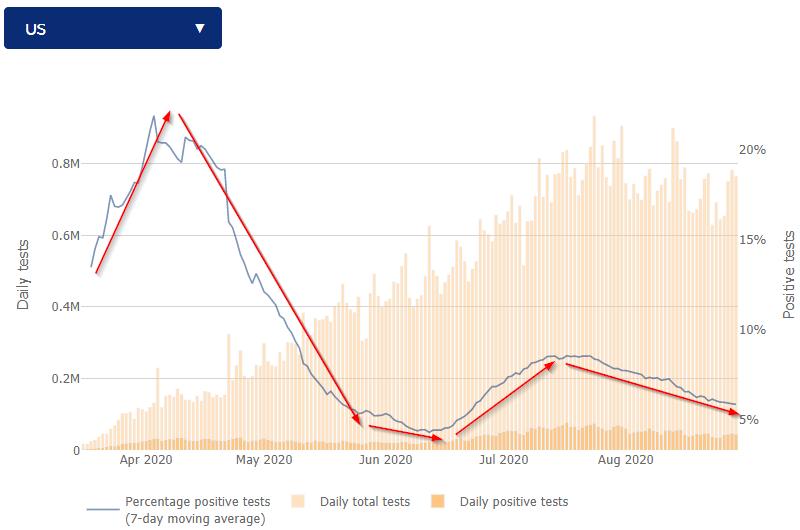
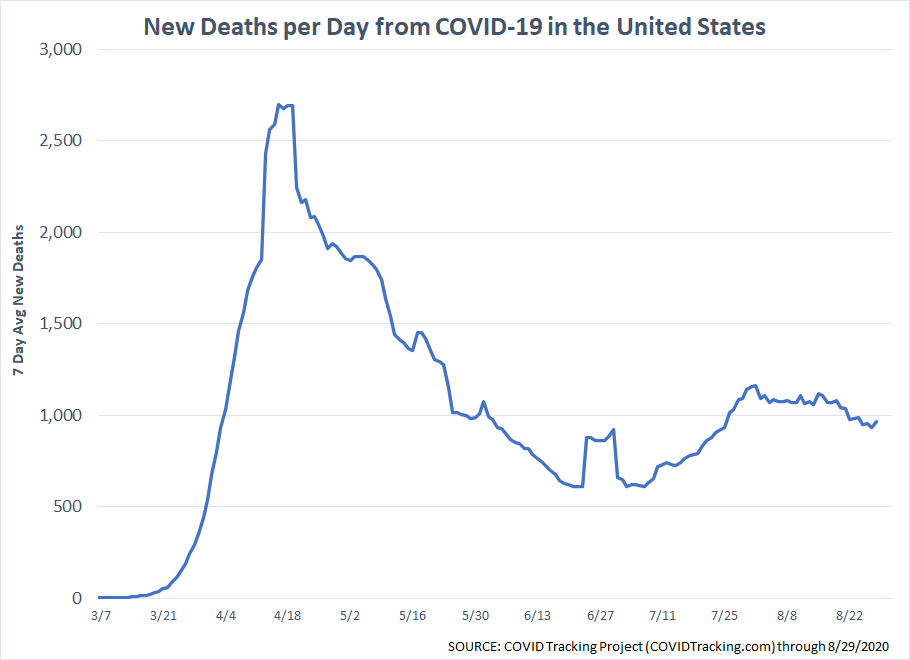
We'll end this week as I have most, with a look at the COVID charts I've been tracking since the beginning. I use this to help us learn more. I'll be the first to admit I didn't think at the end of August I'd still be tracking them. What we've learned so far – mask mandates and social distancing requirements do indeed slow the number of cases (best measured by percent positive tests). It takes about 10 days to see adjustments in policy change the trend in positive tests. It's another 14-28 days before we see it change the trend in deaths.
After the summer surge, which followed many southern states widespread re-openings, the trends have again moved in the right direction (without having to shutdown the entire economy).
Overall, we've "flattened the curve", but we do still have the number of deaths per day around 1000, which means we'll hit 200,000 before the end of the quarter.

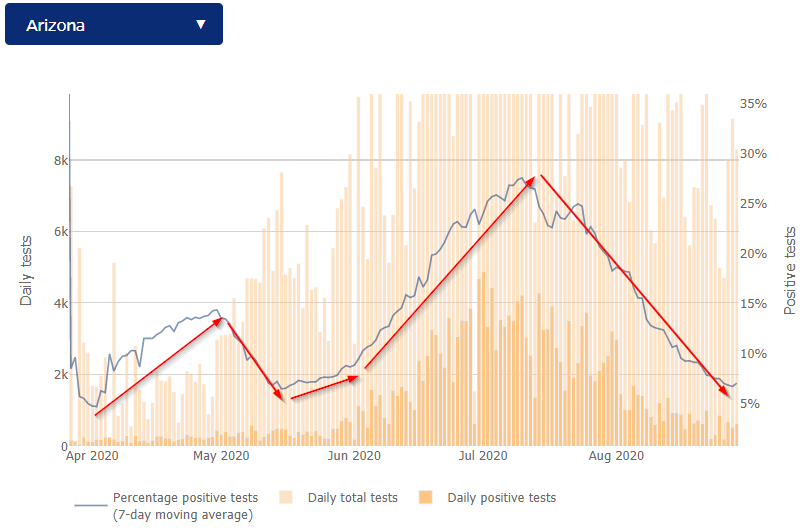
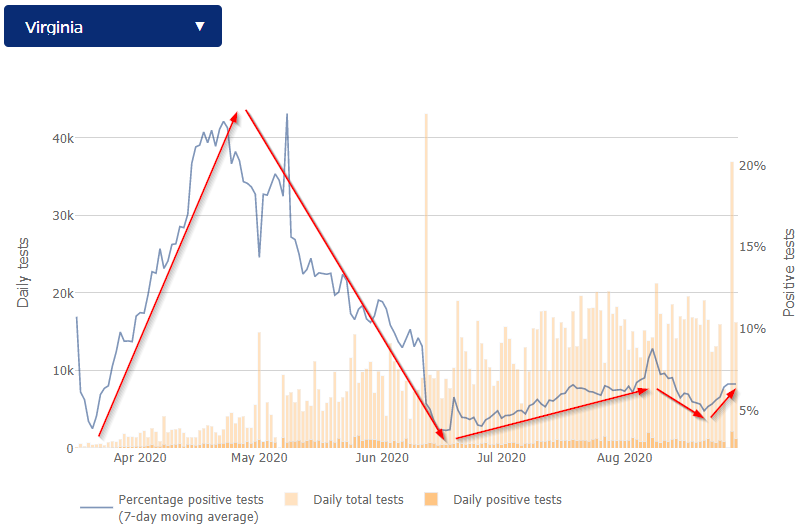
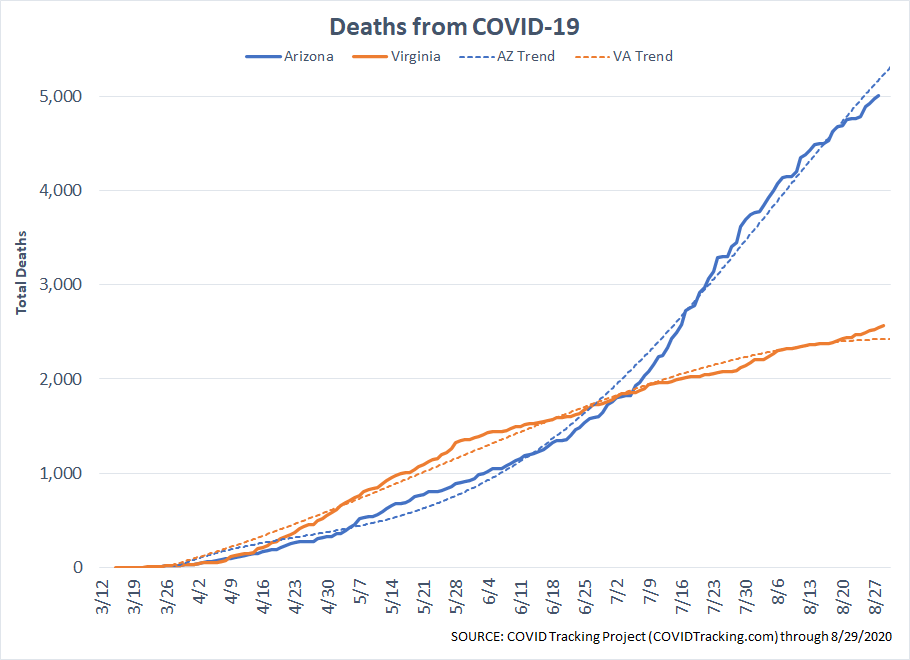
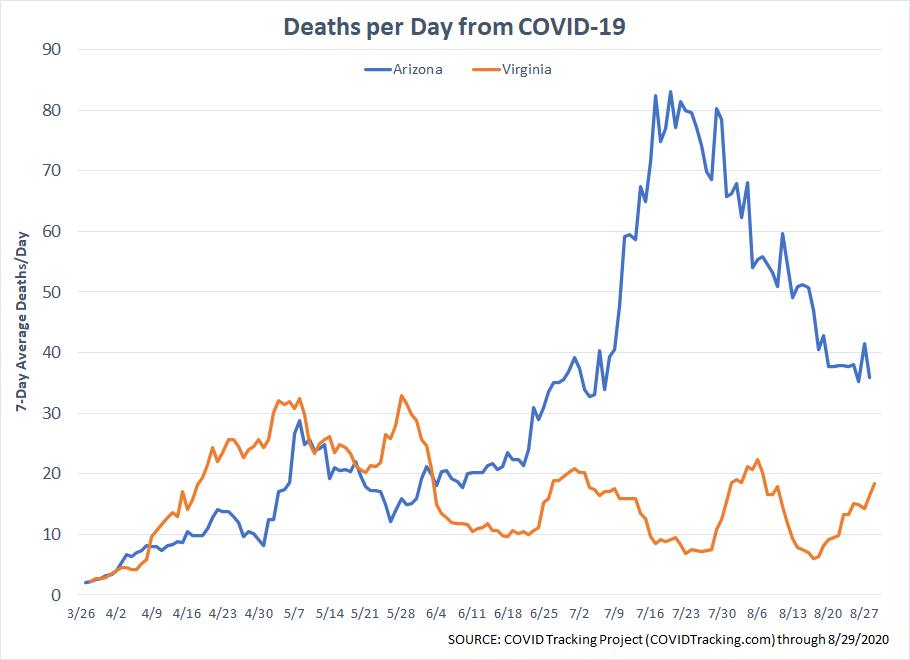
Comparing Arizona and Virginia we can see the polar opposite responses that are now much more in sync. I did note Arizona was averaging 18,000+ tests per day throughout the summer. The past 3 weeks they've averaged about half of that. Virginia has had a steady number of tests throughout, with a big spike last week as the University of Virginia, Virginia Tech, and several smaller universities welcomed students back to campus.
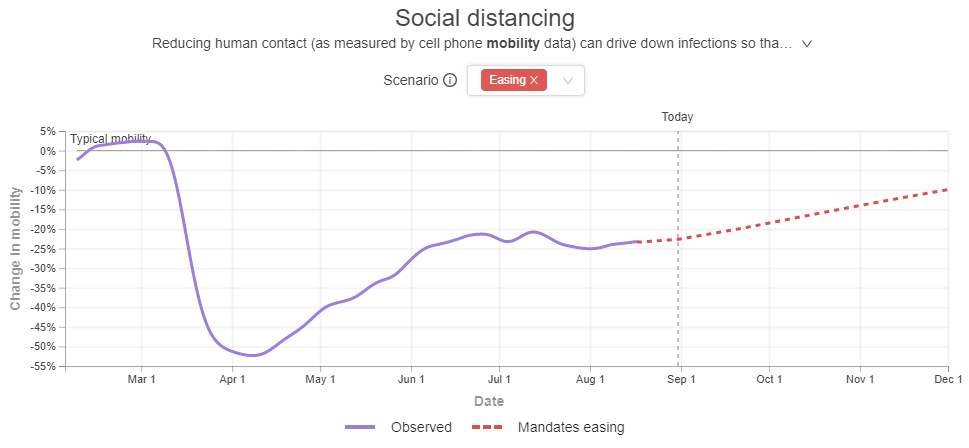
I'll include this helpful chart from the Institute for Health Metrics and Evaluation. It shows the trends in mobility as well as projections into the end of the year. This is still a problem for anybody banking on a "return to normal". Until we get schools back to in-person learning it's going to be difficult to get back to a fully functioning economy. Without additional stimulus (I really, really hate typing that), we could be looking at a big hit to the economy the market is certainly not pricing in.