
Typically, this time of year we see a nice rally in the stock market, often called the "Santa Clause" Rally. Historically December has been the most often positive month of the year. There are many logical reasons for this, some of which have shifted over the years. The primary driver was a flow of new deposits into the market ahead of the end of the year.
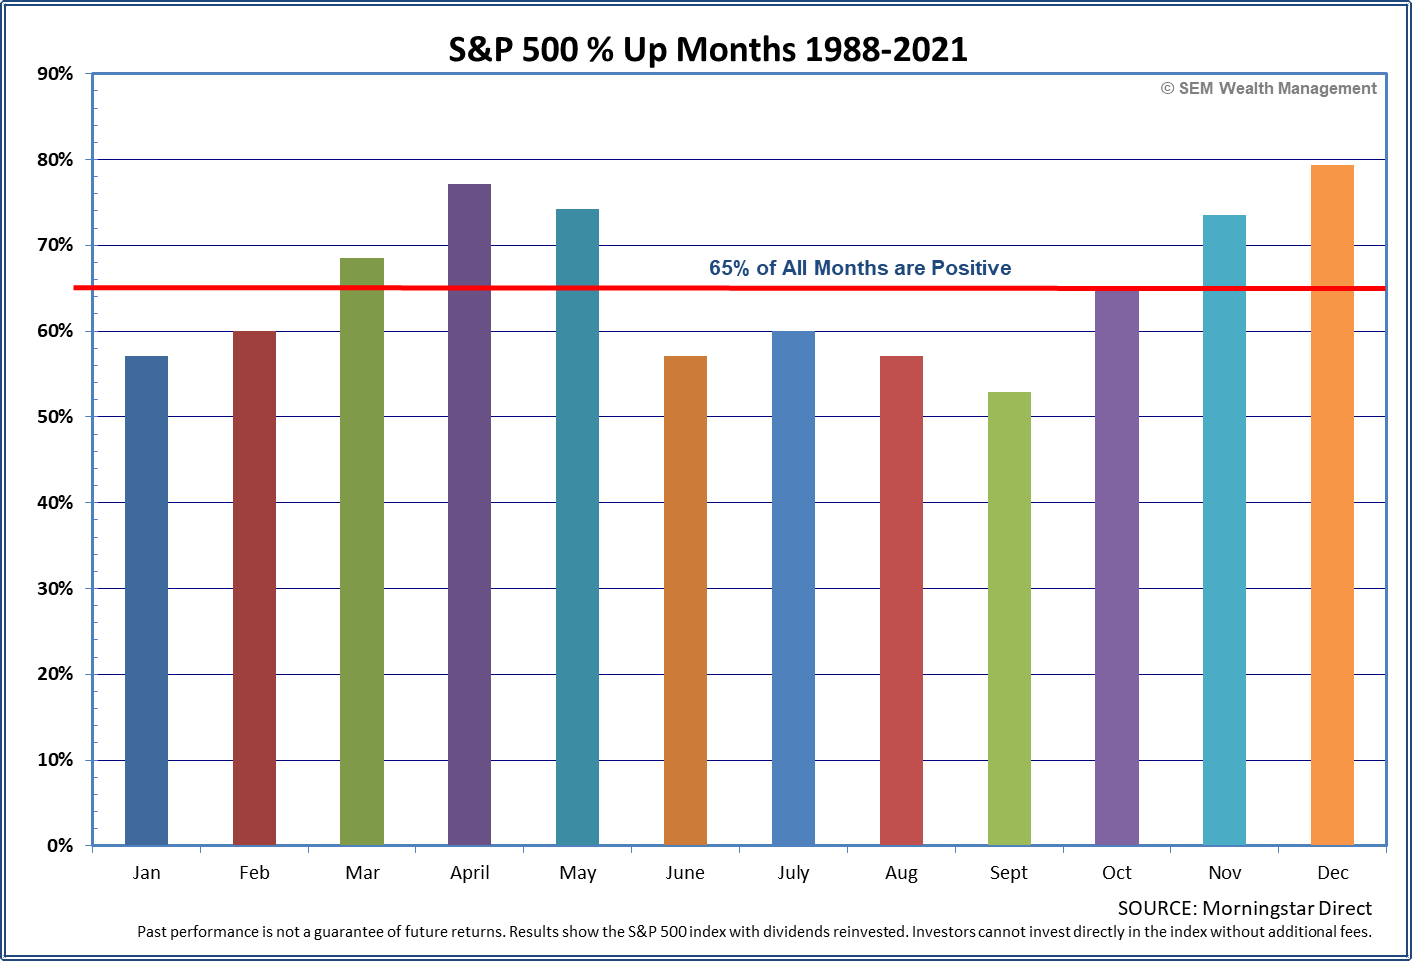
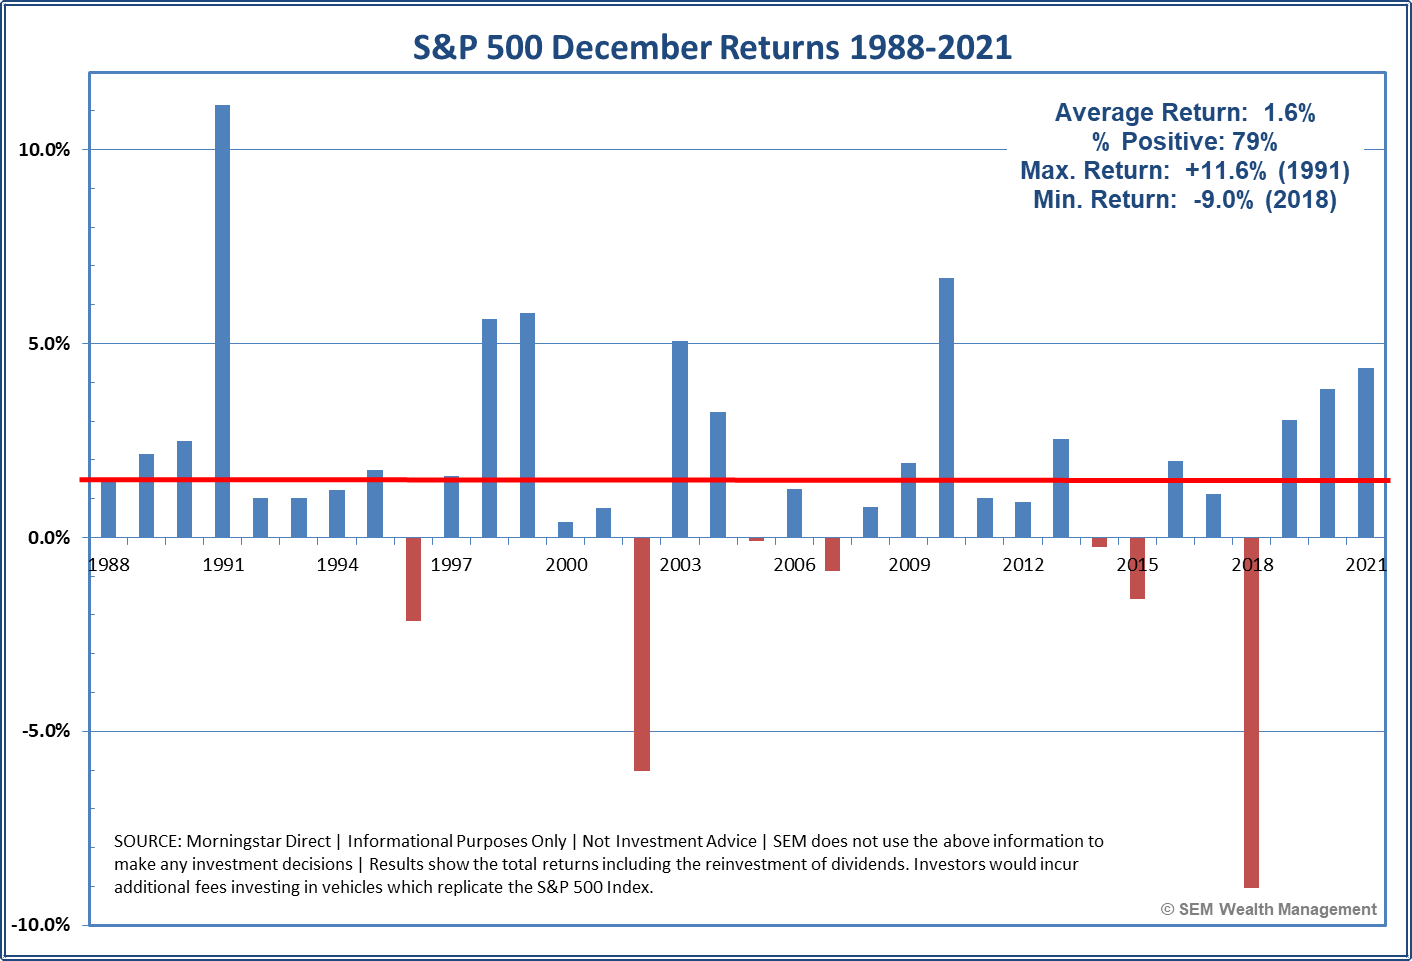
With December up nearly 80% of the time, this still means 1 out of every 5 years December posts negative returns for stocks. The worst was also the most recent – 2018 when the market lost 9%. The second worst was in 2002 when December was down 6%. Both of those years had something in common – they were volatile years with many large rallies and declines, which left taxable investment accounts with some unrealized losses. Selling these losing positions prior to the end of the year is called "tax loss harvesting."
It should be noted SEM has been actively harvesting losses throughout the year, but many large institutions wait until the end of the year to capture these losses. This can create additional downward pressure on stocks. This could be the reason we are seeing such a negative start to the month. I think the negativity is more a result of investors attempting to determine what 2023 will look like.
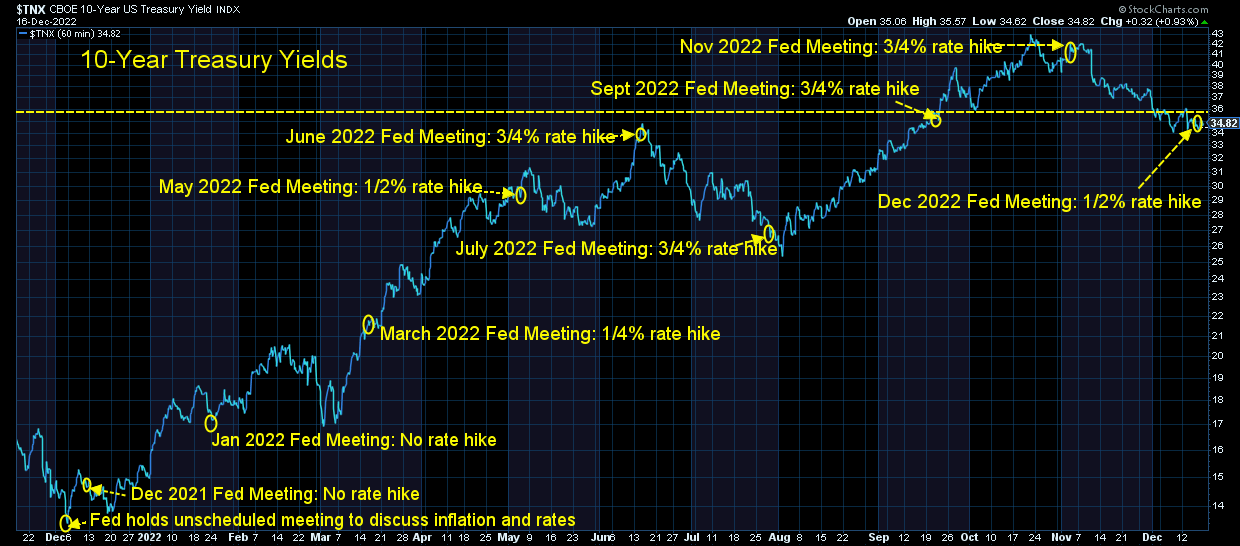
At SEM we don't make annual forecasts. Over our 30+ years we've found them to be not only useless, but also quite dangerous. NOBODY has a consistent track record of successfully predicting the year ahead. In fact, Wall Street has an abysmal record of predicting the market, especially negative years. A year ago, the median estimated for market returns was 8% for 2022, yields were expected to rise from 1.5% to 2.5%. The Fed themselves couldn't even predict their policy levels. Last year they thought the Fed Funds rate would end the year around 2.5%. Instead, stocks are down over 2%, long-term yields are hovering around 3.5% with short-term yields above 4.3%. The Fed last week raised the Fed Funds rate to 4.25% (and expect it to peak just north of 5% in 2023).
That said, the SENTIMENT surrounding these forecasts matters, which is why at SEM we follow a quantitative approach. When there are large unknowns we can see big swings in stock and bond prices. Right now there is a major tug-of-war going on between those who believe the Fed will be able to rein in inflation without causing a recession. Every time inflation comes in below expectations (such as last week when it came in just 0.2% lower than expected) we see a huge (temporary) market rally.
The other side of the market believes the Fed is too late in their inflation fight and will have no choice to cause a recession in order to finally get inflation back down to their 2% target. This means when we see signs of economic weakness or the Fed themselves in speeches reminds us of their sole focus on inflation, the market resumes its downtrend.
Subjectively, I remain on the "Fed is too late" side. Our data driven models also believe this is the right position to be in although we do have some smaller positions which were added in late October and early November as the market strengthened. Those continue to be "short-term" trades which could easily come back off as soon as this week if the weakness continues.
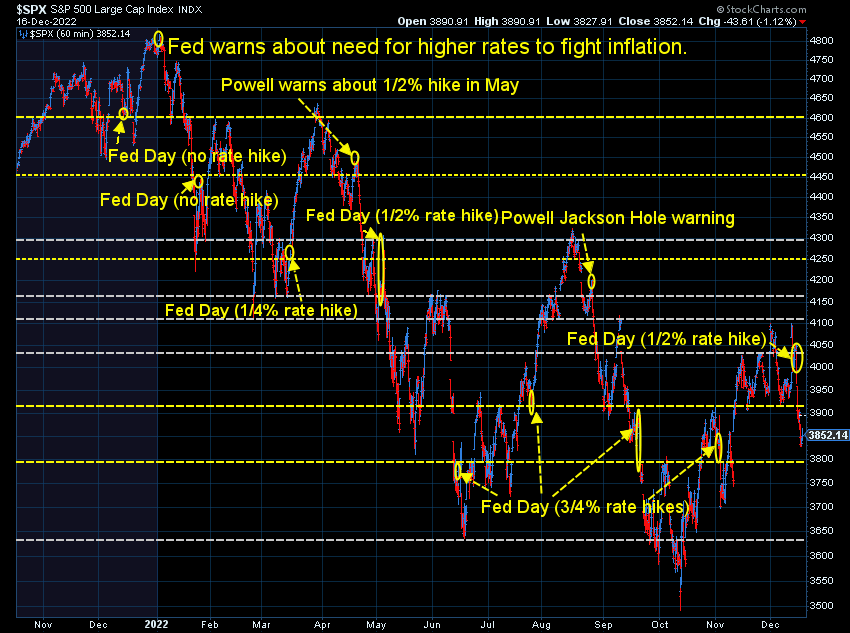
Turning to the market charts I follow every day......
Last week I warned about the fact we were again at what appeared a euphoric peak. A downtrend is marked by lower highs and lower lows. This hourly chart really highlights the swings we've had this year. If the market continues lower, this will be the 6th failed attempt at a rally.
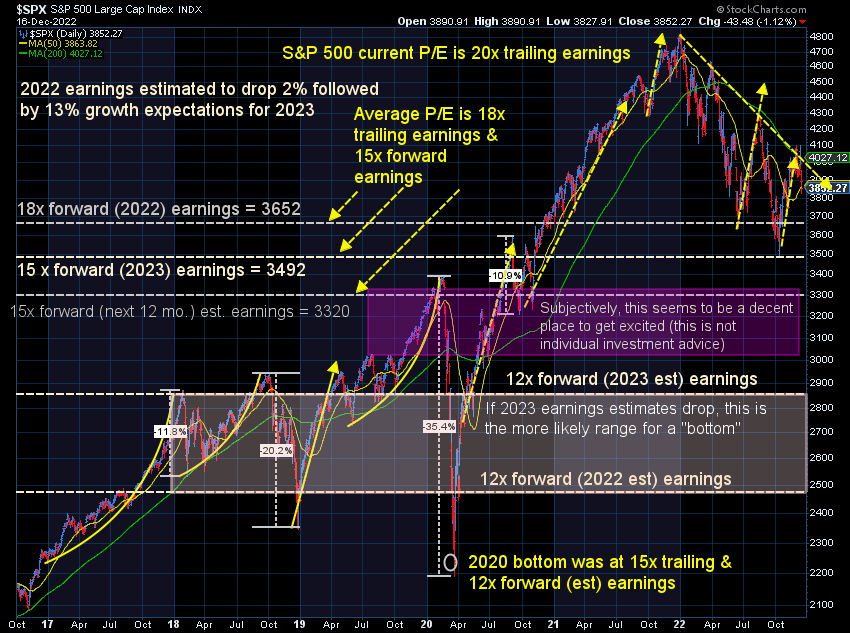
This longer-term chart really highlights the problem. After a rally that was fueled by $5 Trillion of stimulus funded by $5 Trillion of Quantitative Easing stocks remain overvalued even after a 15% drop in prices. Subjectively, I wouldn't be excited about stocks until we see the S&P trading at least down at 15x earnings (12x would be a "back-up the truck" moment.) Of course when stocks get down to those levels everyone will hate stocks and think you're crazy for wanting to buy them.
Bonds will continue to tell the much more important story. As mentioned above, the market is struggling between the question of whether or not the Fed can control inflation without a recession. 10-year yields have stabilized just below 3.5%. A move lower at the same time stocks go lower would be a clear sign big investors are getting worried about a recession.
Finally, back to the Santa Claus rally -— while we do not use "seasonal" factors in our investing decisions (because the bad trades can be really bad) our data shows the true Santa Claus rally historically starts this week (about 5 trading days before Christmas) and continues through the first full trading week of the New Year. This means that we could still see Santa emerge to bring investors some higher (but likely temporary) returns.
We always caution people to be careful listening to the financial media, but this time of year it is especially important. Nobody can give you financial or investing advice on TV, social media, the internet, or a blog (including this one). What matters is where the investments fit into the financial plan, cash flow strategy, risk/return objectives, and overall investment personality. If you don't have a financial plan let us know and we can point you in the right direction.
The purpose of this blog is to help our audience see through the noise to focus on what is truly moving the market.


