
The S&P 500 has risen 20% off the lows from last October, leading the financial media to declare a "new bull market". I cringed when the media declared a bear market simply because the market dropped 20% from its high. When the market first crossed the 20% threshold on the downside we saw a rush of individual investor selling.
I am now shaking my head at how misleading these headlines are and the damage they will do to the average investor. We are likely to see these same individuals who panic sold at the 20% down threshold, believe the coast is clear to move their money back to the stock market.
This is NOT a healthy market! The S&P 500 is up an impressive 12% this year (including dividends). However, 48% of the stocks in the index are NEGATIVE for the year. The average return per S&P 500 component is under 4%, but that is skewed by some huge returns. Check out the top 5 stocks in the S&P so far this year:
- Nividia +165%
- Meta (Facebook) +120%
- Tesla +98%
- Advanced Micro (AMD) +92%
- Royal Caribbean +84%
The median return for each component is less than 1%!
This chart highlights the contribution to the 12% returns.
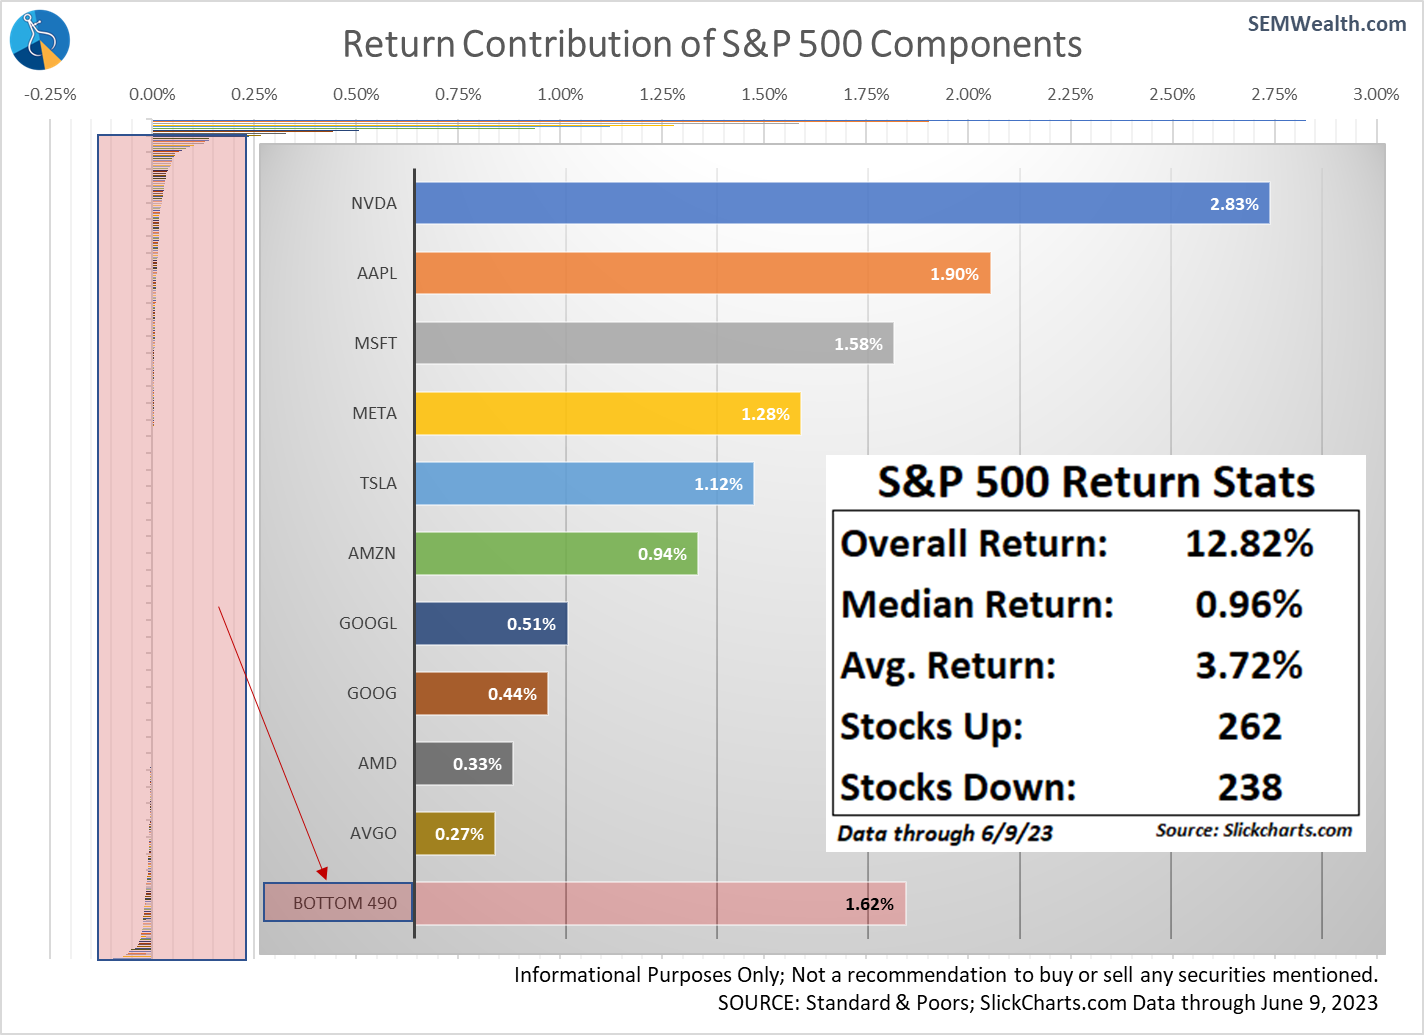
This is NOT a healthy market. Investors are being punished by having a diversified portfolio. The top 5 stocks in the S&P comprise 25% of the overall index.
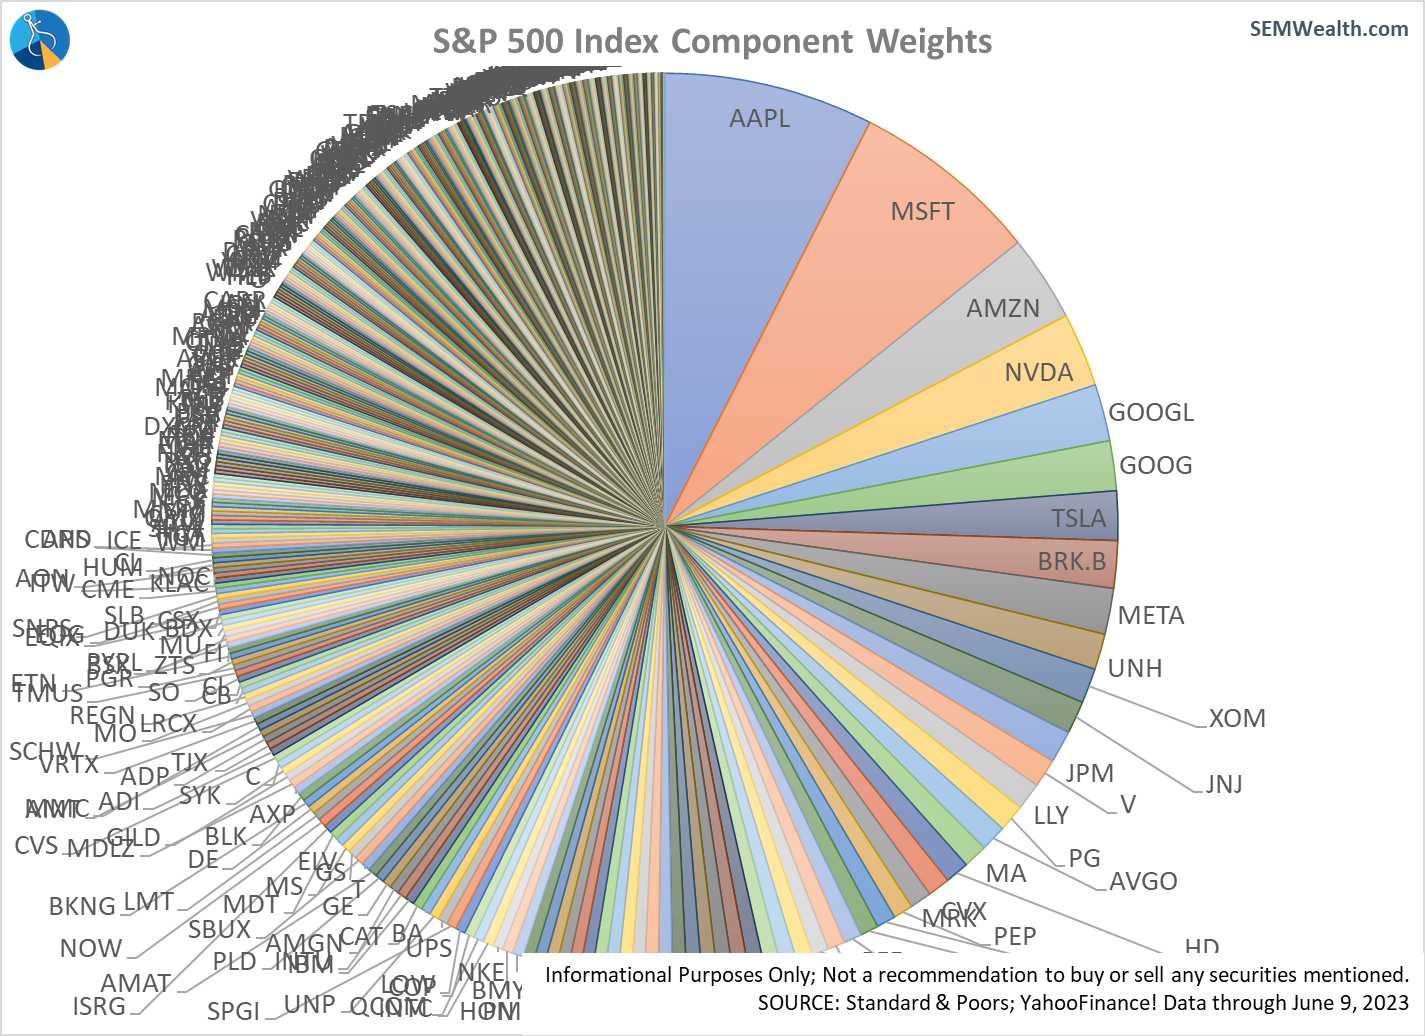
Apple & Microsoft represent 13% of the index, breaking the February 2000 record for the largest weighting of the top two stocks. We know how that ended.
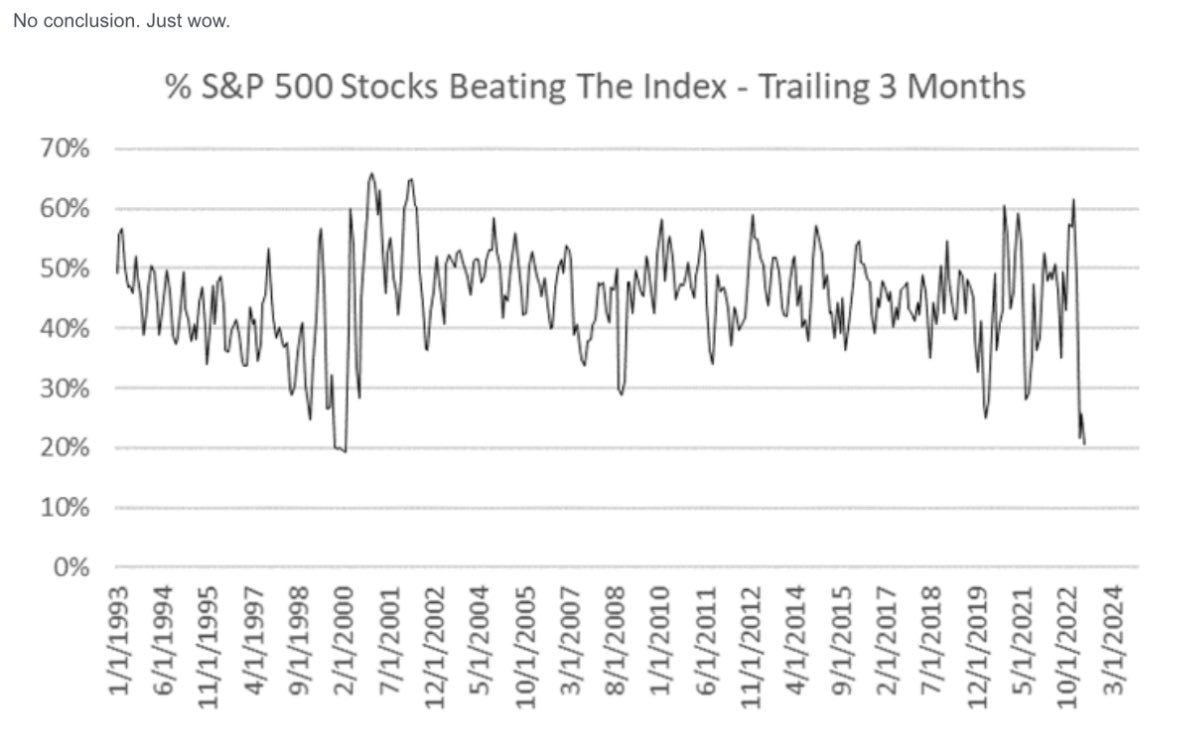
Speaking of 2000, I saw this on Twitter. Note the other times the S&P 500 was this narrow– February 2000 was the only other time this many stocks were TRAILING the 'market'. Note the times just 30% of the stocks in the S&P 500 were trailing the index— all came just before a big pullback for the indes. Maybe this time will be different. 😎
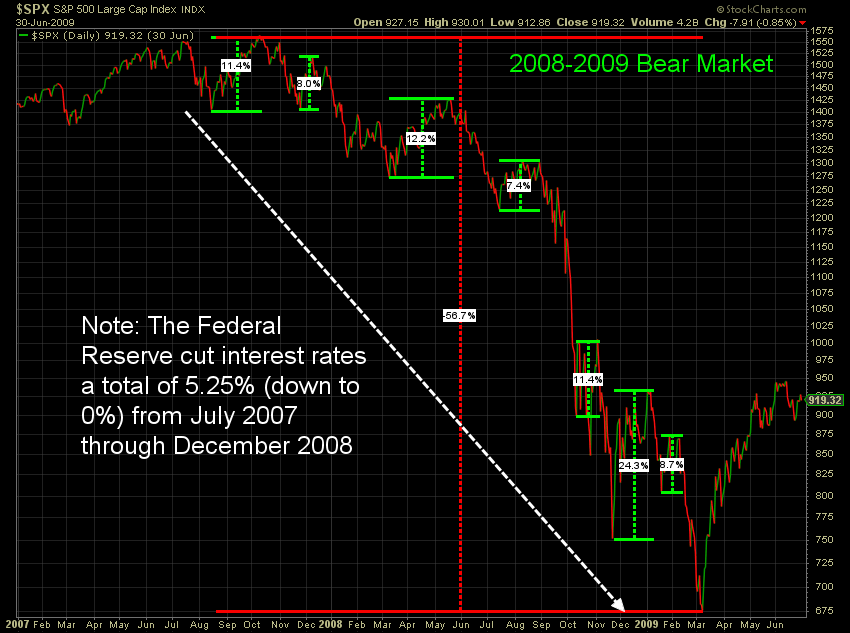
We also know that the most fierce rallies tend to occur during a bear market. We highlighted this several times last year:
The 2008-2009 has a "bull market" inside the bear (using the 20% criteria). After that run the market lost 30% before the actual bottom was put in.
The 2000-2002 bear market saw 3 "bull markets" (using the +20% criteria) before the bear market was truly over:
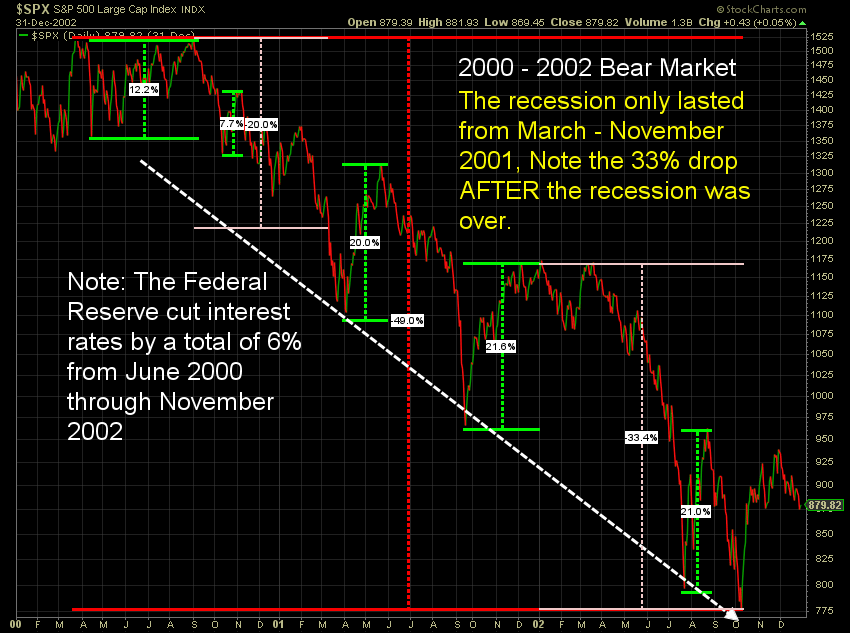
The economic data says the economy is slowing rapidly. Just because the Fed might not raise interest rates does not mean the economy can magically turn around. In fact, the Fed slashed rates ahead of the last three recessions and we still had a recession (and a bad bear market). We discussed our economic model last week:
In times like this, patience is key. We are quite happy to see gains in our accounts, but we also know based on history, data, and our 30+ years of experience, the worst is most likely not over. Stocks are significantly overvalued. Earnings are likely to come in much lower than current expectations. Bond yields are elevated.
Patience is the key.
How much further can it go?
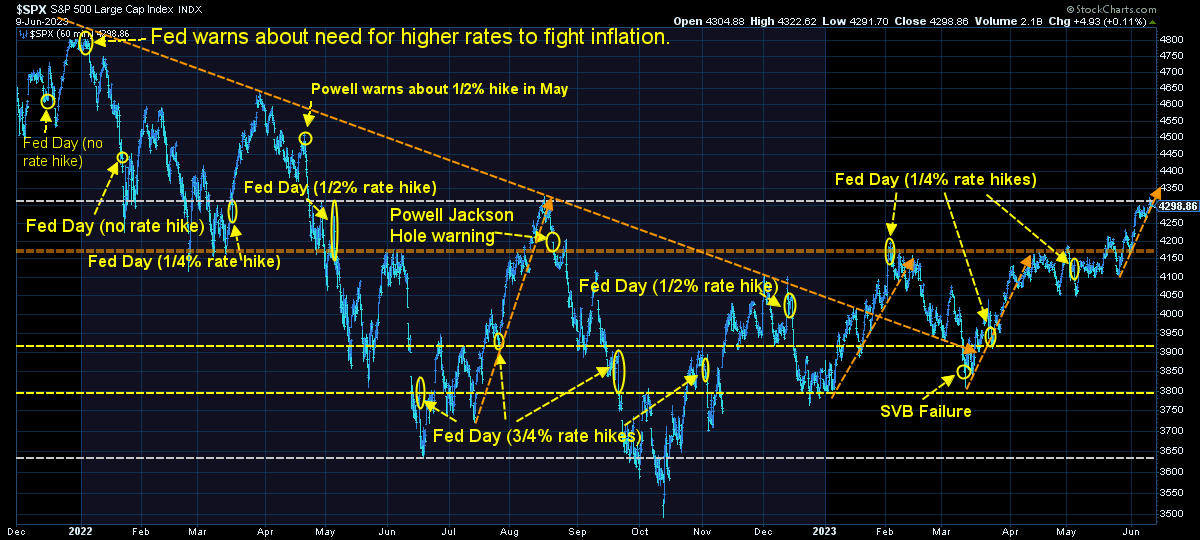
The rally last week pushed the market right to the edge of some fairly heavy "resistance" around 4325. Notice the past steep rallies ended without any real news events. The market is banking on the Fed not only "pausing" their interest rate hikes, but also giving a clear indication they are "done". We will see.
The S&P 500 is now trading at 25x trailing earnings and 20x expected 2023 earnings. It's hard to argue stocks are attractive.
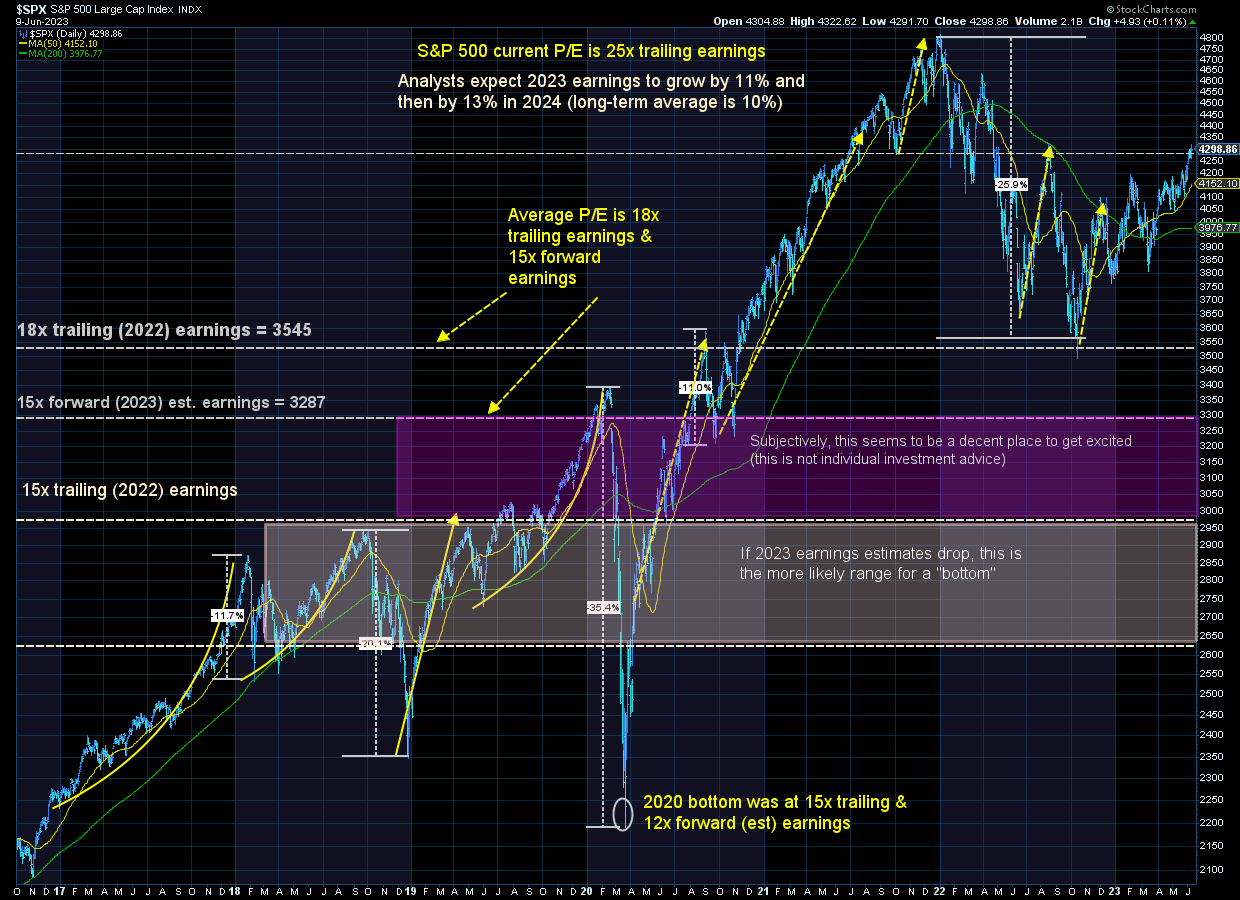
What's even more astounding is the fact earnings estimates have come down a bit during the most recent rally yet stocks keep marching higher.
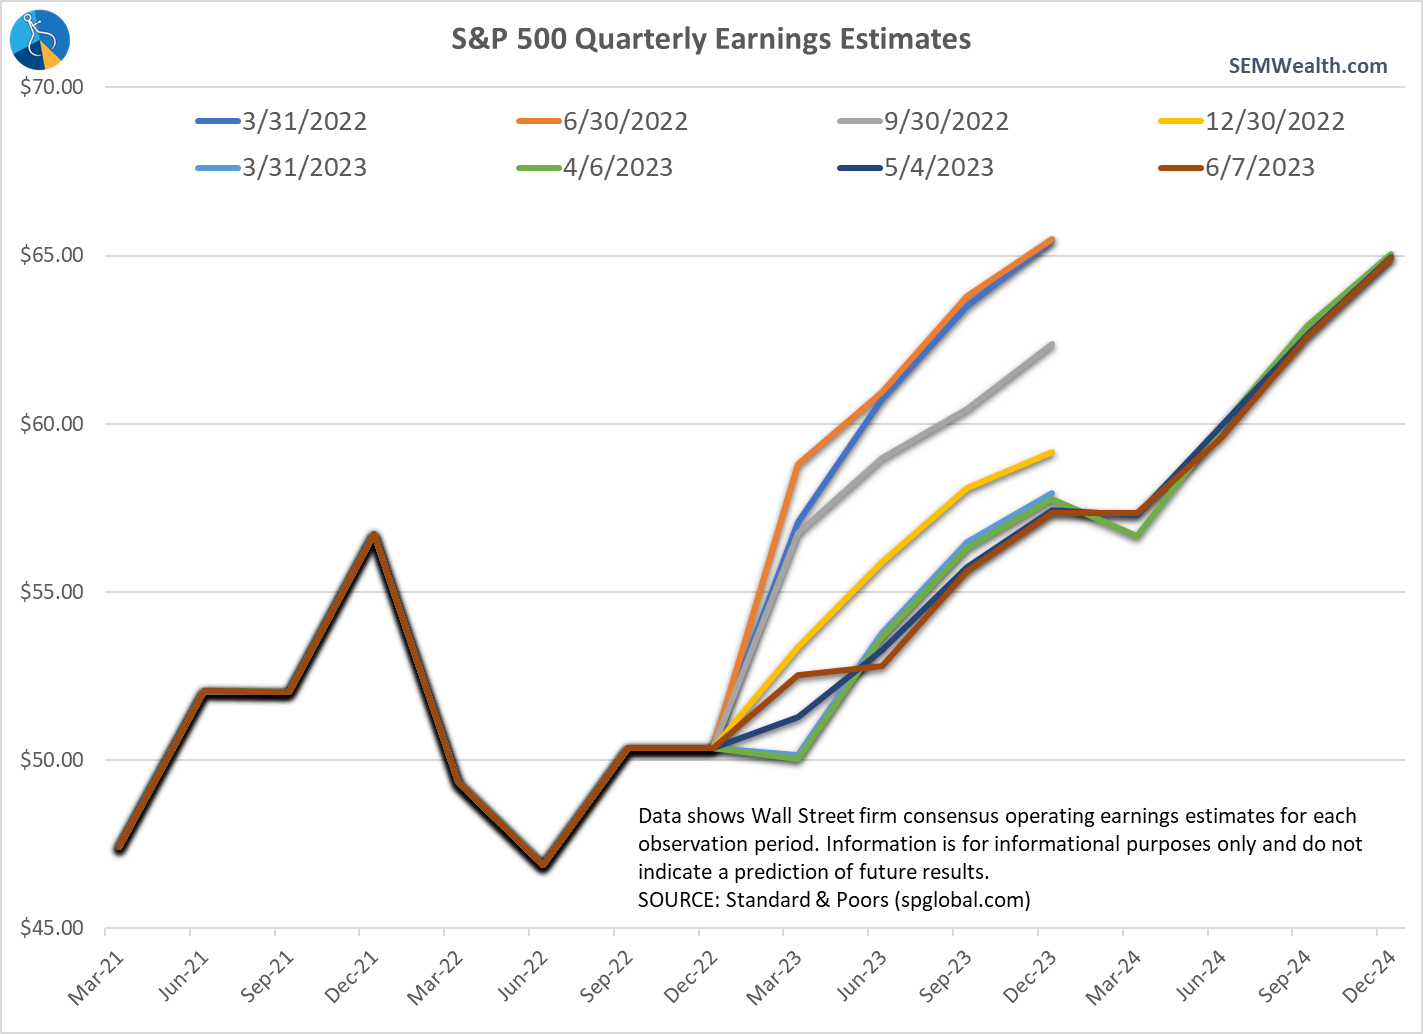
Even more fascinating, estimates for 2024 earnings are ALMOST back to the 2023 annual estimates that were in place a year ago. Animal spirits can prevail for longer than we believe is rational, but eventually the fundamentals and reality catch-up to stocks. We will happily take this rally for as long as it lasts, but it's hard to be excited with valuations this high and estimates not matching our economic model's pessimistic outlook.
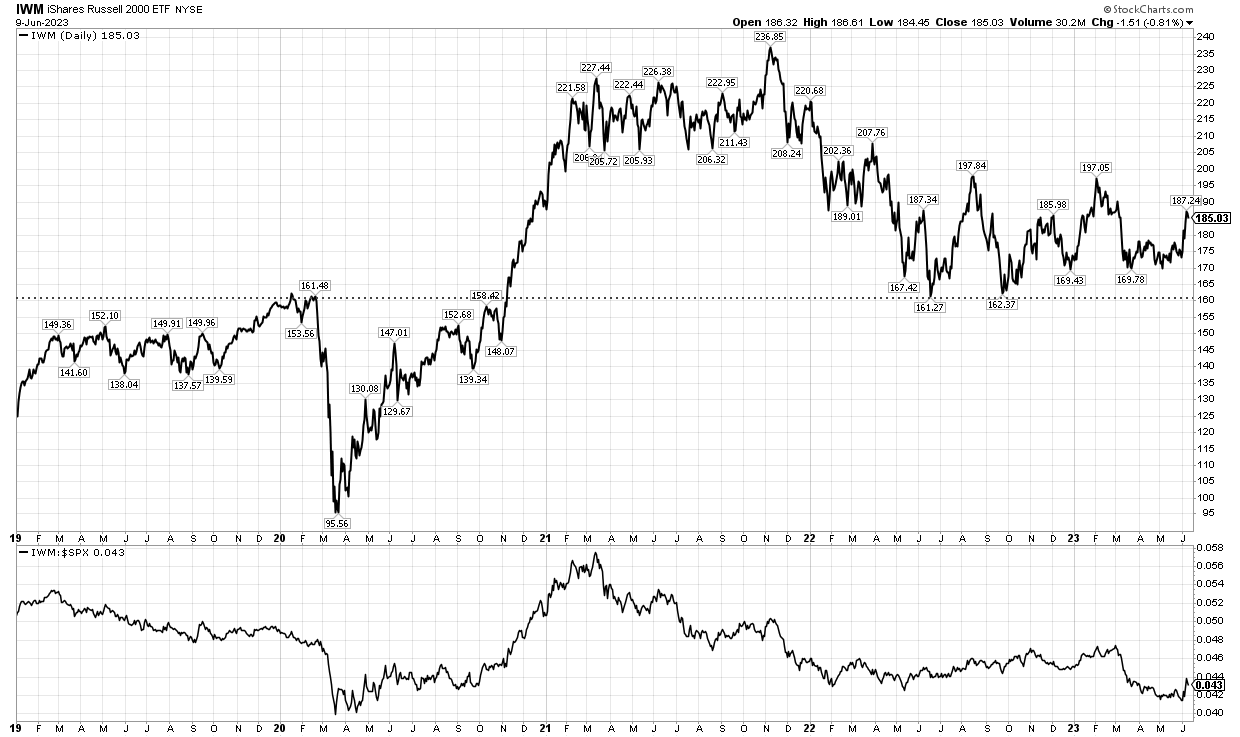
Small cap stocks had a brief bounce earlier in the week last week, but were again down the last few days as the S&P 500 rallied. This is not a sign of a healthy environment.
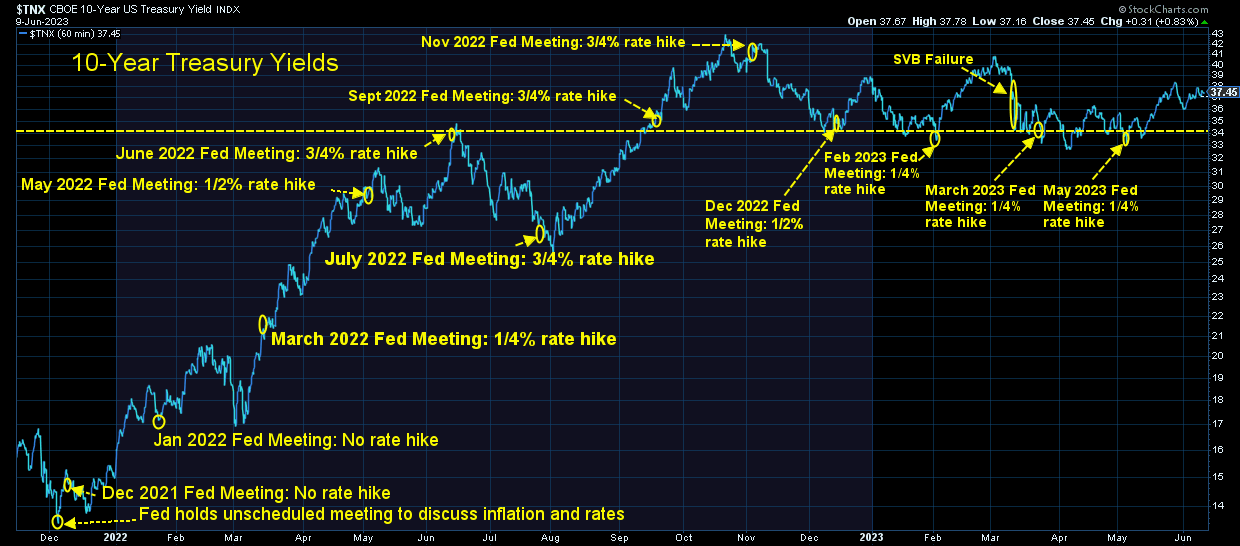
Bond yields stabilized a bit last week, but remain elevated.
I don't know of a way to quantify how much research and market commentary I read every week. While I don't read all of them, I receive 50-75 market commentaries during a middle of the week day and over 120 over the weekend and on Mondays. I filter most of them and have some "must reads". Those reports have gotten to that category in my inbox due to a combination of their long-term track record, use of DATA, ability to shift directions if the market dictates (including admitting when they are wrong), and reporting that does more than rehashing what the mainstream media is already telling us. One of those is the "Sevens Report". I read this report every morning. This morning I thought the closing paragraph said exactly what I'm thinking:
However, my experience through 2000-2003 and 2007-2008 continues to make me nervous. Investors operate in days, weeks and months. Markets and economies operate in quarters and years. In both ’00 and ’07, warnings of a looming economic slowdown were wrong for over a year, with those risks all but dismissed by the time the slowdowns actually showed up. I hope this time is different. I hope we do get Goldilocks and we’re talking about new highs in the S&P 500 by year-end. But the reality of 1) High rates for longer, 2) A slowing economy, 3) Pressure on corporate profits, 4) Contracting lending and 5) Slowly rising unemployment can’t be totally ignored, either. So, while we enjoy this resilient market, please keep in mind that under the surface, things aren’t quite as good as the AAII Sentiment Index would imply.
SEM Market Positioning
While those things above are certainly on our radar, we remain heavily invested. There were no changes (again) last week in any of our models. We remain mostly invested in high yield bonds in Tactical Bond, Income Allocator, and Cornerstone Bond. We remain "bearish" in the Dynamic models (reduced risk exposure based on our economic model), and right in between minimum and maximum exposure in our 'strategic' models.
Our high yield model, which two weeks ago was close to a "sell" appears to be back in an uptrend. The other "trend" indicator which determines the overall asset allocation in our AmeriGuard and Cornerstone models will likely go to a buy if we have a push through the 4325 level with any sort of volume this week.
This chart summarizes where we are as we enter the week:
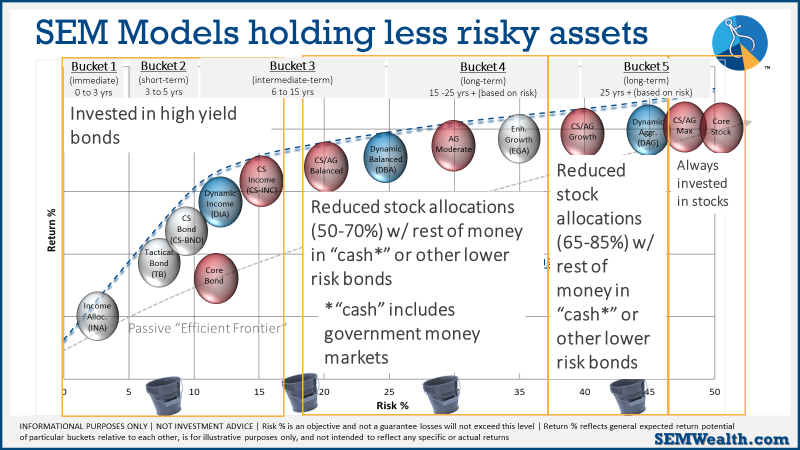
As always, our models will change if the environment changes. For now, calculated, short-term risks are acceptable with the knowledge things could change quickly.
No matter what happens, our models are designed to monitor the overall TRENDS. If Wall Street gets concerned, they will tell their largest clients and we will see trends change in the market. Regardless of the reason, we only care about where the money is flowing (both in and out).
That said, we will be watching more closely than usual the underlying holdings in our funds to make sure they are not taking on abnormal risks. We will keep you posted if anything changes in our positions.
We are already in the heat of the election and it's only going to get more heated. With that I will continue to close with my primary piece of advice during times like this:
Do not let your political beliefs influence your investment decisions. The markets (and economy) do not always react the way you think they will based on the ideological talking points showing up in your media feeds.


