
Human nature doesn't change. We all have our own natural biases which we use to make difficult, if not impossible decisions. We've spent several decades helping investors and advisors understand ways to overcome these biases to avoid doing damage to their long-term financial success.
The best way to overcome our biases is to use DATA and look back at history. Over the long-run, the stock market will reflect the underlying output of the economy. In fact, the long-term equation for stock market growth is:
GDP + Inflation + Dividend Yield = Market Return
Using long-term data the equation would look like this:
3.1% (GDP) + 3.3% (Inflation) + 3.6% Dividends = 10% Market Return
Regardless of the look-back period, the return of stocks has been around 10%. That's going back to 2000, 1990, 1980, 1970.....all the way back to 1926.
However, whenever the stock market generates returns well above the long-term average we end up going through a sharp market correction where the returns are well below average. Using the market growth equation with today's inputs we should expect below average returns:
2% (GDP) + 2% (Inflation) + 1.5% Dividends = 5.5% Market Return
In other words, using the fundamental equation for stock market returns which has worked for nearly 100 years (which included at least 5 "new eras") we should expect returns to be 45% below average.
Another thing which has worked if applied correctly is the old axiom:
Buy Low / Sell High
The trick, of course is how you define "low" and "high". There are various metrics out there, the most common is the Price to Earnings (P/E) ratio. We use that one a lot because it is the most popular. However, because earnings tend to fluctuate a lot and they tend to not track economic performance perfectly, using the P/E ratio to predict future returns is not too useful.
Here is a plot of the starting P/E ratio (horizontal axis) and the subsequent 10-year returns (y-axis) going back to 1950. The equation at the bottom includes the R-squared number, which is essentially how well the line fits the data. The more the dots are clustered around the line the better the "fit". In this case it doesn't fit very well.
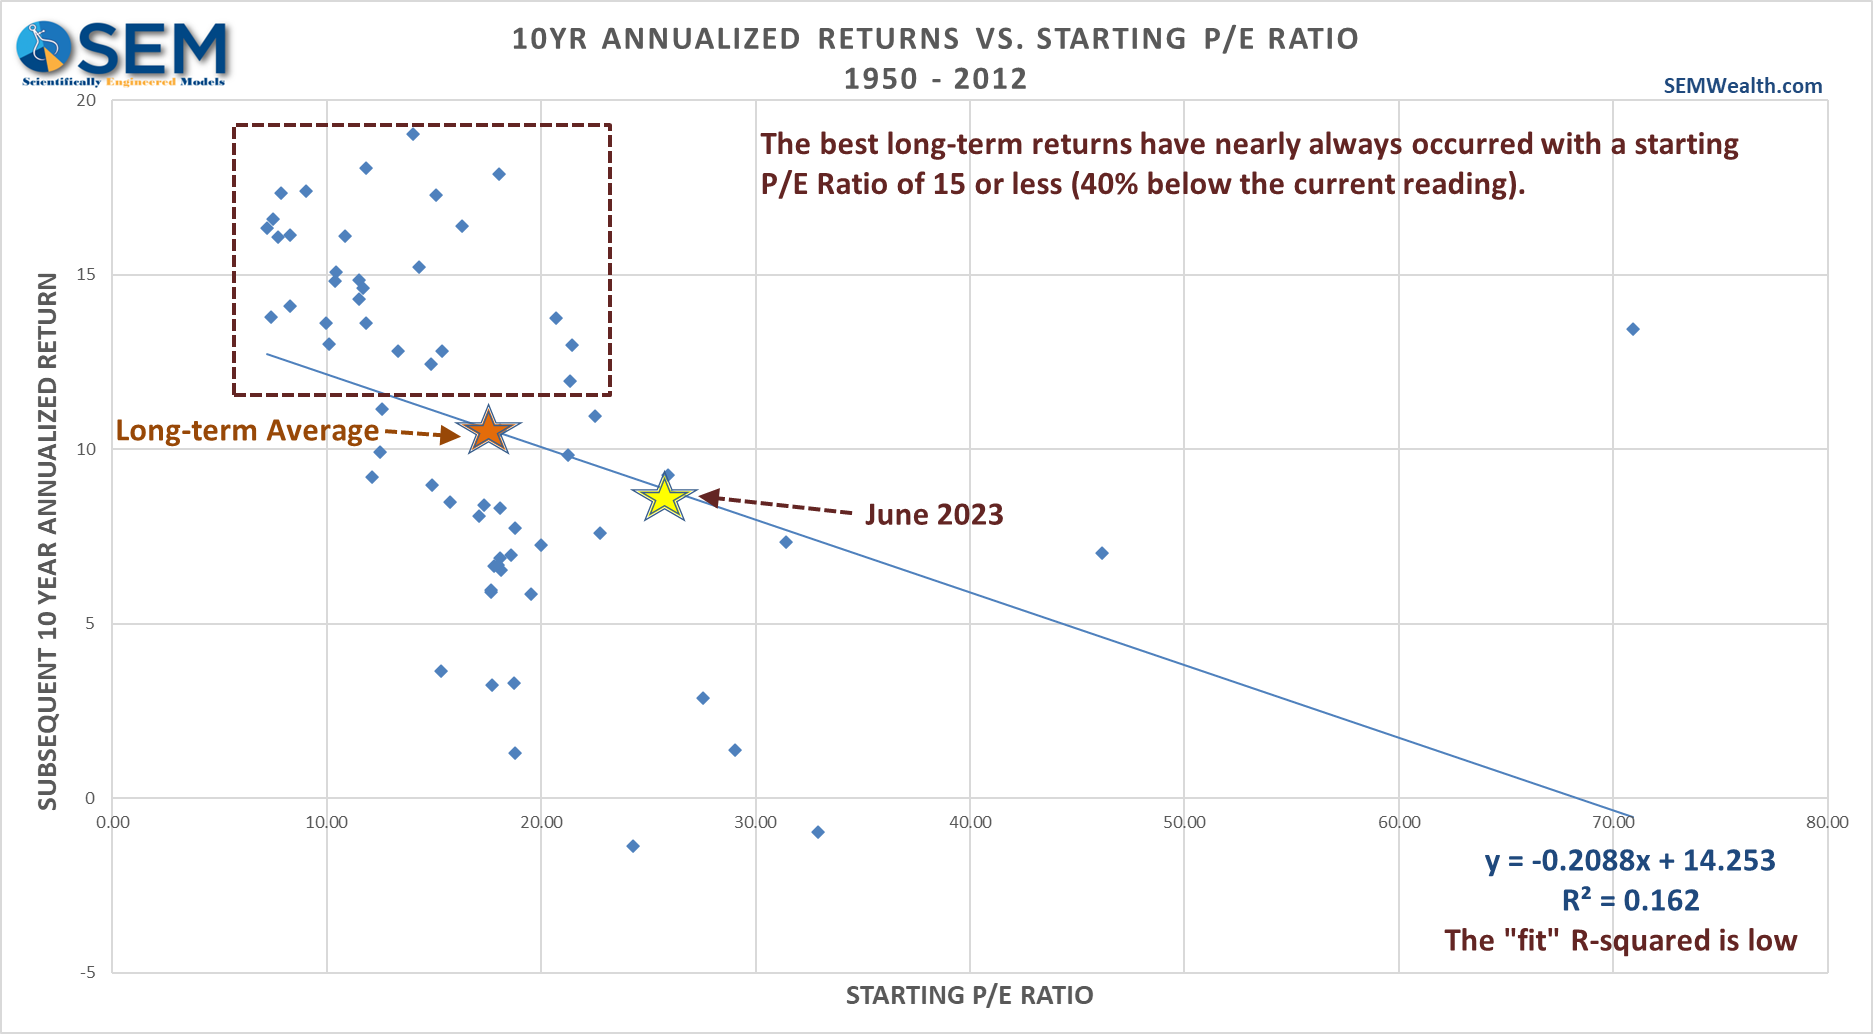
Even with this bad fit, the current P/E says we should expect below average returns.
As a former accountant and "fundamental" investment manager (one who uses company financial statements to evaluate investments), I've never liked earnings as a metric anyway. They can easily be manipulated and can change quickly. I always found a better way to look at a company is the cash flow it is generating.
Currently, the Price/Cash Flow ratio of the S&P 500 has only been higher once – at the beginning of 2022.
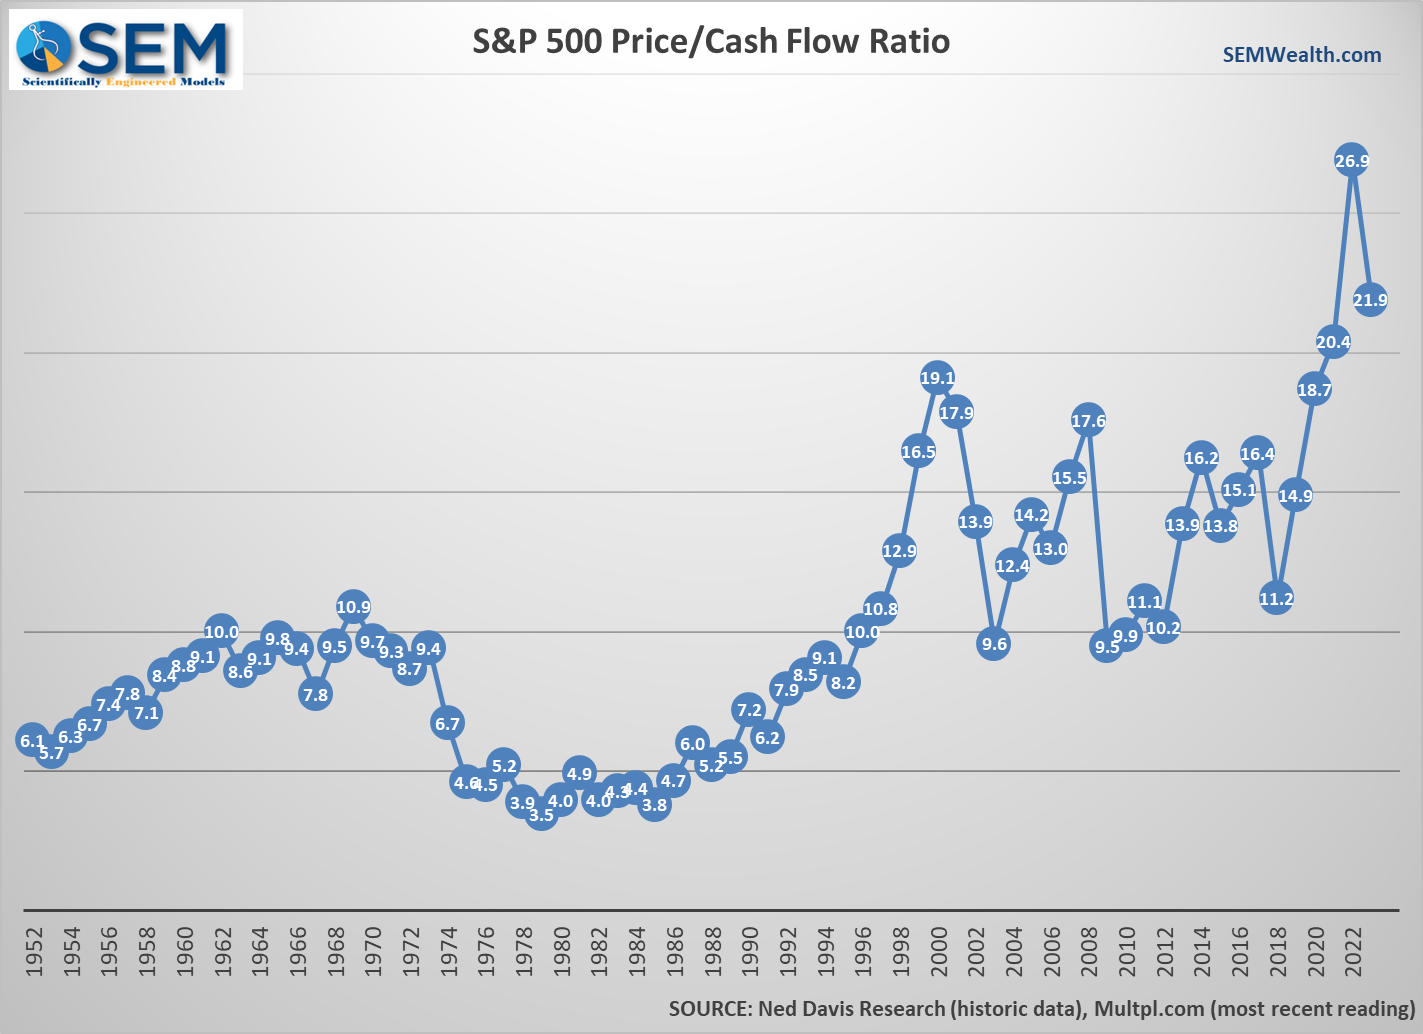
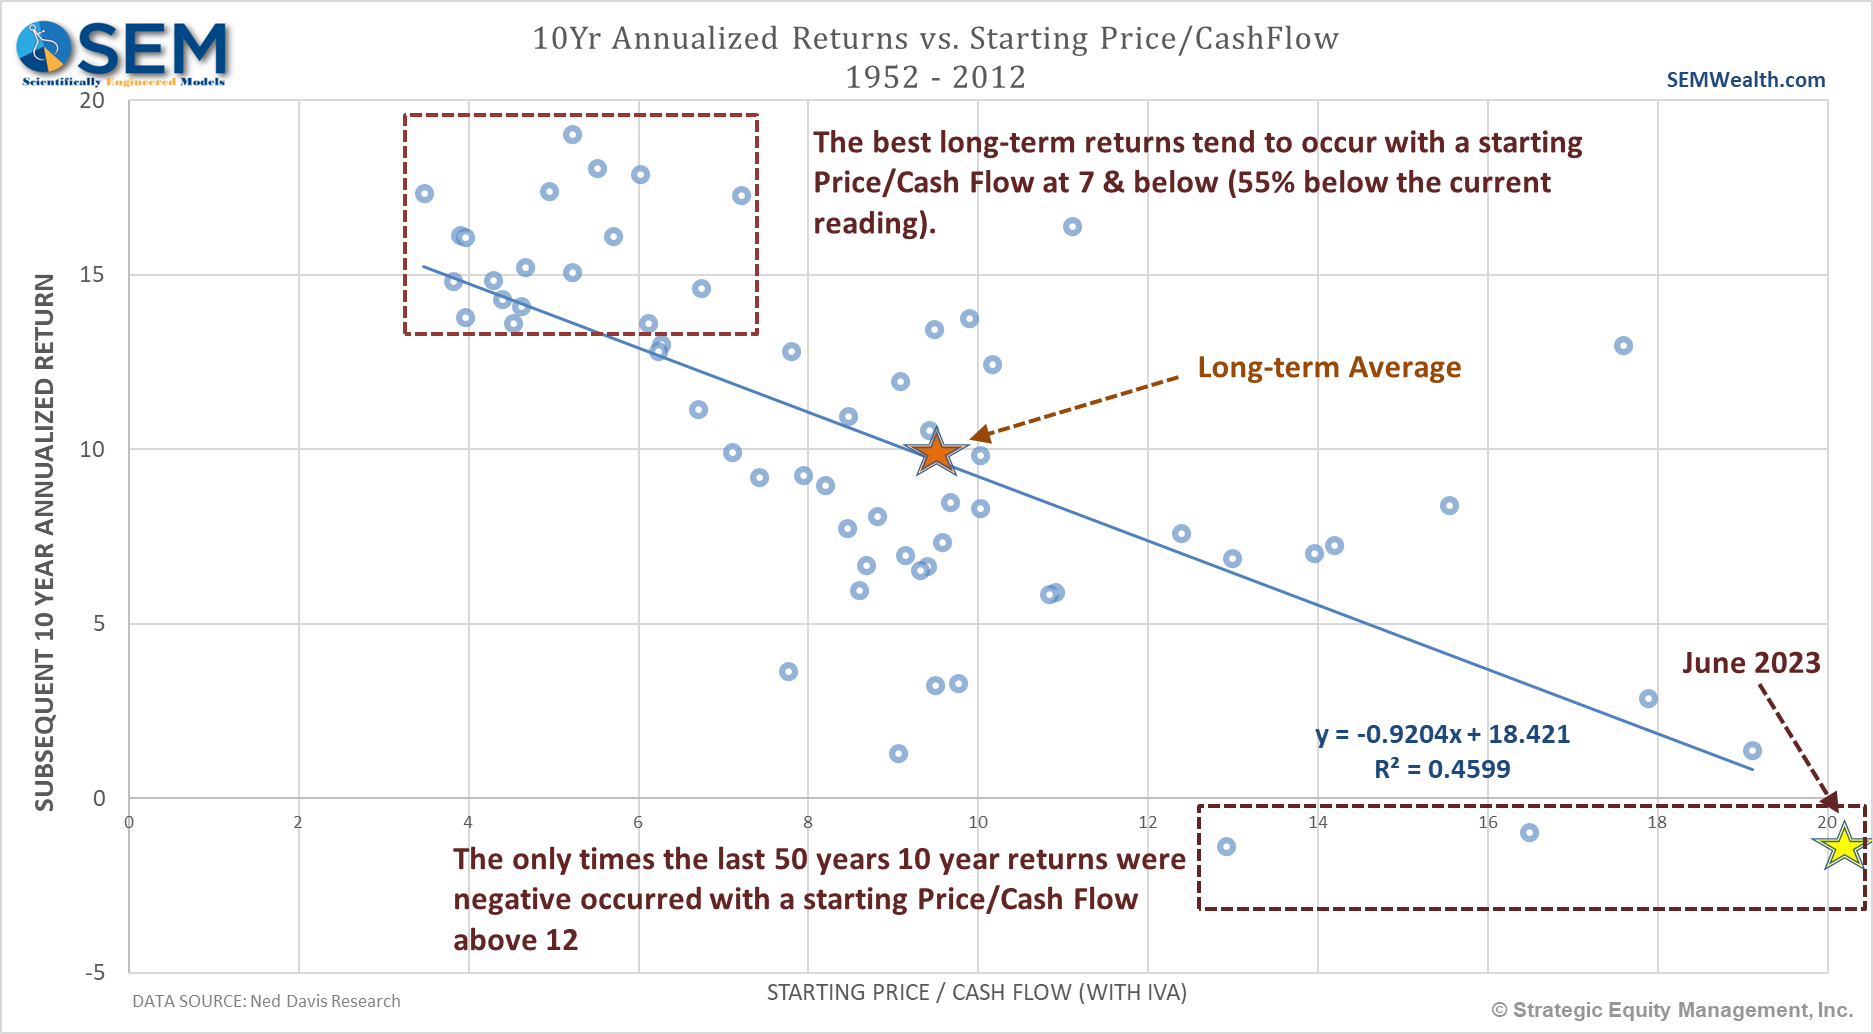
Price/Cash Flow also tends to be a much better predictor of long-term returns than the P/E ratio.
The Price/Cash Flow ratio says returns for the next 10-years should be NEGATIVE.
Nobel Prize winning economist Robert Shiller (one of the founders of behavioral finance) found a better way to value stocks by smoothing out the earnings. Essentially he takes the average earnings over the last 10 years to use as the denominator in what is now known as the Shiller P/E (or P/E10). We can see it is indeed a much better predictor of long-term returns:
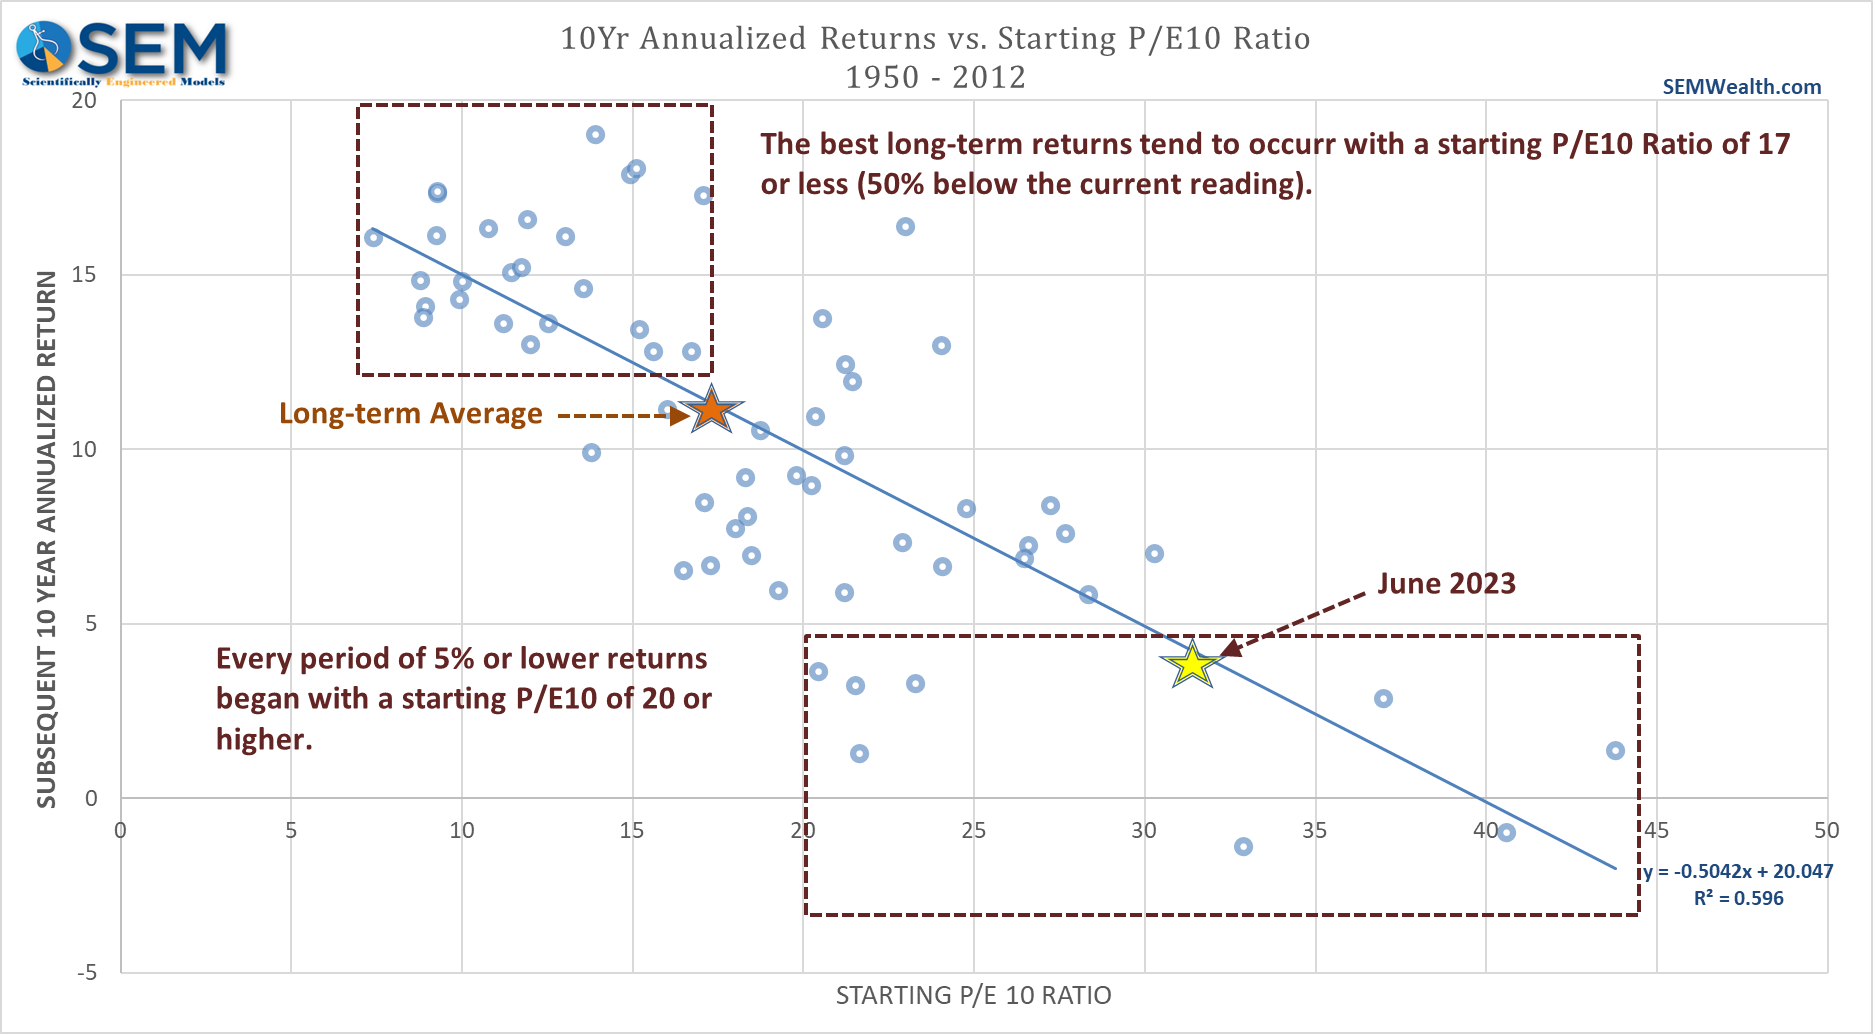
The Shiller P/E says we should expect below average returns over the next 10 years.
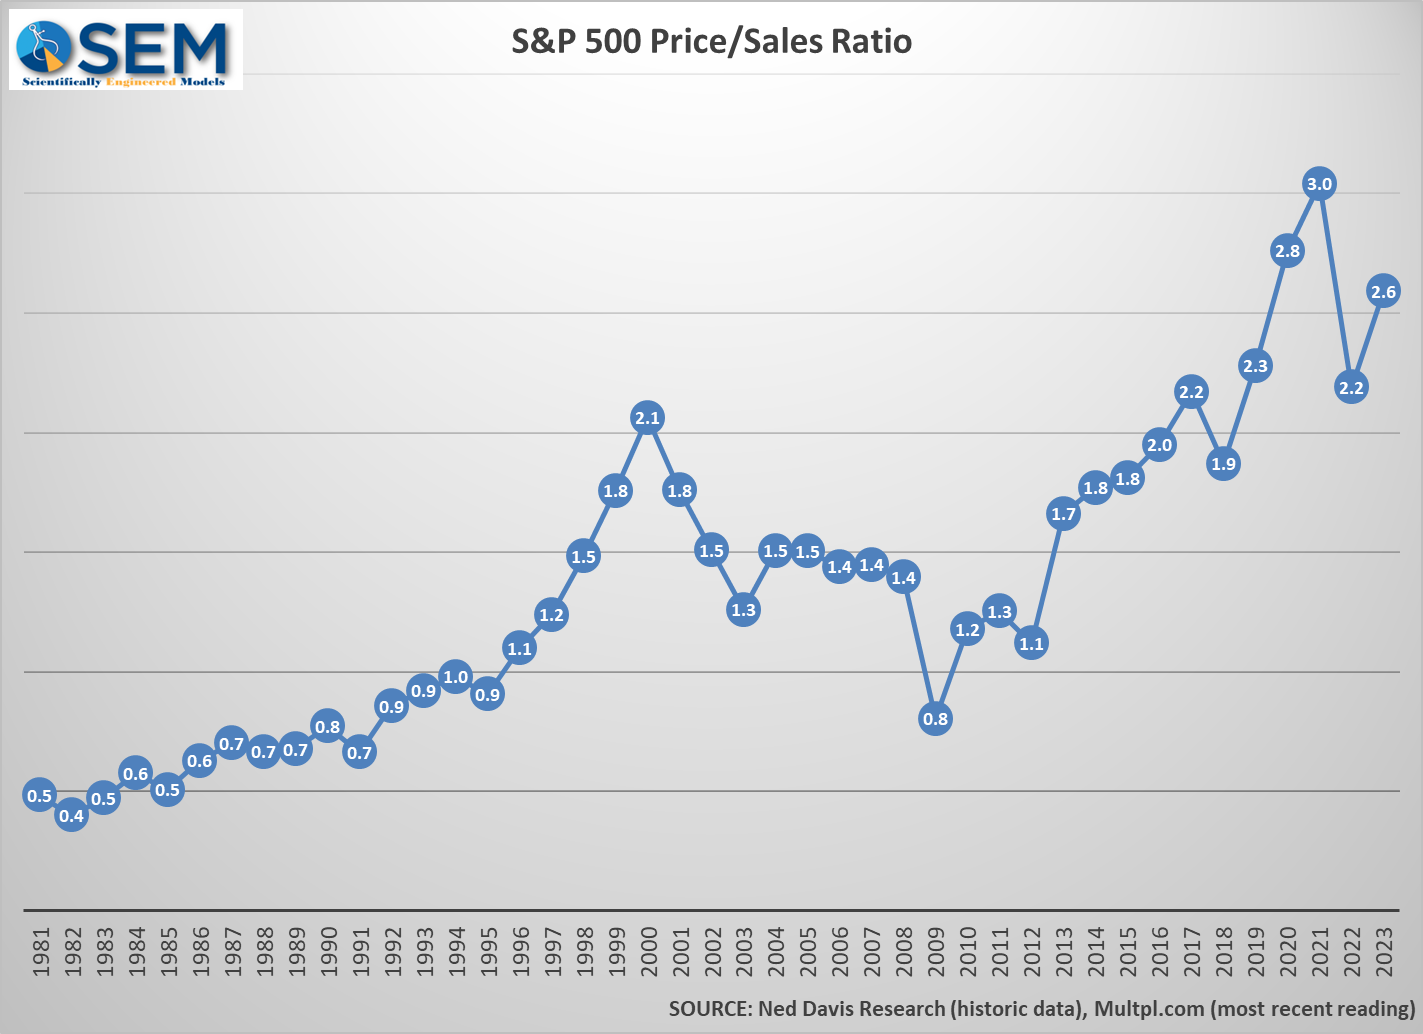
Another thing I found as an accountant and fundamental investment manager is Revenue (Sales) is often a better metric to compare companies. Many companies do not have earnings and thus cannot have a P/E (or force you to make some wild prediction about future earnings). Others use accounting tricks to goose their earnings. It's much harder to manipulate revenue over the long-term.
When we look at the S&P 500 Price/Sales ratio, we can see that it has only been higher one time – in 2021 just before the big drop in 2022. If you thought 1999 was crazy, what do you think of 2023?
The Price/Sales ratio is also a much better predictor of long-term returns.
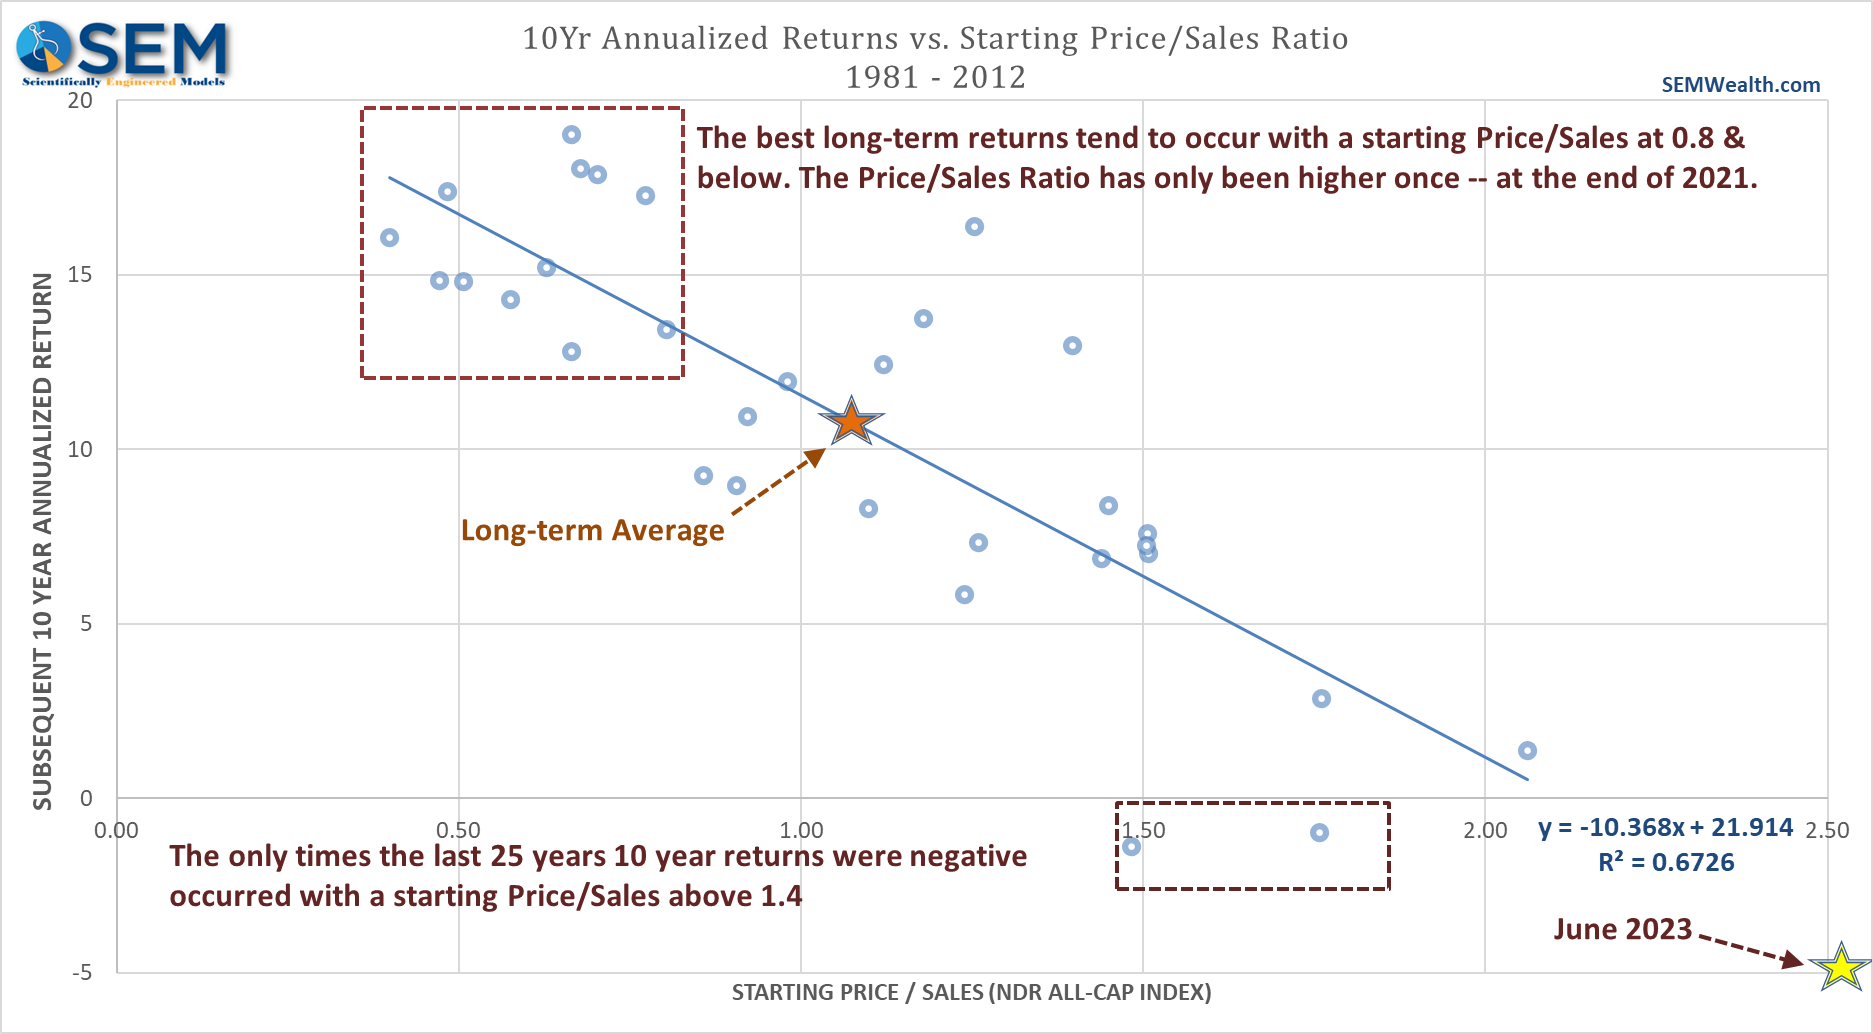
The Price/Sales ratio says we should expect NEGATIVE returns.
Finally, as a former accountant and fundamental investment manager, I studied Warren Buffett closely. His approach was very disciplined and based on numbers. In 2001 when Forbes magazine asked him the best way to measure the value of the stock market he said it is the total value of the stock market divided by the total value of the underlying economy. You see, it is mathematically impossible for the stock market of a country to have a value significantly higher than the economy it is a part of indefinitely. Therefore, when the market is valued higher than the economy your potential returns are low. Conversely, when the market is valued below the value of the economy, your potential returns are high.
As you might expect from Warren Buffett, this wasn't an opinion and was instead based on data. Here is how the Buffett indicator succeeds in predicting 10-year returns.
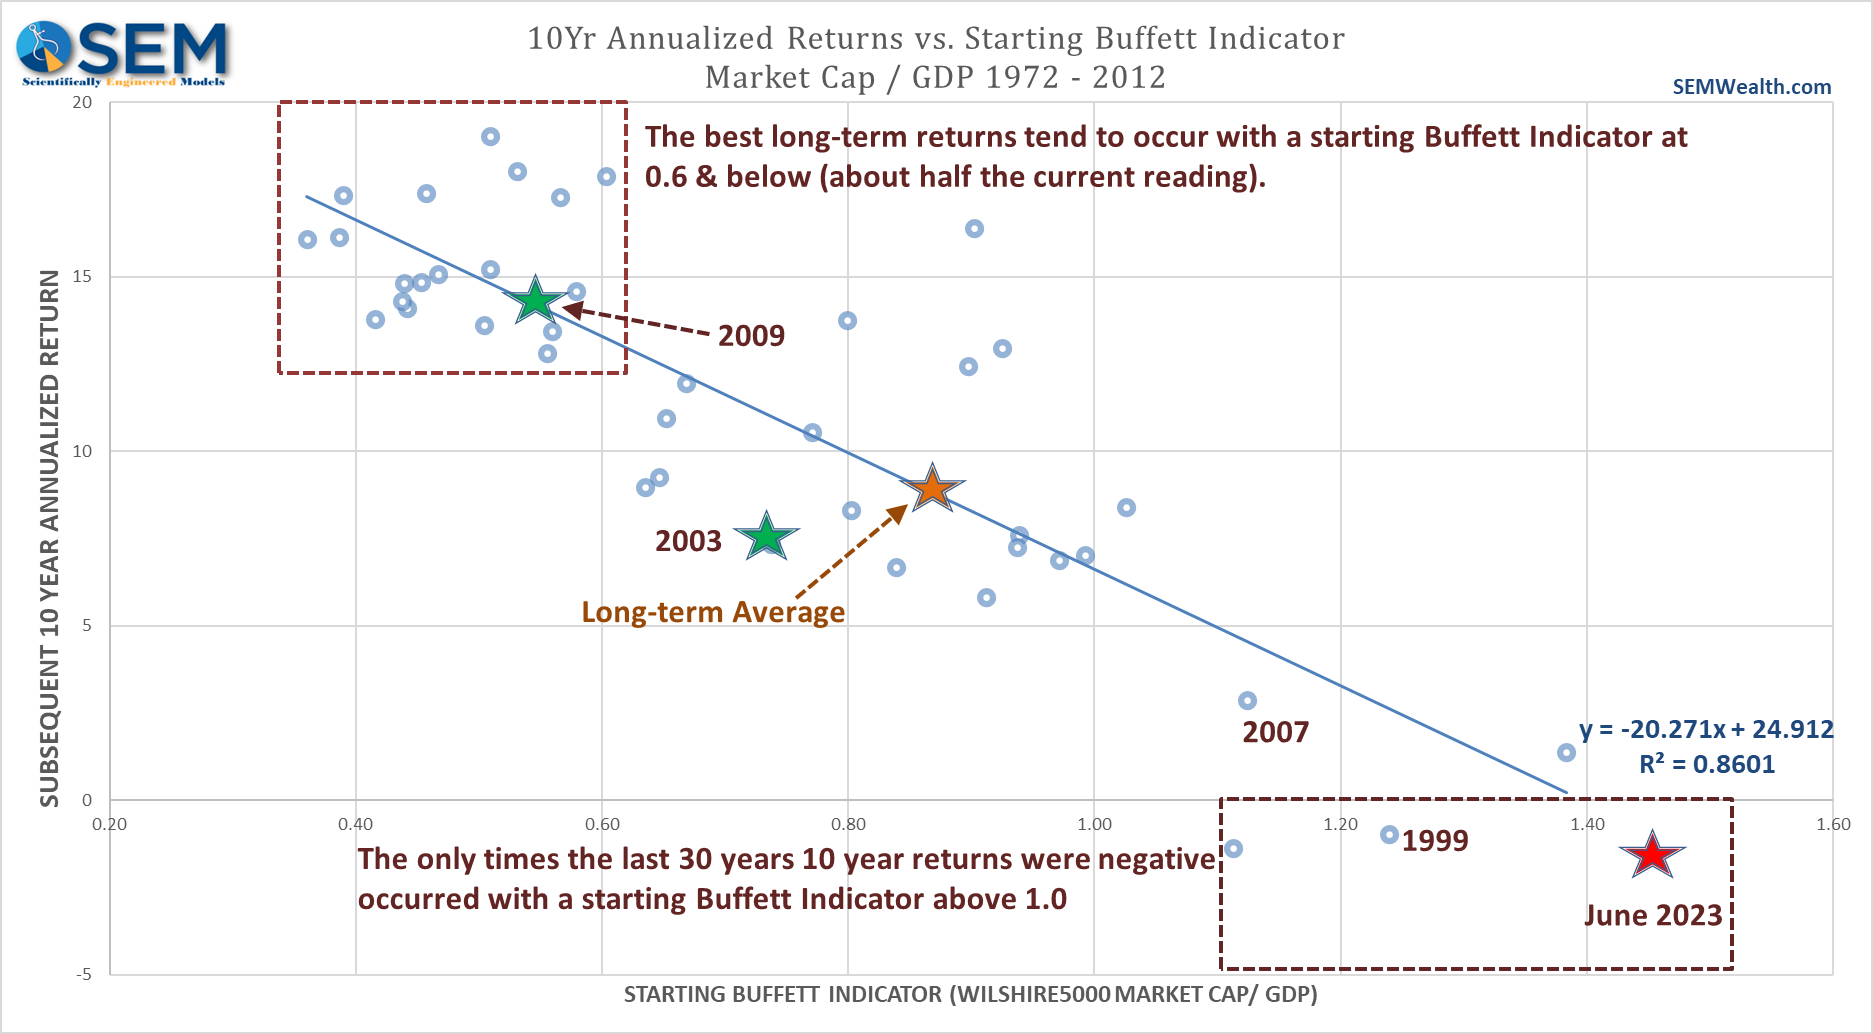
The Buffett Indicator says we should expect NEGATIVE returns for the next 10-years.
If we were to use all of the indicators above, we should EXPECT 1% returns over the next 10-years. If you excluded the P/E ratio's prediction, you'd expect -1% annualized returns over the next 10-years.
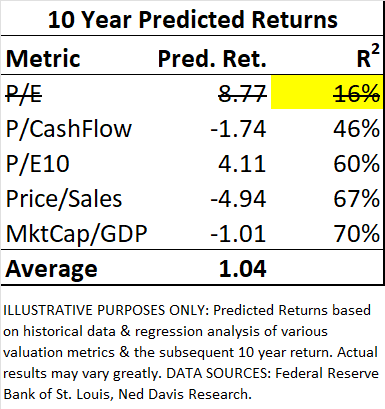
Buy Low / Sell High. It works if you follow it. Let's recap what each of these data points tells us about the expected returns for stocks over the next 10-years:
- Economic Model = below average (about half the long-term average)
- P/E Ratio = below average (about 80% of the long-term average)
- P/Cash Flow = NEGATIVE returns
- P/E10 (Shiller P/E) = below average (about 40% of the long-term average)
- P/Sales = NEGATIVE returns
- Market Cap/GDP (Buffet Indicator) = NEGATIVE returns
These predictions do not mean a steady drag each and every year. Historically when the market has been this far above 'normal' we see a very sharp drop of 35-55% that last 18-24 months followed by a move over the next 8 or 9 years to recover those losses.
What that means for investors is to BE READY for the drop. If you're taking too much risk in your account just because you wanted higher returns, look to reduce risk now. Have money on the sidelines waiting to take advantage of much lower valuations. This is not easy to do without a pre-built model and plan, so if you don't have one, get one.
This is exactly what SEM is doing. Patience is a key. DATA and history tells us we will get to a point where we can expect well above average returns for stocks (and bonds). We just aren't there yet.
SEM Market Positioning
While all of the things above are certainly on our radar, we remain heavily invested. The key difference between our advice to readers and our own investments is we have a quantitatively based plan to leave the party when things start to look shaky (and we take those moves without broadcasting them in the blog)
There were no changes (again) last week in any of our models. We remain mostly invested in high yield bonds in Tactical Bond, Income Allocator, and Cornerstone Bond. We remain "bearish" in the Dynamic models (reduced risk exposure based on our economic model), and right in between minimum and maximum exposure in our 'strategic' models.