A lot has been made about the losses in bonds over the past 3 years. Researchers from Bank of America obtained bond market data all the way back to 1787 and found there has never been a 3 year period with this large of a drop in Treasury Bonds. As Bloomberg pointed out, "how many bonds were trading during the War of 1812?"
Either way, it's safe to say there isn't a person alive who has witnessed these types of losses in the bond market. Even though my entire career I've warned that Treasury Bonds are not "low risk" (unless you buy them at issuance and hold until maturity), they can be extremely volatile, which can lead to large losses. These types of losses have led many investors to give up on bonds entirely and retreat to "guaranteed" vehicles such as Money Market funds/accounts, CDs, high yield savings accounts, and fixed annuities.
There's certainly nothing wrong with that. As I've said often the past few months – if an investor is sure they do not need liquidity AND their financial plan works at 3-4% annualized returns with that portion of the money, great. I say 3-4% because at some point yields will come down and when those guaranteed vehicles renew it will most likely be at lower rates.
For everyone else the question is, what do you do now?
For long-term asset allocation decisions, I'm a big believer in forward return estimate models which look at current valuation levels and how returns stacked up for investors starting at those levels. Stocks are near historically high valuation levels, which usually means low "forward" returns until valuations revert to below average valuations. The average long-term return for the stock market is 10%. Based on historic valuations, I would be surprised if stocks averaged 10% returns over the next 10 years (until we see a major correction in valuations.)
Treasury Bonds, on the other hand have averaged 5% returns over the long-term (going back to 1928). The lowest 10-year period since then was the 10-years ended in 2022 (at 0.12% ANNUALIZED returns). The previous record low was the 10-years ended in 1959 (at 0.78% ANNUALIZED returns).
The question is whether or not bonds are permanently broken or if they will 'revert' to the long-term mean return? 10-year Treasuries are currently yielding 4.6%, which means simply reinvesting dividends should get you close to that return by itself. The yield curve remains 'inverted' with 2-year Treasuries yielding 5.3%.
This is setting up an interesting potential opportunity in the bond market. The first concept we need to understand is bond prices move in the opposite direction as interest rates. The reason is simple – if I bought a 10-year Treasury Bond in let's say 2020 with a yield at 0.5% and the going yield is now 4.6%, nobody is going to want my bond unless it is deeply discounted.
The other concept we need to understand with bonds is the longer the maturity, the more sensitive the bond will be to changes in interest rates. This makes sense because the longer you have to wait to get paid back the more risk interest rates will move against you. This is called duration.
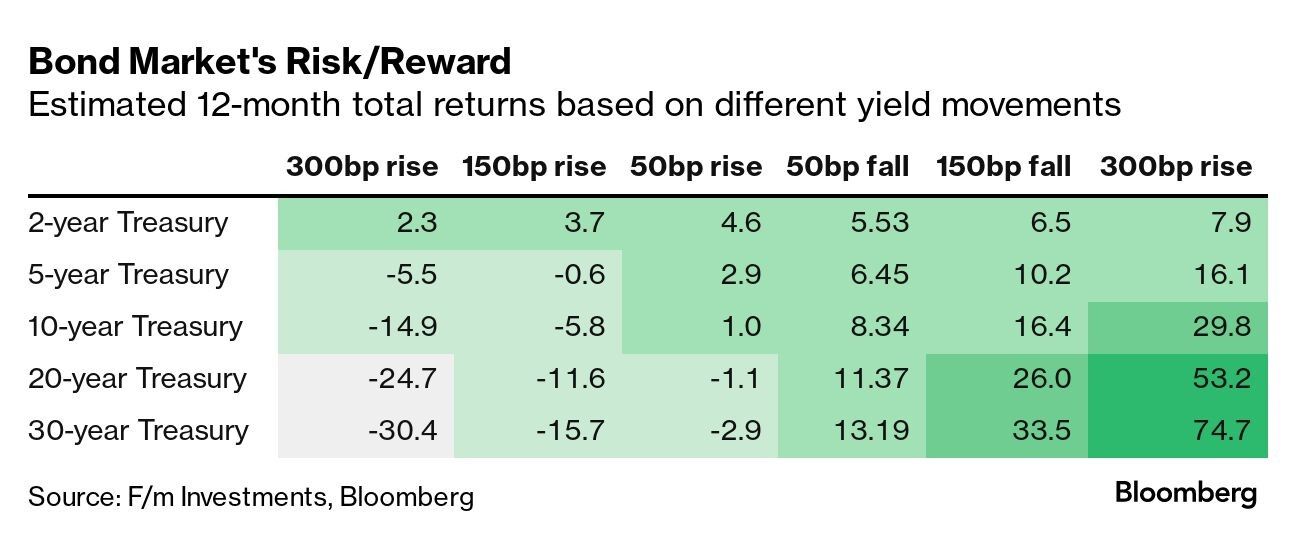
Now because yields have moved up so quickly since May (over 1.5% on the 10-year) we are in a situation where the risk-reward to owning Treasury bonds is the most attractive I've seen in my career. Bloomberg put together this table illustrating the return potential based on 1/2% changes in yields:
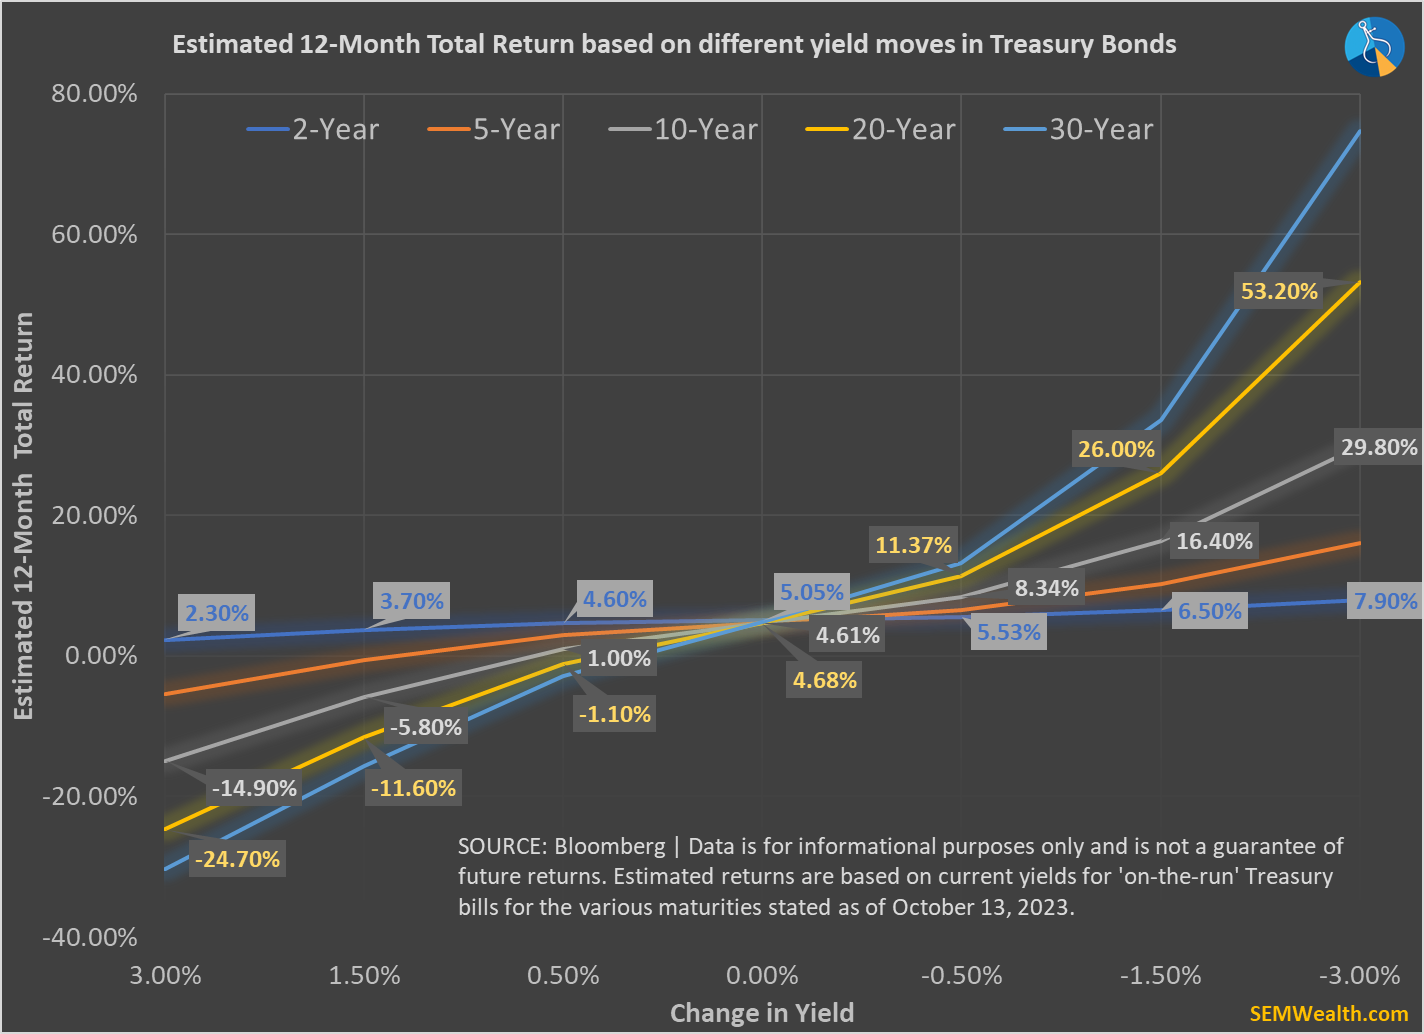
I put together this visual from the data:
This chart summarizes the potential gains and losses if rates move up or down by 3%.
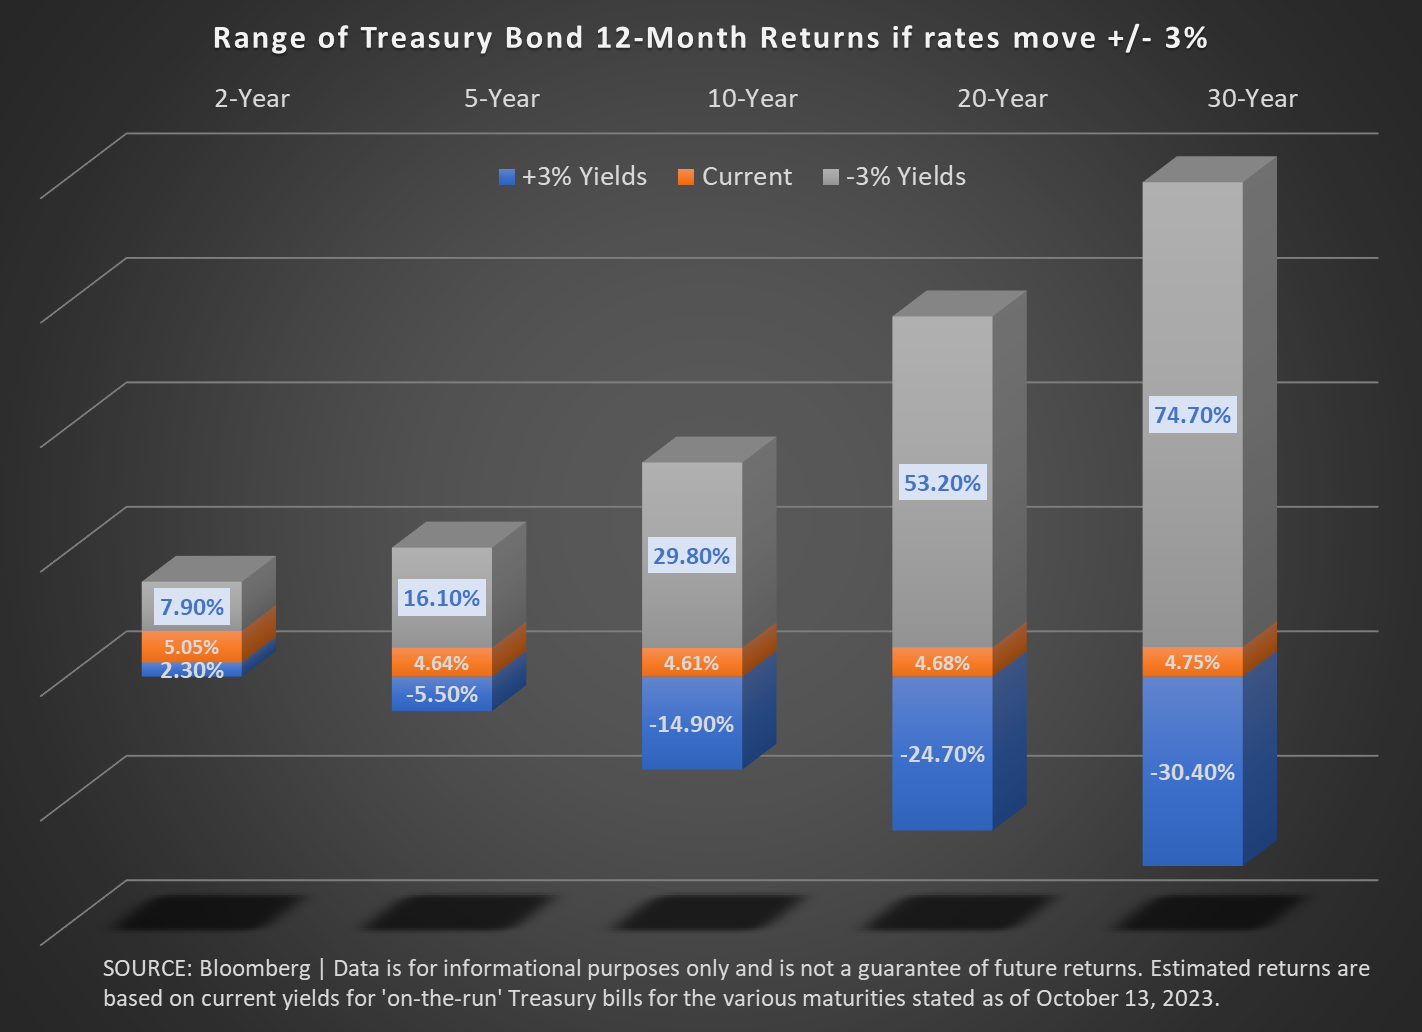
The question of course is whether or not we are more likely to see rates go up or down by 3% (and when that will happen). Are we more likely to see 1.5% again on the 10-year or 10-year bonds yielding 7.5%? I could make a case for both.
Interest rates have been forced higher after 15 years of manipulation by the Fed which created artificially low interest rates. I remember in 2010 when the Fed had pushed rates to 0%, the former 'bond king' Bill Gross said the "natural rate" for the 10-year was around 4% (it was around 1.5% at the time). His concern was sooner or later the Fed wouldn't be able to keep rates low and they would rocket back up to their natural rate.
We probably cannot unwind 15 years of Fed manipulation in a couple of years. In 2021 they were purchasing over 80% of all Treasury Bonds being issued. Now they are not only not buying, they are selling them. At the same time we are going to see higher and higher borrowing demands which could force rates higher.
On the other side of things, a recession would naturally cause inflation to slow to the point where the Fed will start to cut rates. As we've seen with the Fed under Jerome Powell they will literally write a new playbook if necessary to 'save' Wall Street. You add to the mix what I believe will be another 'crisis' from community and regional banks thanks to their commercial real estate exposure and it is easy to see the Fed launching yet another round of Quantitative Easing. Combine this with what will likely be big losses in the stock market and you'd probably see a "flight to quality" trade where institutions sell stocks and buy Treasury bonds.
It may be one of those scenarios or somewhere in between. At SEM, we aren't adjusting any of our models. We continue to test over multiple bond environments to check whether or not our systems can handle shocks in either direction. We are starting to get excited about the potential returns in fixed income whenever we get the inevitable financial shock which comes during a recession. In the meanwhile, we are quite happy with 5%+ yields on money market funds while we wait.
For those just now choosing to move to 'guaranteed' products. The upside is these are attractive returns and you're guaranteed to miss the carnage in the financial markets if things continue to get worse. However, you're also guaranteed to miss what could be a historic climb in Treasury Bond prices.
We cannot give advice on this page and especially without knowing your financial plan, cash flow strategy, and most importantly investment personality. For many people the 'guaranteed' products work well. For others they are only attractive because we've endured the 3 worst years in bonds since the founding of our country.
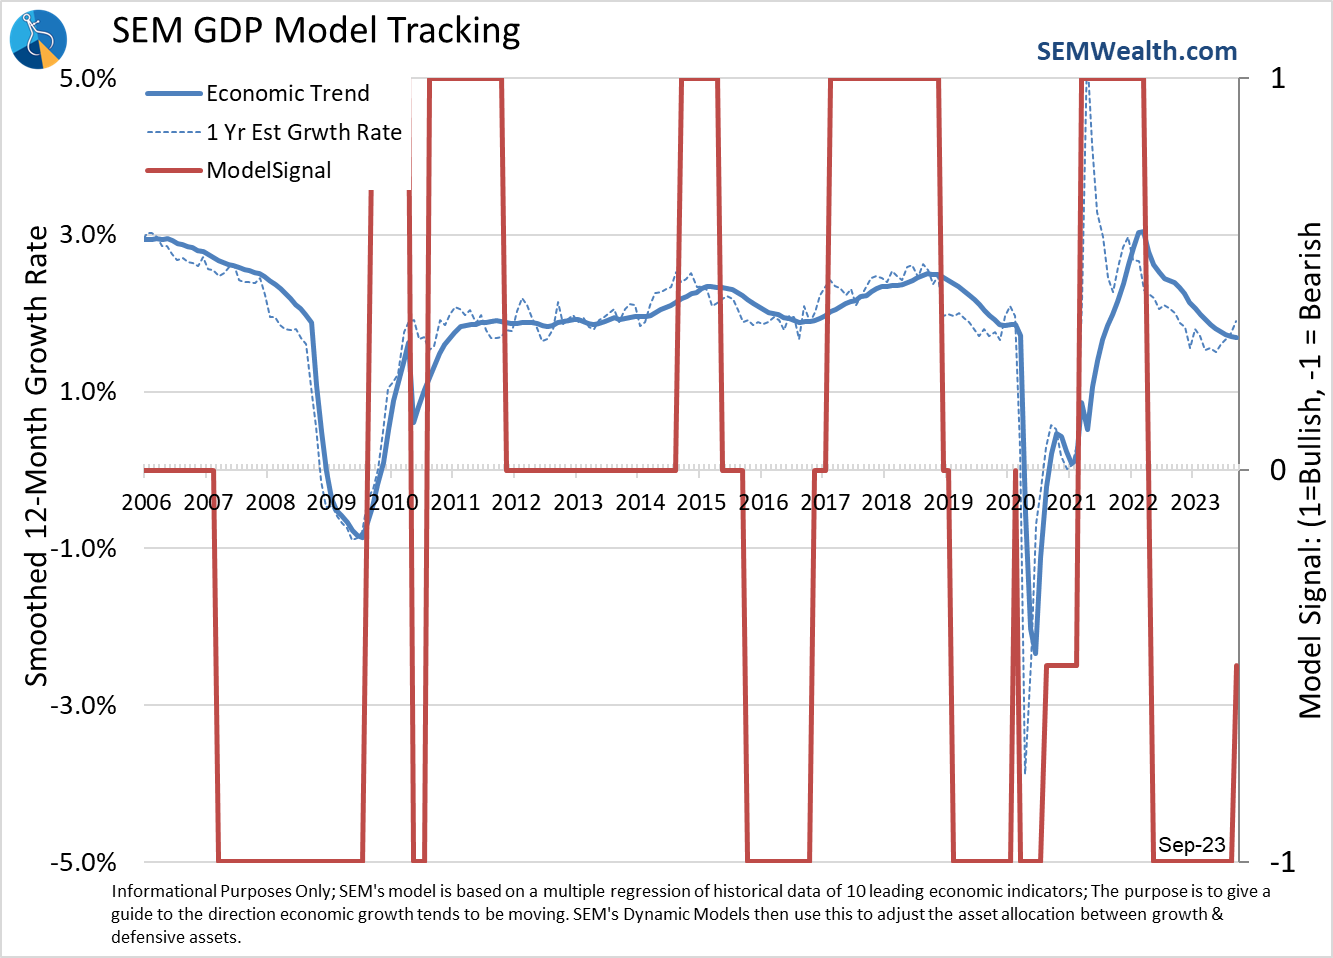
I know I promised a full economic update this week, but this bond data was too intriguing to not post it. In case you missed it, last week's blog did have a summary of our economic model along with updates on other model changes which have occurred over the past few weeks:

Market Charts
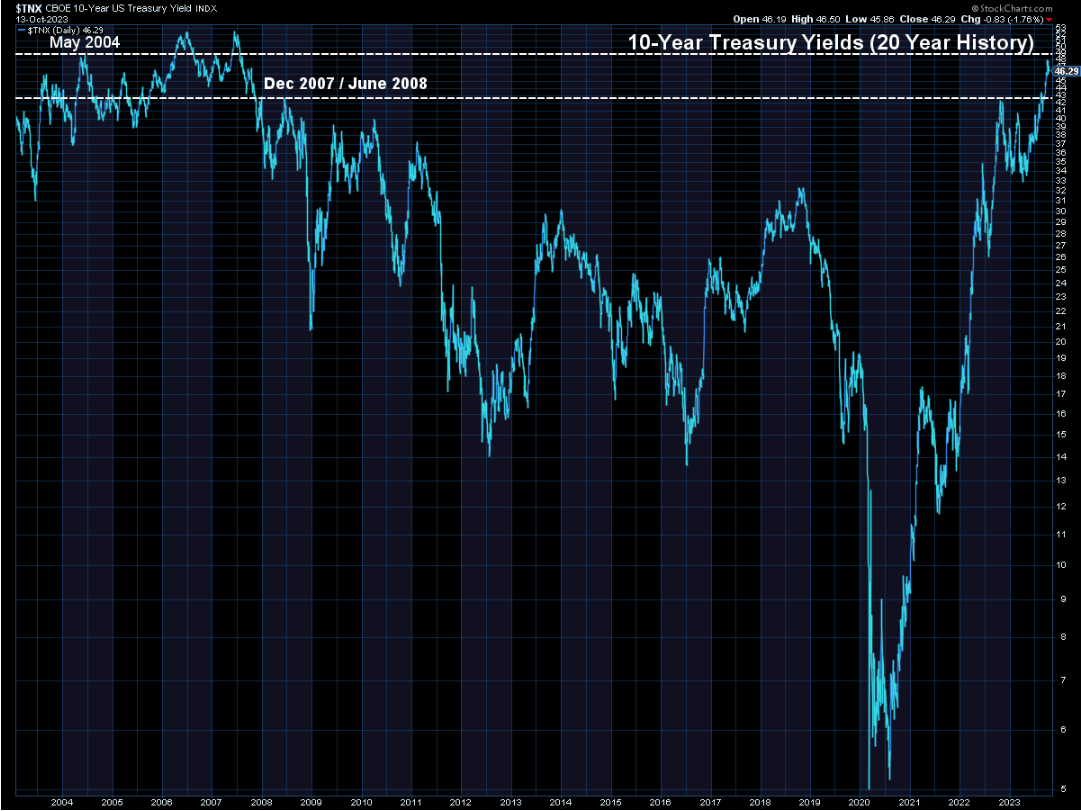
Since we've been talking about bonds, I'll start with the 10-Year Treasury yield chart. Yields spiked higher two weeks ago, but retreated a bit last week.
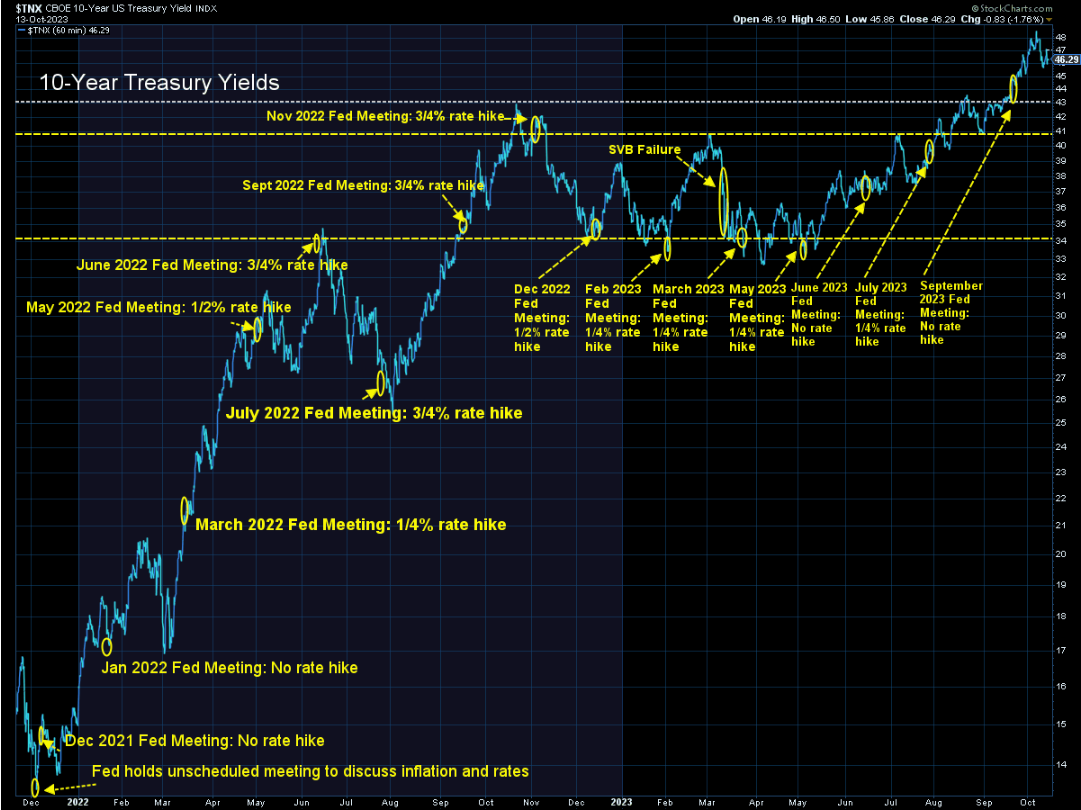
They continue to hover at 15-year highs.
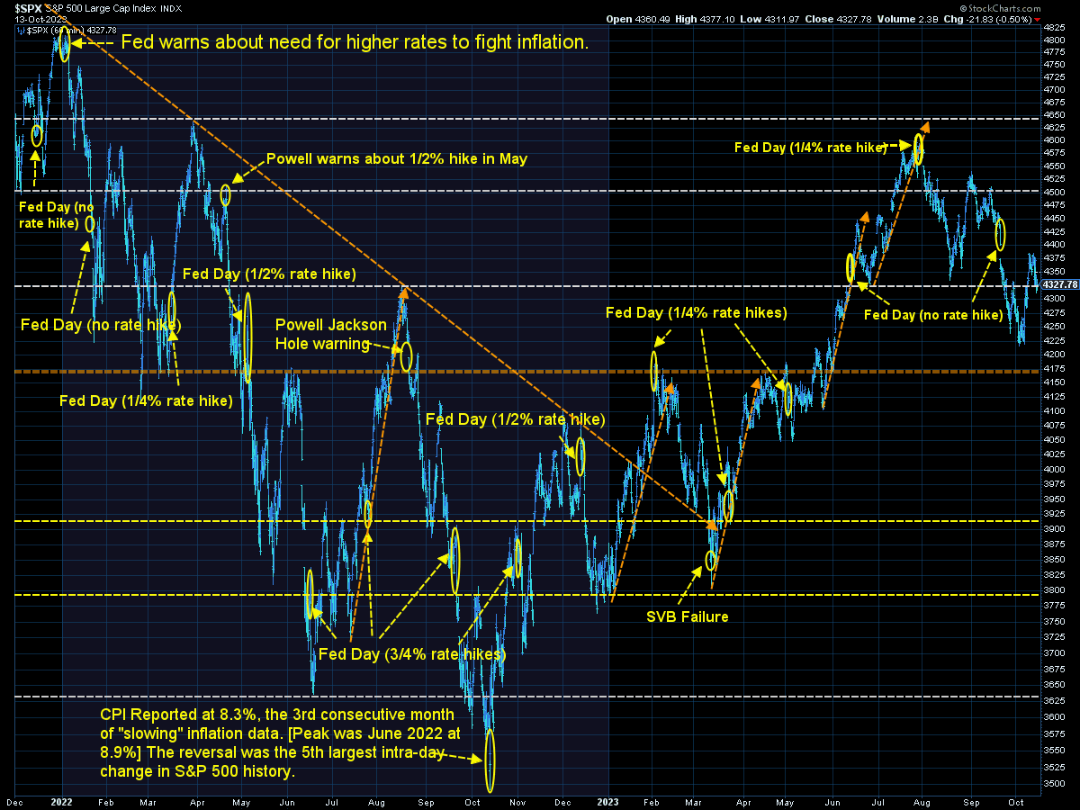
Stocks remain in a near-term downtrend which means we are more likely to see lower prices. However, we are nearly through the worst seasonal period for the markets (the 6 weeks after Labor Day), so we may see an attempt to stage a rally appear soon.
SEM Model Positioning
SEM deploys 3 distinct approaches – Tactical, Dynamic, and Strategic. These systems have been described as 'daily, monthly, quarterly' given how often they may make adjustments. Here is where they each stand.
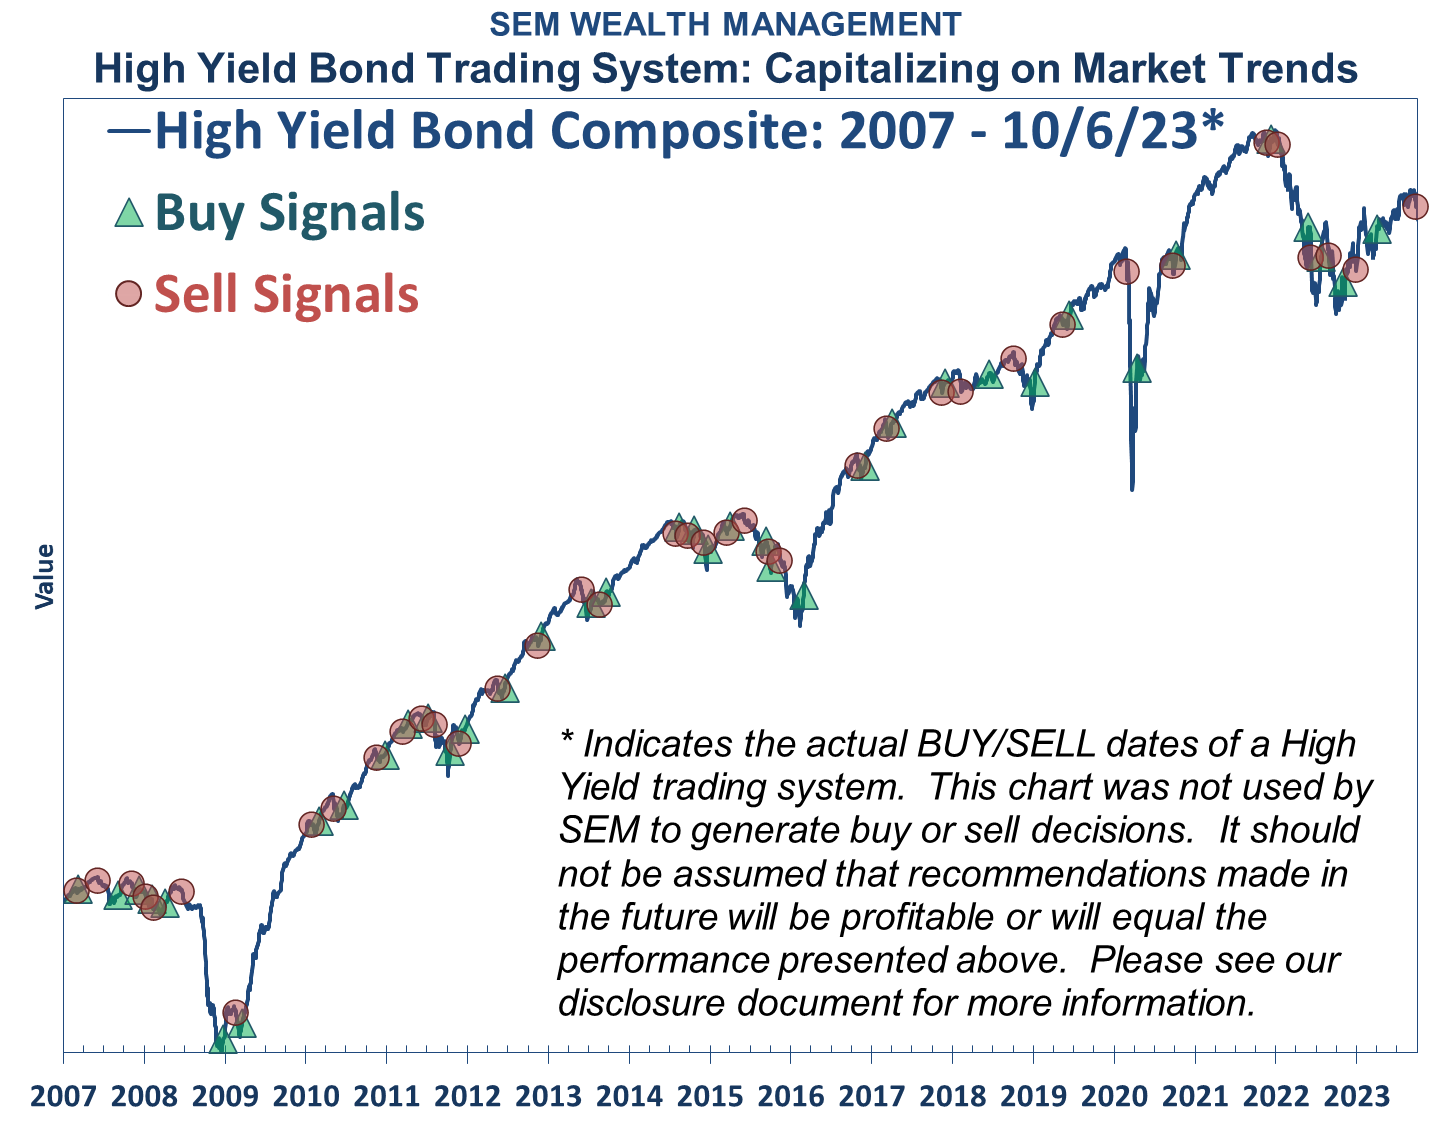
Tactical (daily): The High Yield Bond system which bought the beginning of April issued all 3 sell signals last week, so as of 9/28/2023 we are completely "risk-off". The money market accounts we are using have a 5%+ annualized yield, so we are happy to sit there as long as possible considering high yield (junk) bonds are only yielding 6 1/2 - 7% currently.
Dynamic (monthly): At the beginning of October the model moved slightly off the "bearish" signal we've had since April 2022. This means a small position in dividend stocks (Dynamic Income) and small cap stocks (Dynamic Aggressive Growth). Other than that, the models remain 'bearish'.
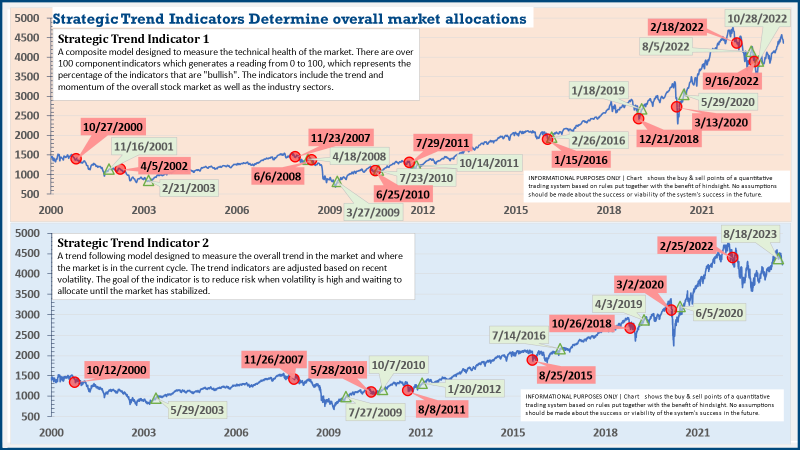
Strategic (quarterly)*: The core rotation is adjusted quarterly. On August 17 it rotated out of mid-cap growth and into small cap value. It also sold some large cap value to buy some large cap blend and growth. The large cap purchases were in actively managed funds with more diversification than the S&P 500 (banking on the market broadening out beyond the top 5-10 stocks.)
The * in quarterly is for the trend models. These models are watched daily but they trade infrequently based on readings of where each believe we are in the cycle. The second indicator triggered on August 16, brining the strategic models to a fully invested position. We are NOT locked into these for the next quarter. The 'sell-point' for this system is down around 3-4% from here.
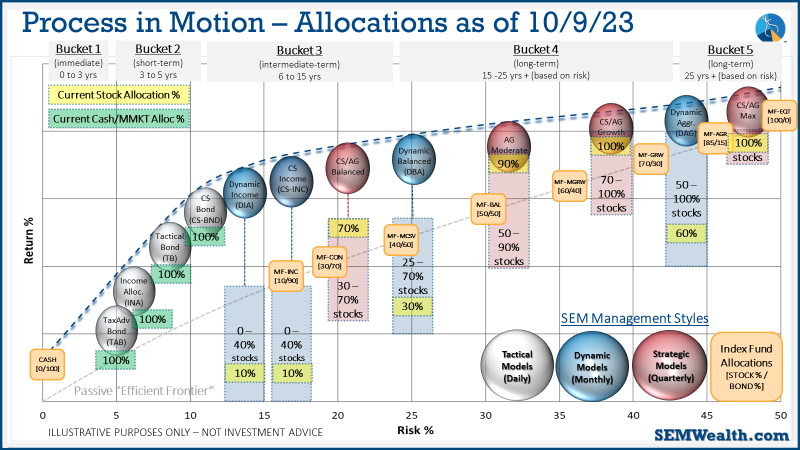
Overall, this is how our various models stock up: