The market moves in cycles of excessive optimism and excessive pessimism. I start out nearly every presentation with this slide:
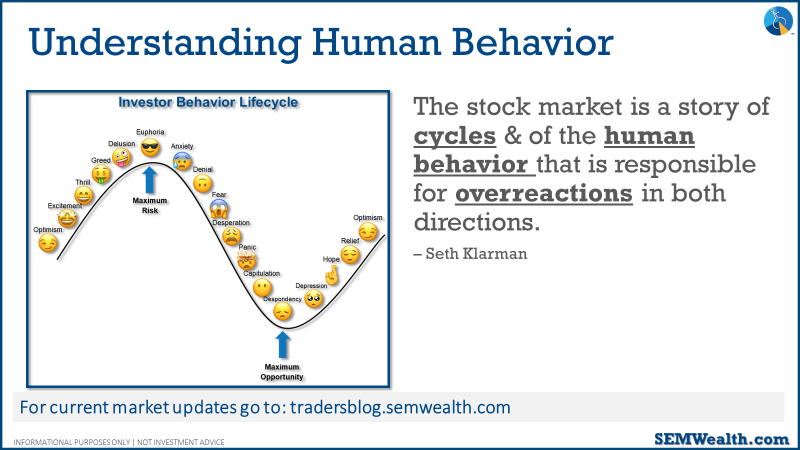
This is important to understand if you watch the markets closely. It is easy to get sucked into the current narrative which conveniently always is designed to support the current market direction.
We started 2020 with excessive optimism (even though SEM's economic model was concerned about a slowdown). That optimism quickly spread to excessive pessimism for about 8 weeks, which chopped 35% off the market valuations. As the government (over) reacted to the pandemic with (unprecedented) stimulus stocks bottomed and we reverted to excessive optimism the second half of 2020 and for all of 2021. It seemed nothing could stop the market's march higher.
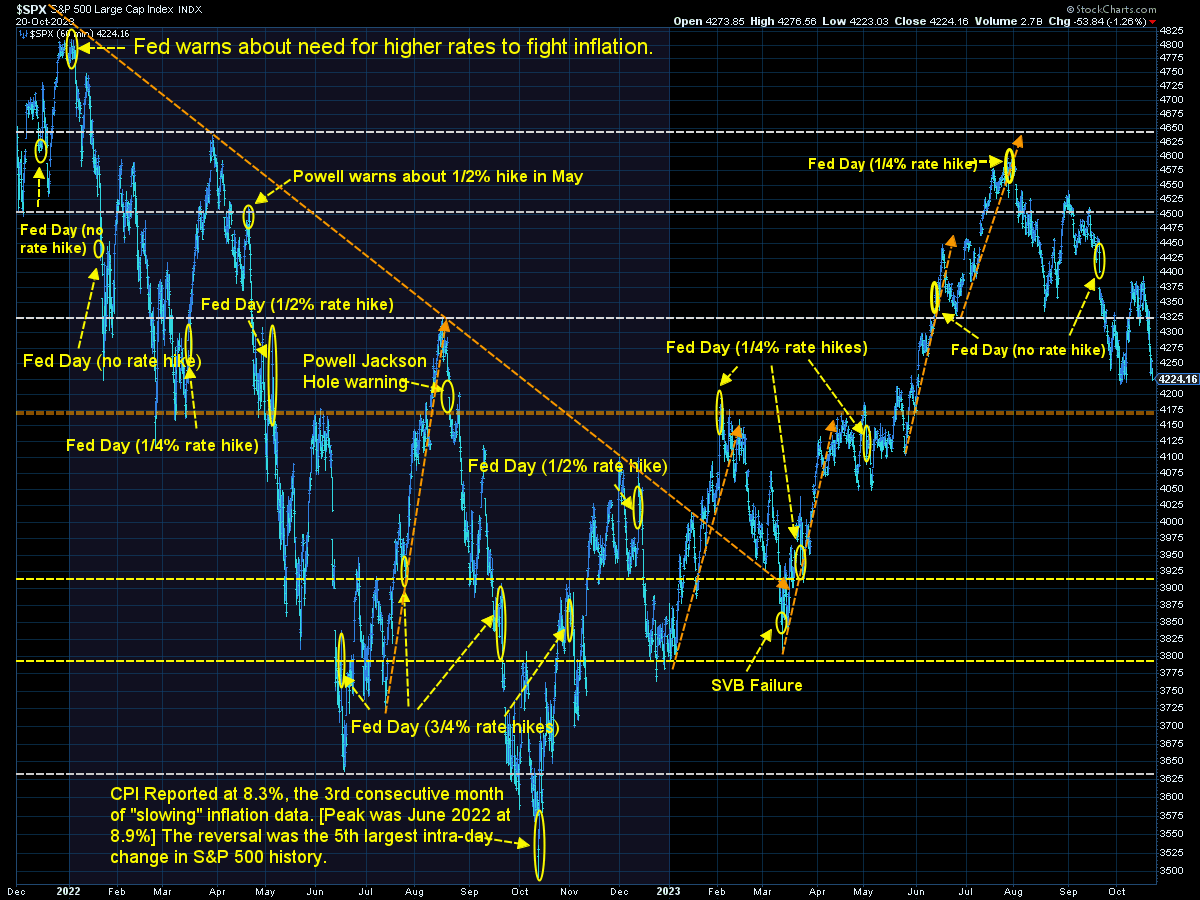
In 2022 the Fed started the year by telling us they would need to raise interest rates to fight inflation (which had started roaring higher in April 2021). Everyone then became overly pessimistic and chopped 22% off the market valuations (and 18% from the bond market index). Corporate earnings dipped some, but in the last quarter of 2022 a new narrative began to form.
October 2022 - August 2023 Narrative
1.) The economy would not go into recession, meaning......
2.) Earnings would grow at above average rates
3.) The Fed would gain control of inflation, meaning.....
4.) The Fed would not only stop raising interest rates, but also......
5.) The Fed would cut interest rates before the end of 2023 or early in 2024 (which would support the strong earnings growth predictions.)
Unfortunately this has not been playing out since August. We now are facing several problems.
August 2023 - Present Concerns
- Inflation while lower has not been falling rapidly enough, meaning.....
- The Fed will most certainly not be cutting interest rates anytime soon.
- Congress is essentially closed for business thanks to the circus in the House after the Speaker had the audacity to work with the other side to keep the government open.
- Due to all of the above, interest rates have rocketed higher, meaning.......
- Earnings growth may be much lower than people hoped.
Add to this the escalating war in the Middle East and you have a not so rosy scenario. Each bullet point above is something we've discussed throughout the year on this page, but based on the reaction of the market, it was not in their realm of possibilities. Like all corrections, this risks turning into another episode of overreactions – this time to the overly pessimistic side of the cycle.
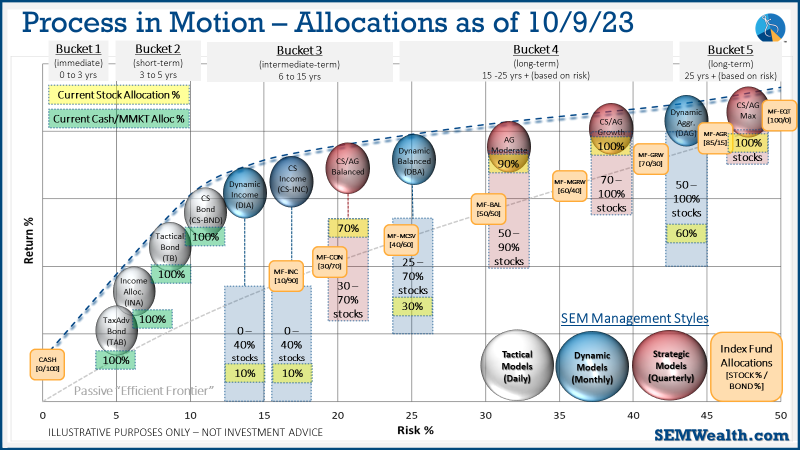
As shown in the SEM Model Positions, we are ready for whatever direction this develops.
Market Charts
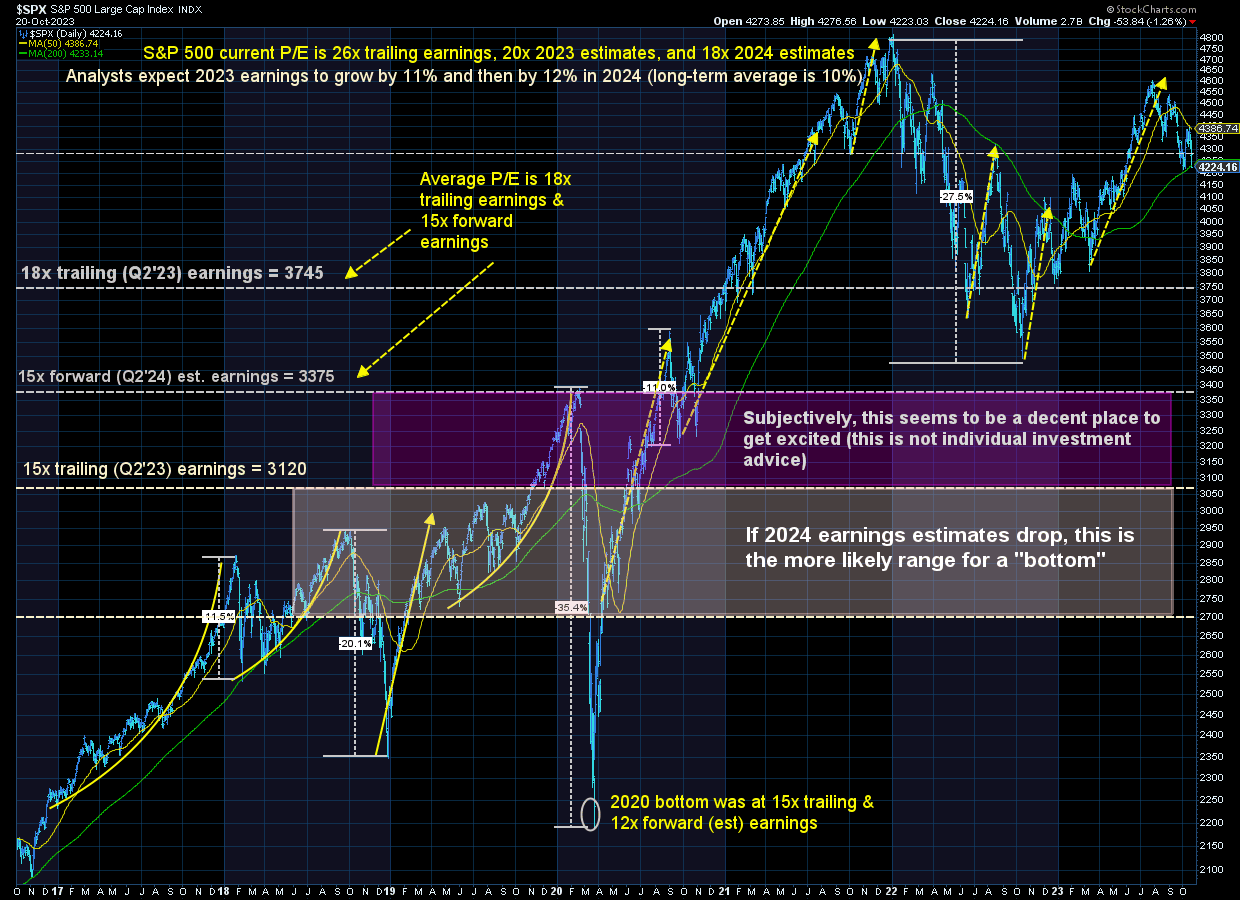
The S&P made a valiant attempt two weeks ago to get back on track. It failed. The "head & shoulders" blow-off top pattern I identified in mid-September remains in play.
Some people have asked about the head & shoulders pattern. While not perfect, it is a good illustration of the behavior around a temporary top in the market. The market rallies off of a key level, pulls back a bit, and then explodes higher. Naturally you see a bit of a correction, which brings in the 'buy the dip' crowd. However, the dip buying is not enough to send the market to new highs and the market sells off again. You typically see people trying to buy the dip again around the levels where the euphoria started (the neckline), but when that fails you usually see the size of the entire move given back to the downside.
It is by no means perfect and not anything we can model to use in our systems as it is very subjective, but it is something to pay attention to if you are looking to put new money to work.
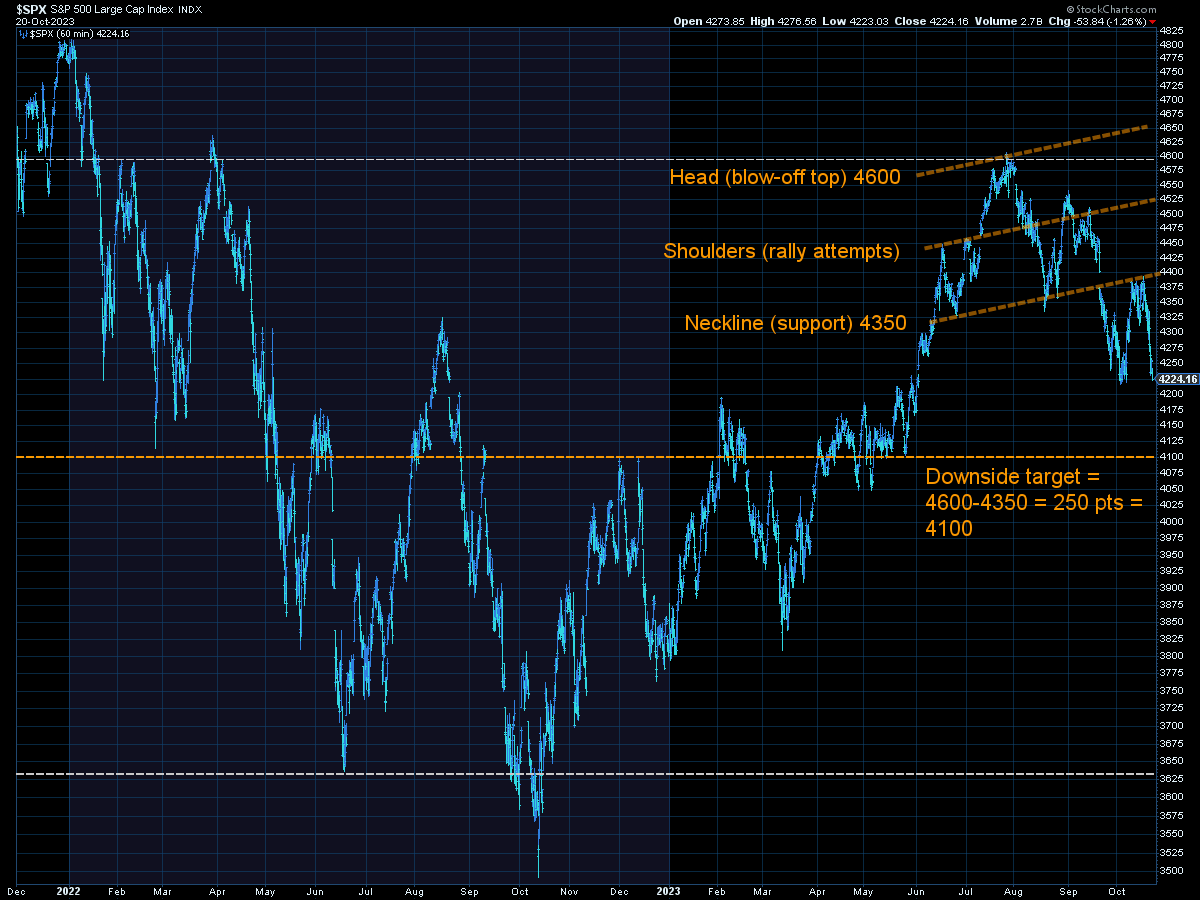
Zooming out, we can see 4100 would be classified as a mild correction and would leave the market solidly in 'overvalued' territory. The 200-day moving average, a level many people use as the 'long-term' trend line is once again in play. Breaking the moving average the first time is not significant from a technical perspective, but it could bring out more selling as it means the last 12 months of returns are close to being wiped out. Psychologically this is important.
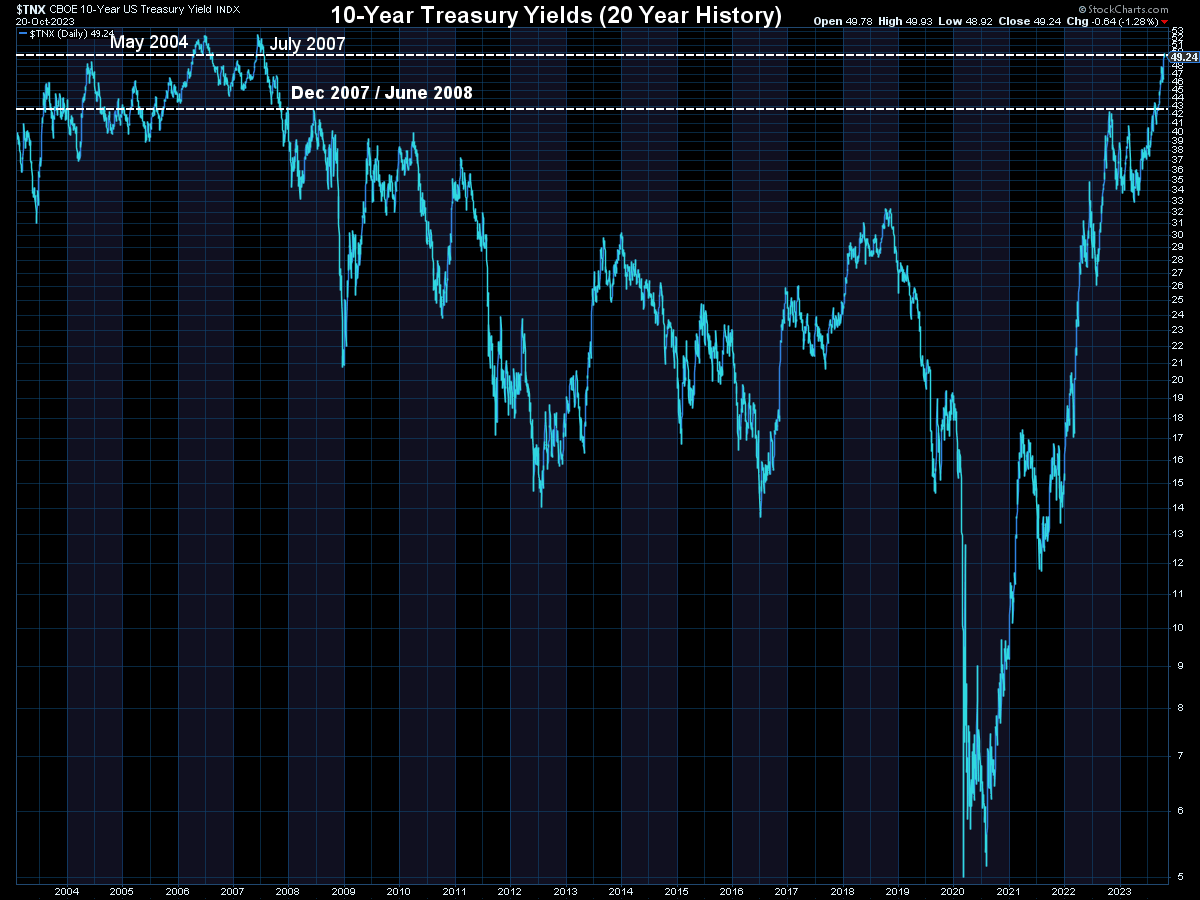
What is more important at the moment is what is happening with interest rates. We're back at levels not seen since 2007 and before that 2004.
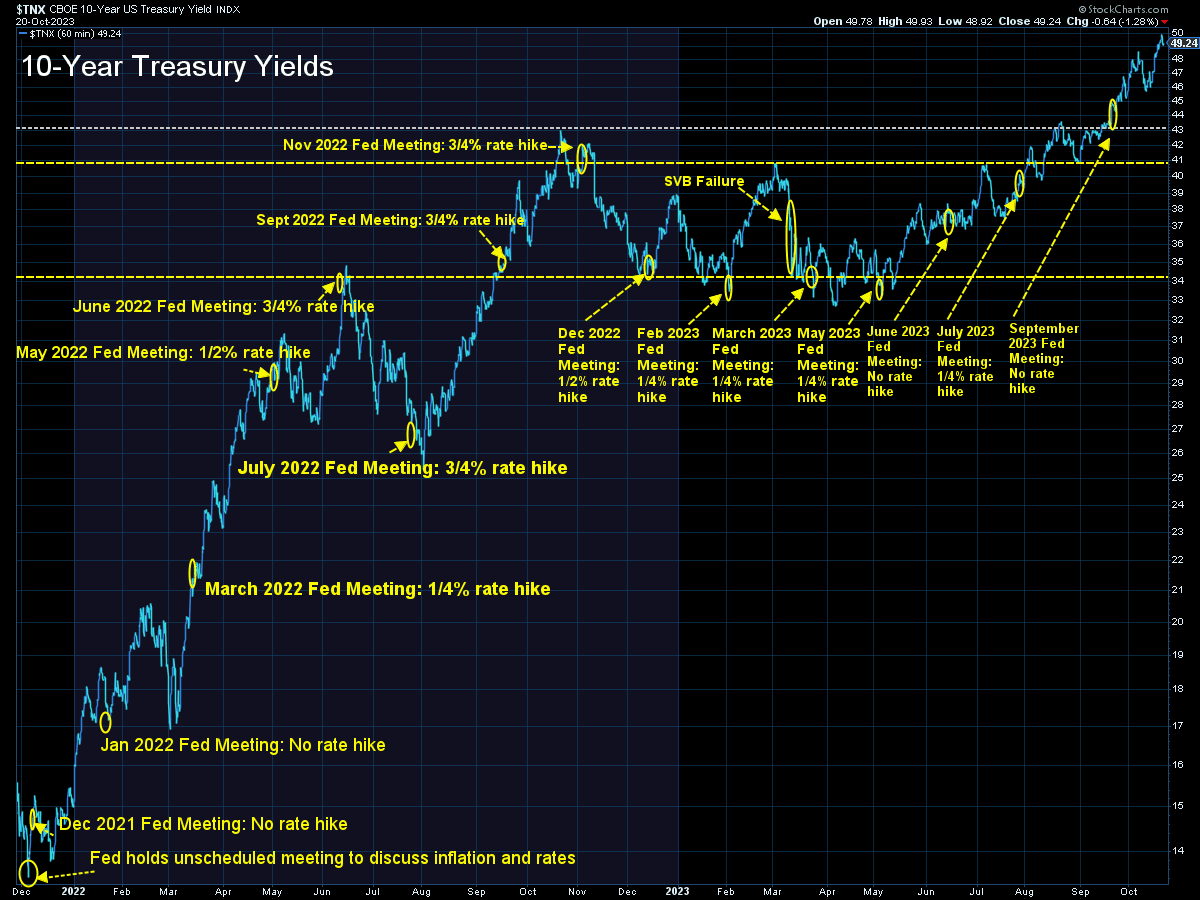
This WILL create a drag on growth. It WILL lead to things breaking in the financial system. Which is why I believe it WILL lead to the Fed once again stepping in to save (some) banks (eventually). This is why I discussed the increasingly attractive return/risk set-up in the bond market last week.

It should be noted, bonds are still VERY risky. My point was at these interest rate levels bonds should be considered for growth oriented clients. For more conservative clients, it's probably too soon, which is why our models remain invested in money markets or lower risk bonds for those types of clients.
SEM Model Positioning
[no changes from last week]
SEM deploys 3 distinct approaches – Tactical, Dynamic, and Strategic. These systems have been described as 'daily, monthly, quarterly' given how often they may make adjustments. Here is where they each stand.
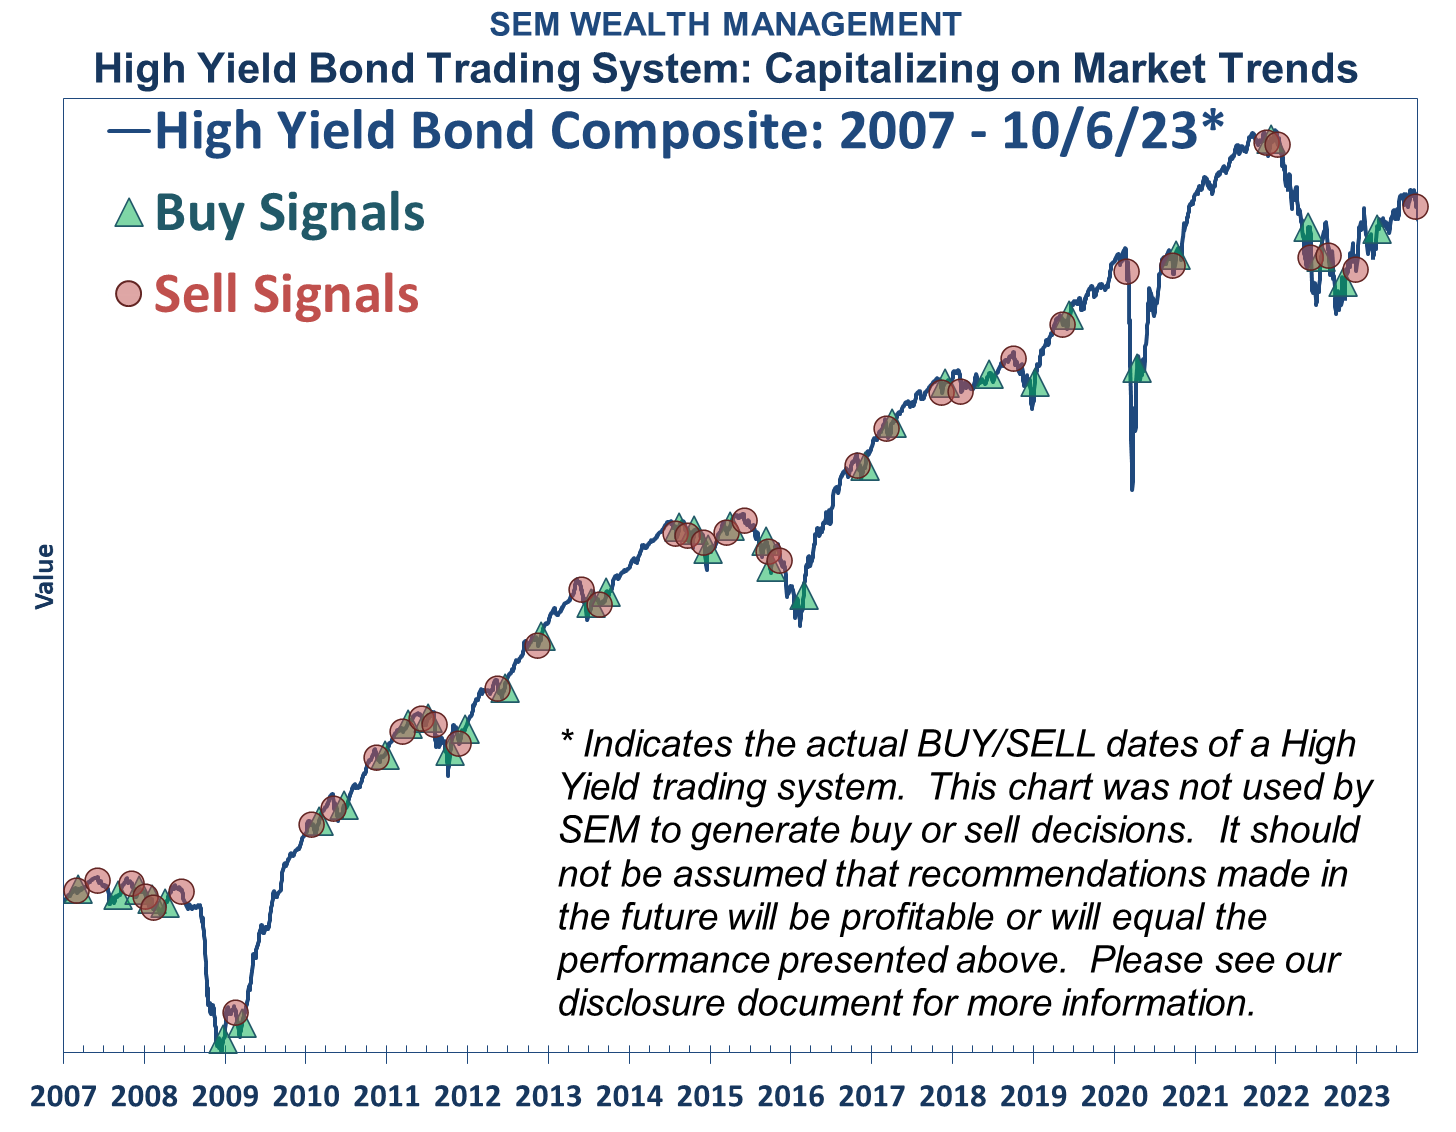
Tactical (daily): The High Yield Bond system which bought the beginning of April issued all 3 sell signals last week, so as of 9/28/2023 we are completely "risk-off". The money market accounts we are using have a 5%+ annualized yield, so we are happy to sit there as long as possible considering high yield (junk) bonds are only yielding 6 1/2 - 7% currently.
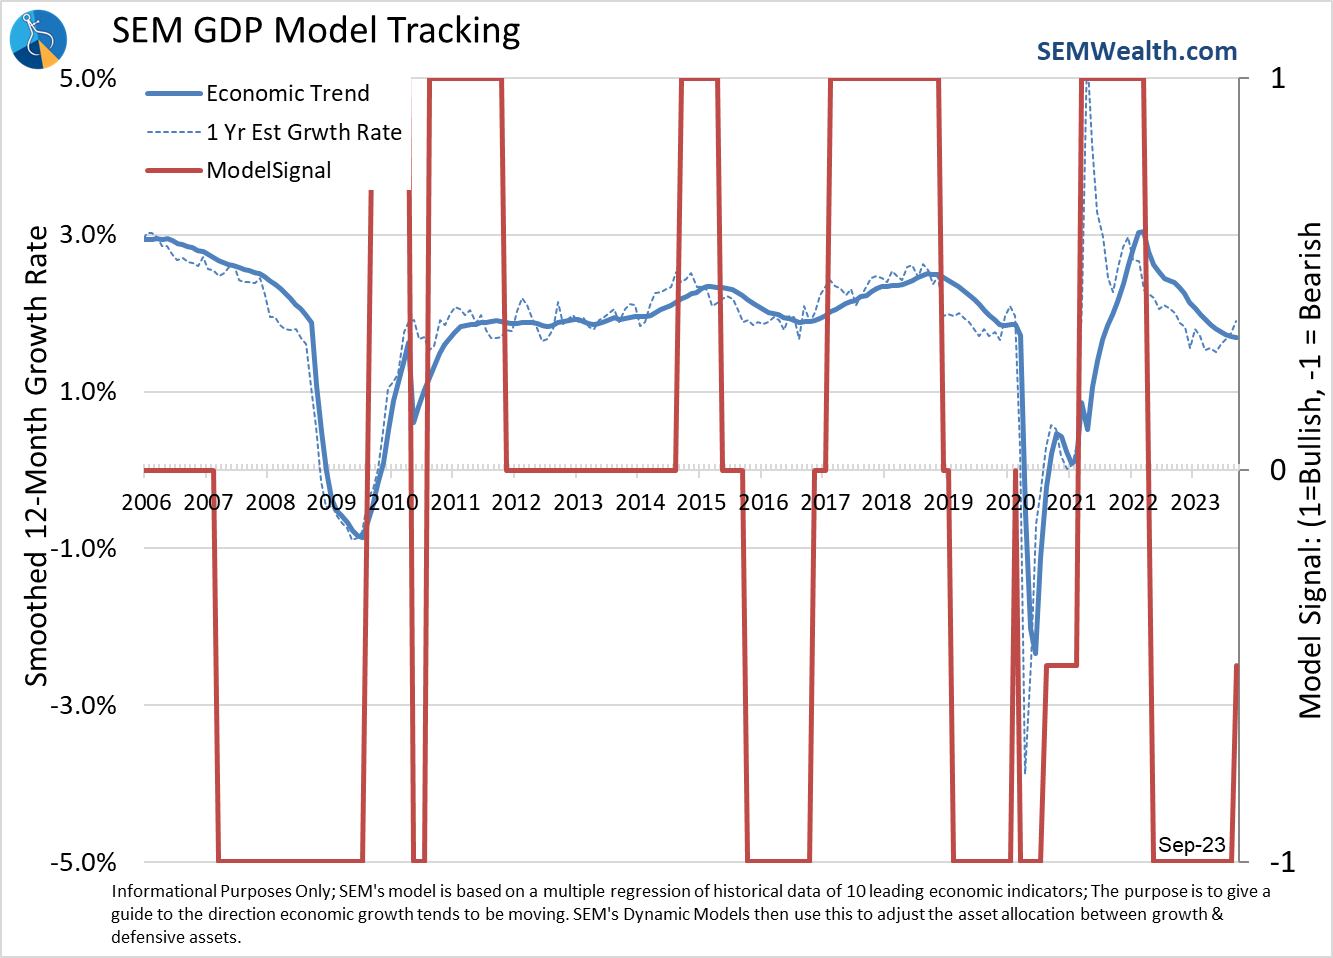
Dynamic (monthly): At the beginning of October the model moved slightly off the "bearish" signal we've had since April 2022. This means a small position in dividend stocks (Dynamic Income) and small cap stocks (Dynamic Aggressive Growth). Other than that, the models remain 'bearish'.
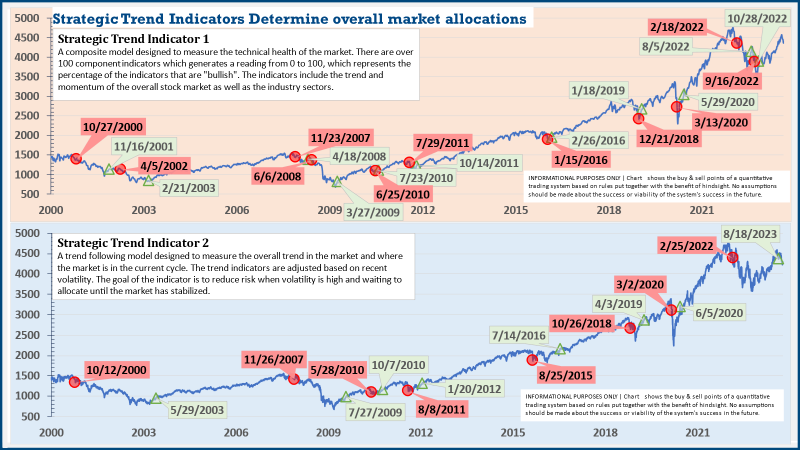
Strategic (quarterly)*: The core rotation is adjusted quarterly. On August 17 it rotated out of mid-cap growth and into small cap value. It also sold some large cap value to buy some large cap blend and growth. The large cap purchases were in actively managed funds with more diversification than the S&P 500 (banking on the market broadening out beyond the top 5-10 stocks.)
The * in quarterly is for the trend models. These models are watched daily but they trade infrequently based on readings of where each believe we are in the cycle. The second indicator triggered on August 16, brining the strategic models to a fully invested position. We are NOT locked into these for the next quarter. The 'sell-point' for this system is down around 3-4% from here.
Overall, this is how our various models stock up: