December is a time to look back at the year that was and turn our attention to what the new year may look like. For the stock market, following a sell-off in 2022, the new year brought impressive gains for the overall index (albeit heavily skewed to a handful of mega-cap technology stocks). 2023 started with overly pessimistic concerns about a recession and additional declines in the market. Barring a big sell-off the last month of the year, 2024 is likely to start with overly optimistic expectations for the year ahead (that's just how our brains and the market work).
The first thing I read every morning is the Sevens Report. Last week, Tom Essaye provided a week long narrative of what is already priced into the market and what could go right or wrong in the year ahead. I like to work off of lists, so I summarized Tom's analysis in the chart below.
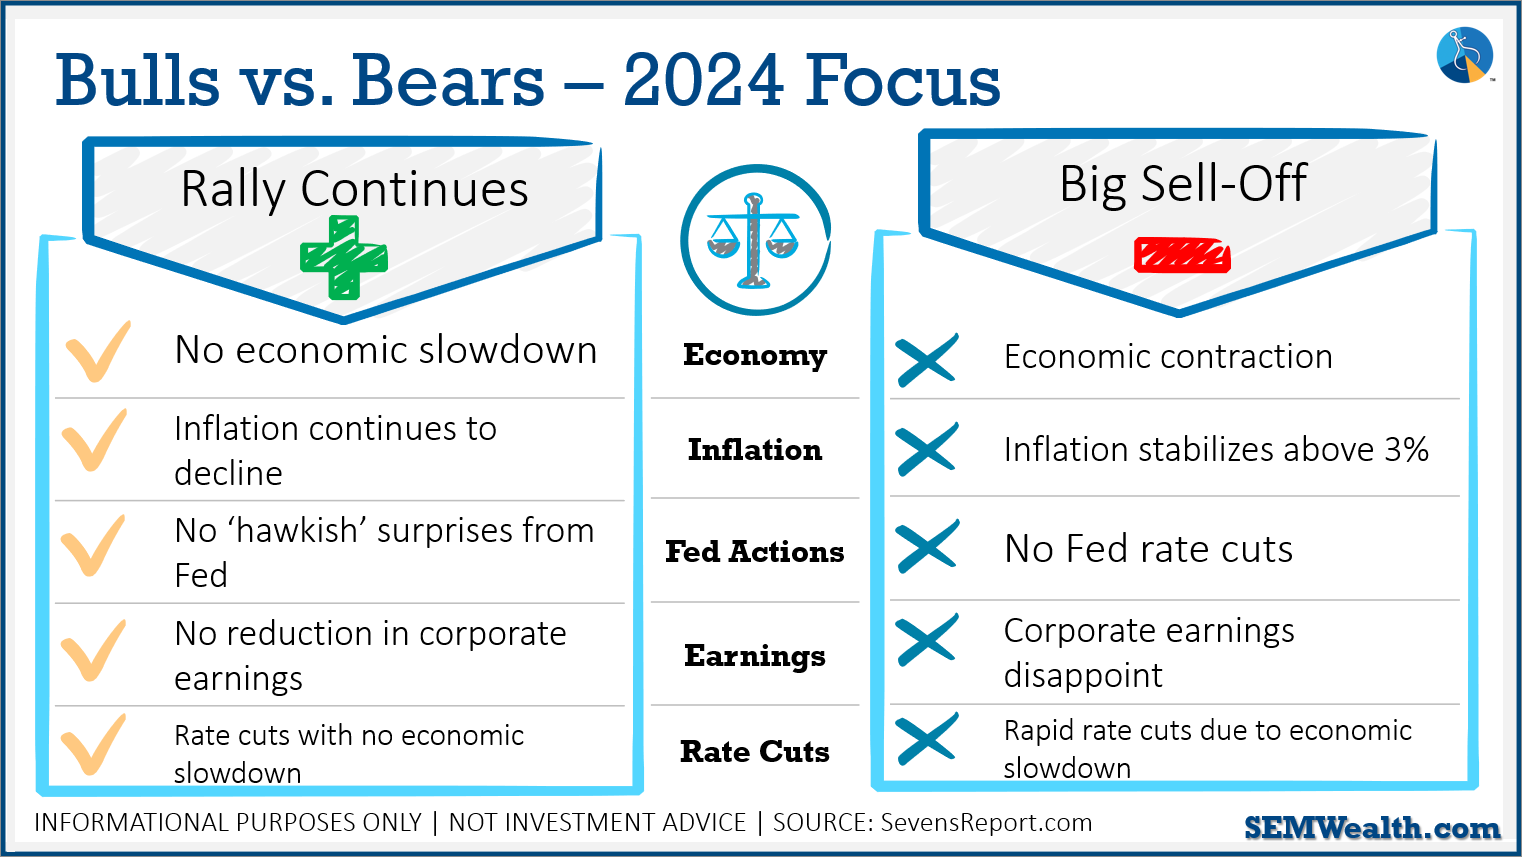
I like to also assign a scoring system just to keep track of where we are currently. To keep it simple. Here are my thoughts for each area above:
ECONOMY:
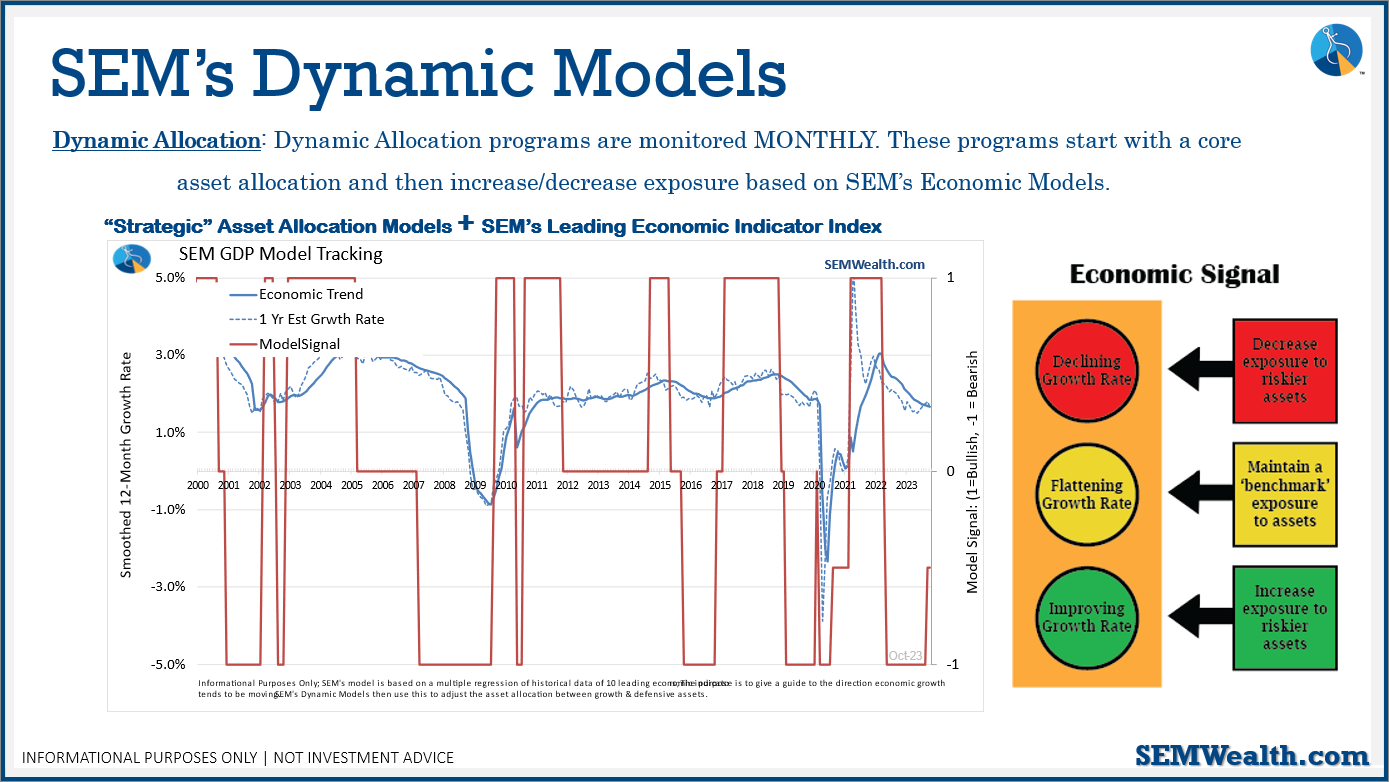
SEM's economic model continues to lean 'bearish'. We'll have a more detailed look next week. So far, our economic model is saying the couple of month bump in growth is likely to reverse. More details next week after we receive the rest of the November data.
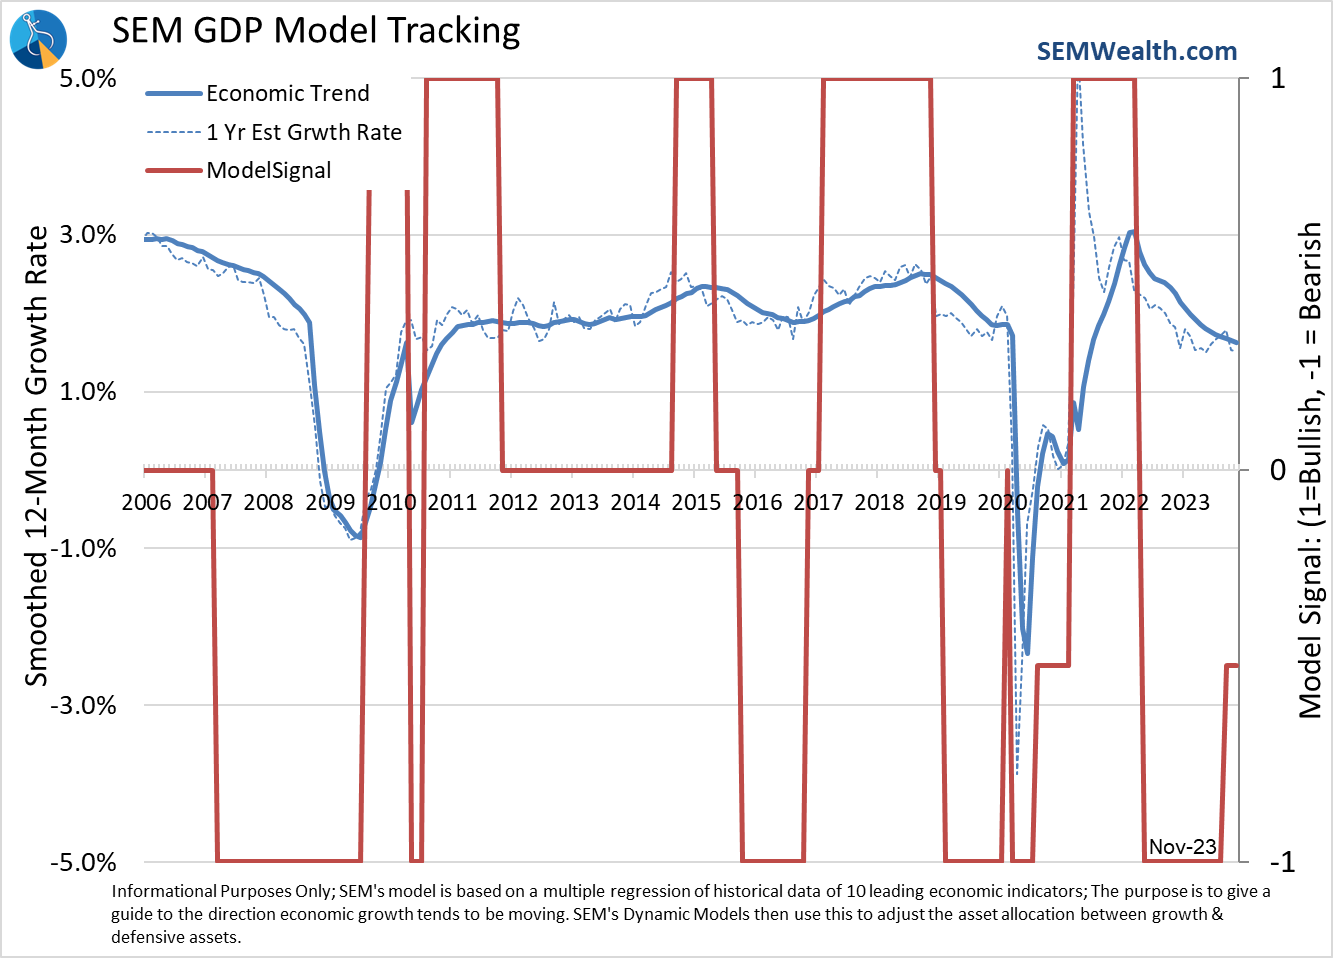
ECONOMIC SCORE: -0.5 [Next Update Dec 8 - Payrolls Report]
INFLATION:
This is the first of several variables which are contradictory for those betting on a strong 2024. Inflation is very likely to remain above 3% if the economy does not slow. For now the trend in consumer inflation is down, which is a positive, but the pressure on Manufacturing inflation has again increased, which could make inflation remain higher than the Fed would like.
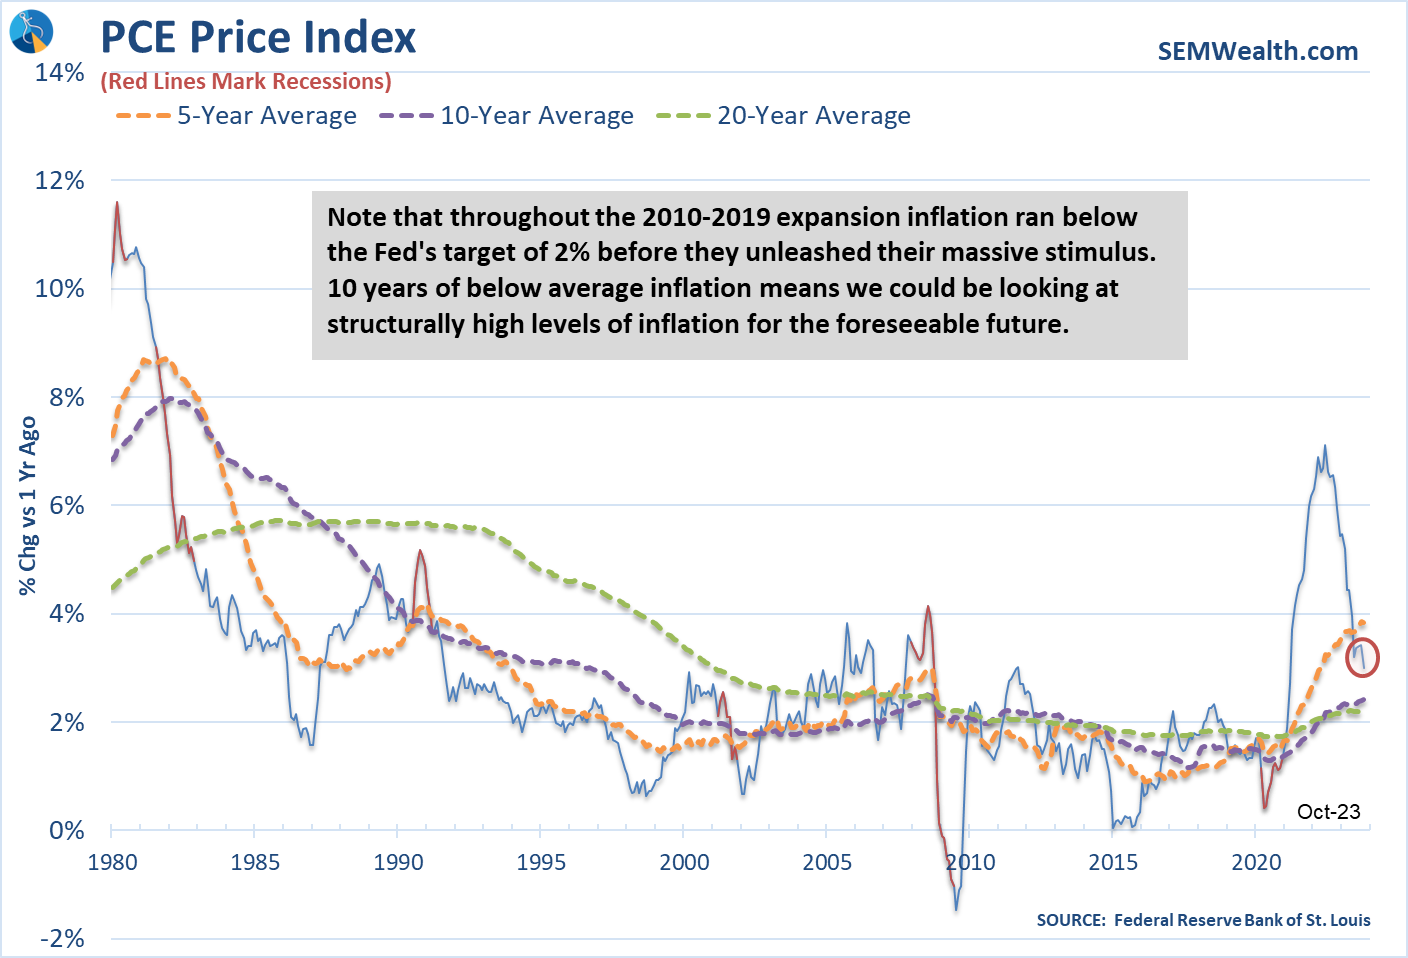
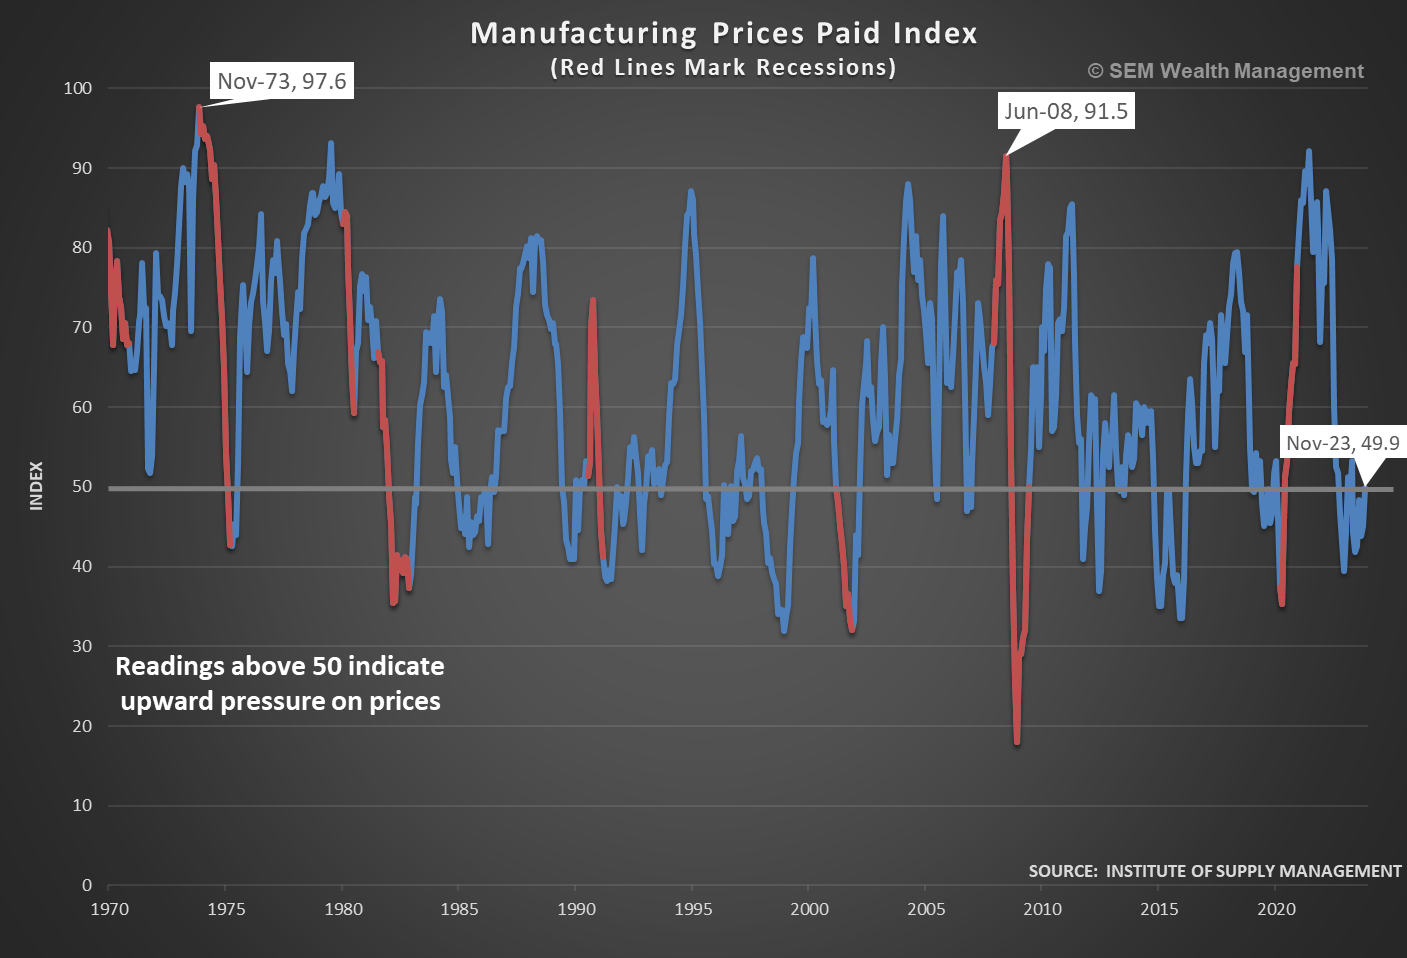
INFLATION SCORE: 0.0 [Next data point Dec 12]
FED ACTIONS:
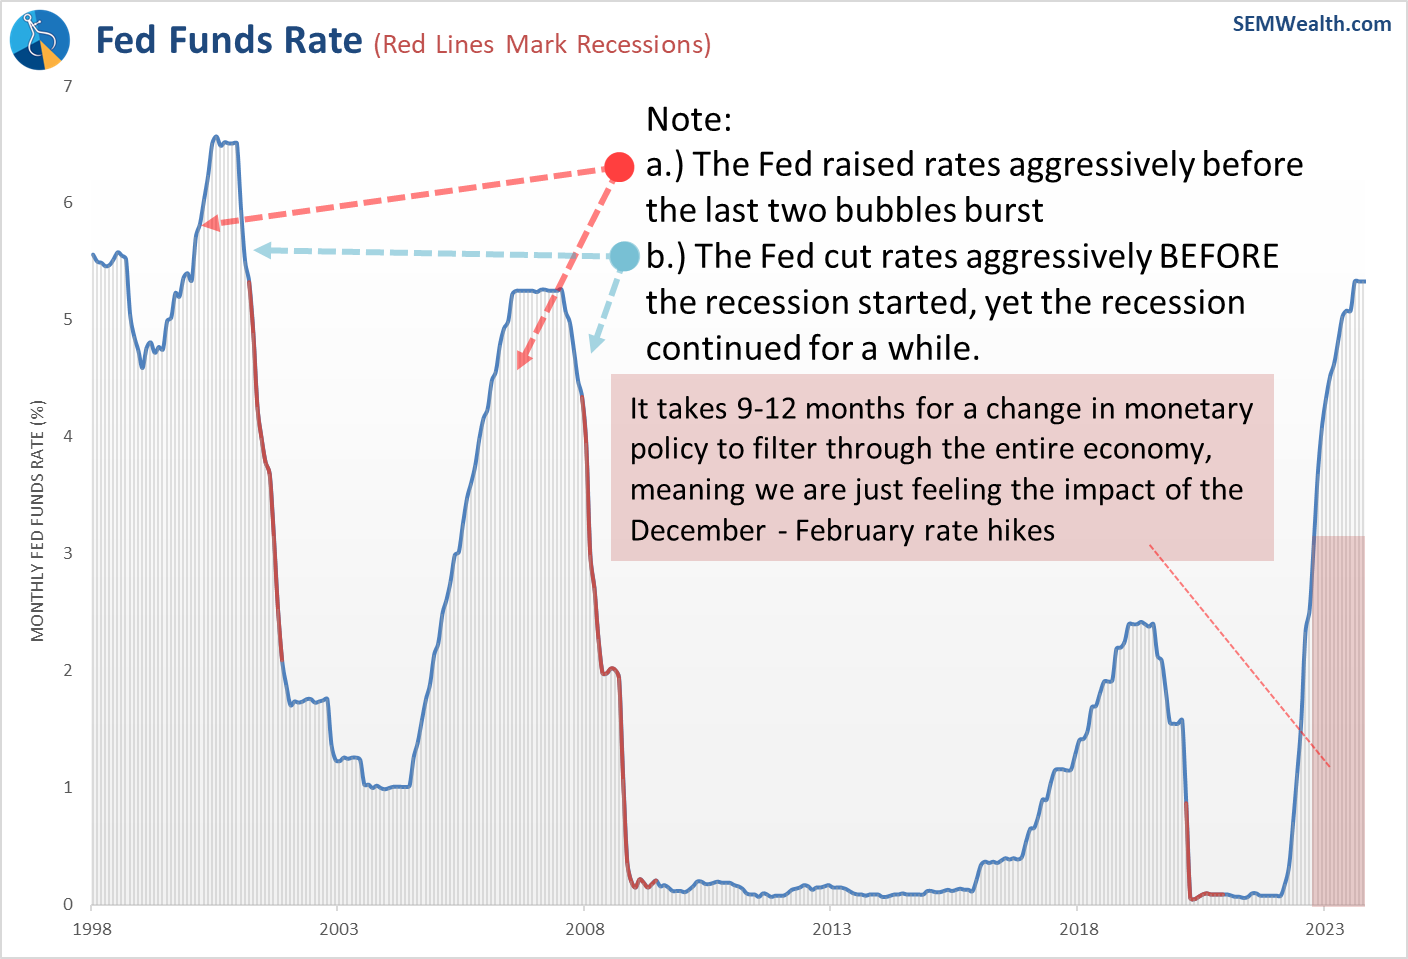
The Fed meets next week. Due to the huge rally after the last meeting when everyone believed Chair Powell said the Fed was done with rate hikes, he has said every meeting is "live" (meaning they could change policies) and nearly every member of the Fed is saying the Fed is not likely to cut rates anytime soon.
I personally believe any more rate hikes would be a mistake. We're still dealing with the hikes from earlier this year. The concern is the nearly 1% drop in long-term rates since the last Fed meeting, which could cause the Fed to at least talk rates back up next week.
FED ACTION SCORE: 0.0 [Next Meeting Dec 12-13]
EARNINGS:
Wall Street analysts are almost always overly optimistic in their forward earnings forecasts. When enthusiasm is high even a decline in estimates can lead to higher prices as the expectations simply shift to future quarters (and years).
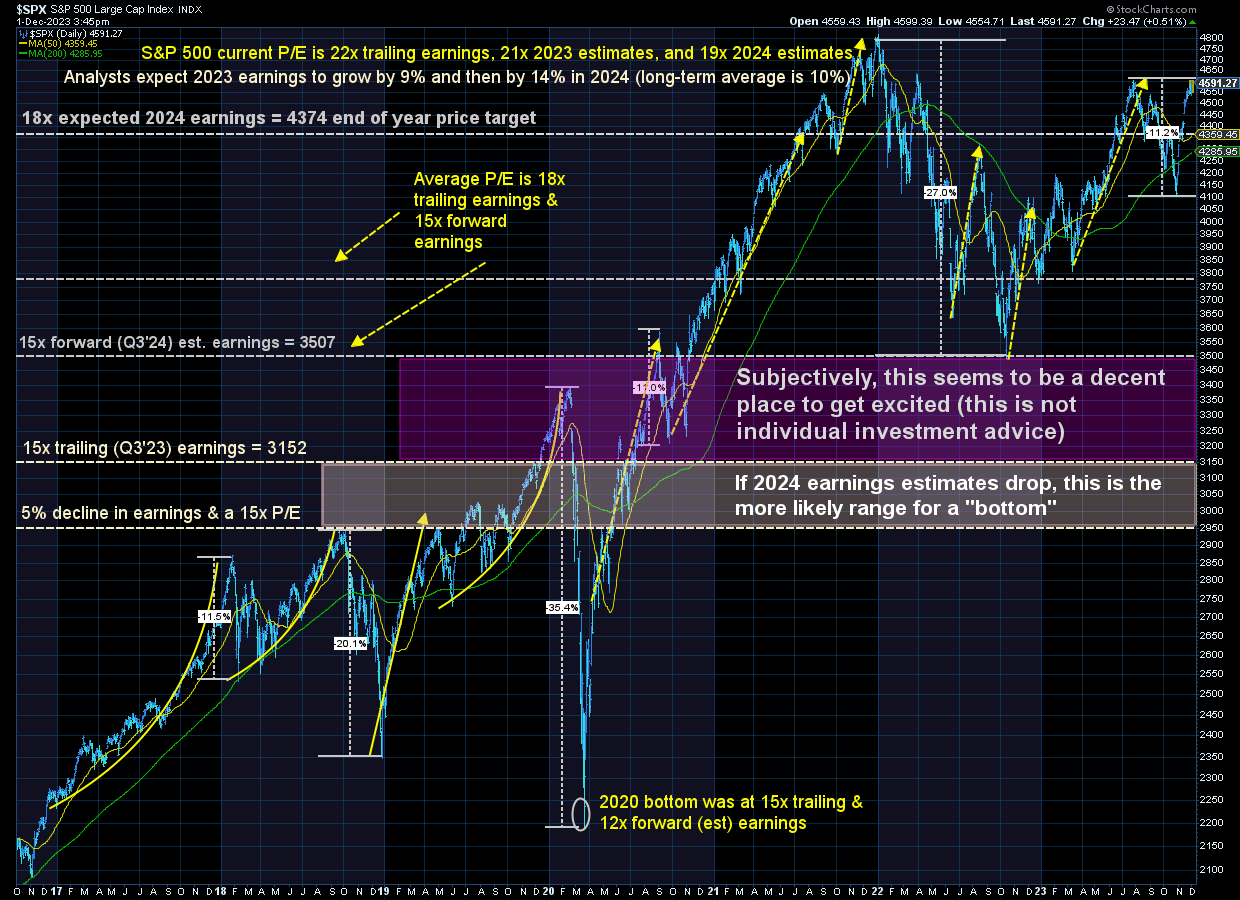
This chart illustrates how wrong Wall Street has been about the S&P 500 earnings outlook. 2023 earnings are looking to come in about 5% below the estimates made at the start of the year. The shaded box marks the future. Note the sharp drop in earnings last quarter followed by an impressive 14% increase for 2024.
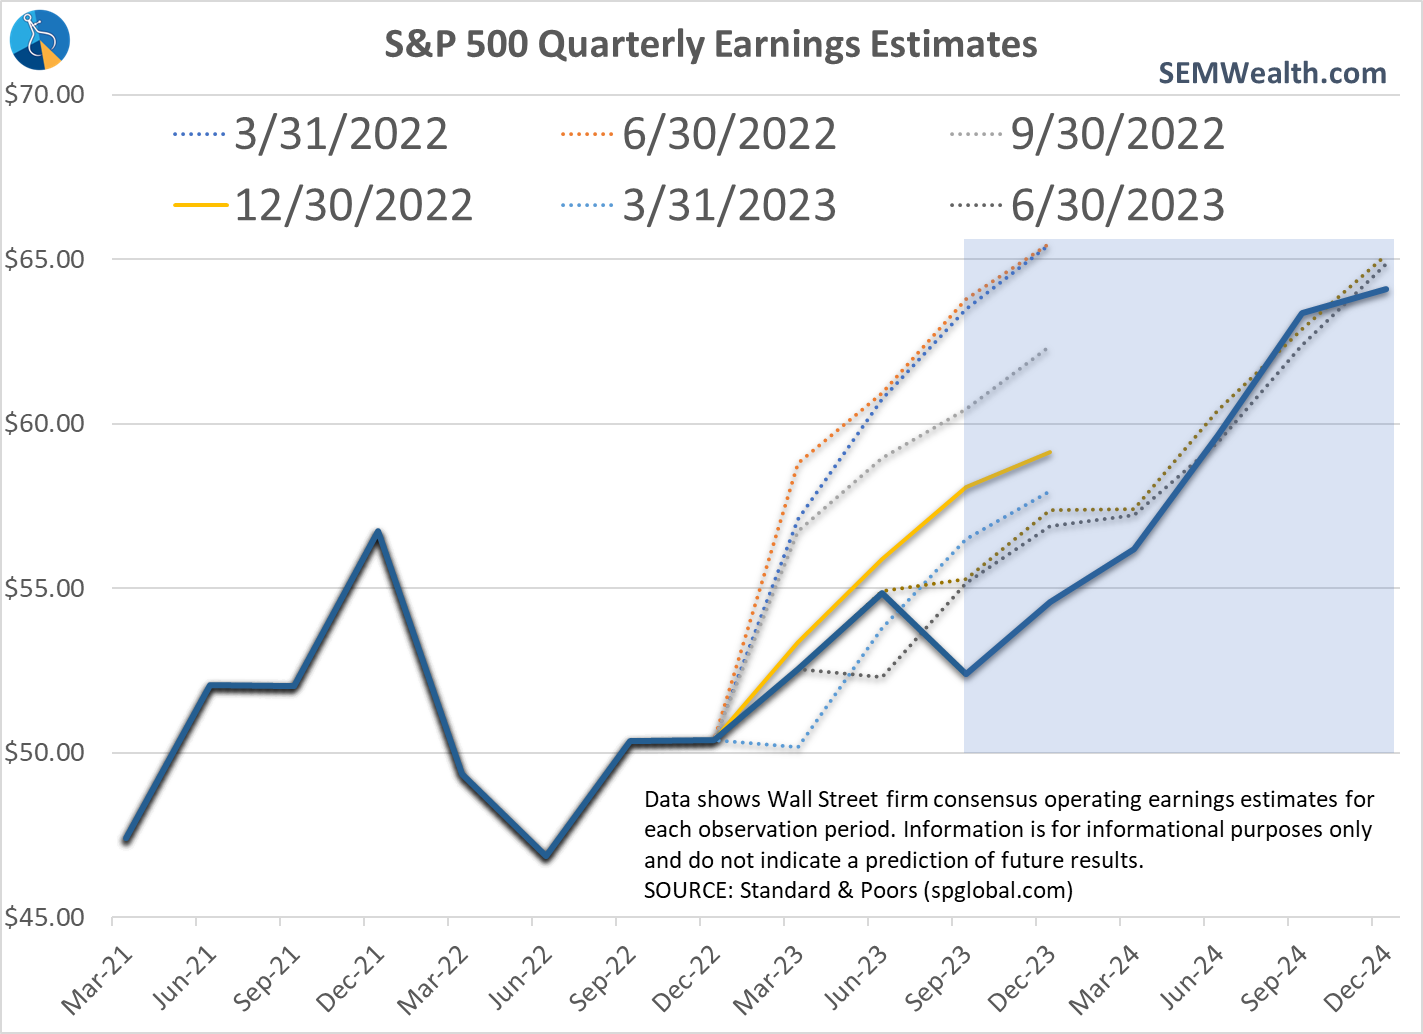
The long-term average growth for S&P 500 earnings is 10%. Wall Street is expecting ABOVE AVERAGE growth. The long-term median P/E is 18x current earnings. The S&P is trading at 18x projected 2024 earnings. The market is already pricing in significant growth. If the economy slows just enough to hit estimates we could see a big drop in the S&P. Just the small dip in Q3 earnings knocked 11% of the S&P from mid-August to late October.
EARNINGS SCORE: -1.0 [Monitor monthly]
RATE CUTS:
By far the biggest concern for next year comes in the expectations priced into the interest rate markets. Based on futures contracts you can back into the expectations for where interest rates will be at specific dates. The current expectations are both alarming and baffling.
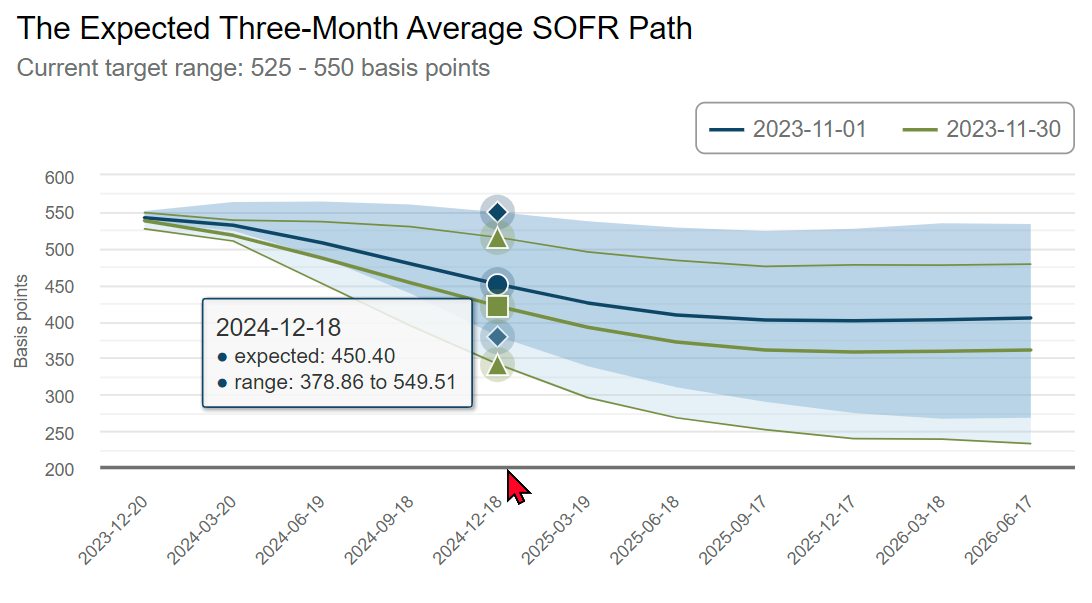
The market is expecting the Fed to cut rates in March 2024 and by the end of the year the median expectation is for the Fed to have slashed rates by 1/4% four times (1%). The only way this is likely to happen would be if either inflation fell rapidly to 2% or unemployment was increasing enough to send recession alarm bells off enough to get the Fed to cut rates.
Maybe I'm wrong and the Fed will cut rates before the economy slows down, but if not, a rate cut and especially 4 of them would not be a predictor of a great year for the stock market.
FED RATE CUT SCORE: -1.0 [Next Fed Meeting Dec 12-13]
CONCLUSION:
OVERALL SCORE: -2.5
On this very simple scale I tilt it about halfway towards the bearish bet. The reason is simple – the stock market is expecting a nearly perfect scenario. This means in order to rally we need an already impressive 2023 (on the surface) to lead to an even better 2024.
I really want to be optimistic. I think our economy has come a very long way with many positive things occurring which makes our long-term future bright. The problem is two-fold:
1.) Entirely too much debt was used to "fix" things. Debt is future spending brought forward and we essentially brought 50% of our GDP output forward in the name of "stimulus". With rates significantly higher paying back the "fix" will be expensive and a drag on growth for a bit.
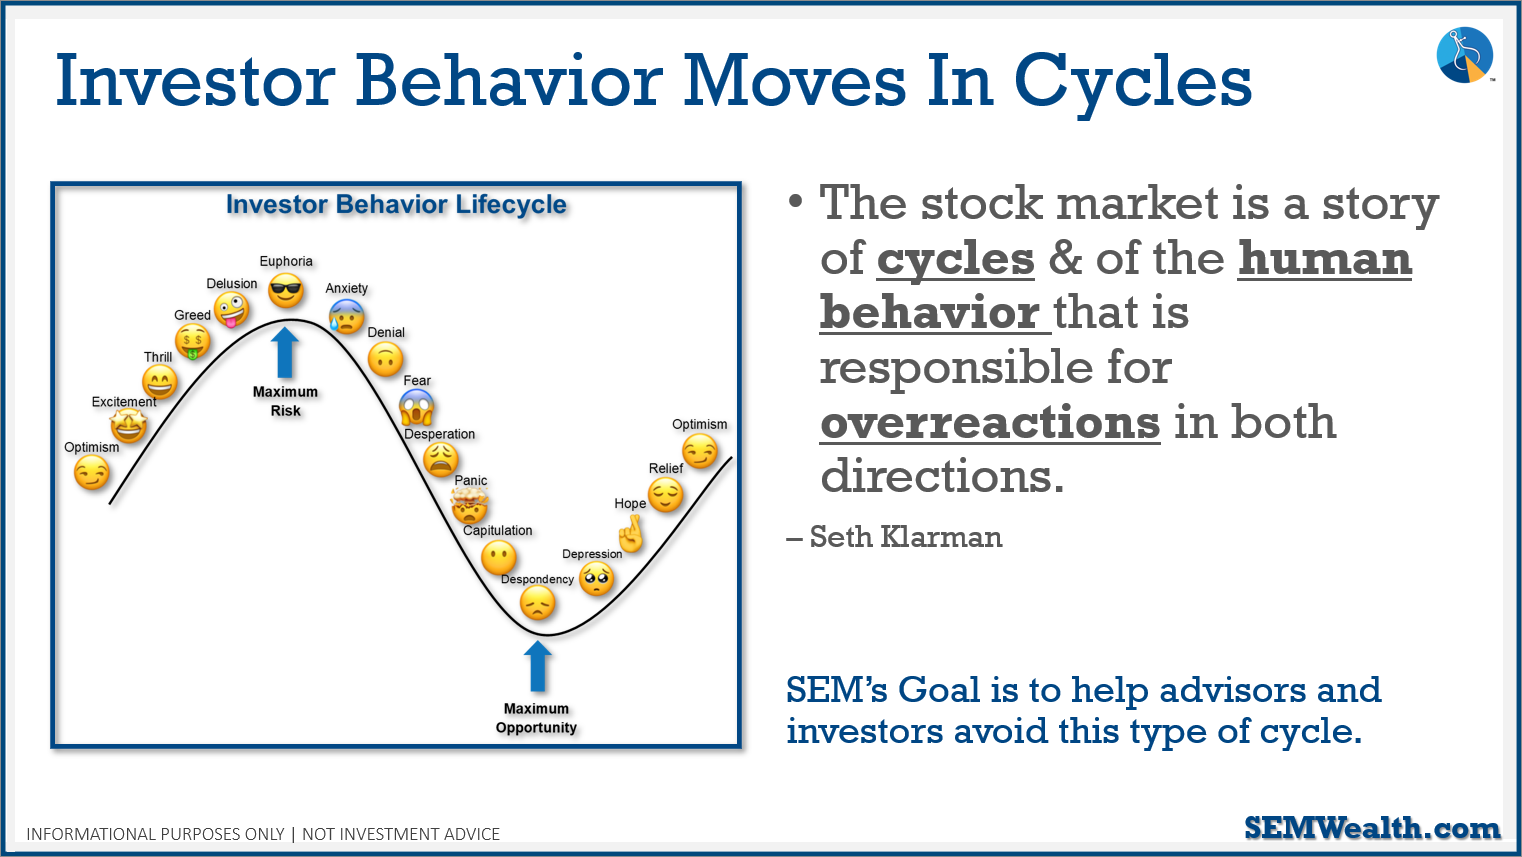
2.) The market is entirely too optimistic. My favorite chart and quote are shown below. Everything on the "positive" side of the bull-bear argument seems to be priced in, which means things have to be even better for the market to continue its rally next year. The slightest disappointment in a couple areas could cascade into overly pessimistic investors, which is when we want to have cash ready to put to work.
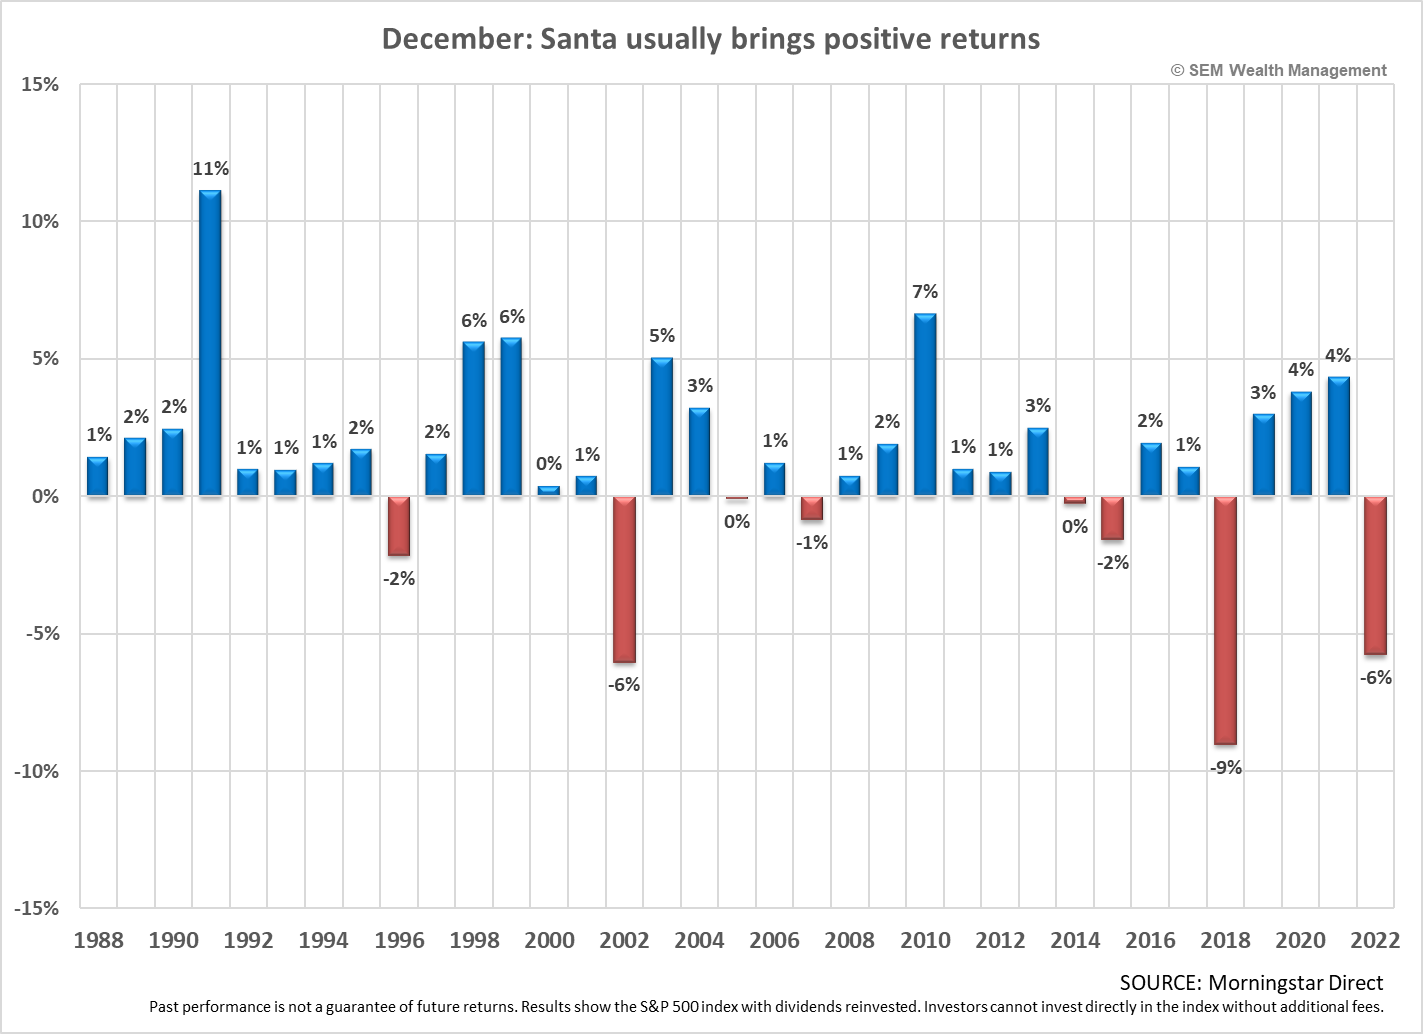
What about December?
Before we get too focused on 2024, we have the last month of the year to worry about. Historically December is a very positive month when the market is up over 15% for the year. Overall, December is up 77% of the time going back to 1988.
We do have to be wary, 2002, 2018, and 2022 all had big drops in December. We shouldn't have to worry about too much tax loss harvesting and many investors may want to wait to sell anything until the year rolls over.
Market Charts
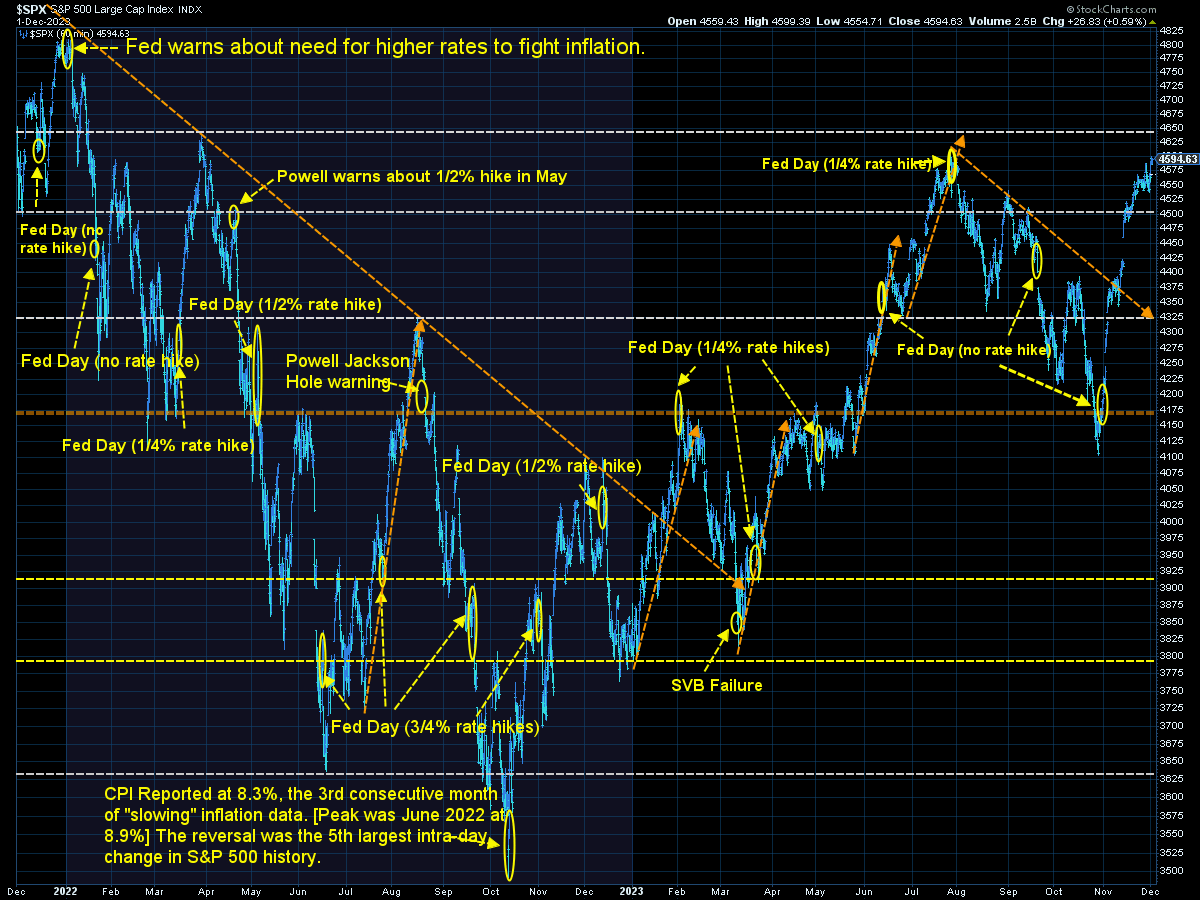
The S&P 500 closed the week right at the highs of the year, last hit in late July (before the aforementioned 11% drop). Despite the fundamental concerns listed above, the trend is higher and the market has broadened out nicely the past month with small caps and value stocks picking up steam (the small cap Russell 2000 was up a ridiculous 3% on Friday when the S&P 500 was up 0.6%)
Longer-term, as noted above, the S&P 500 remains in overvalued territory.
The key driver for the November rebound has been the 0.75% drop in the 10-year Treasury yield. The trend still looks favorable, but as we've learned the last 18 months, one wrong word from the Fed can lead to a weeks-long reversal.
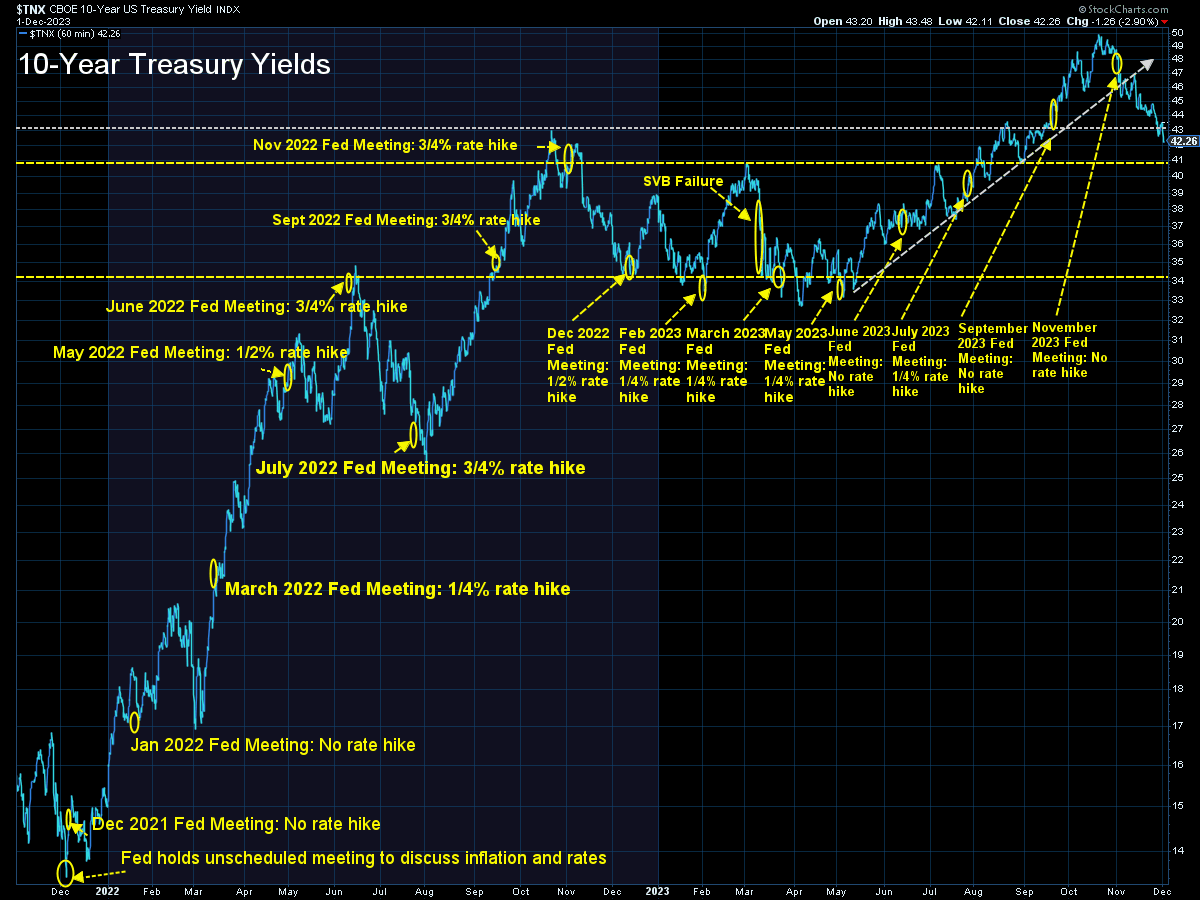
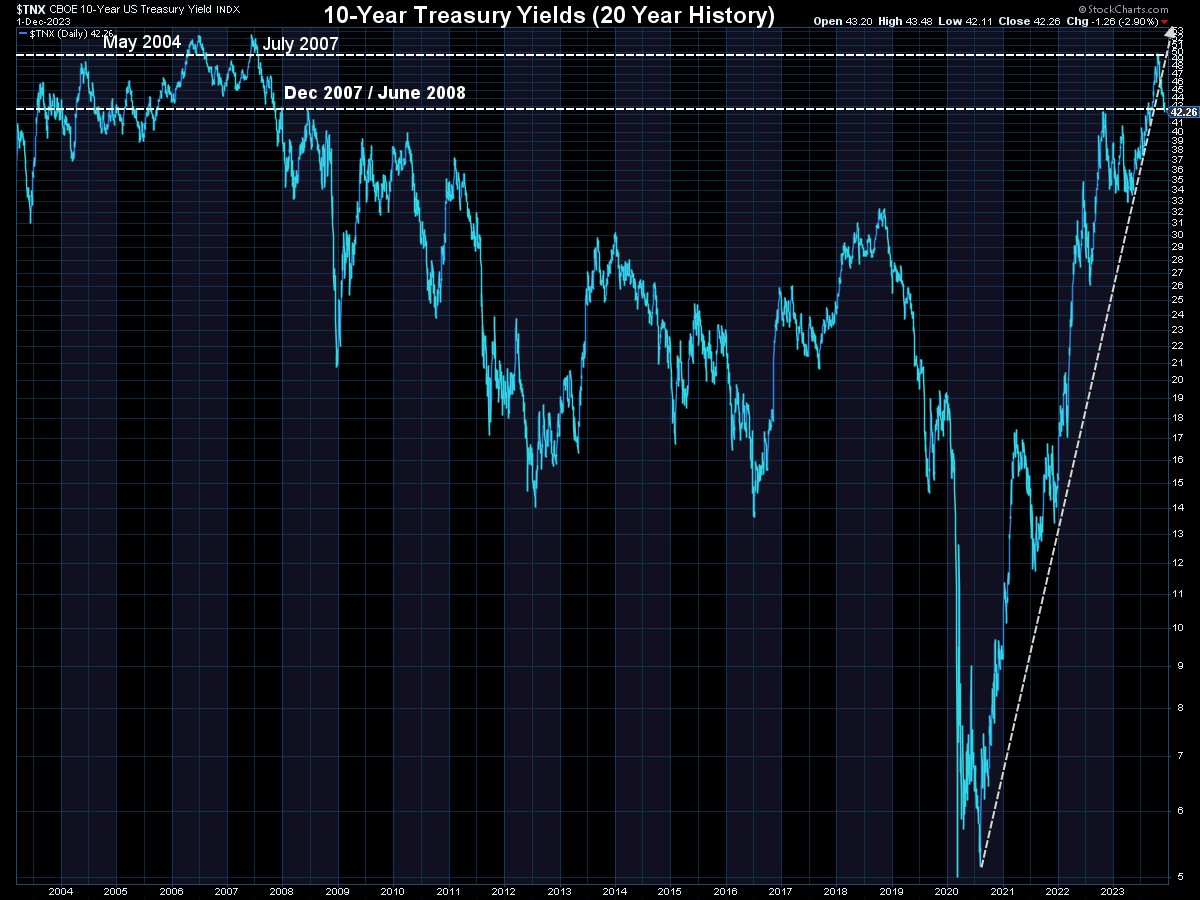
More importantly, the interest rate environment is much different than we've enjoyed the past 15 years. This is likely going to be a problem in the coming years for both investors and businesses.
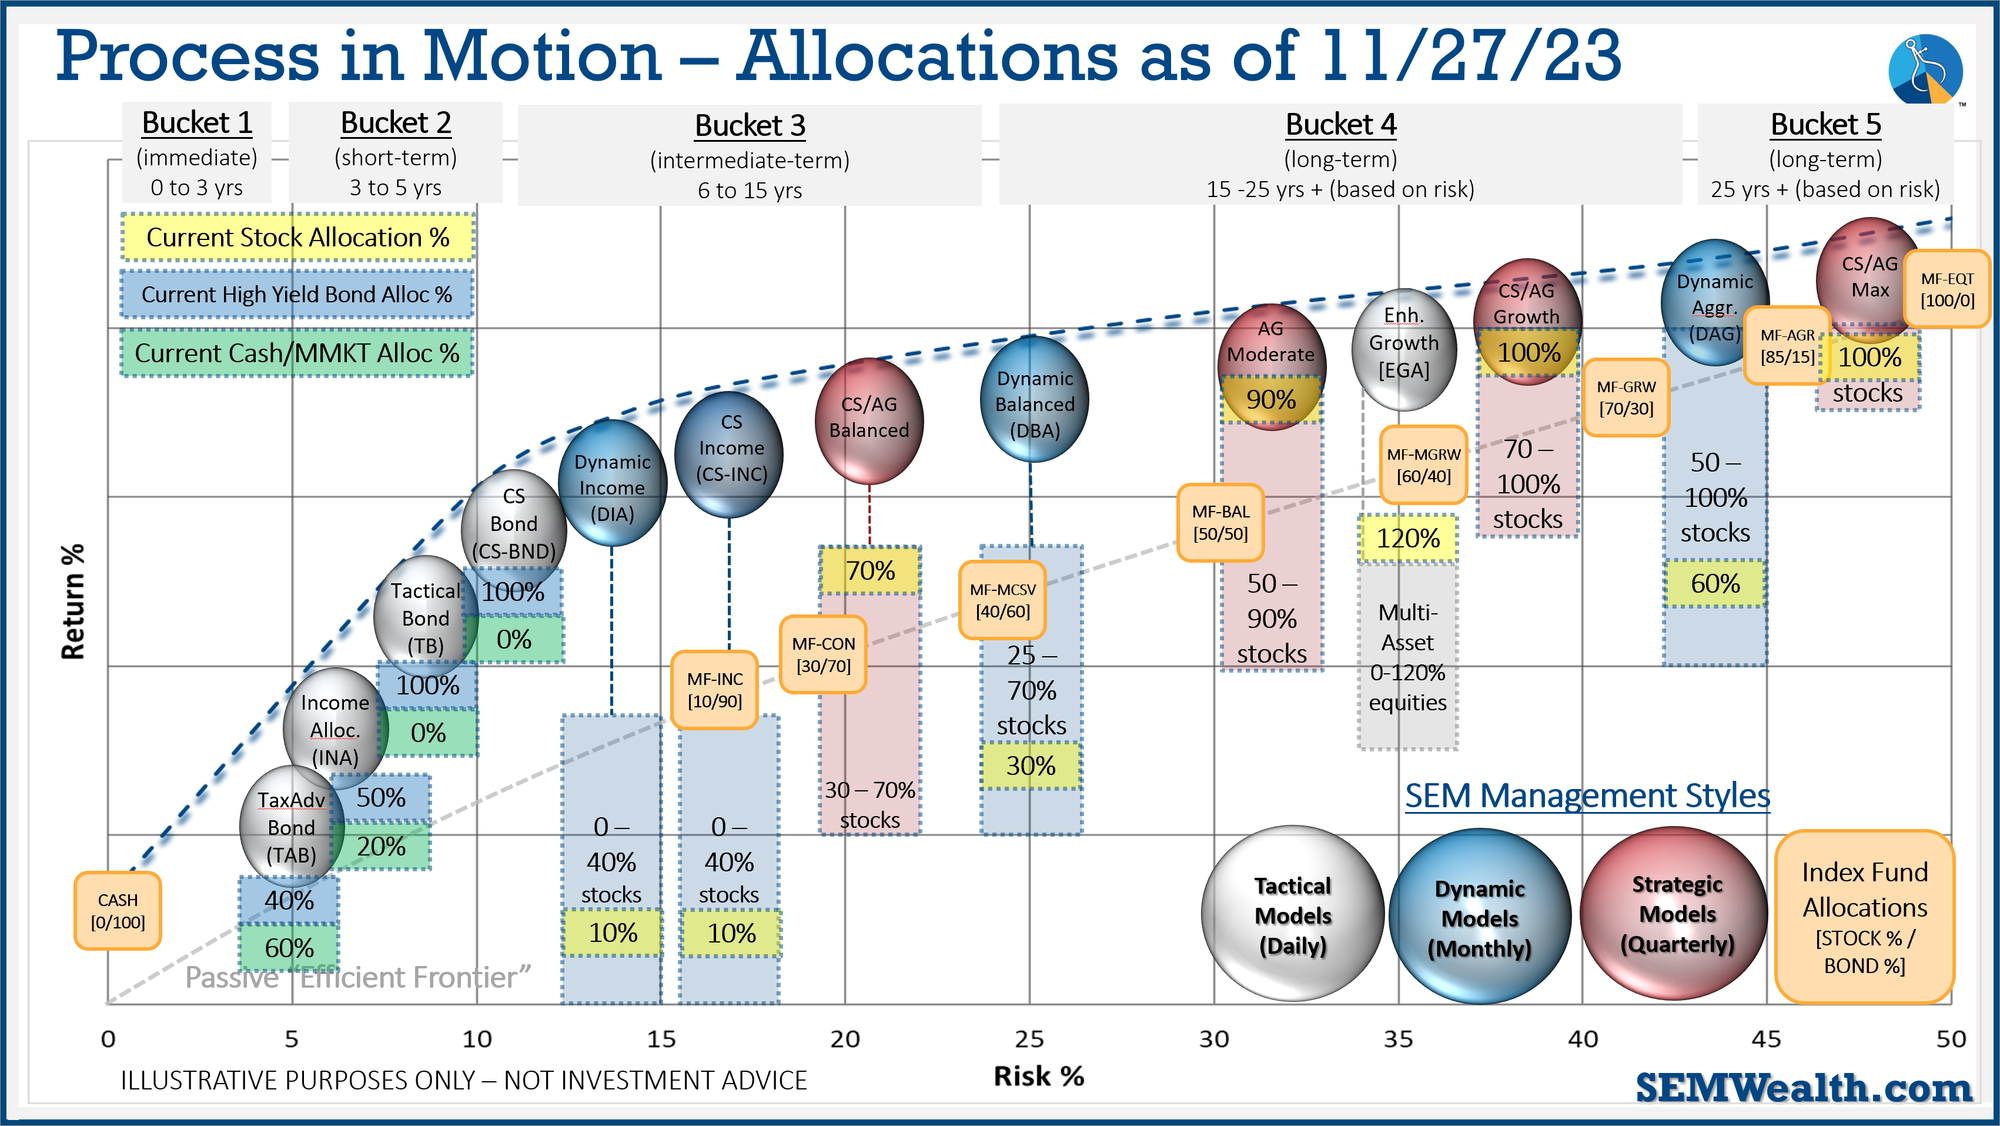
SEM Model Positioning
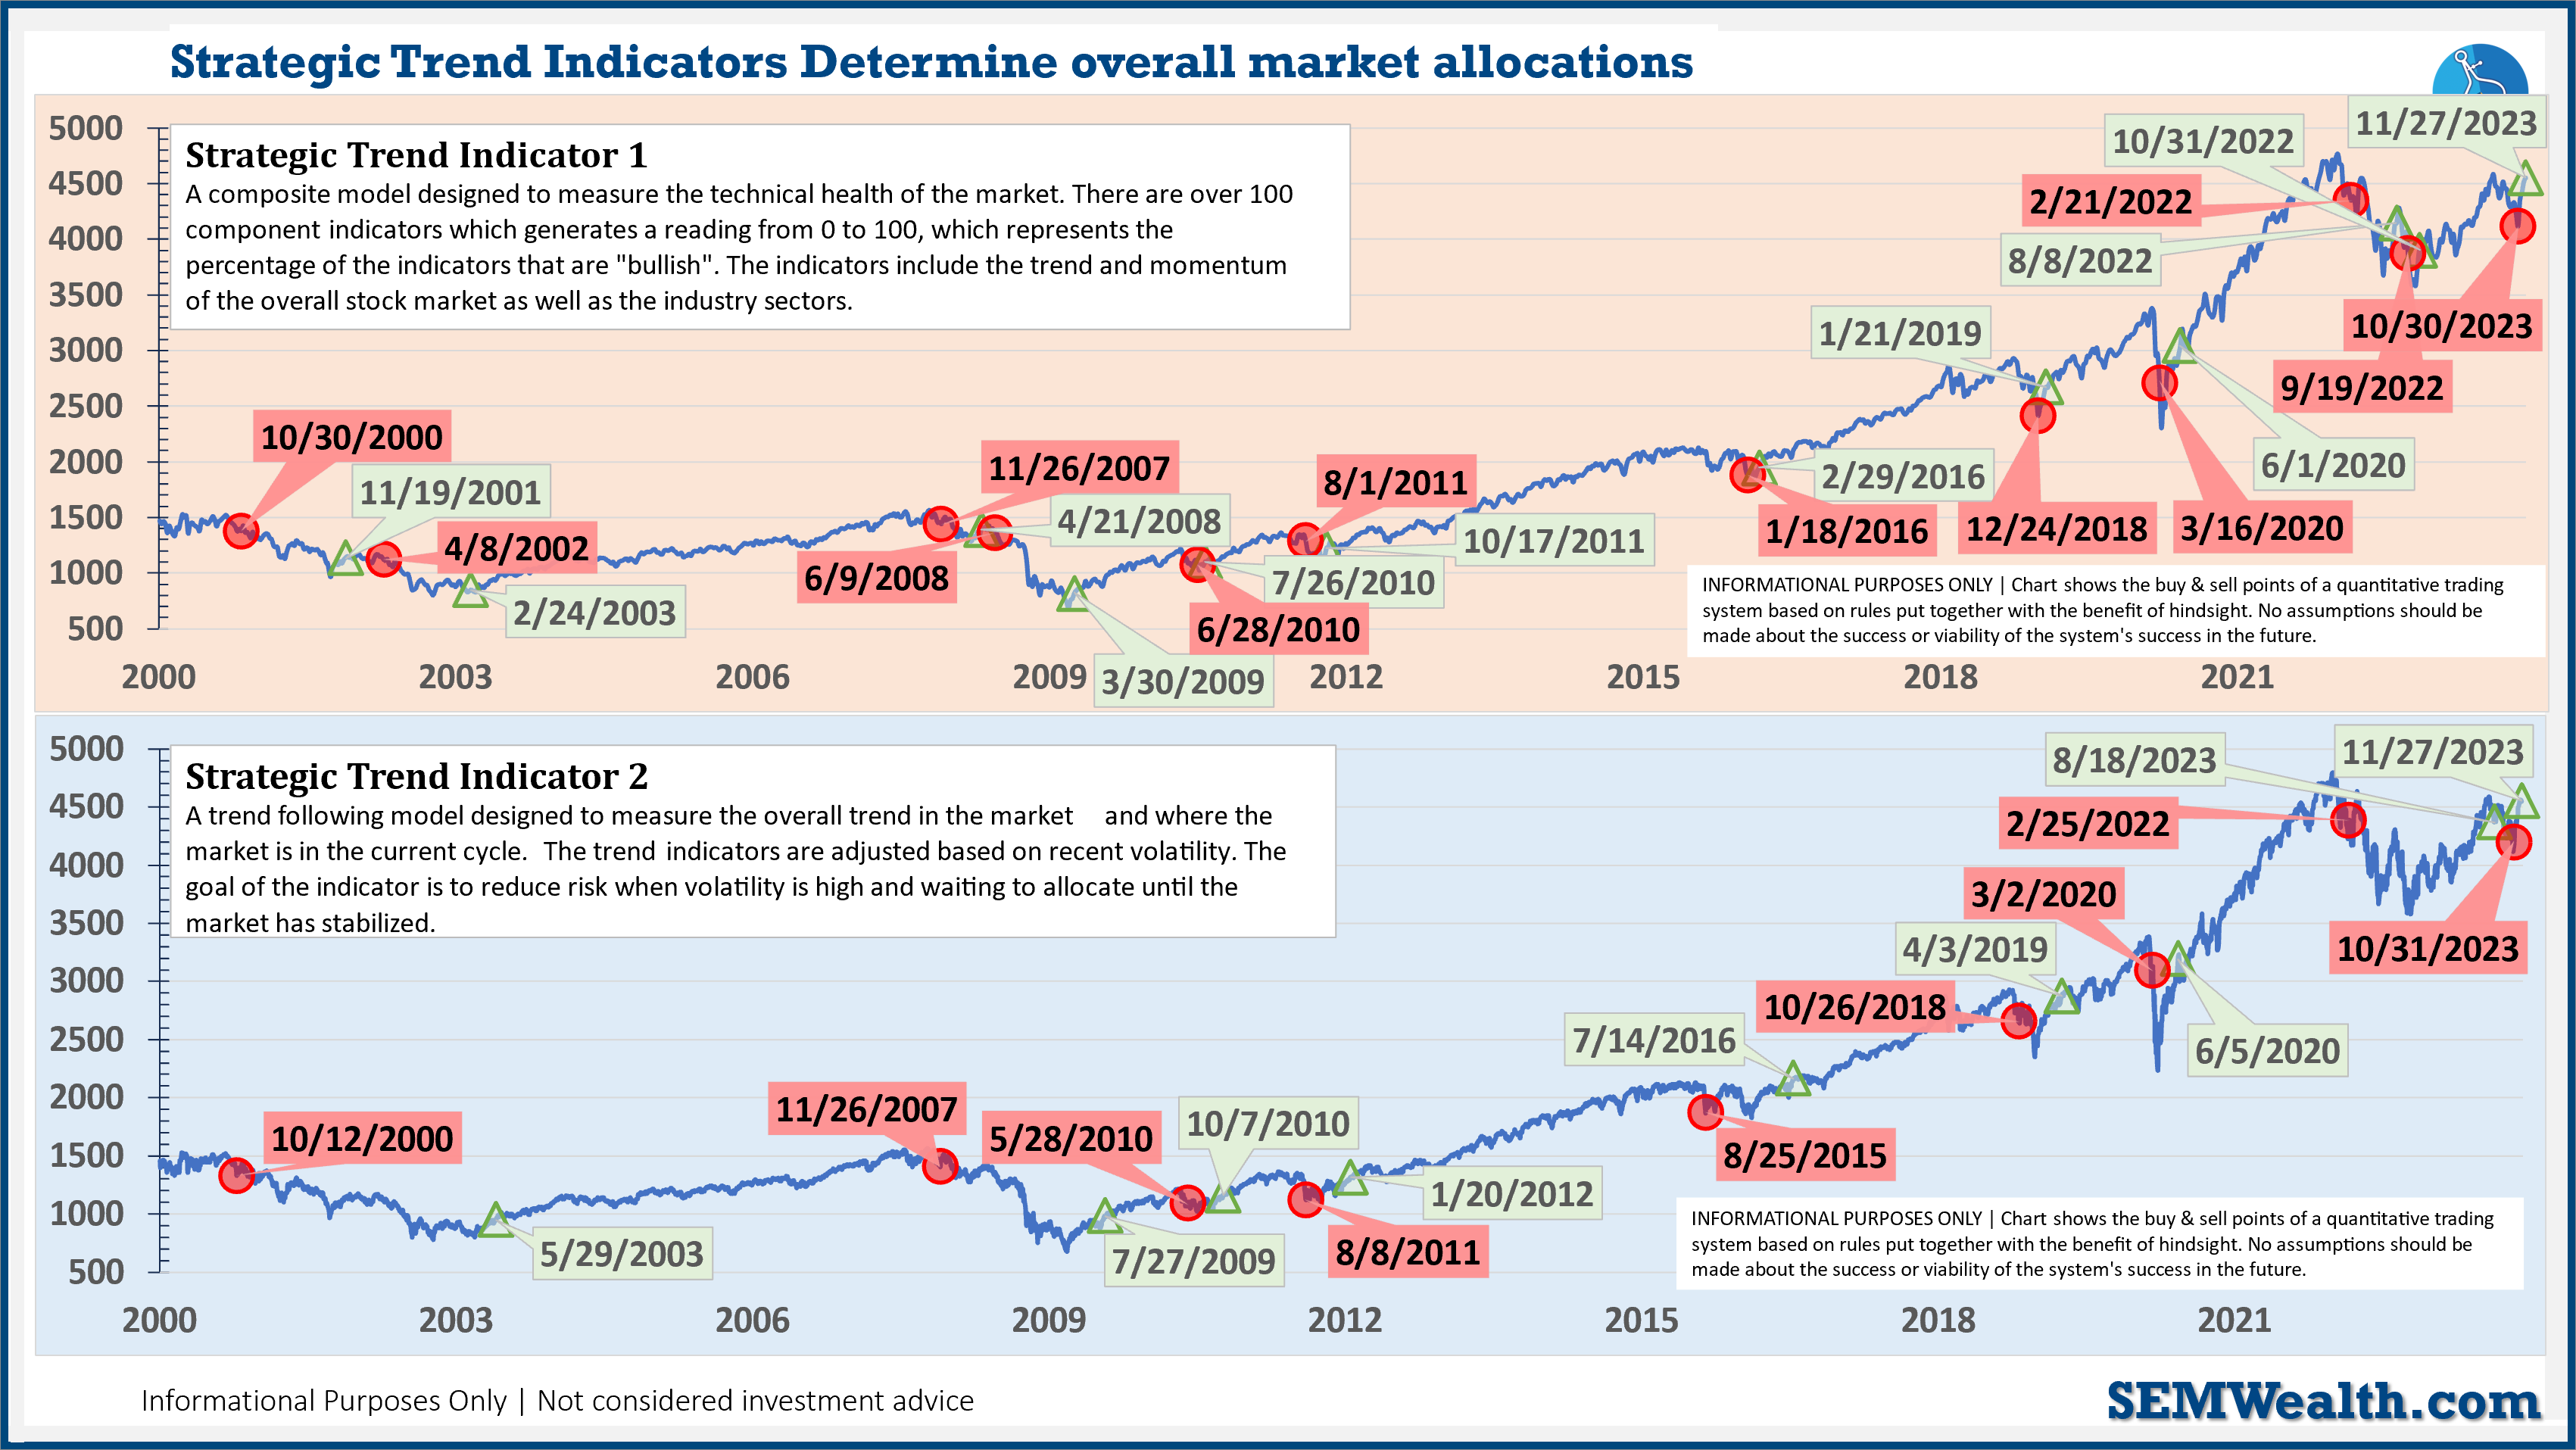
SEM's Strategic Trend Models went on a buy 11/27/2023
SEM deploys 3 distinct approaches – Tactical, Dynamic, and Strategic. These systems have been described as 'daily, monthly, quarterly' given how often they may make adjustments. Here is where they each stand.
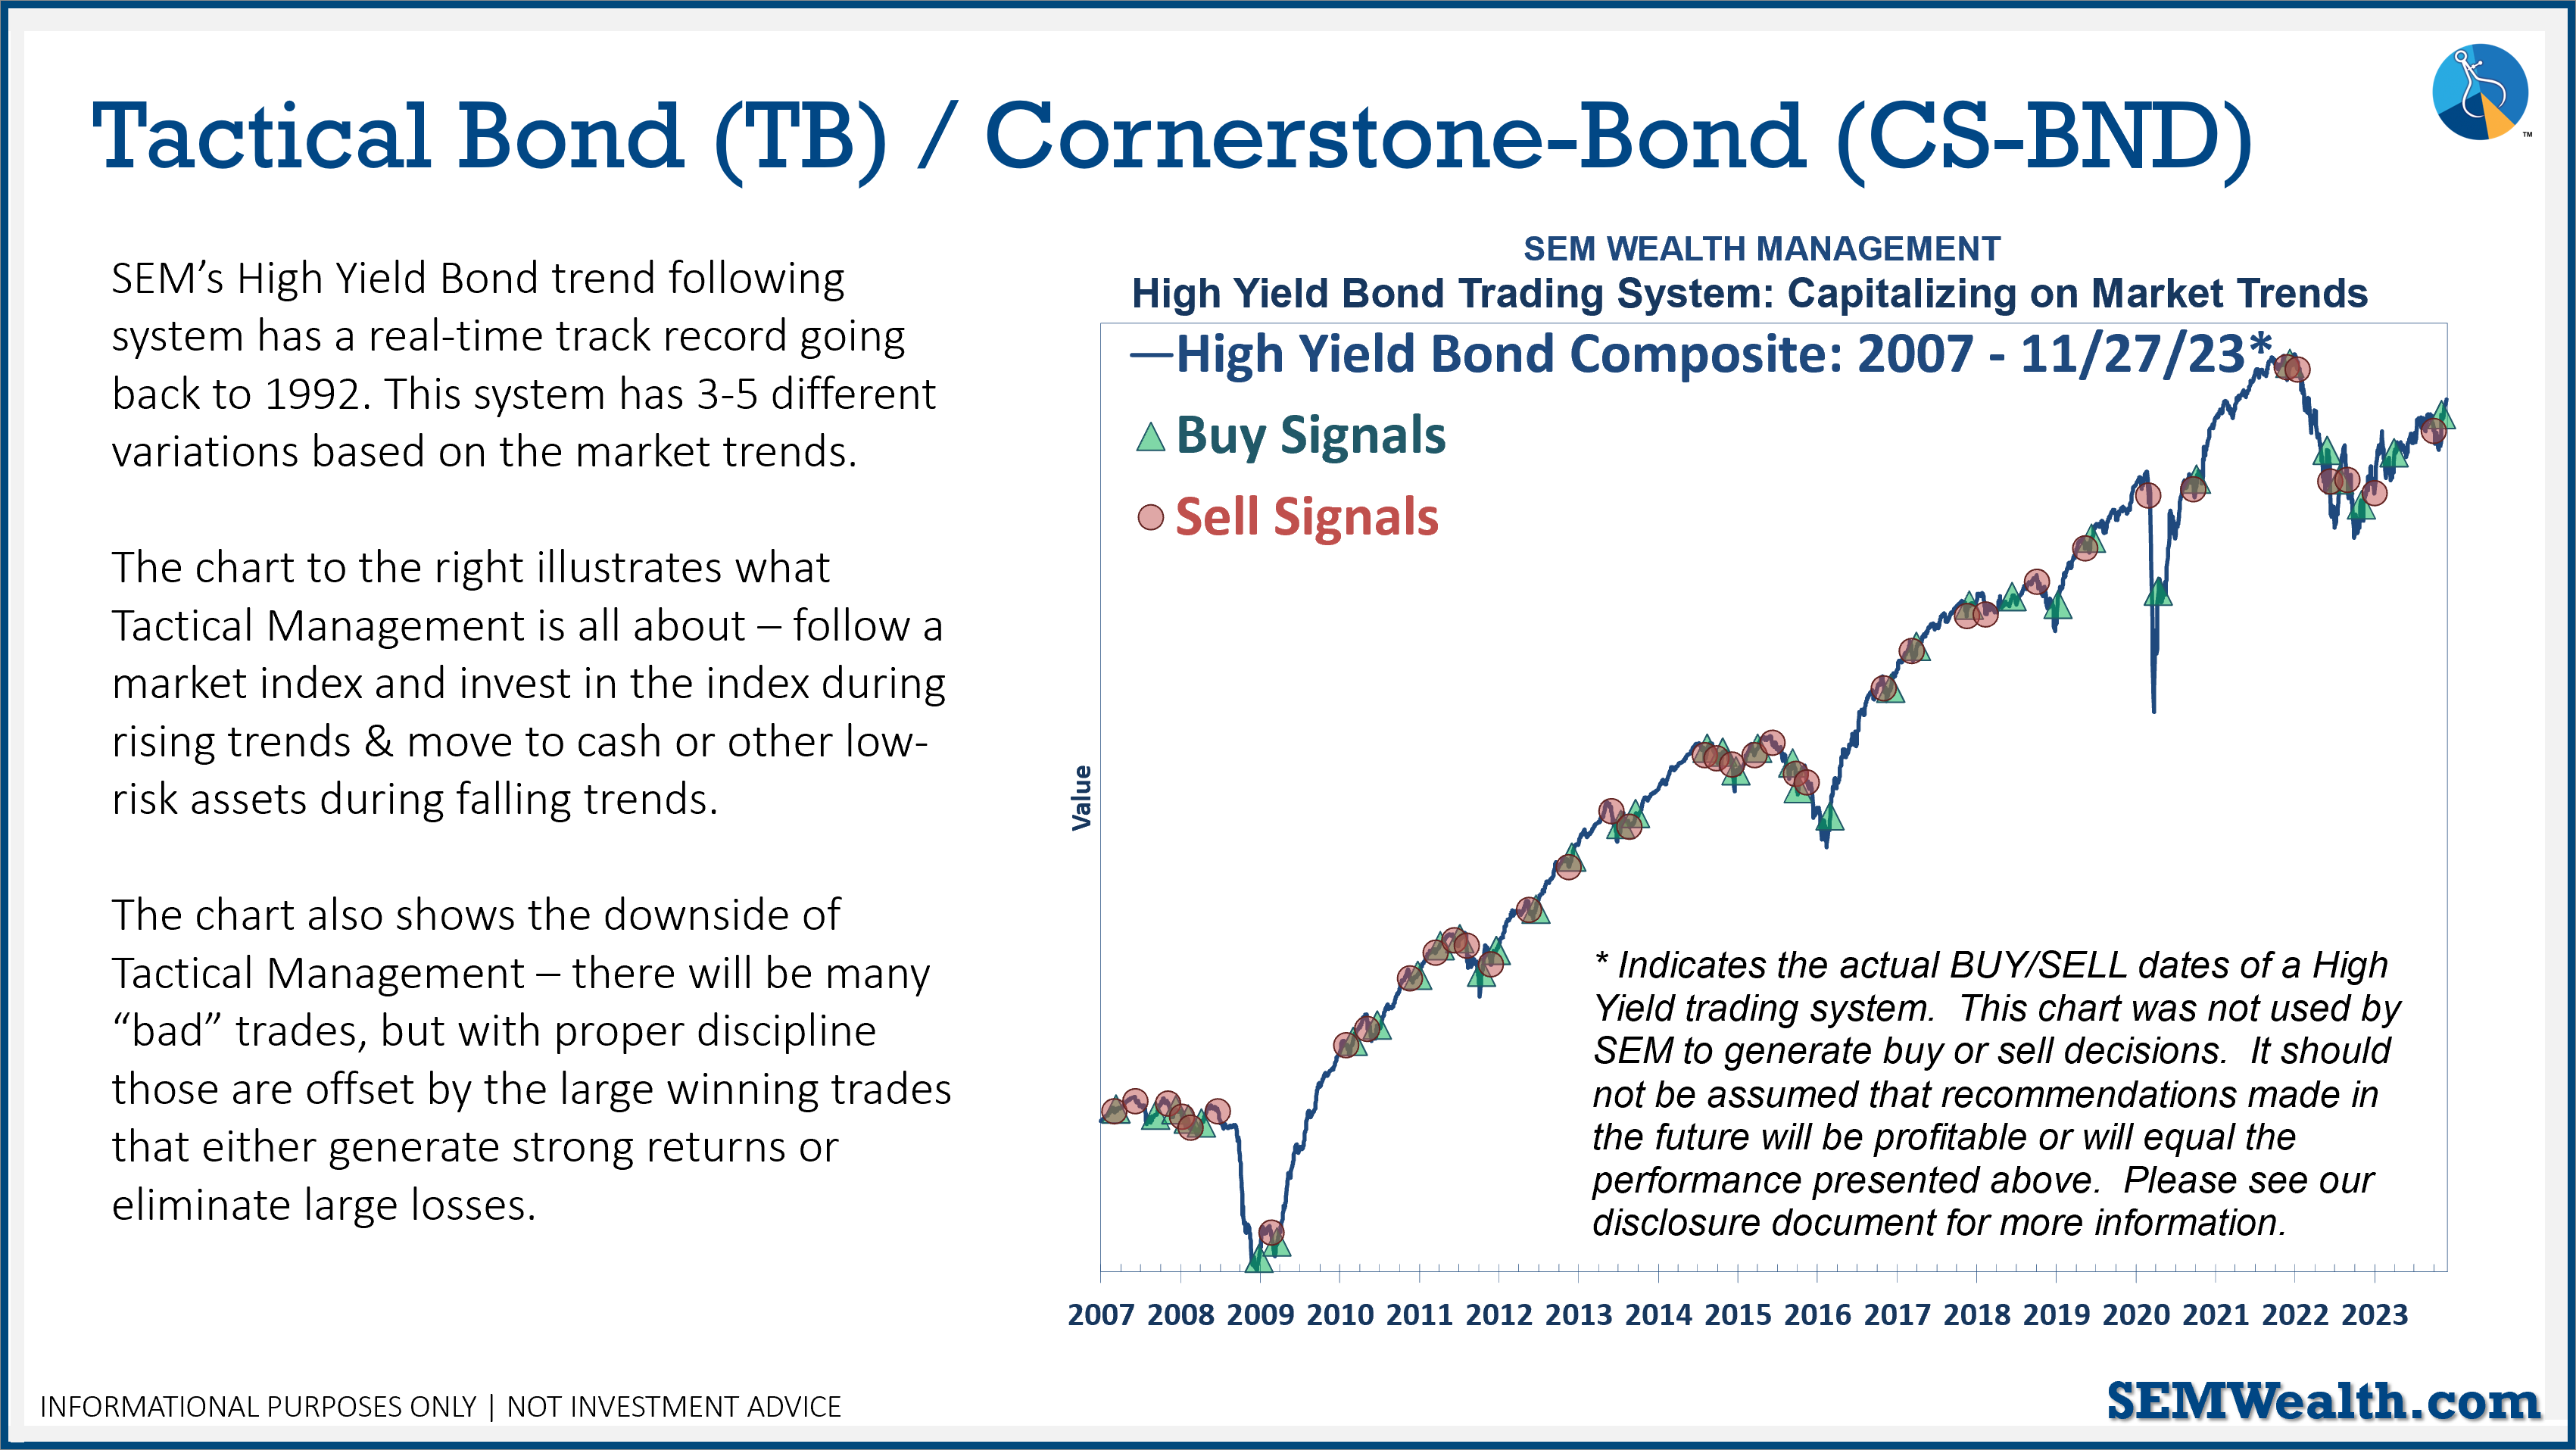
Tactical (daily): The High Yield Bond system bought the beginning of April and issued all 3 sell signals 9/28/2023. All 3 systems were back on buy signals by the close on 11/3/2023. The bond funds we are invested in are a bit more 'conservative' than the overall index, but still yielding between 7.5 -8.5% annually.
Dynamic (monthly): At the beginning of October the model moved slightly off the "bearish" signal we've had since April 2022. This means a small position in dividend stocks (Dynamic Income) and small cap stocks (Dynamic Aggressive Growth). Other than that, the models remain 'bearish' and is closer to going back to fully 'bearish' than it is to moving to 'neutral'.
Strategic (quarterly)*:
BOTH Trend Systems reversed back to a buy on 11/27/2023
The core rotation is adjusted quarterly. On August 17 it rotated out of mid-cap growth and into small cap value. It also sold some large cap value to buy some large cap blend and growth. The large cap purchases were in actively managed funds with more diversification than the S&P 500 (banking on the market broadening out beyond the top 5-10 stocks.)
The * in quarterly is for the trend models. These models are watched daily but they trade infrequently based on readings of where each believe we are in the cycle. The trend systems can be susceptible to "whipsaws" as we saw with the recent sell and buy signals at the end of October and November. The goal of the systems is to miss major downturns in the market. Risks are high when the market has been stampeding higher as it has for most of 2023. This means sometimes selling too soon. As we saw with the recent trade, the systems can quickly reverse if they are wrong.
Overall, this is how our various models stock up: