There are certain terms on Wall Street which get thrown around quite a bit that few people understand. Even those of us who follow the market closely may not understand the meaning of the latest buzzword used to describe the market or economy. The most frequently used word this year has been 'Goldilocks'.
This of course is adopted from the story of Goldilocks and the Three Bears where the main character seeks the 'just right' porridge, chairs, and beds of the bear family's house she broke into. The stock market this year has been on a tear (at least the mega cap growth/technology stocks have, which have been pulling the indexes higher). The idea is the economy is 'just right' – not too hot which would lead to the Fed continuing their inflation fight, but also not too cold where we will see a drop in corporate earnings.
On the surface, I think this is what the data is saying (for now). Let's take a walk through SEM's economic model.
Strong Indicators
-Jobs
The labor market continues to produce 'new' jobs at a rate indicative of an economic expansion.
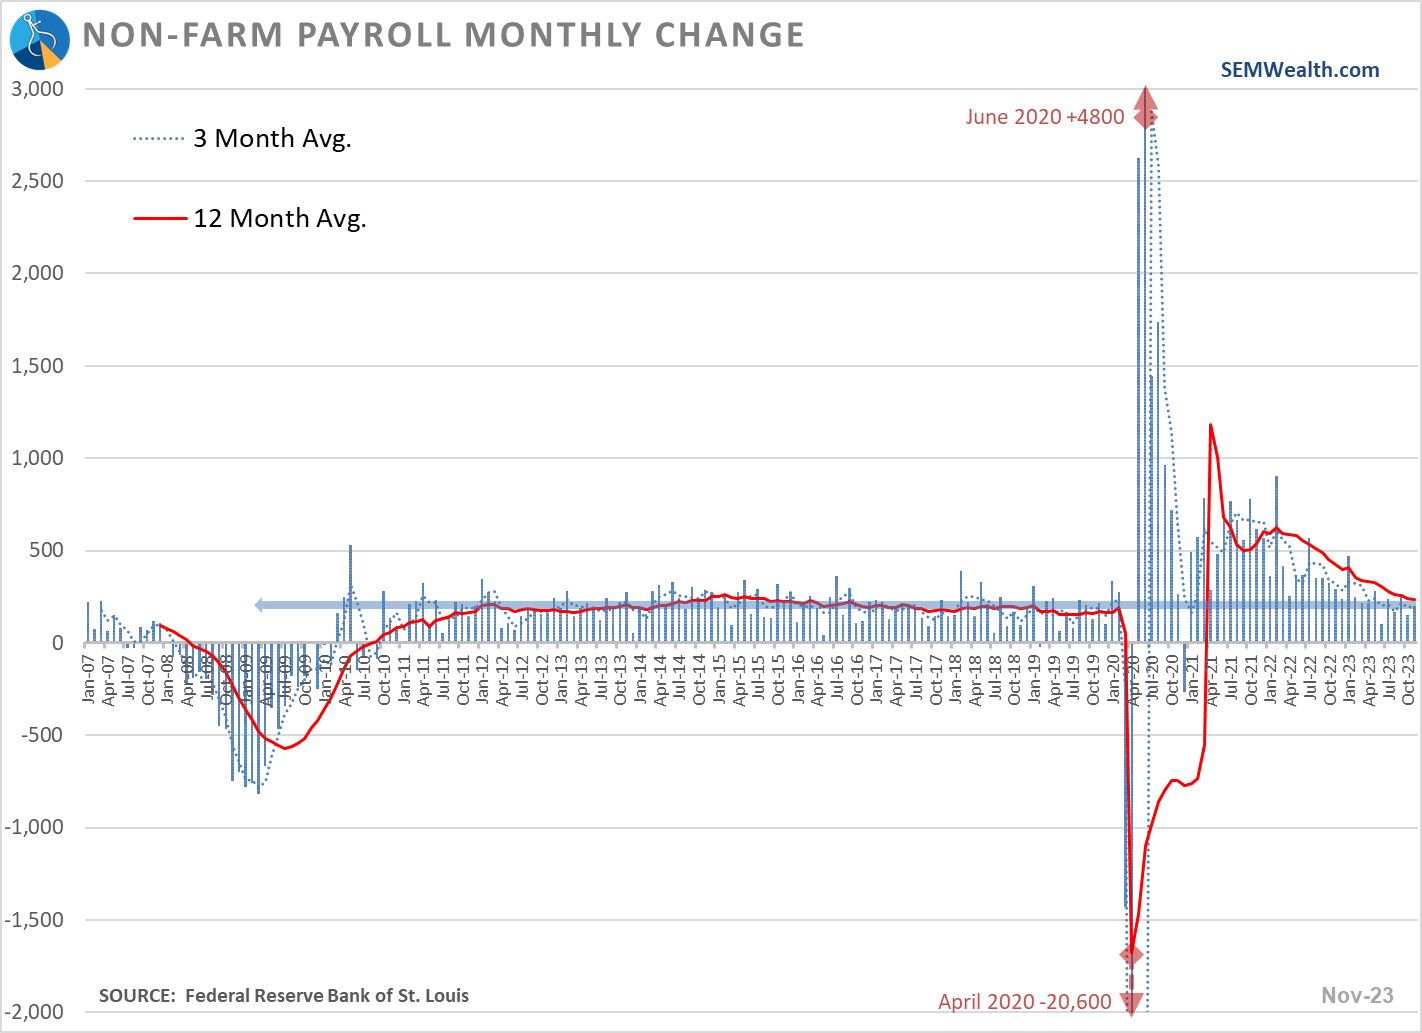
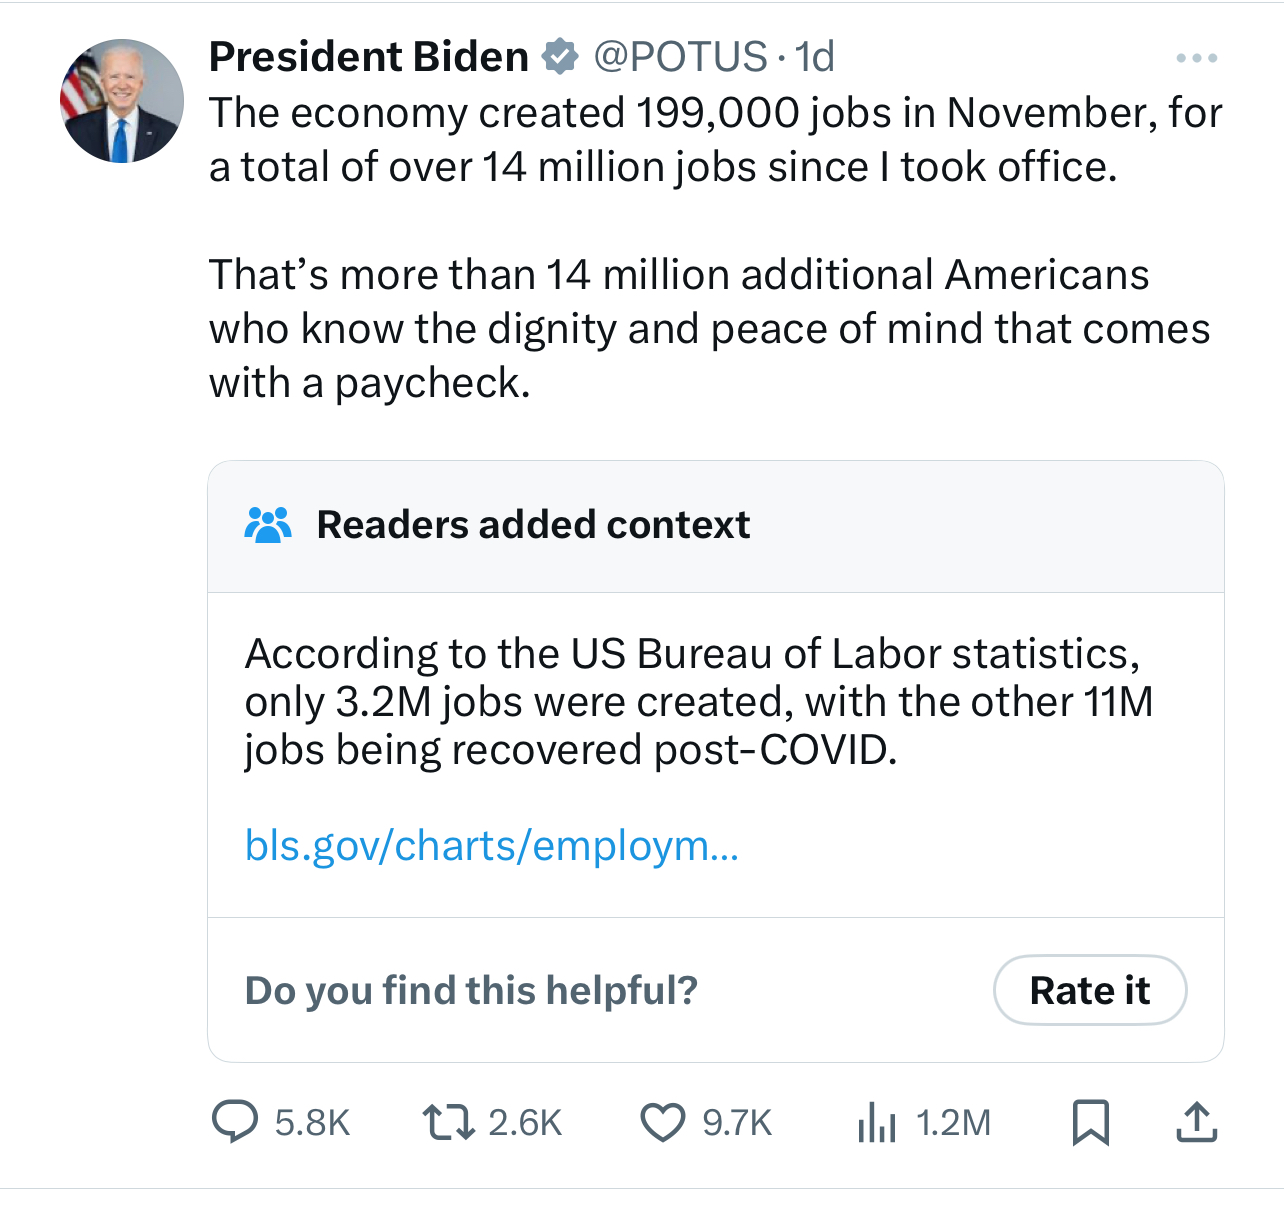
For everything wrong that Elon Musk has done with the platform formerly known as Twitter, there is one nice feature — reader based 'context'. I saw this over the weekend to frame the jobs numbers more correctly......11 million of the 14 million 'new' jobs were simply replacing the ones lost during COVID.
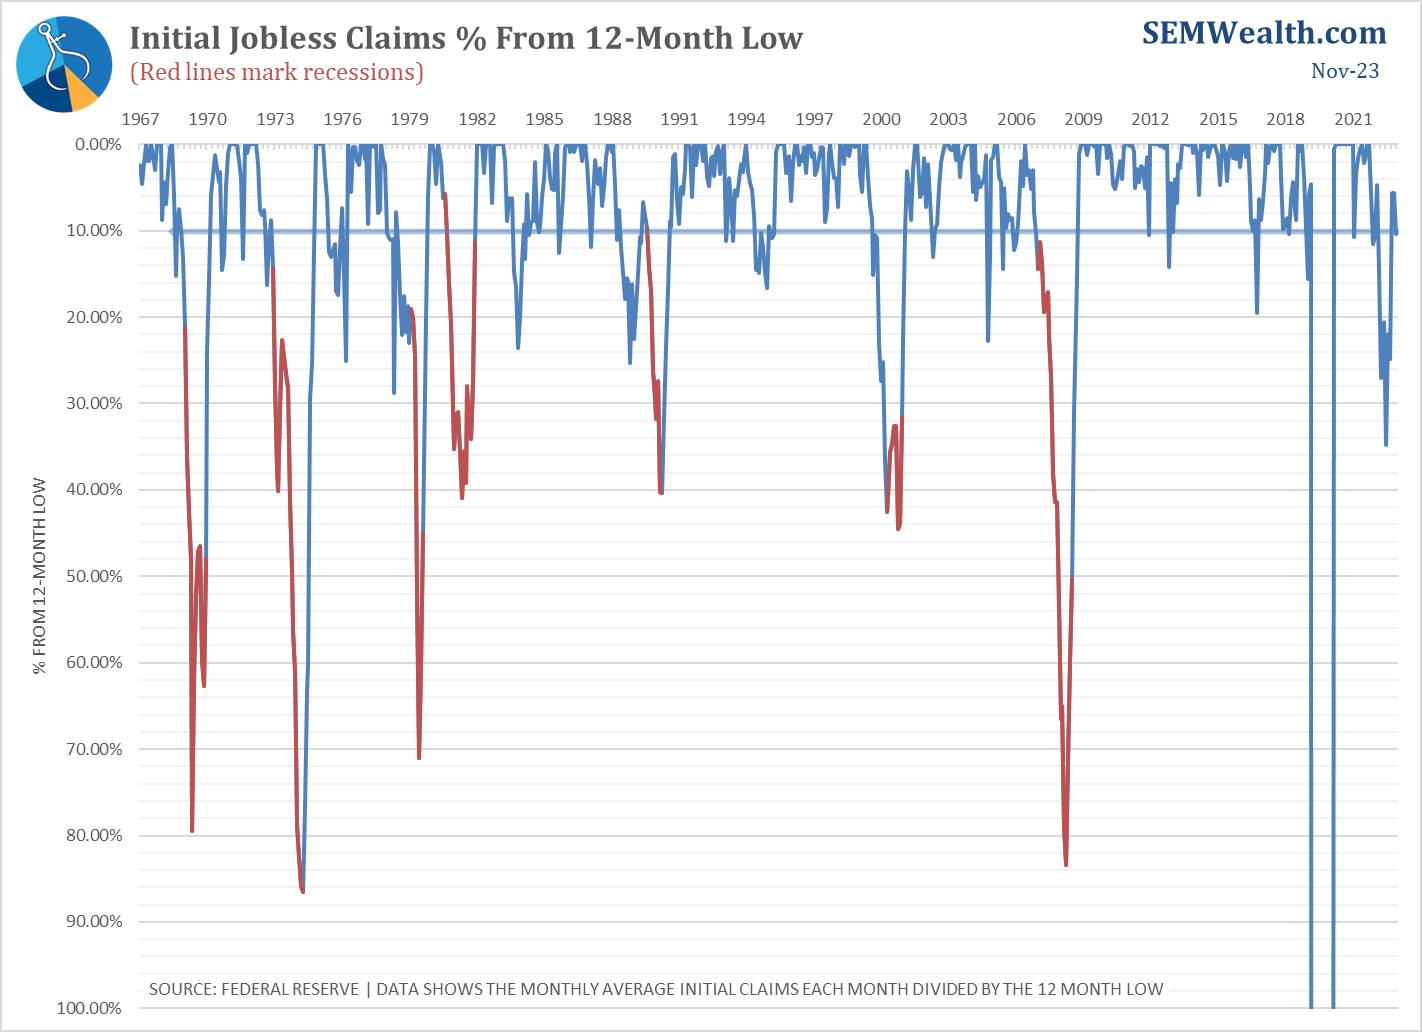
The problem is many of these jobs are 'easy come, easy go' service jobs. We continue to watch Initial Unemployment Claims which are flashing a warning sign (but not as bright as it was a month ago).
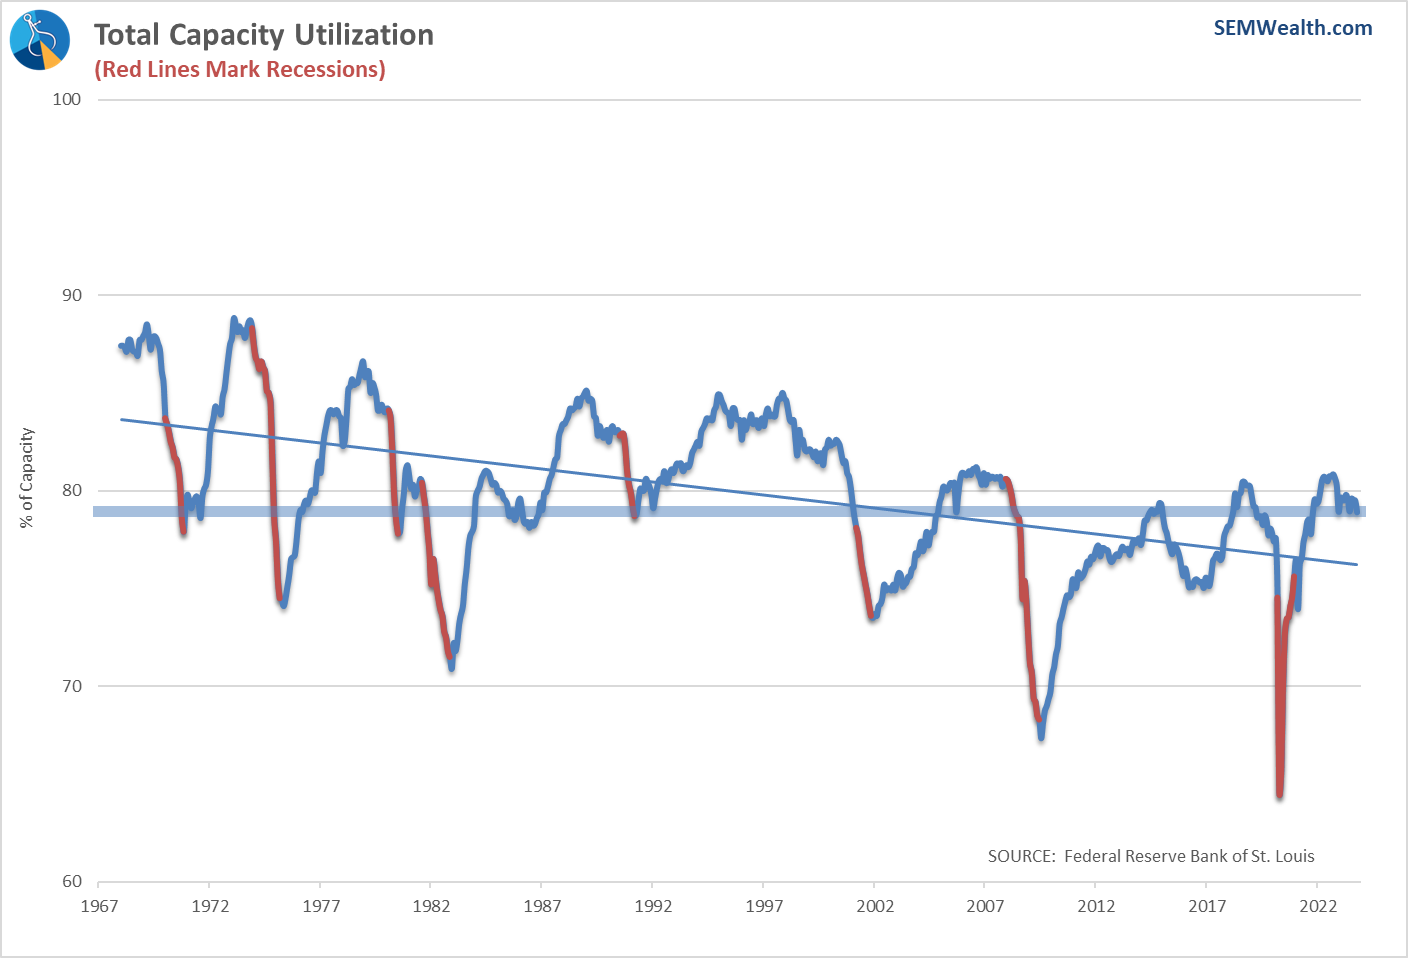
-Capacity Utilization
Relative to the past decade, Capacity Utilization (what percentage of the country's manufacturing capabilities are active). I continue to chalk this up to a 'benefit' of COVID as we realized we cannot rely on one region of the world for all of our supply chain.
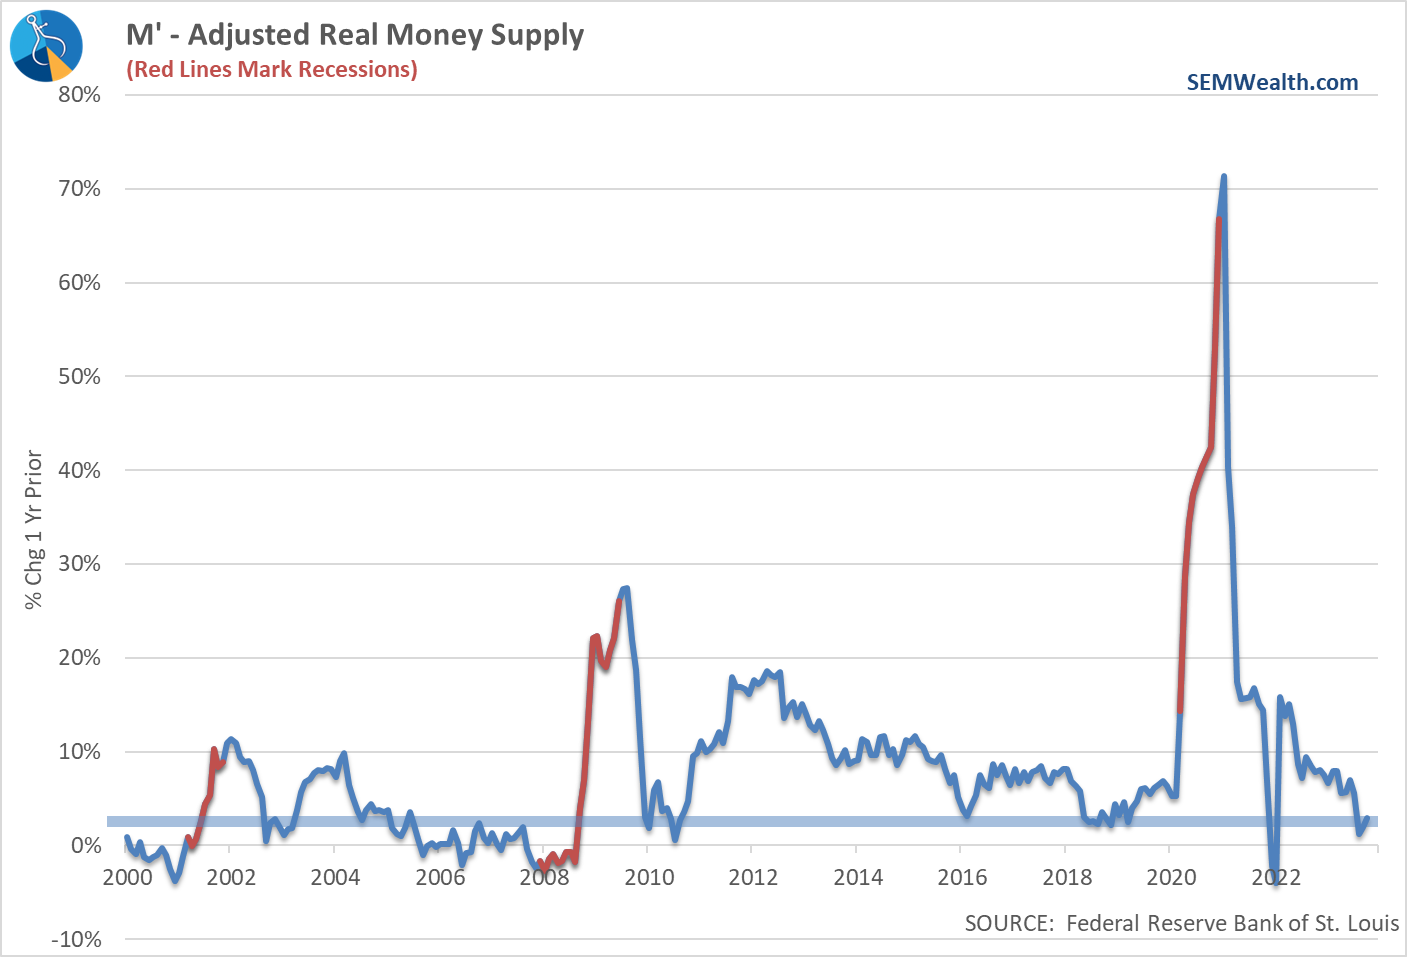
-Money Supply
For all the talk of the Fed 'tightening', the Real Adjusted Money Supply (which takes into account investment & brokerage money market assets) continues to grow. It may be a slower rate than the past couple of years, but this is still stimulating the economy.
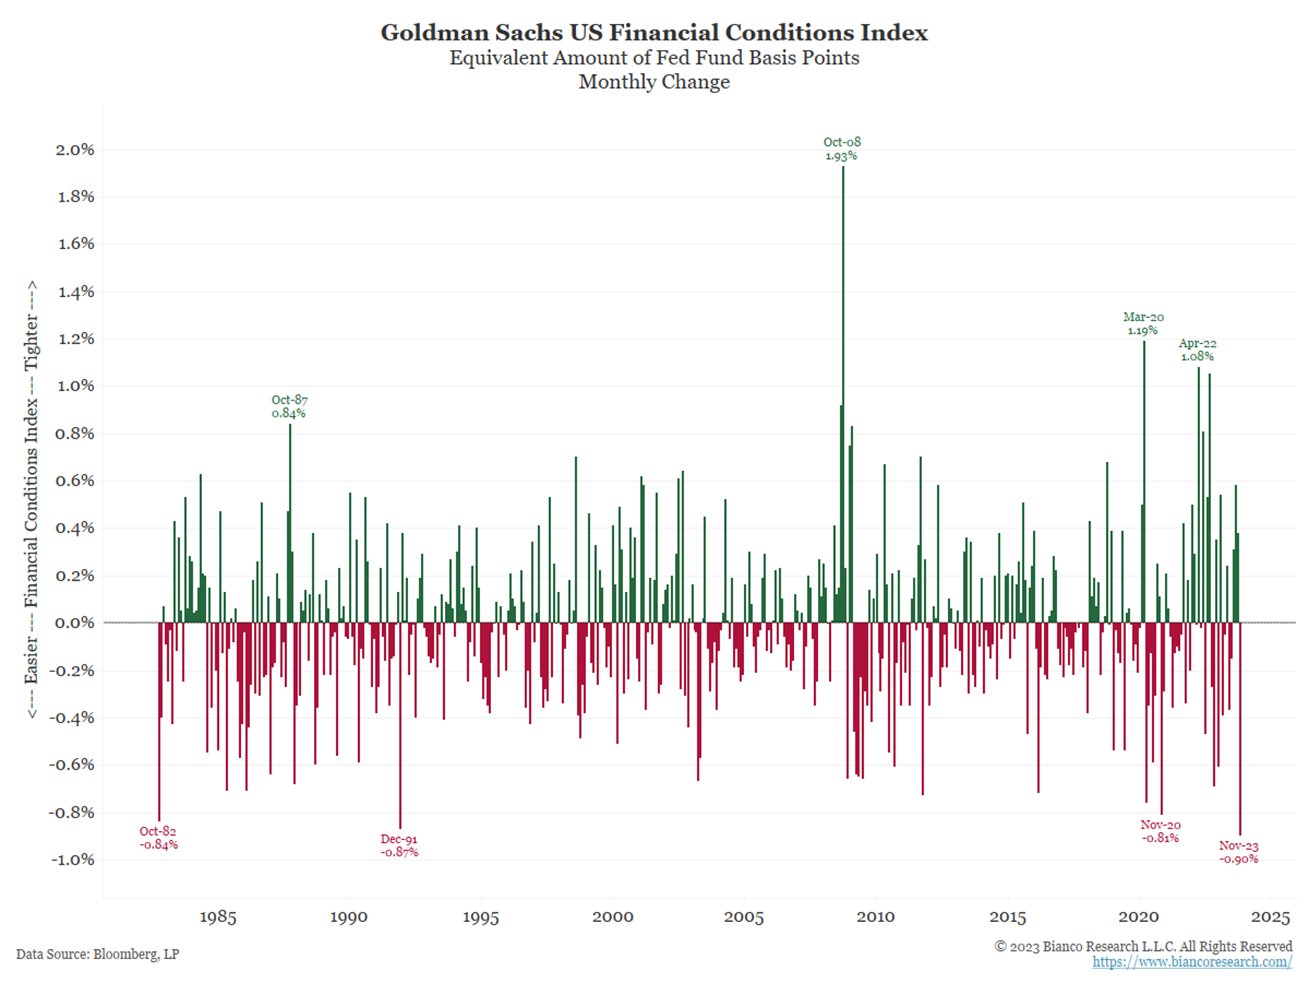
Even more fascinating the 'financial conditions' index, a measure calculated by Goldman Sachs to look at the overall financial system eased at a RECORD 90 bps in November. This could make the Fed look closely at their policies as loose financial conditions are not a recipe to control inflation.
Flattening Indicators
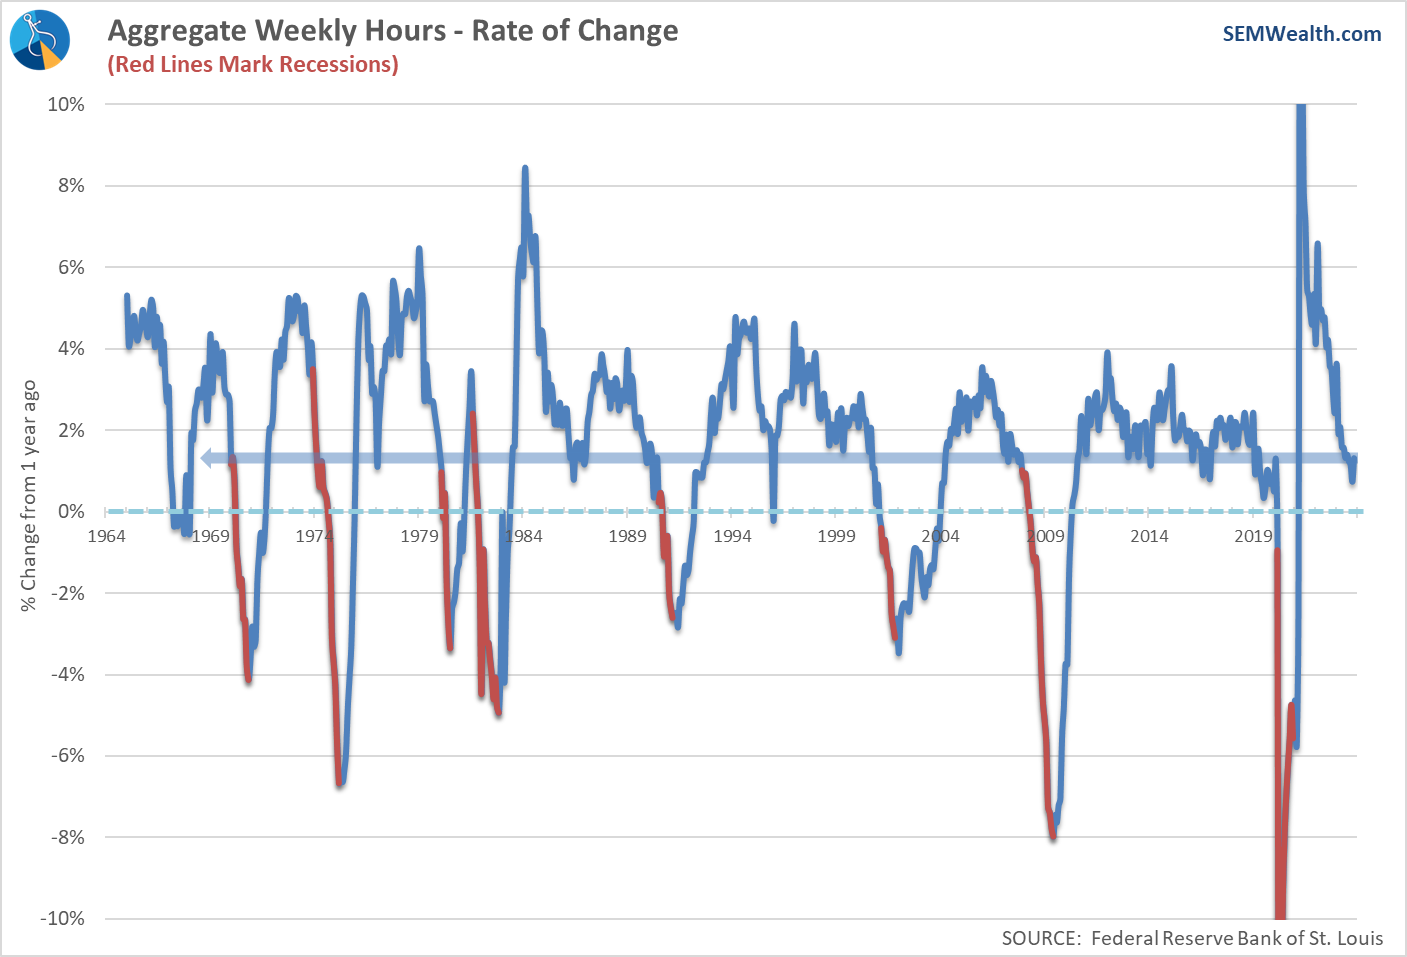
-Hours Worked
This indicator continues to be on my watch list as a leading indicator of jobs.
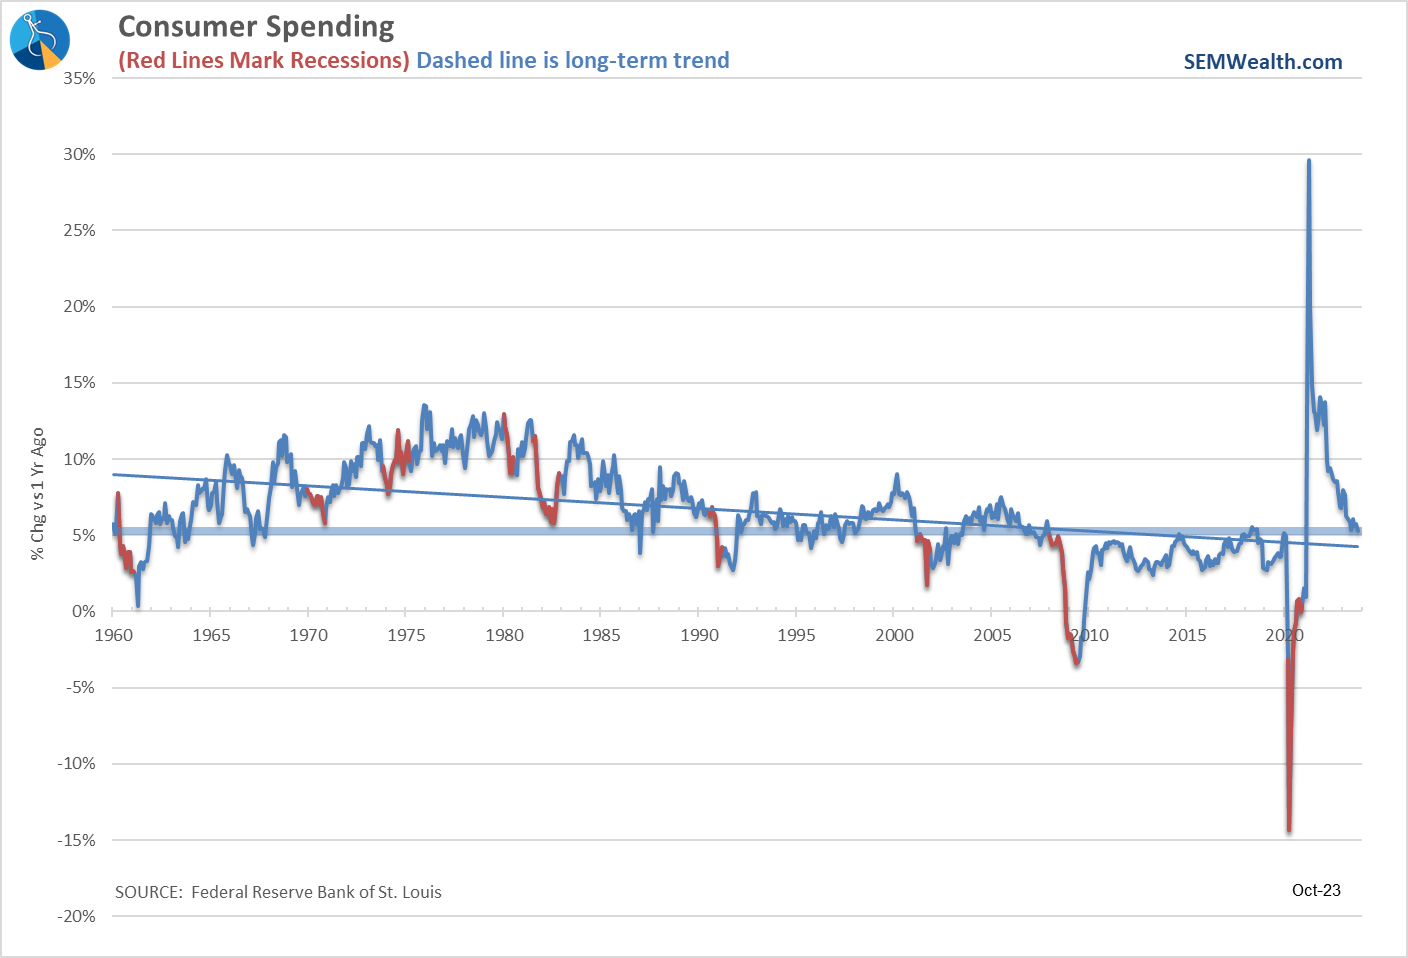
-Consumer Spending
While still strong, consumer spending may be coming down to earth. It will be interesting to see what happens post-holidays.
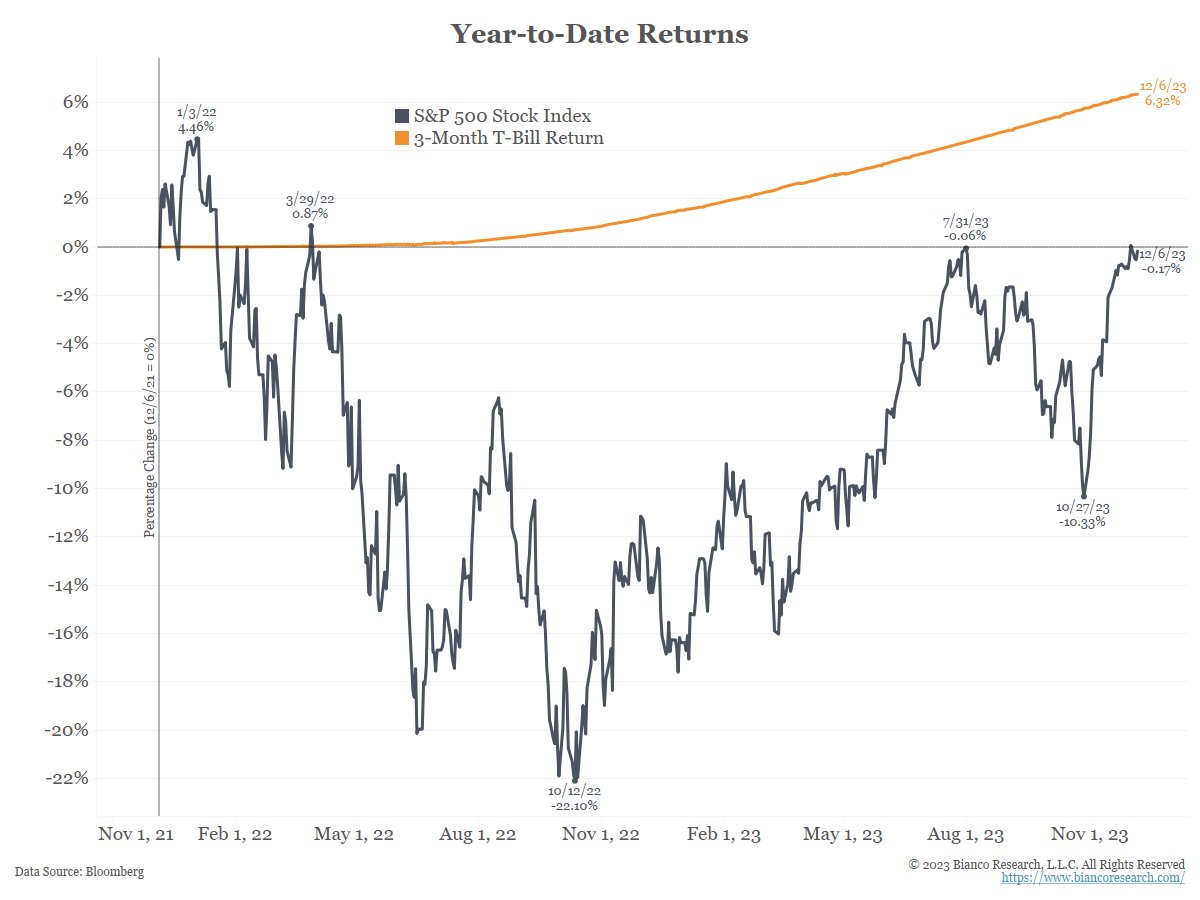
-Stock Prices
Despite the mania in 2023, stocks are almost exactly where they were 2 years ago. Check out another great chart from Jim Bianco of Bianco research showing the returns since November 1, 2021.
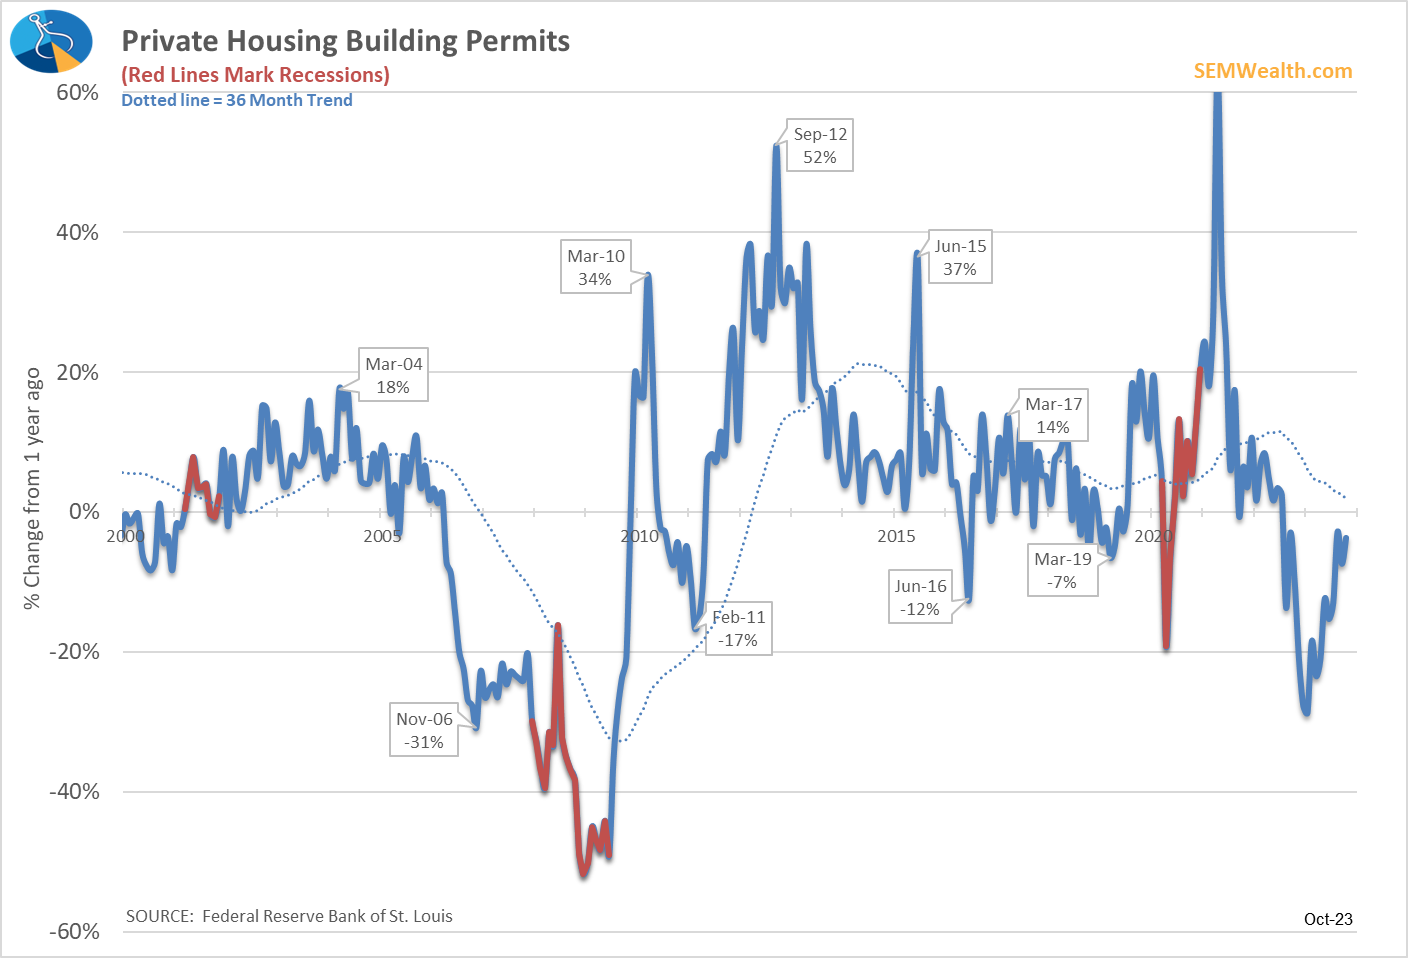
-Building Permits
This is a tough one to measure. Like manufacturing, the pandemic may have caused a big reset in the housing market. Our population is still growing, so we need more homes. The problem is the big gap between homes built for now retiring Boomers and homes for Millennials wanting to buy their first home.
Permits are still declining a bit versus a year ago, but signs are increasing housing could pick up in 2024.
Weak Indicators
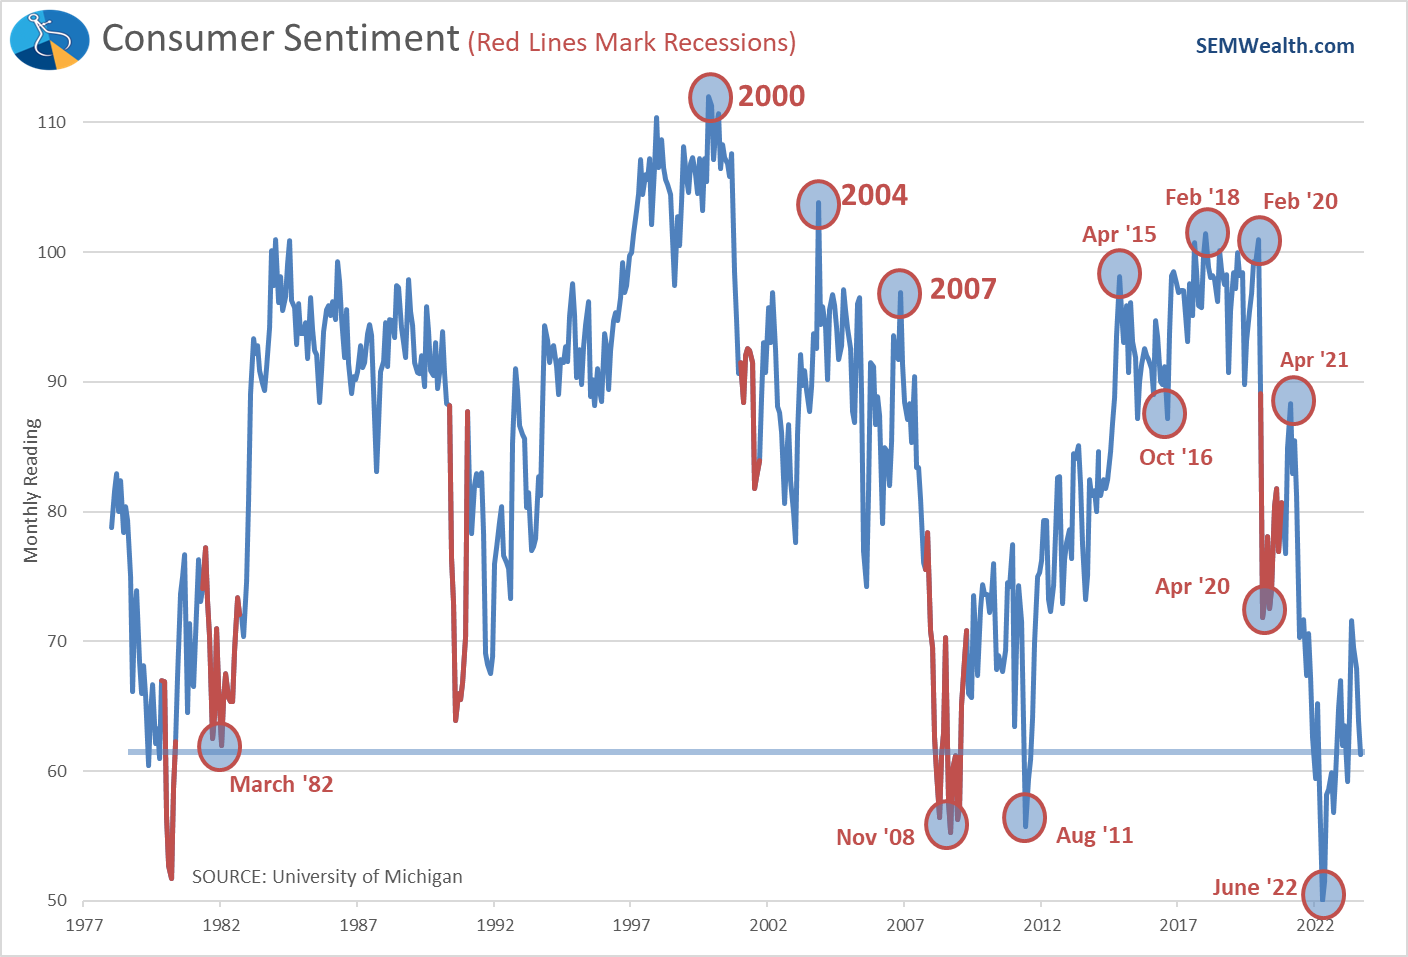
-Consumer Sentiment
This one confounds me. Consumers have spent money like the world was ending and they'd never have to pay it back, which typically happens when enthusiasm is high. Instead, sentiment remains close to the bottom of past economic slowdowns. Heading into what could be an even uglier presidential election than the past 2, it will be interesting to see if sentiment rebounds or moves to new lows.
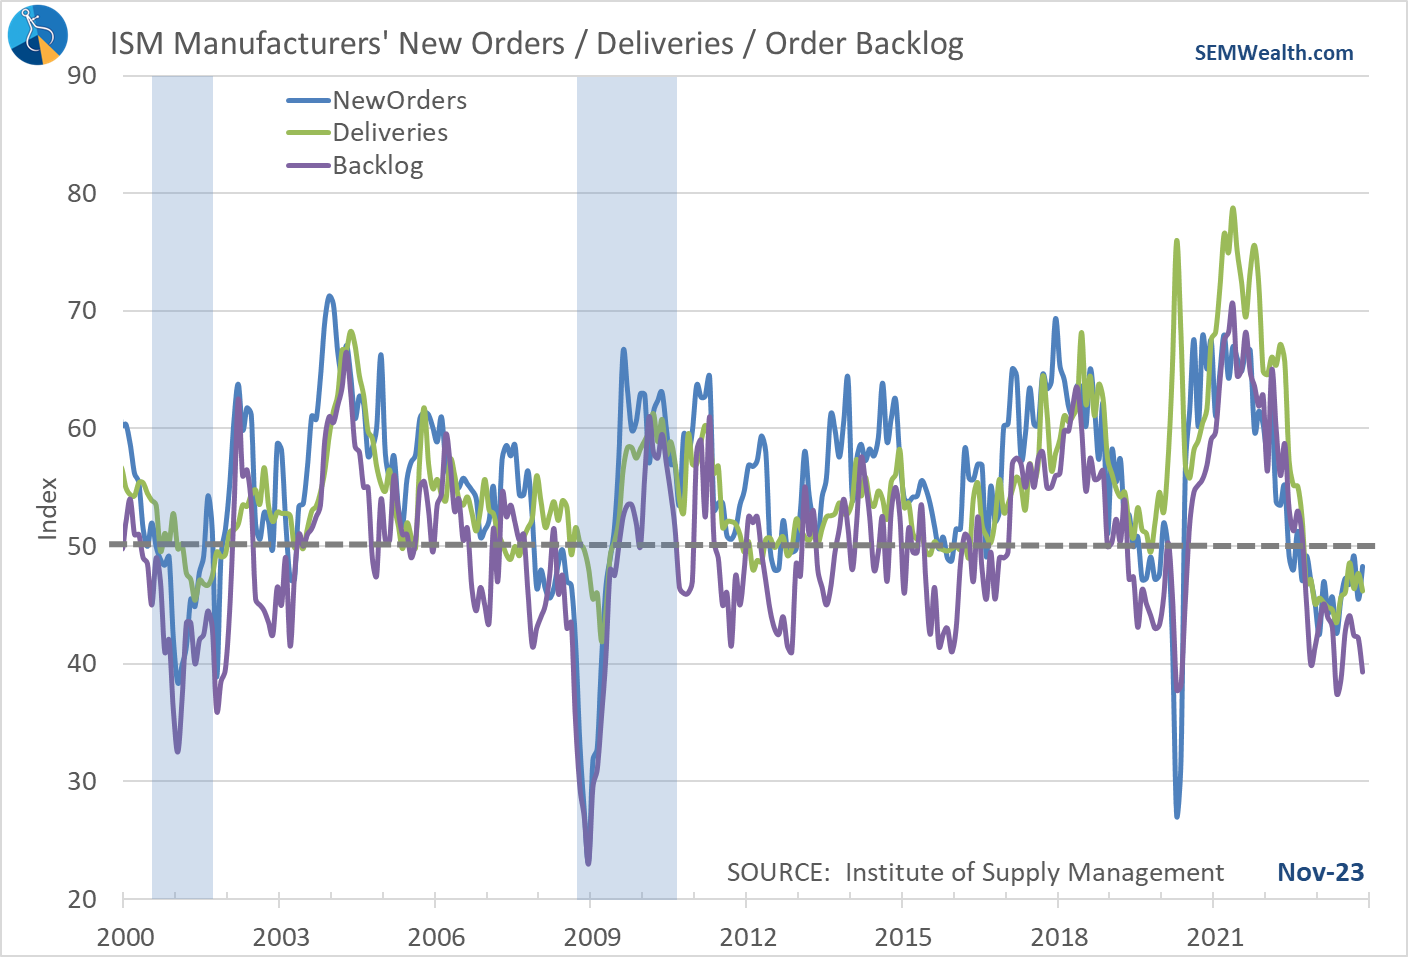
-Consumer Goods Orders
It seems everyone who used their stimulus money to buy large ticket 'stuff' has led to a months long recession in manufacturing. I put these indicators in the 'leading, leading' category meaning they turn lower well before anything else. We need to see a reversal in these to have hope for 2024's economic activity.
(Remember, a reading below 50 is an indicator of a contraction)
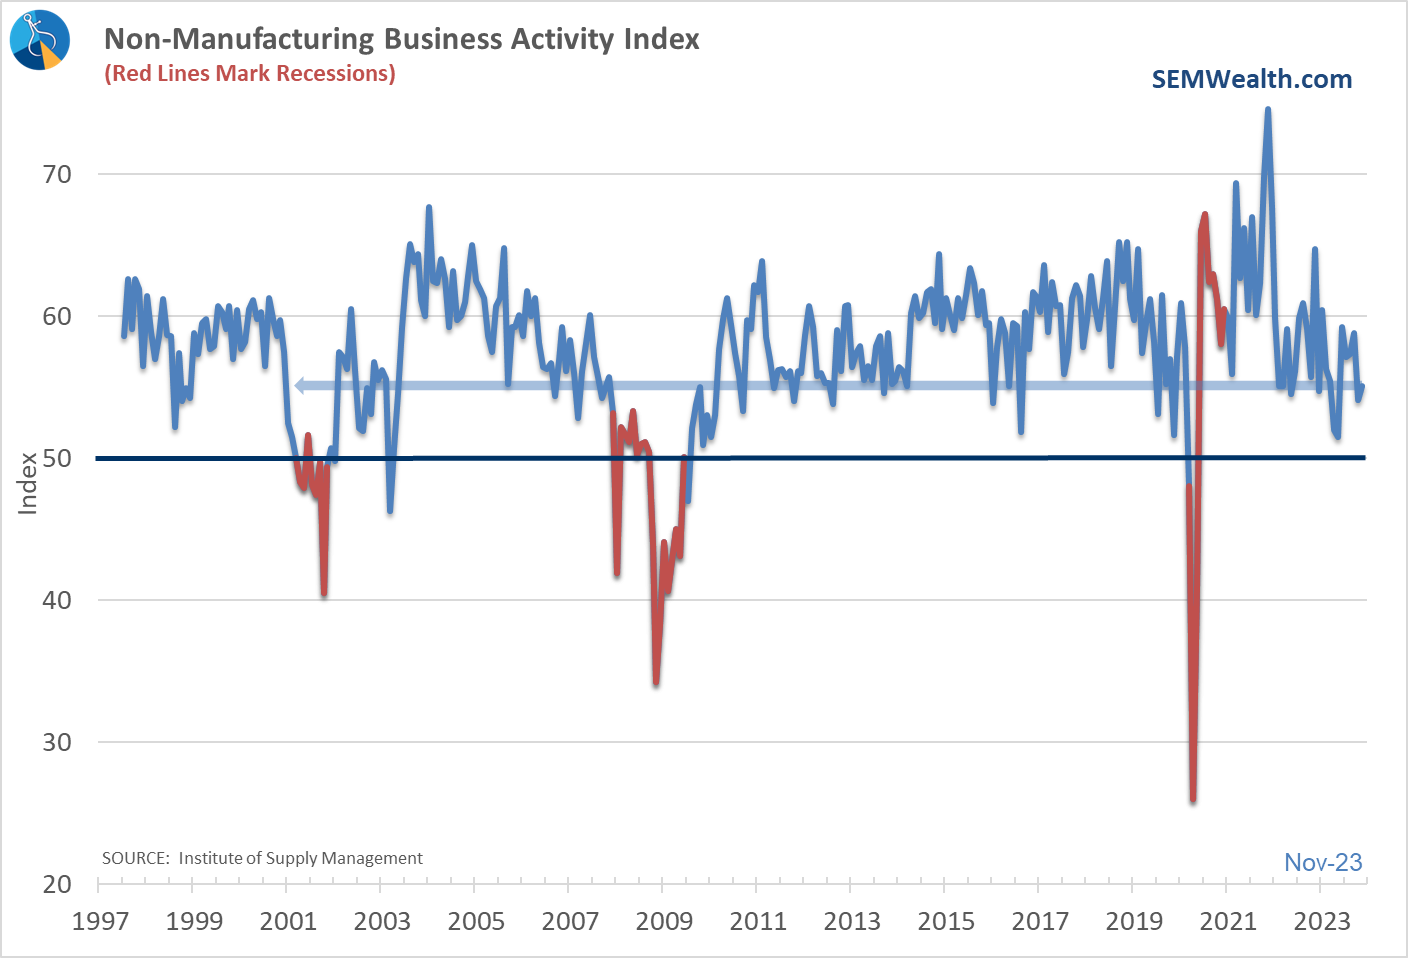
-Service Business Activity
Our economy is driven by services, so this indicator is one we watch closely. While still in "expansion" territory, it has weakened significantly the past few months.
Overall Model Outlook
Here is a look at our dashboard through November:
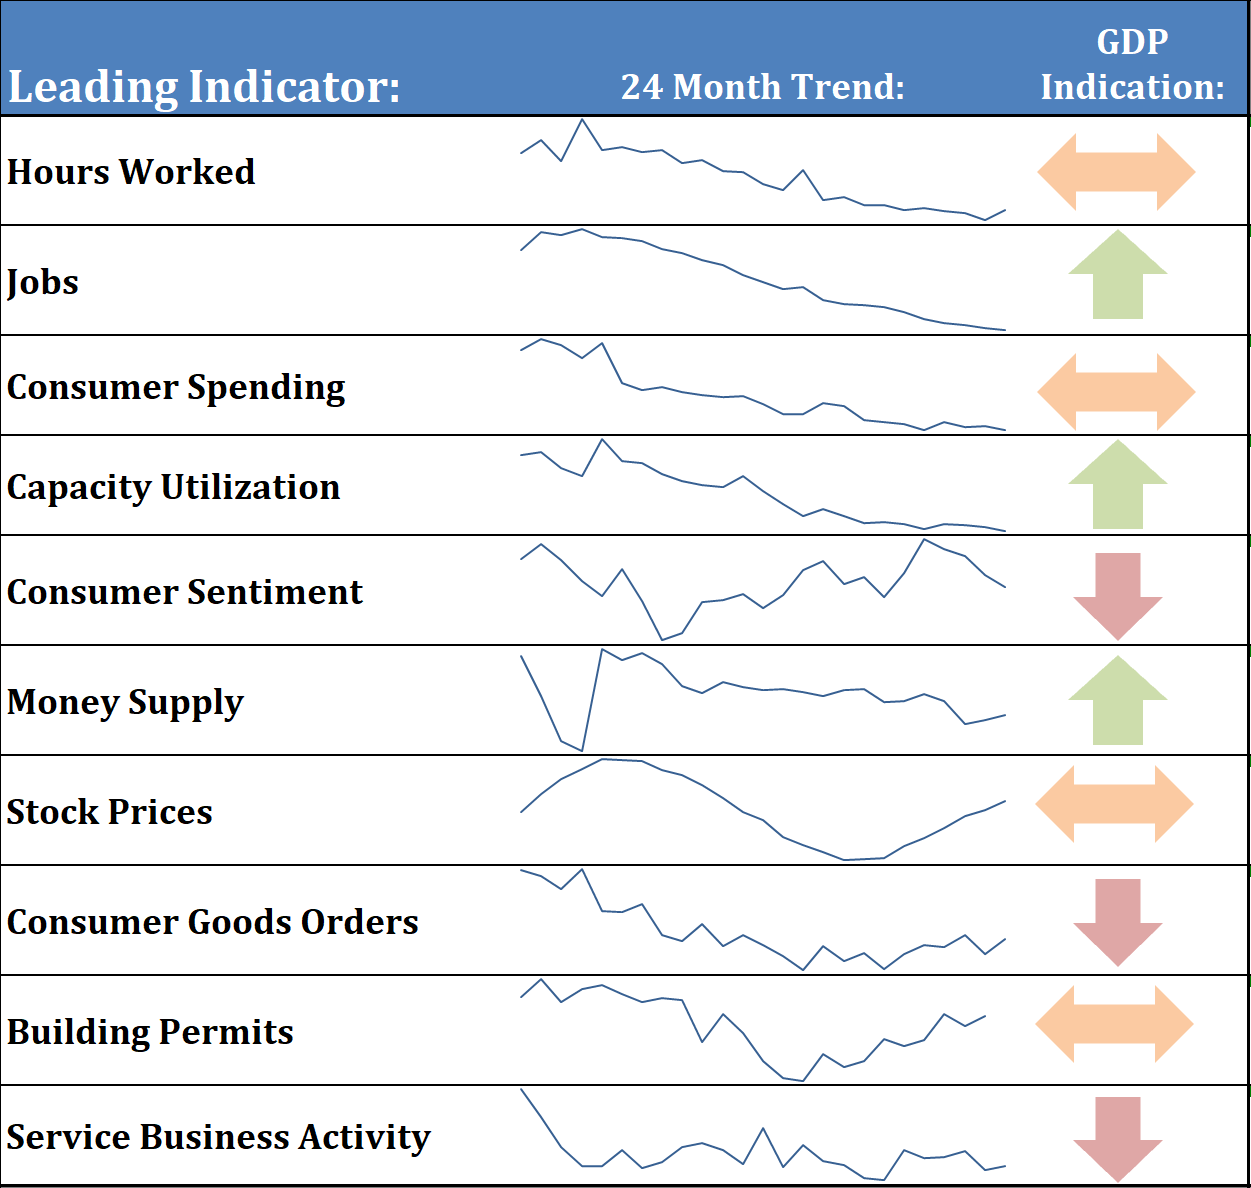
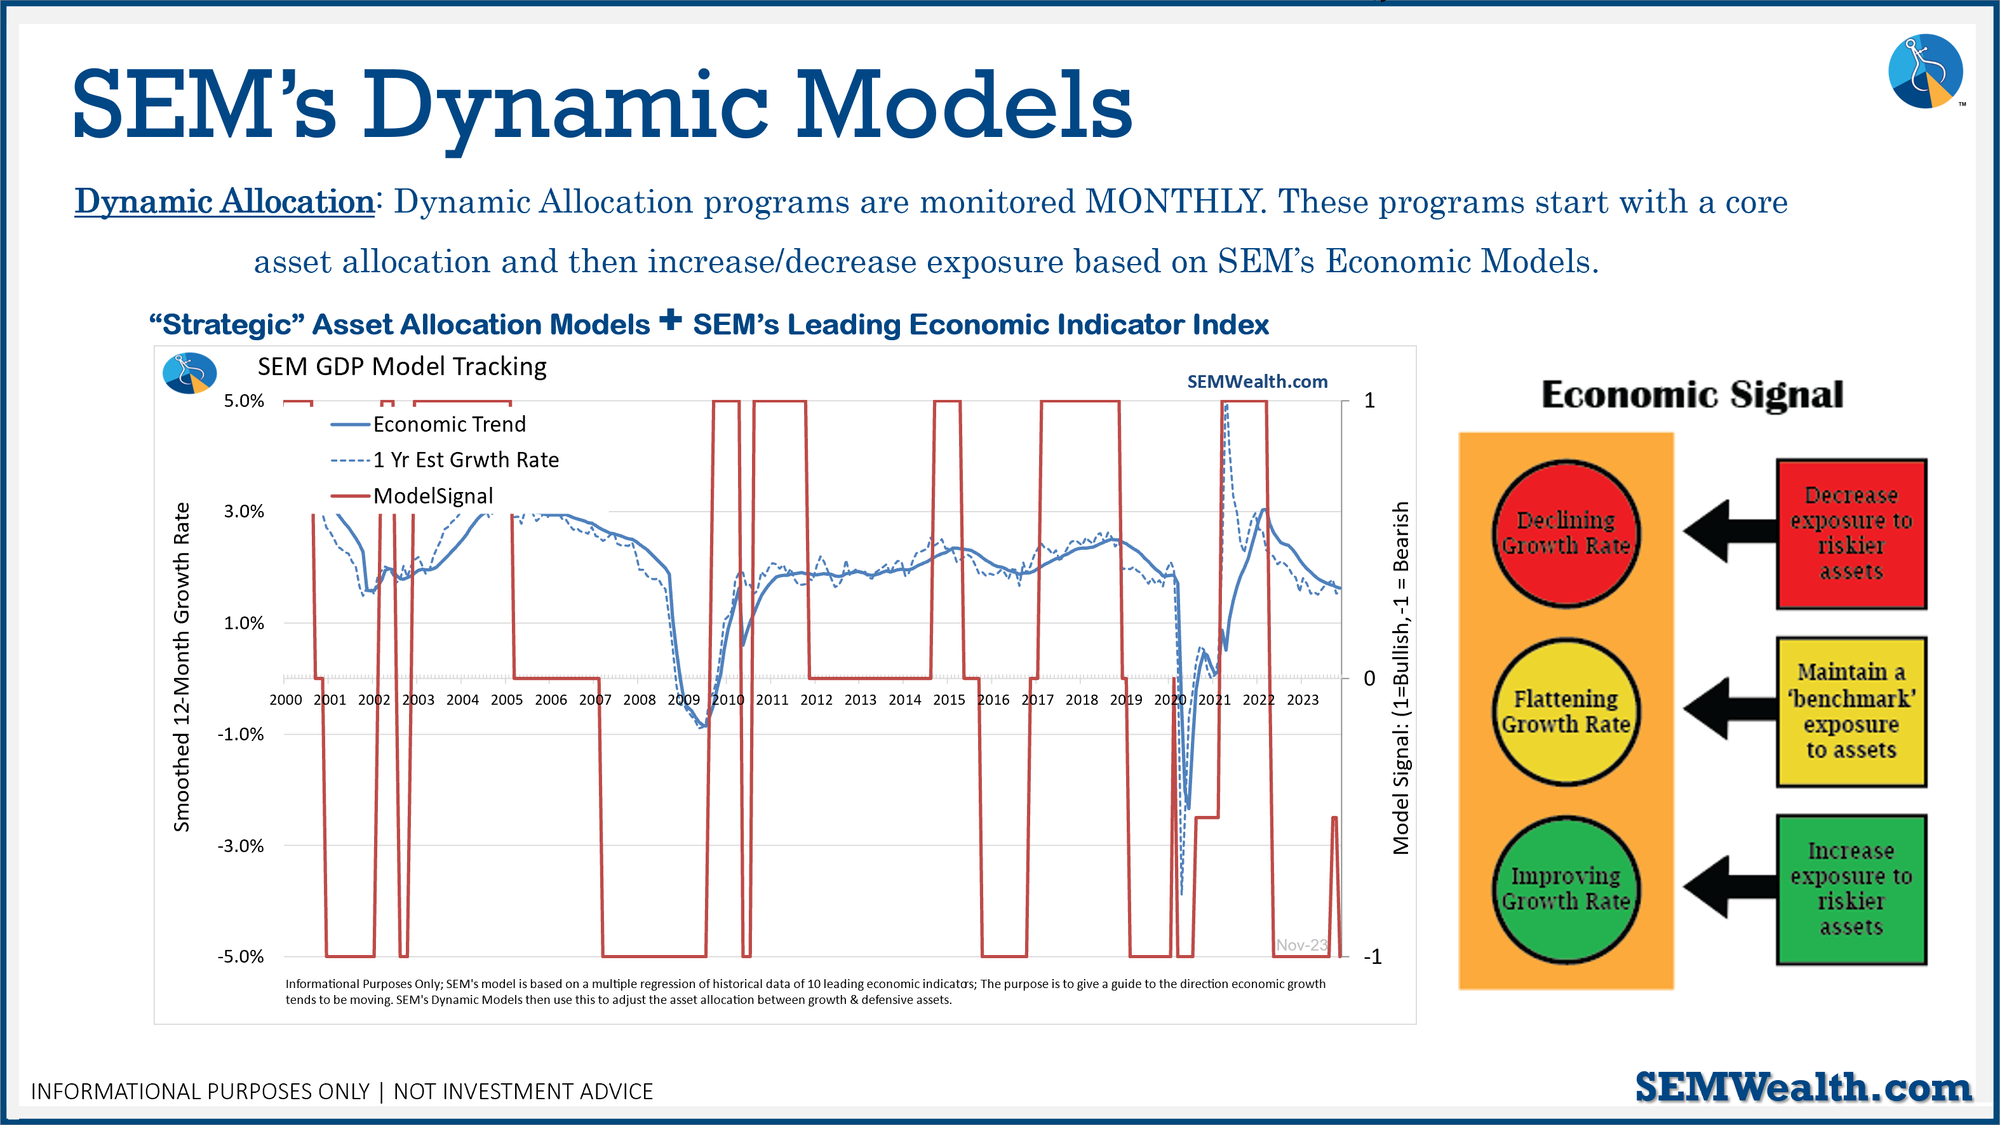
At the beginning of October there was some hope we were moving from the 'bearish' position back to 'bullish'. Unfortunately that is not the case and the continued economic slowdown has pushed the model back to bearish.
This means selling the 10% position we had in small cap stocks inside Dynamic Aggressive Growth and the 10% position we held in Dividend Growth stocks inside Dynamic (and Cornerstone) Income.
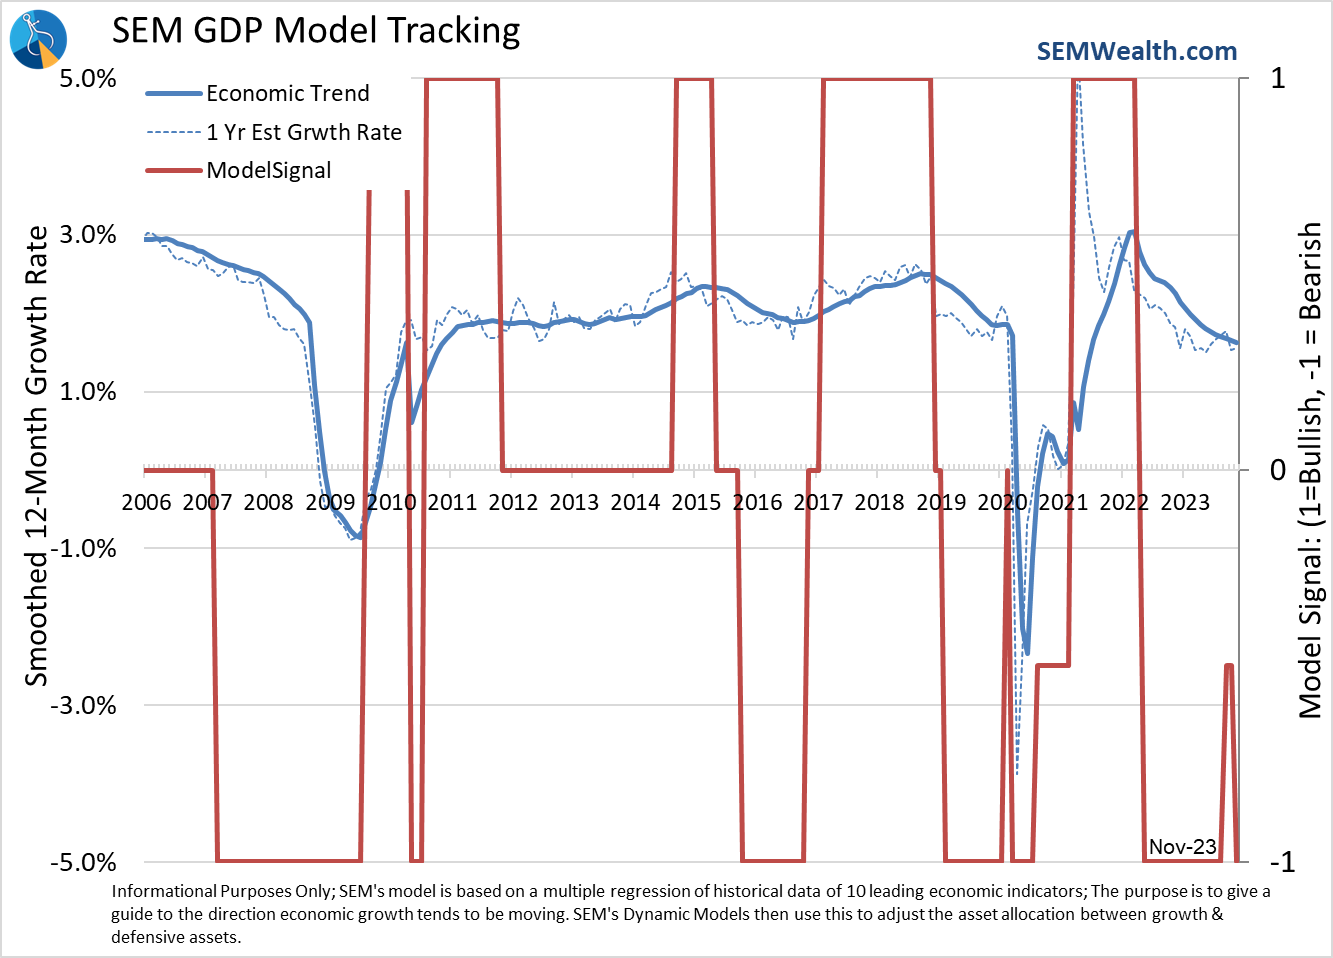
I think it's important to understand how the model works – it is not calling expansions or recessions, but rather is the trend in growth increasing, flattening, or declining.
Here's what it is saying right now – the economy grew at a 3% pace the last 12 months. That rate is expected to slow to around 1.6% over the next year, or about half the growth we enjoyed in 2023. That should be BEARISH for stocks as it will make for a difficult earnings environment.
The intangible here is the Fed – I suppose a 1.6% growth rate would be in the Goldilocks category as long as inflation continues to head lower. The Fed shouldn't have to raise rates due to the economy being too hot. The problem is it also isn't too cold, which to me throws a wrench in those banking on four Fed rate cuts in 2024.
So Goldilocks indeed remains, which is great for the markets for now. The problem of course is the Bears eventually come home and chase the intruder out of the house (in some darker versions she doesn't make it out alive). Either way it is our job to not get sucked into the latest mania and instead focus on the data. The data says a Goldilocks economy does not last, which means following the same well-tested, long-running trading systems inside SEM's models allows us to both participate in a good chunk of the upside while not getting chased (or eaten) when the Bears eventually make it home.
In case you missed it, we highlighted the 5 focus areas for the market in 2024. I'll try to update our summary next week after this week's Fed meeting and CPI reports. For now, you can check it out here:

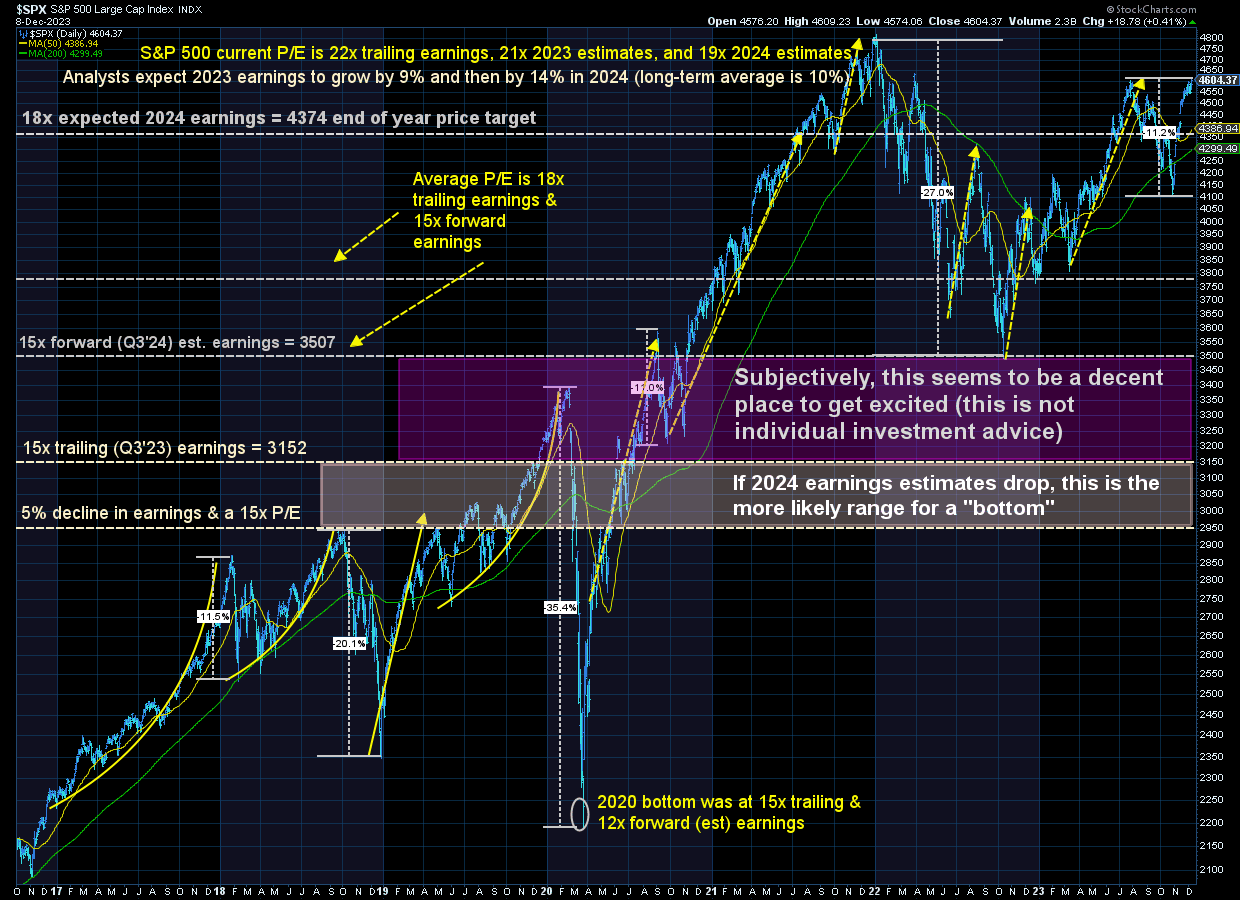
The bottom line – the economy was growing at 3%, it looks to be heading to a 1.6% growth rate. Earnings are on pace to grow 9% in 2023 and then another 14% in 2024 (the long-term average is 10%). In other words, economic growth is going to slow significantly, yet corporate earnings are going to accelerate. In a 'normal' market environment, the economic slowdown would lead to earnings cuts, which would lead to lower stock prices. This is why our Dynamic Models are 'bearish'.
Market Charts
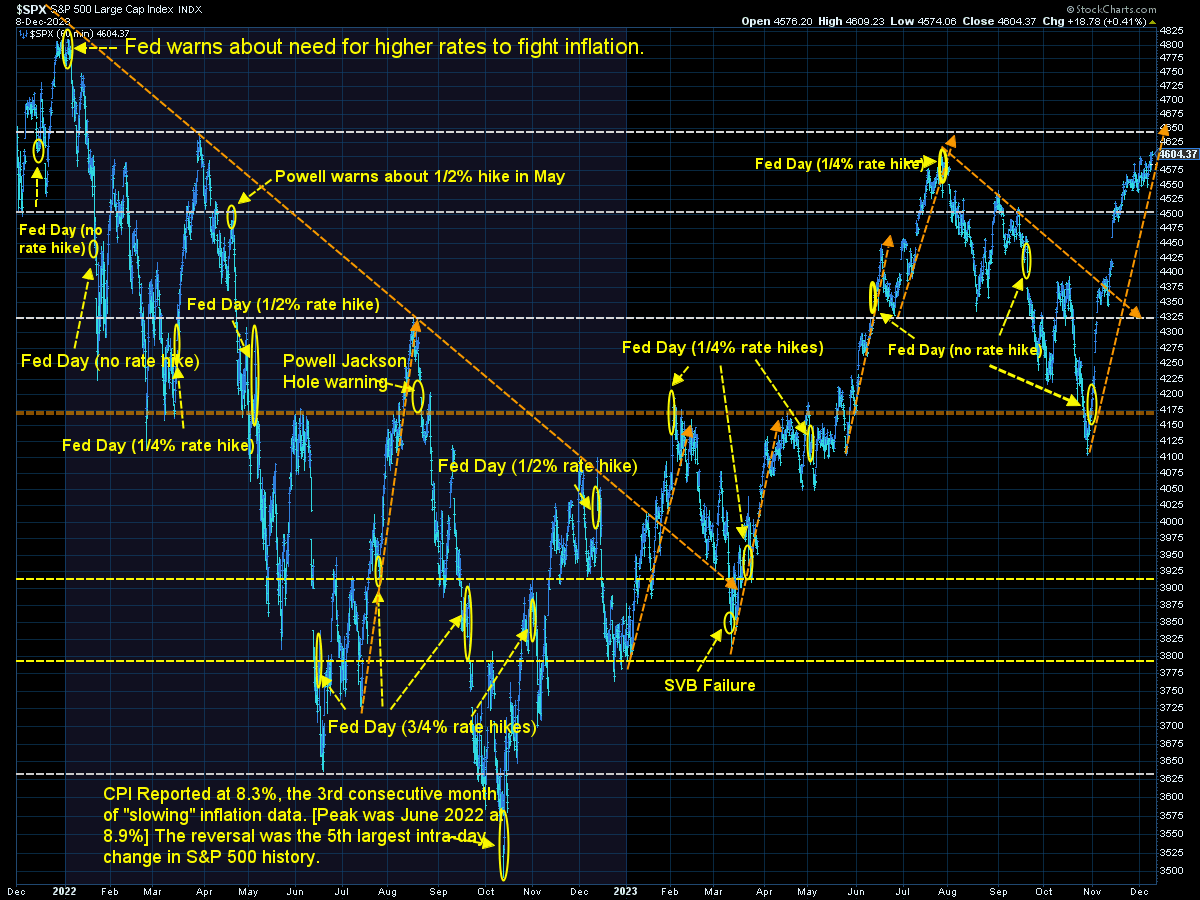
The S&P 500 2-year chart really tells a story of some wild swings – a scare leads to a sharp decline followed by optimism the worst is over which leads to a nearly vertical rise for stocks. We are currently in the midst of one of those vertical climbs. It certainly could go higher since it is the best month of the year, but as you can see, when these sharp climbs end it often leads to a very big sell-off.
Longer-term the market remains overvalued which is another risk for those just now wanting to add stock market exposure.
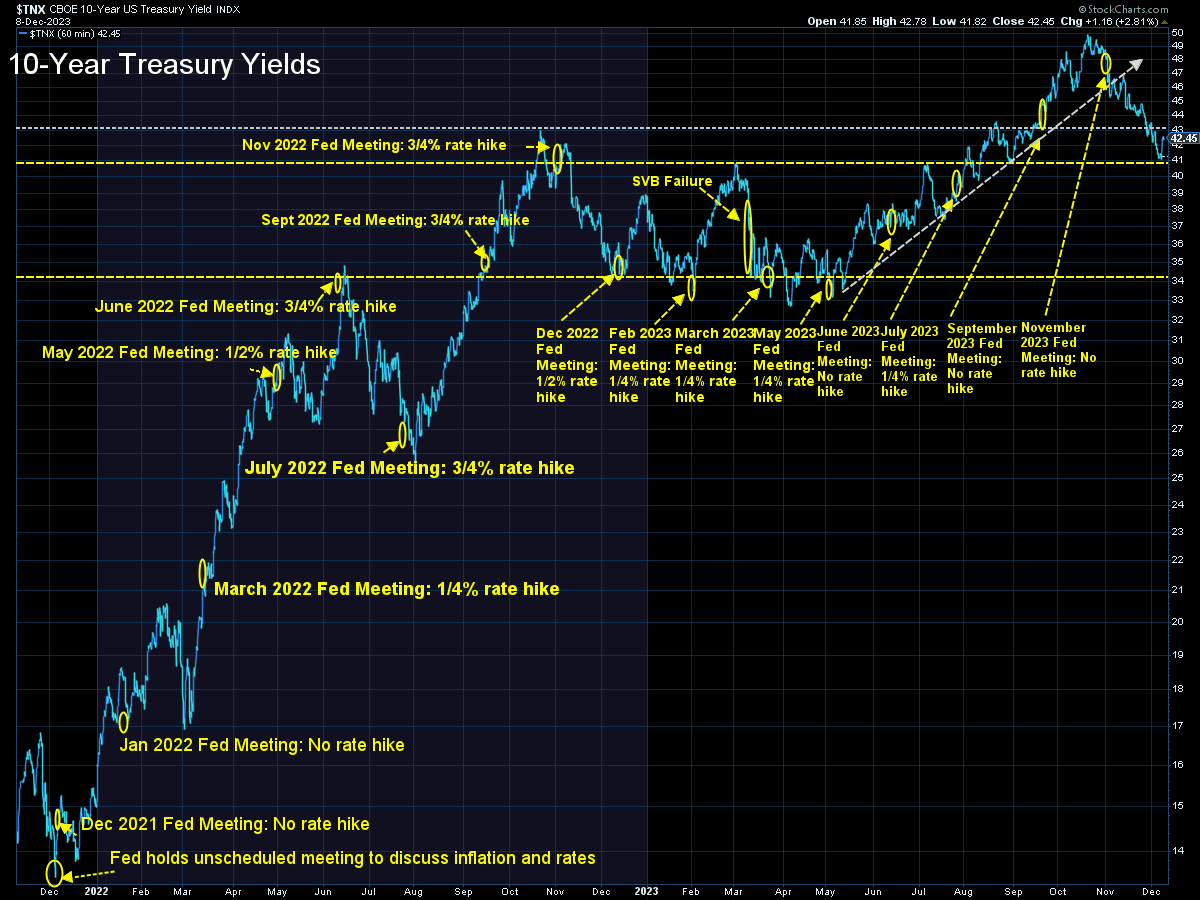
The trickier and more important area is the bond market. Yields have come down about 3/4 of a percent and from a technical stand-point could continue moving lower.
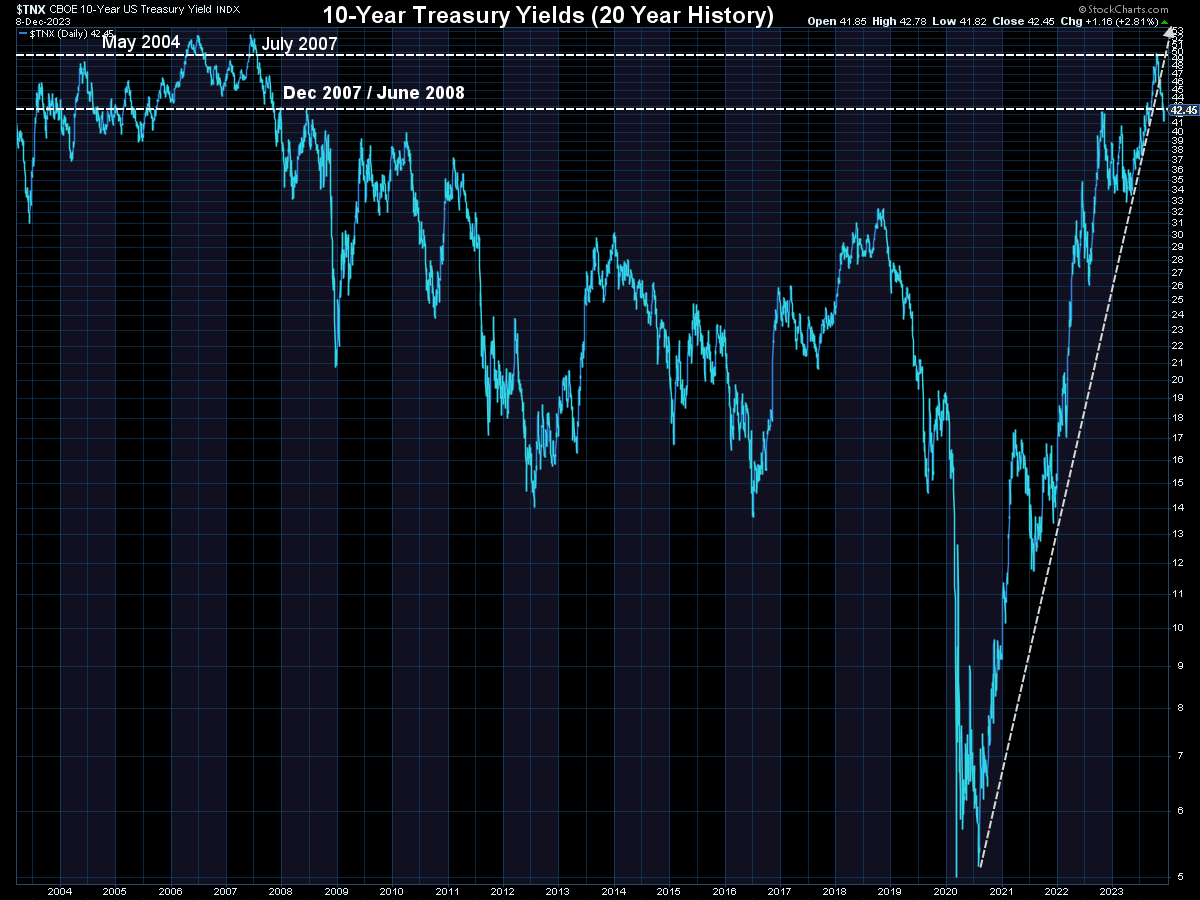
Longer-term, yields are obviously still high. This chart puts the current yield levels in perspective.
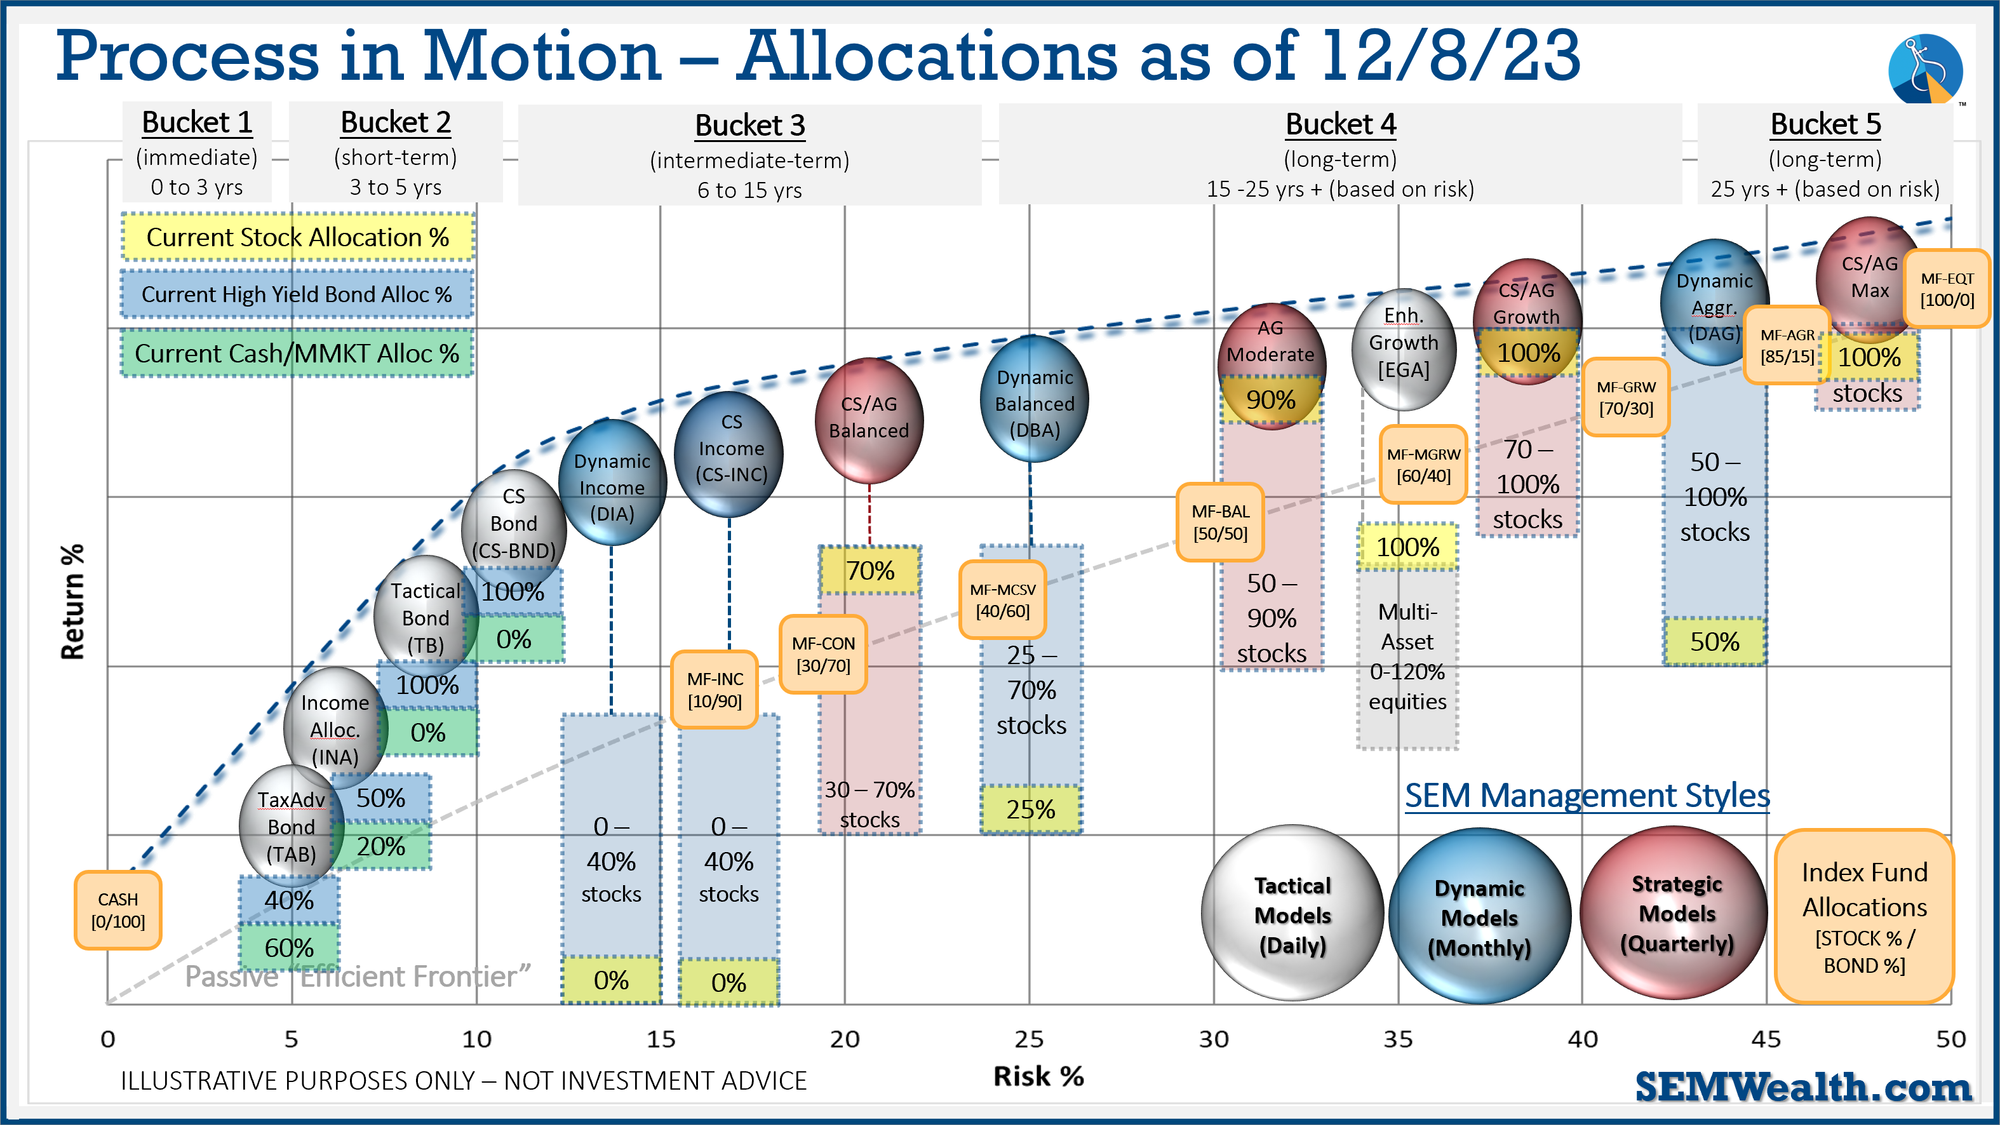
SEM Model Positioning
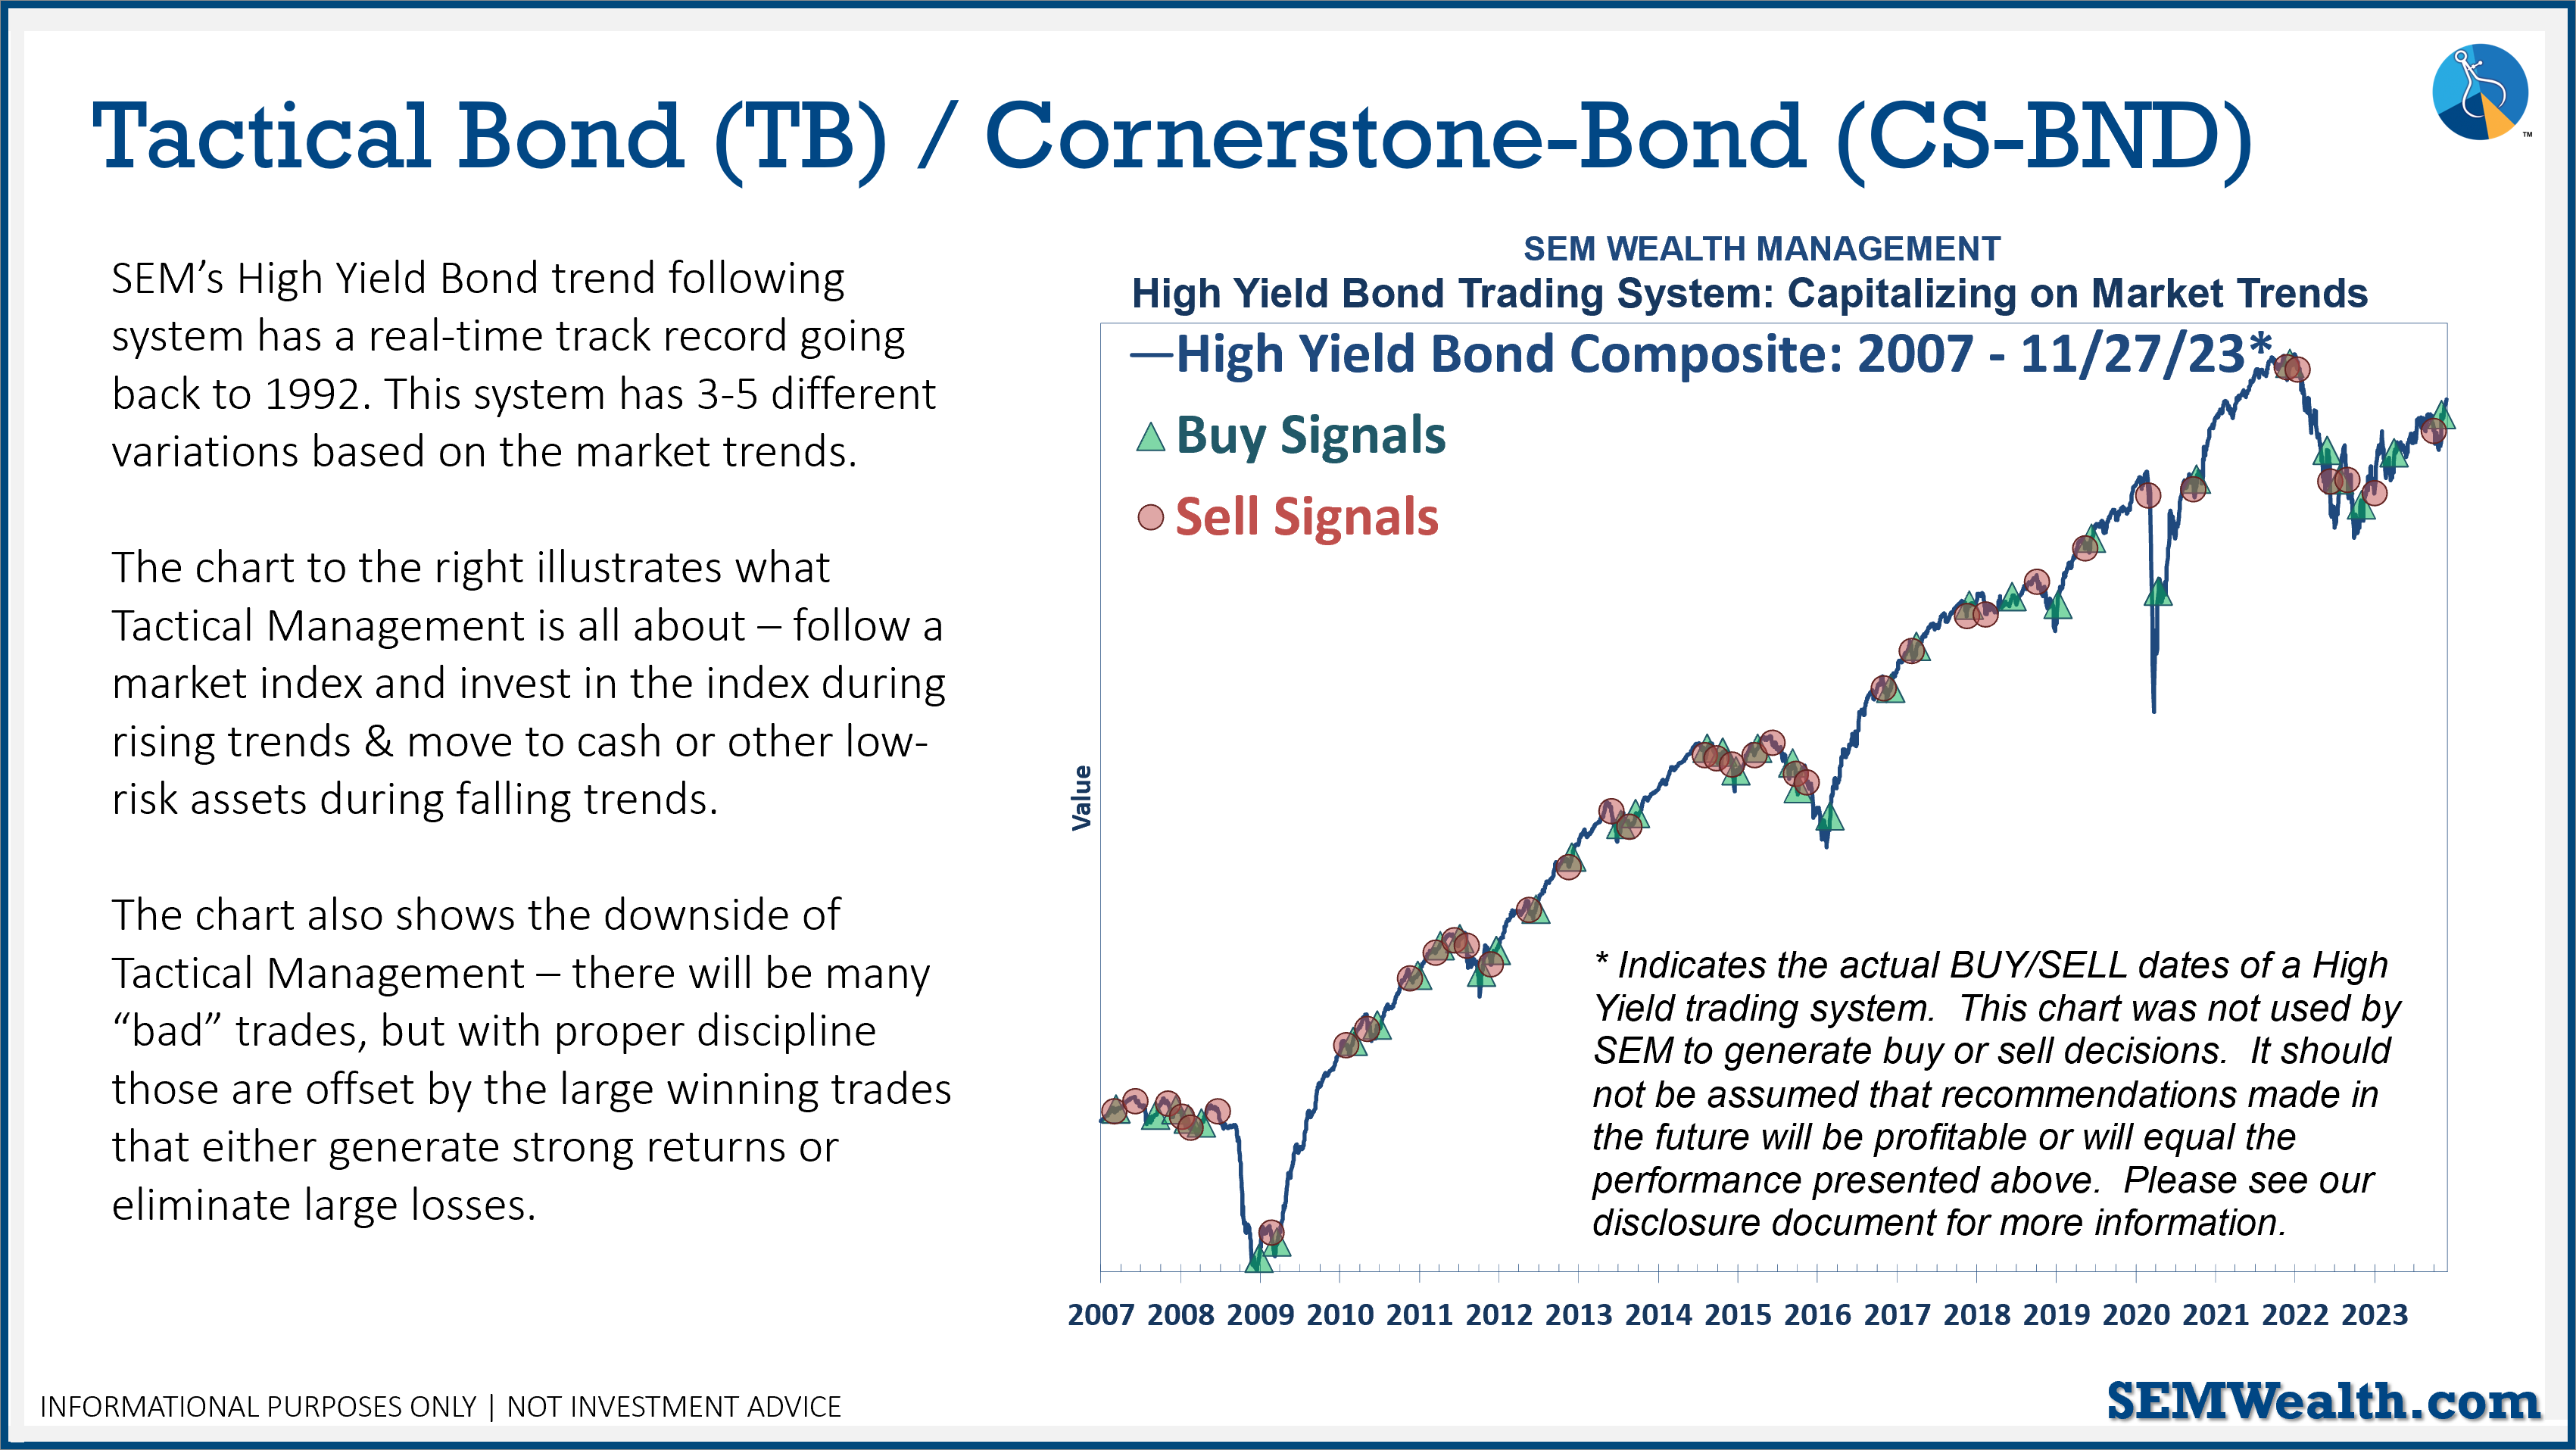
-Tactical High Yield went on a buy 11/3/2023
-Dynamic Models reverted back to 'bearish' 12/8/2023
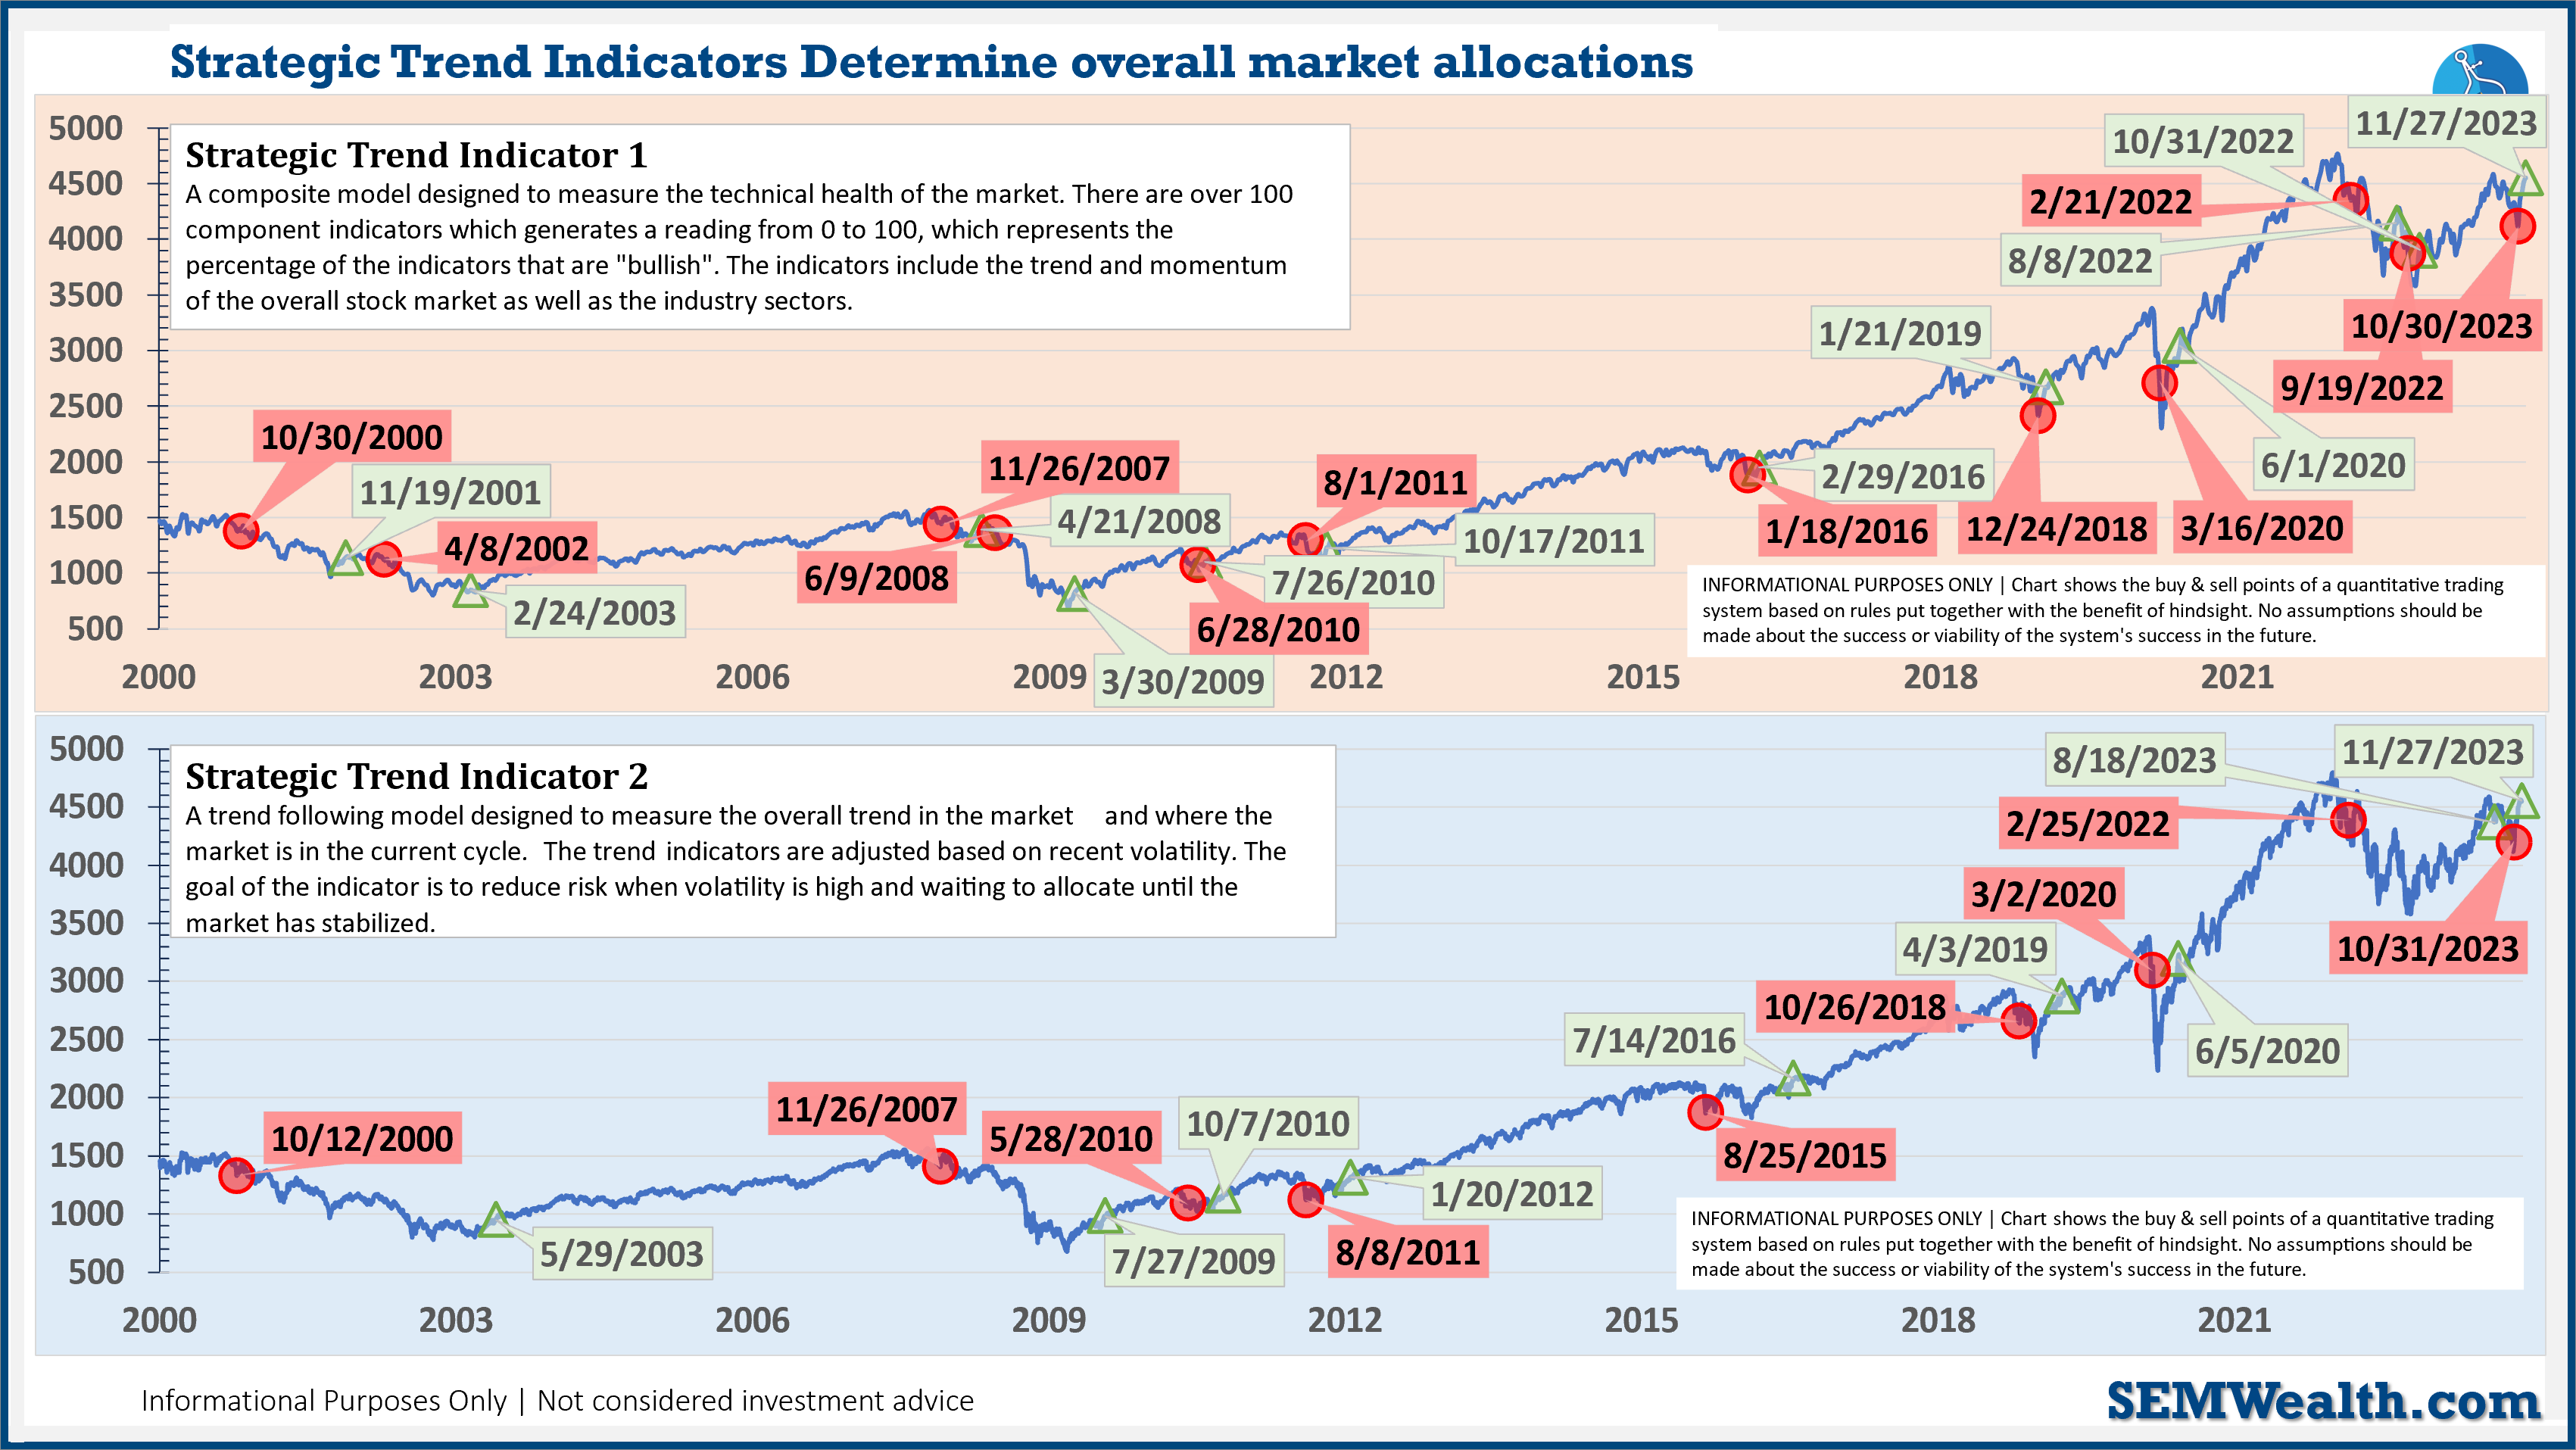
-Strategic Trend Models went on a buy 11/27/2023
SEM deploys 3 distinct approaches – Tactical, Dynamic, and Strategic. These systems have been described as 'daily, monthly, quarterly' given how often they may make adjustments. Here is where they each stand.
Tactical (daily): The High Yield Bond system bought the beginning of April and issued all 3 sell signals 9/28/2023. All 3 systems were back on buy signals by the close on 11/3/2023. The bond funds we are invested in are a bit more 'conservative' than the overall index, but still yielding between 7.5 -8.5% annually.
Dynamic (monthly): At the beginning of October the model moved slightly off the "bearish" signal we've had since April 2022. At the beginning of December it reverted back to "bearish". This means no positions in dividend stocks (Dynamic Income) or small cap stocks (Dynamic Aggressive Growth).
Strategic (quarterly)*:
BOTH Trend Systems reversed back to a buy on 11/27/2023
The core rotation is adjusted quarterly. On August 17 it rotated out of mid-cap growth and into small cap value. It also sold some large cap value to buy some large cap blend and growth. The large cap purchases were in actively managed funds with more diversification than the S&P 500 (banking on the market broadening out beyond the top 5-10 stocks.)
The * in quarterly is for the trend models. These models are watched daily but they trade infrequently based on readings of where each believe we are in the cycle. The trend systems can be susceptible to "whipsaws" as we saw with the recent sell and buy signals at the end of October and November. The goal of the systems is to miss major downturns in the market. Risks are high when the market has been stampeding higher as it has for most of 2023. This means sometimes selling too soon. As we saw with the recent trade, the systems can quickly reverse if they are wrong.
Overall, this is how our various models stock up: