On what was a crazy Friday after a crazy weekend prior, it feels like world events are constantly happening more and more. In my experience, there’s about a 75% chance when you tune in to a major news channel that the bottom graphic will have “BREAKING NEWS” on it. While I feel a potential assassination and an IT meltdown grounding flights and shutting down banking functions would certainly qualify, I think the feeling of living through constant world events is just a product of living in the Information Era. When you have access to information as soon as it becomes information, then there will ALWAYS be some “breaking news.” Having the information isn’t really helpful, what is helpful is knowing how to react to that information. That’s what we, and everyone, is trying to do properly.
There are entire industries that are trying to react to information and take advantage of that information. You might say finance is one of those because having the data that we have is only part of the equation. This is also part of human nature to try and find cause and effect relationships and provide our own opinions on what the news around us truly means. The problem is that those opinions don’t always follow proper logic and can end up hurting us. So, let’s try and see if we can find an accurate analysis of what’s happening around us.
For example, the speculation of the aftermath of Trump handling the assassination attempt the way he did would take our expected, close upcoming election into a landslide. That’s a typical bias (representativeness) which is trying to find connections to our last candidate’s assassination attempt, President Reagan, and how he dominated his upcoming election. While there has been a slight polling bump, the national polls that have come out after the assassination attempt would still show we have a close election. This shows us that even when we are faced with a monumental event, we have a tendency to overreact when faced with news.
As a whole, we tend to do this with all of politics. There’s A LOT of news about our candidates at this time of the election cycle, which means there’s a lot of reactions that we have to seek for the news. The general consensus seems to be that regardless of who actually wins, that Trump would be the better president for our economy. Normally there’s a lot of speculation about what a challenger would do for the economy while having all of the information about the sitting president. Going into the weekend, we had DATA on both candidates. With President Biden announcing he is withdrawing from the race and throwing his support behind Vice President Kamala Harris, we no longer even have that.
The sentiment of the economy under Biden (and thus Harris) has been poor, despite the data showing us strong jobs numbers and strong stock market returns (we discussed this in Politics Pt III and our latest SEM University linked below.) I think this is another example of us overreacting to the news we receive. We hear more about the physical struggles of Biden and our analysis is that our country, along with our economy, is tanking. But the good news is that generally the market doesn’t have much correlation to who’s in the Oval Office.

In the case of Trump, overall, we can look back at the economy under his lead and it was positive. However, we should all know that we shouldn’t expect a potential Trump re-election to be all positive. Having a more active president for the economy will lead to more news, and as I’ve highlighted that leads to more potential overreactions. And in terms of the stock market that led to volatility under Trump.
While the point-to-point returns during the Trump presidency were strong, many people forget about 2018 where we started the year with two large drops approaching 10% and ended the year with a nearly 20% drop. The culprit was his 'trade war' and the machinations between "will he or won't he" take a strong stance on China. Here is the chart Jeff used in the blog back then with annotations of the 'news' driving the markets.
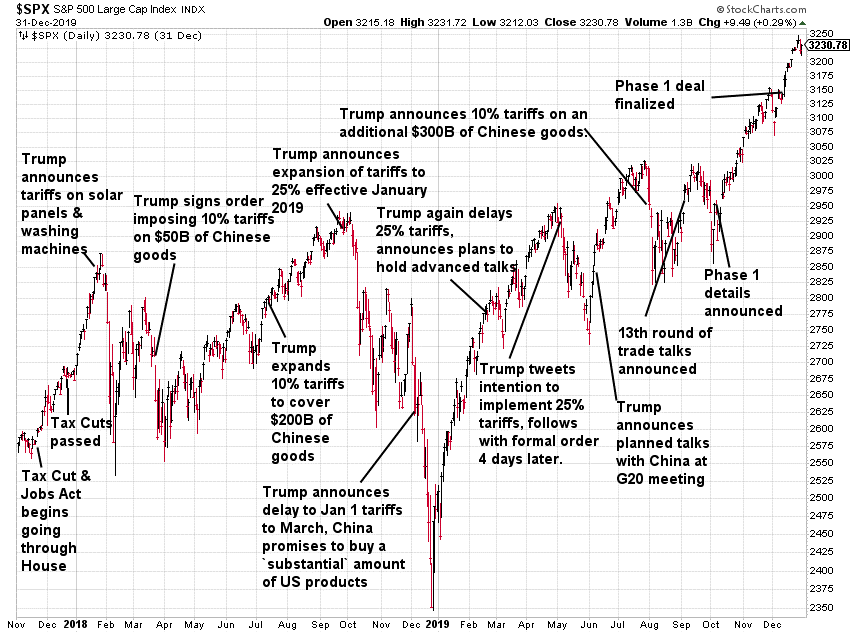
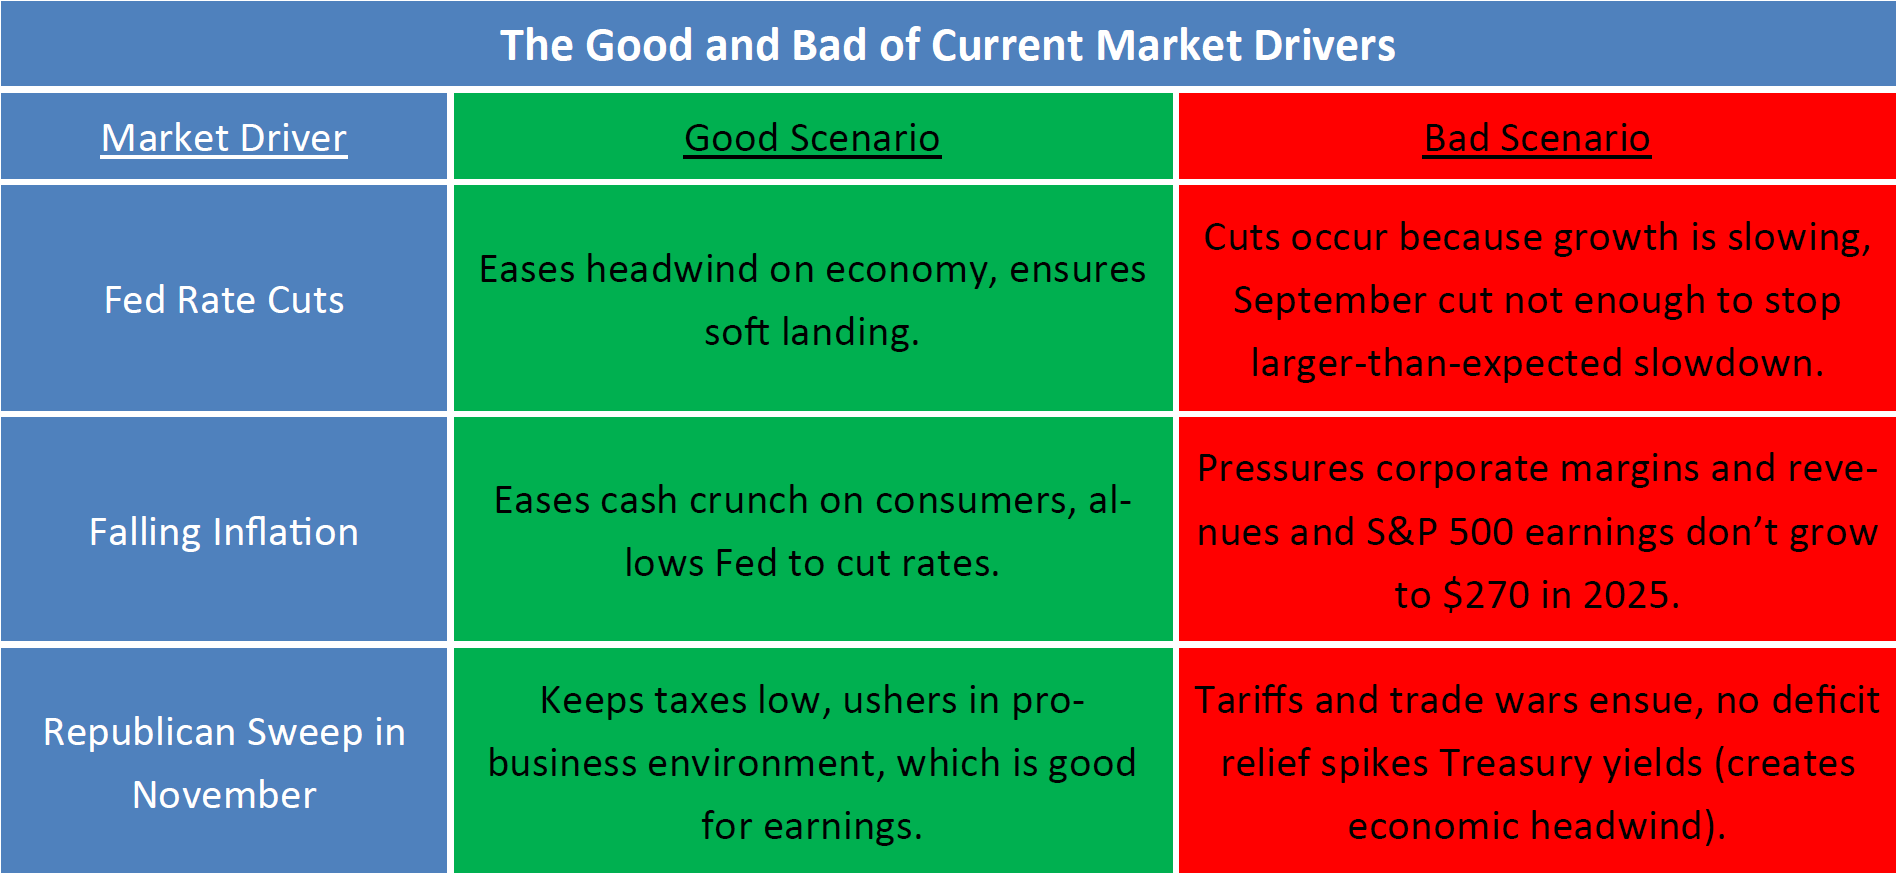
During the Trump Presidency Jeff often defined the news cycle as "Good Trump vs. Bad Trump". He wasn't talking about anything other than his economic policies. Yes, some policies are great for the economy and logically the stock markets, but there are others which could do quite a bit of damage. This chart from the Sevens Report last week did a good job summarizing the good versus bad policies. One reason for the big sell-off last week was ramblings about banning tech sales to China along with very high tariff rates imposed on goods from China.
Overall, tariffs and 'trickle-down' tax cuts could cause inflation to resume which could cause the Fed to be forced to raise interest rates and/or create an economic slowdown.
Now as we have more “breaking news,” we have another variable to consider in all of this. While this was an outcome that has historically been unprecedented (a sitting president not seeking election for a second term), this is a possibility that those with understandings of the election have considered. Even while Biden was winning the Democratic Primary almost unopposed, pollsters were putting out hypothetical general election polls matching up Trump with some popular Democratic nominees.
In the last week, betting prognosticators had set the odds of a Biden drop-out as the expected result. Even throughout most of the last month, that has been a real possibility according to them and they looked at it as never a foregone conclusion that Biden would accept the nomination. What that ultimately means for us, is that while we may have been shocked at this result that seems unprecedented, this was always a scenario that was considered from the experts, and thus doesn’t catch them too off guard. All this really does from SEM’s standpoint is it takes a market hindrance, uncertainty, and clears up a bit of unknowns. In this new case, a new Democratic nominee would be the “uncertain” choice, but a Trump presidency can still lead to a lot of uncertainty and volatility on its own. It’ll still be up to us all to adapt to the data and information in front of us as it presents itself, and isn’t as “breaking” as the headlines lead us to believe.
The moral of all of this is hopefully we can all remain a little calmer as we live through “constant world events.” Breaking news isn’t always life-changing news, in fact most of the time it will have very little impact on our lives. Louder news doesn’t mean more important news. These are flaws that we all have and flaws we can work together to fix. SEM will continue to look at the data and take human emotions out of our decision making and will be able to take the news as it is and not focus on the noise.
Market Charts
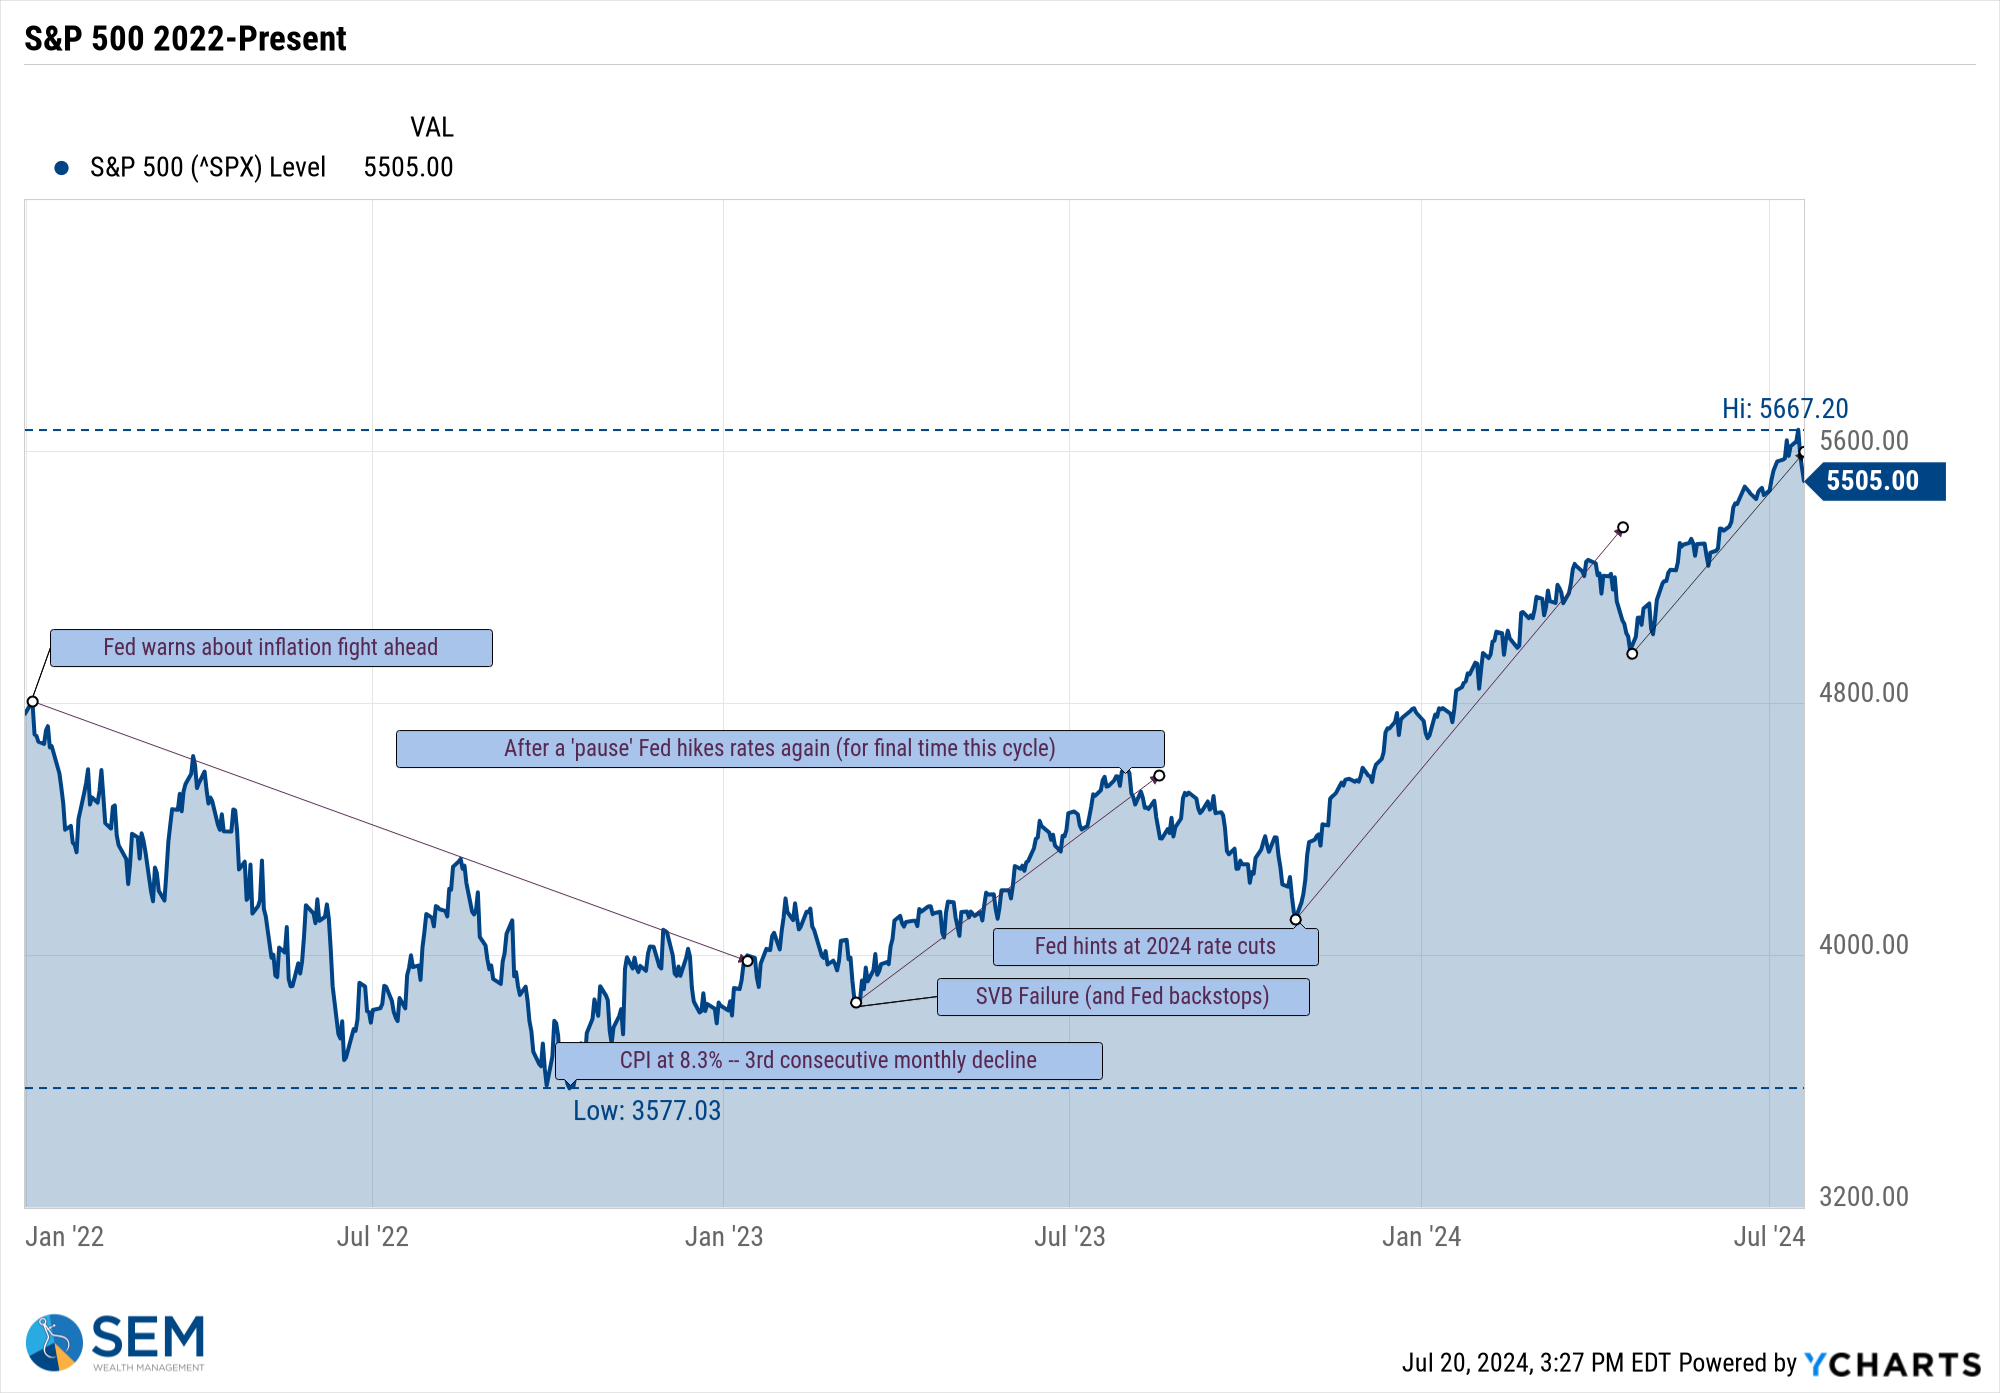
The S&P 500's very steep uptrend was broken last week, but we've seen that before. The mega-cap market was due for a drop. The rumblings about tariffs and banning sales to China could simply be an excuse to take profits in the large-cap growth space.
The better news was the non-mega cap growth stocks continued to outperform. Small caps doing better than large caps are typically a sign of confidence in the economy.
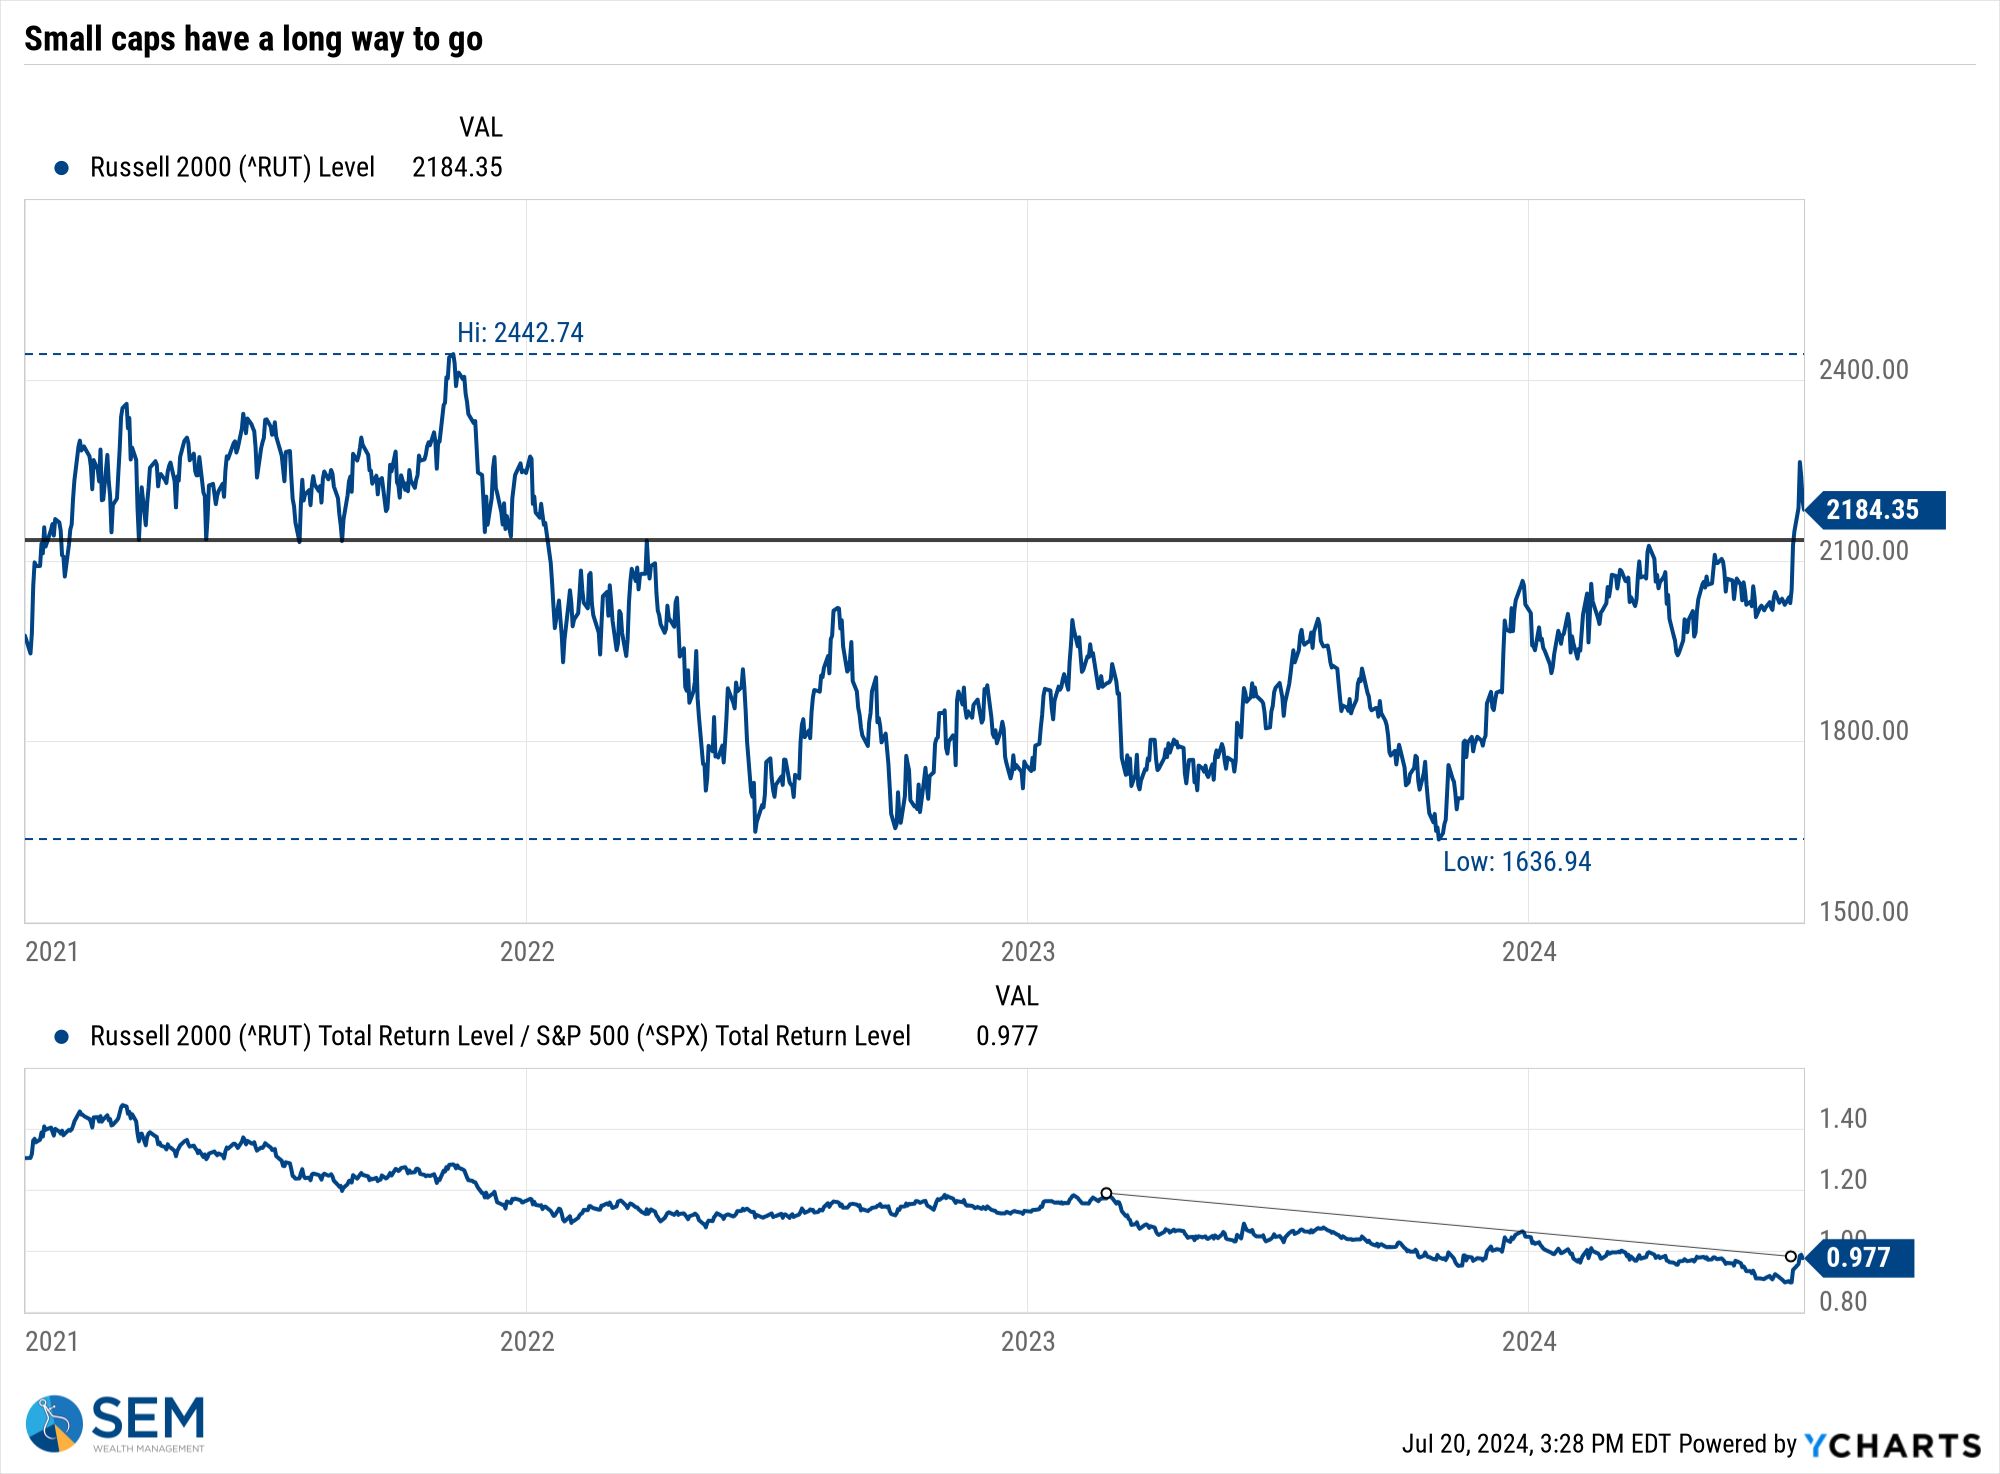
Overall asset class performance shows the wide swings we've seen since the peak in 2021.
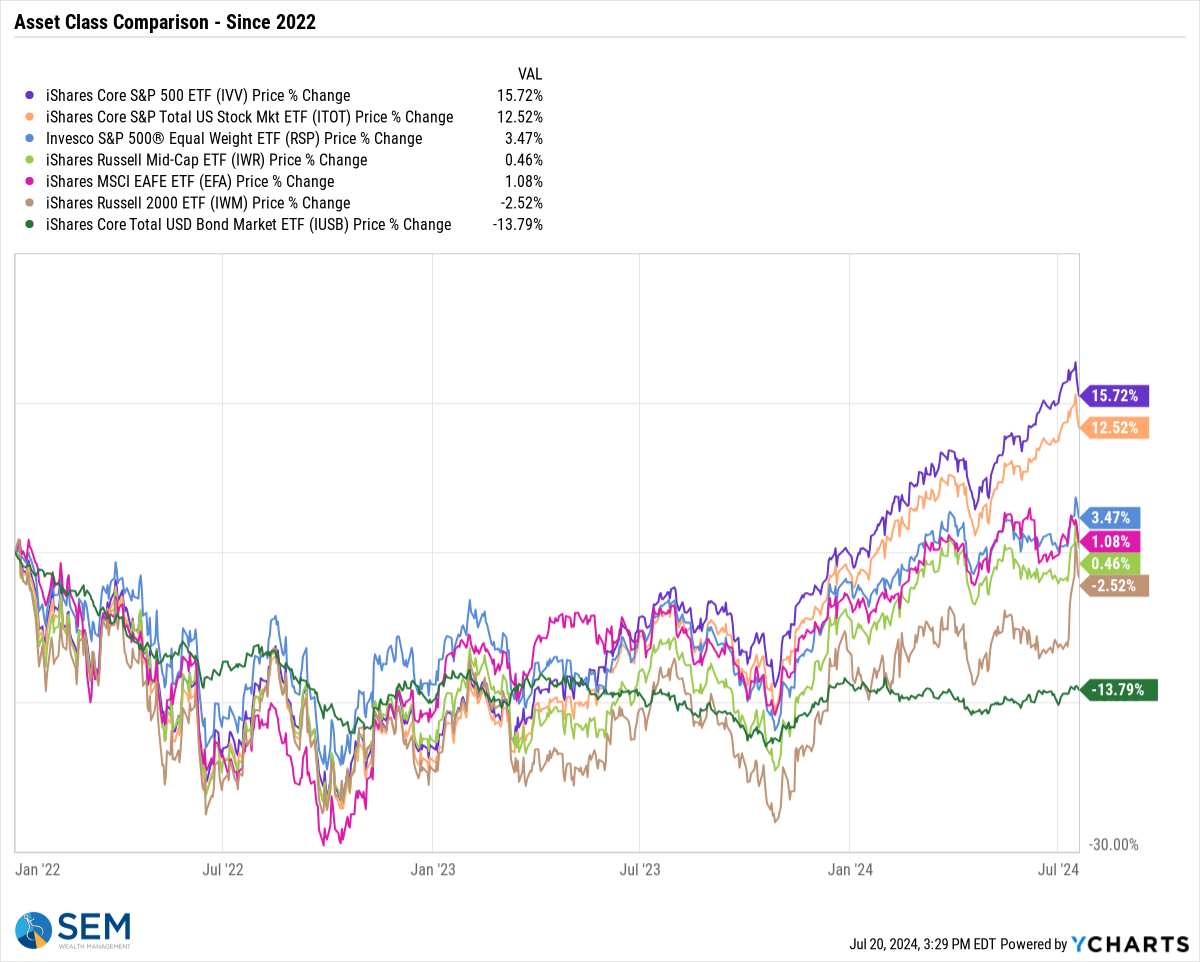
Note, the bond market is still down 13% since the stock market peak. Small caps briefly recovered their bear market losses, but Friday's drop took them back below their all-time highs.
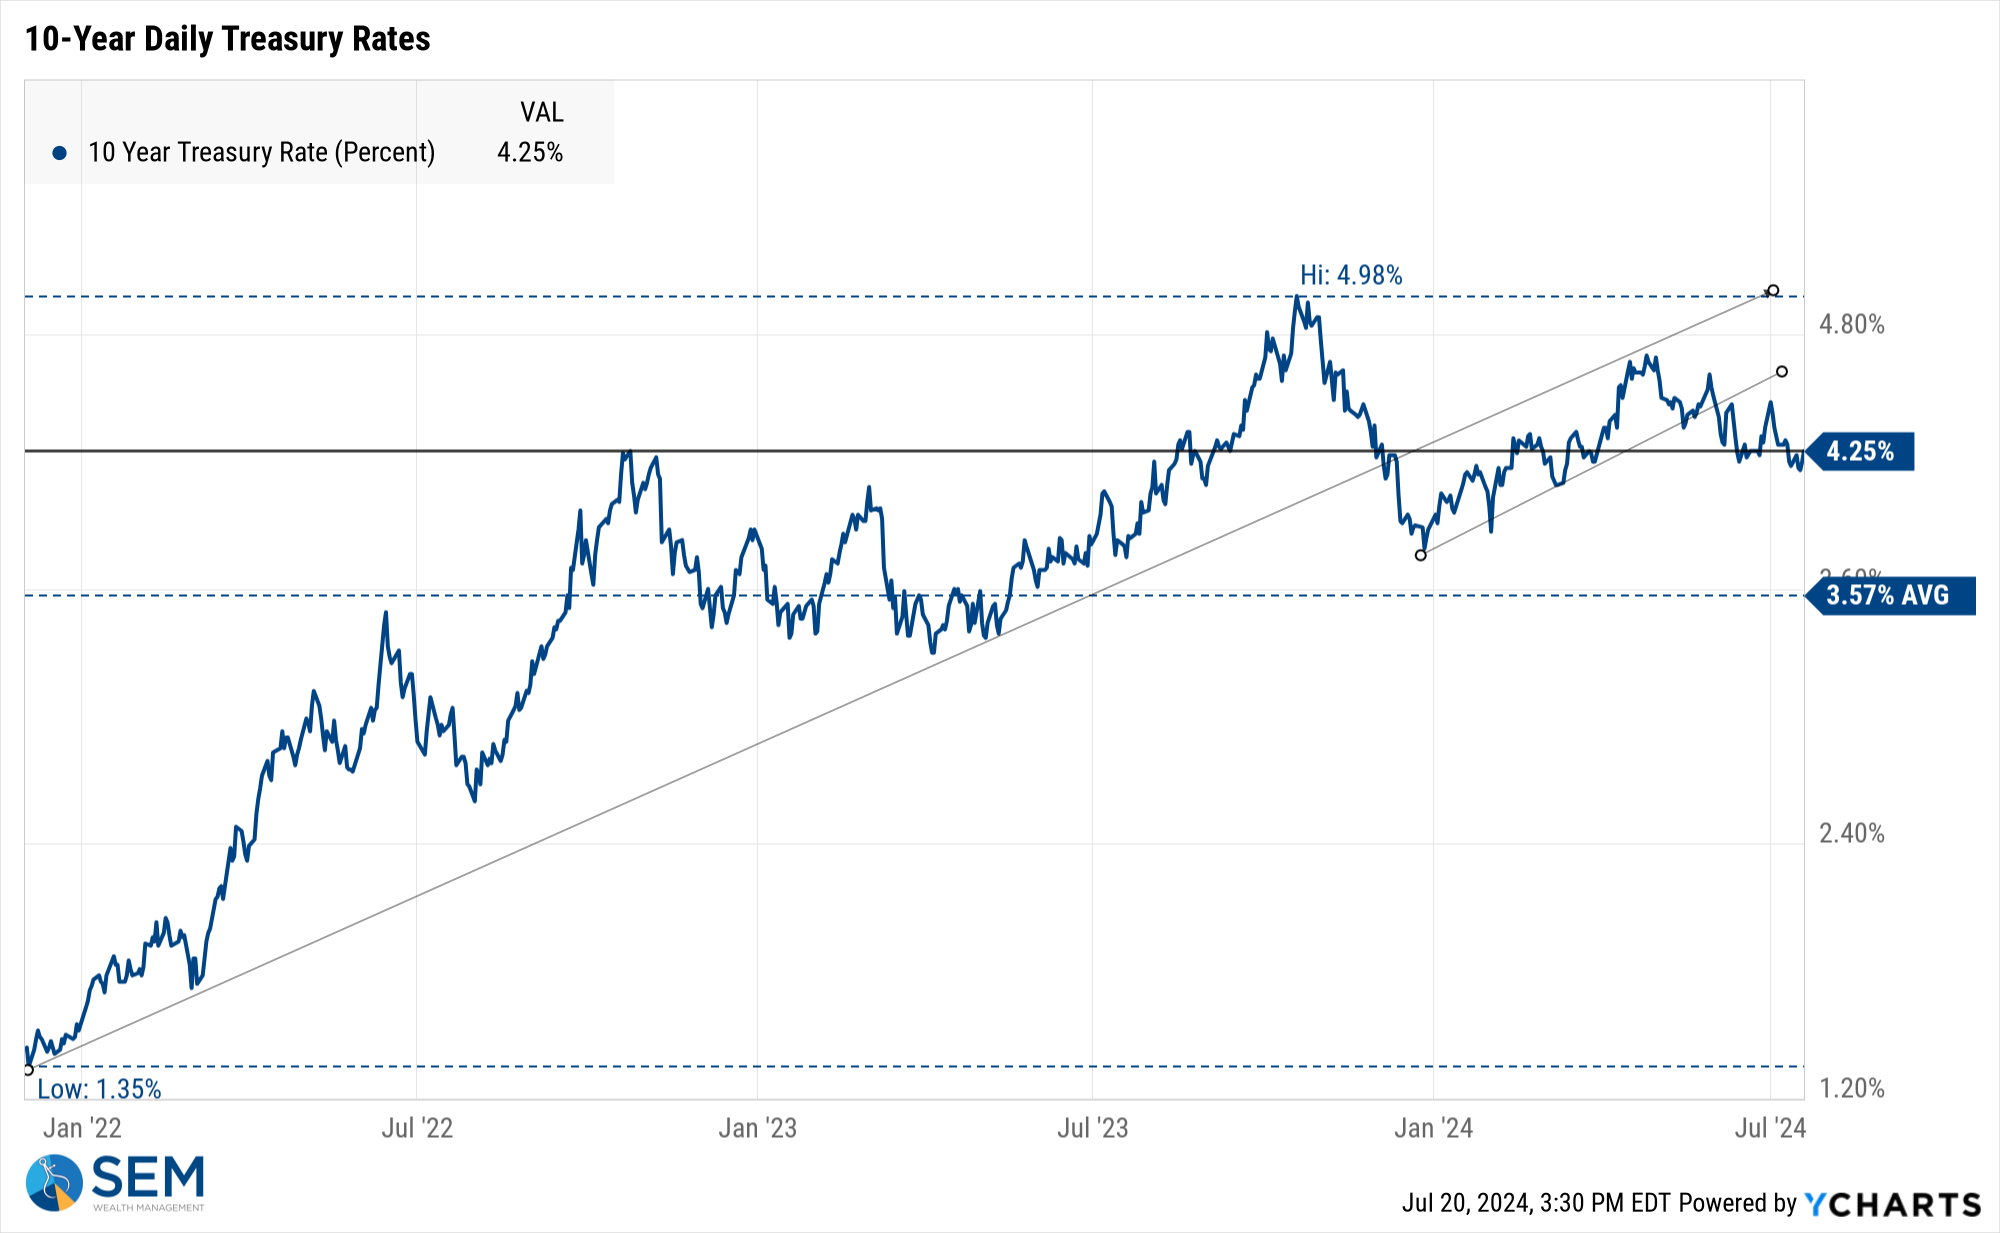
Turning to bonds, interest rates crept up a bit, but still ended at the 4.25% key level we've been watching.
SEM Model Positioning
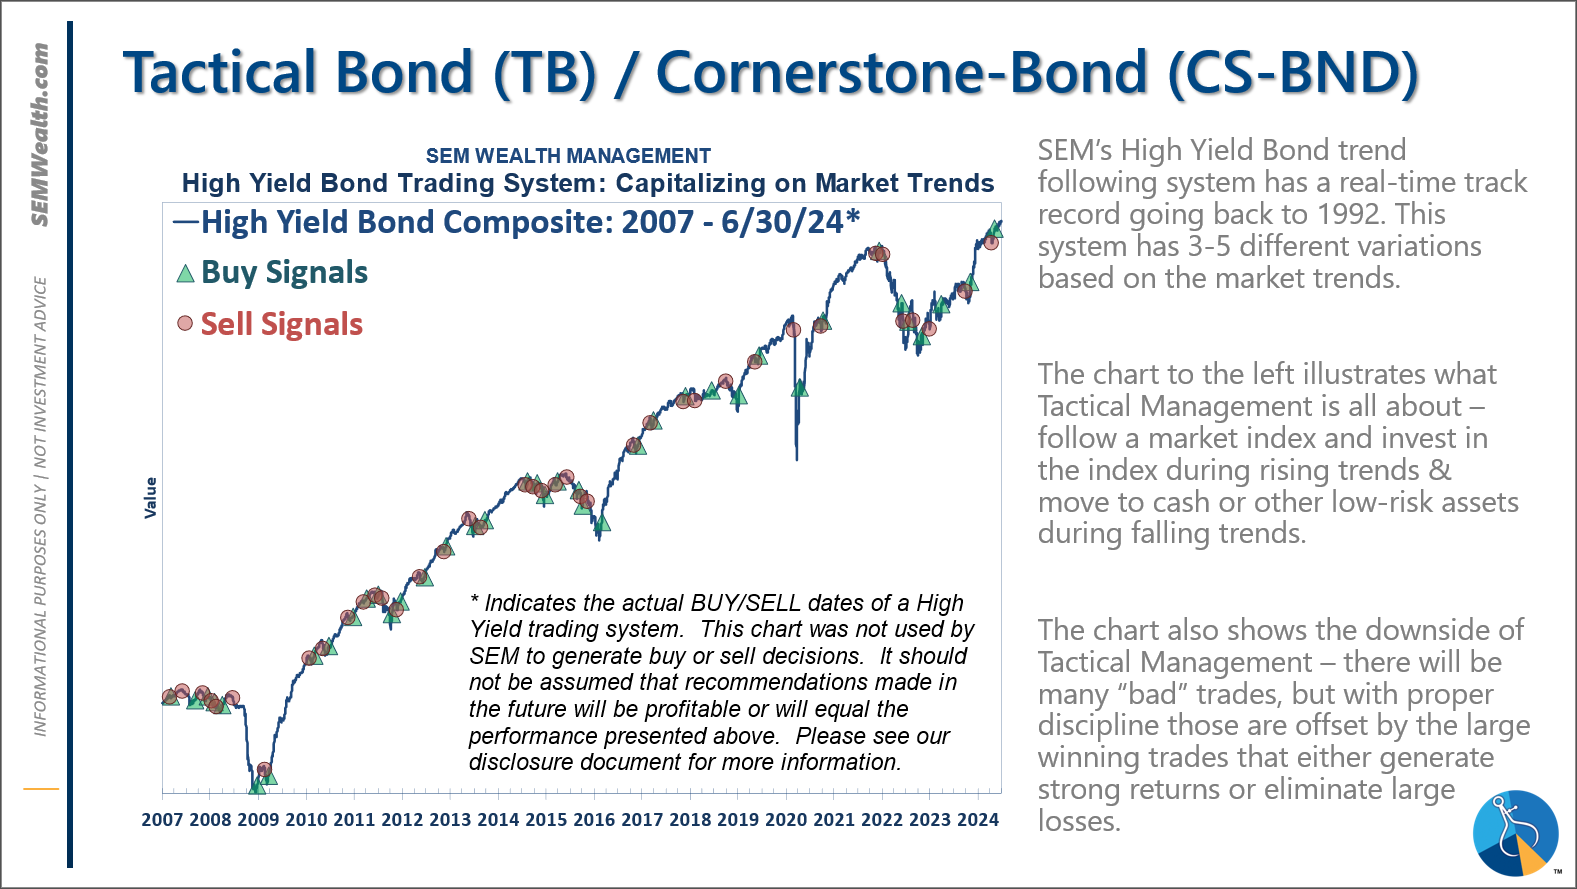
-Tactical High Yield had a partial buy signal on 5/6/24, reversing some of the sells on 4/16 & 17/2024 - the other portion of the signal remains on a sell as high yields continue to oscillate.
-Dynamic Models are 'neutral' as of 6/7/24, reversing the half 'bearish' signal from 5/3/2024. *NEW* 7/8/24 - interest rate model filled from partially bearish to partially bullish (lower long-term rates).
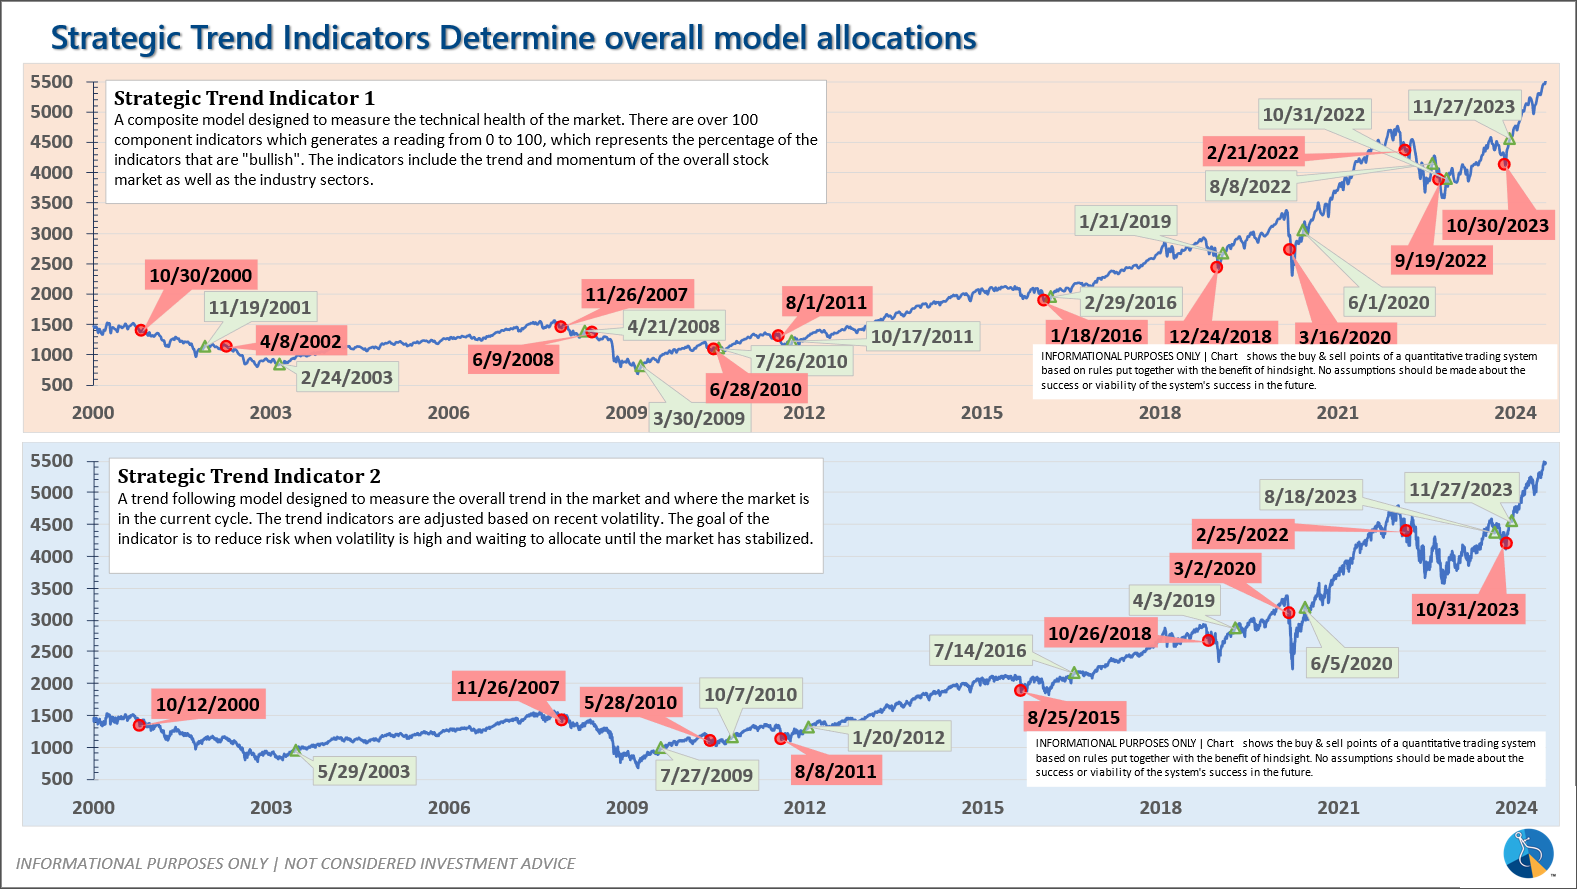
-Strategic Trend Models went on a buy 11/27/2023; *NEW* 7/8/24 – small and mid-cap positions eliminated with latest Core Rotation System update – money shifted to Large Cap Value (Dividend Growth) & International Funds
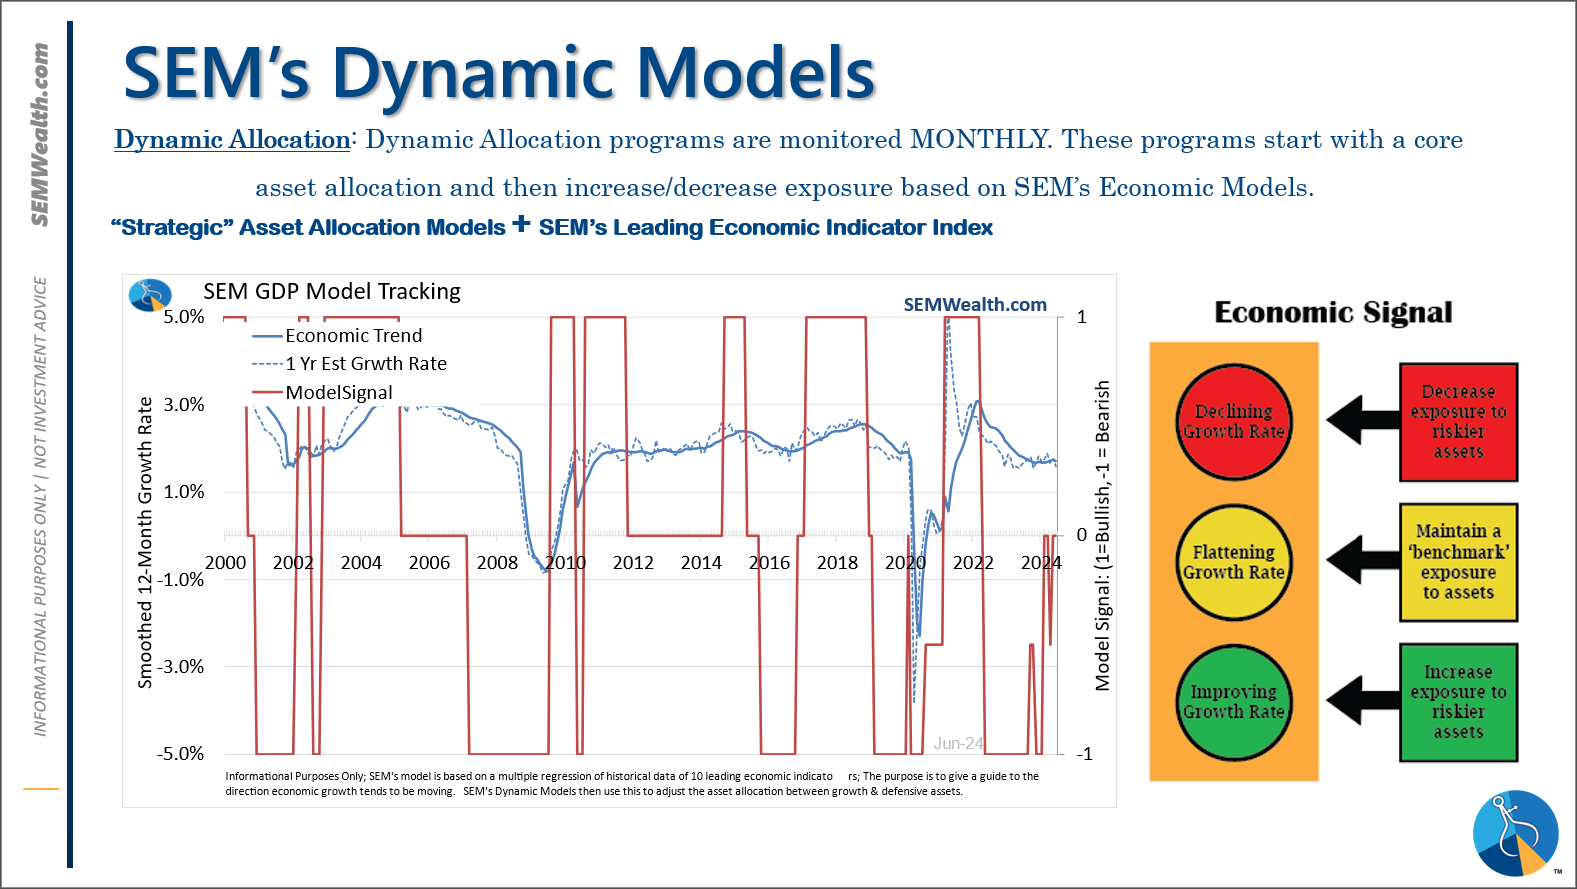
SEM deploys 3 distinct approaches – Tactical, Dynamic, and Strategic. These systems have been described as 'daily, monthly, quarterly' given how often they may make adjustments. Here is where they each stand.
Tactical (daily): On 5/6/24 about half of the signals in our high yield models switched to a buy. The other half remains in money market funds. The money market funds we are currently invested in are yielding between 4.8-5.3% annually.
Dynamic (monthly): The economic model was 'neutral' since February. In early May the model moved slightly negative, but reversed back to 'neutral' in June. This means 'benchmark' positions – 20% dividend stocks in Dynamic Income and 20% small cap stocks in Dynamic Aggressive Growth. The interest rate model is slightly 'bullish'.
Strategic (quarterly)*: BOTH Trend Systems reversed back to a buy on 11/27/2023
The core rotation is adjusted quarterly. On August 17 it rotated out of mid-cap growth and into small cap value. It also sold some large cap value to buy some large cap blend and growth. The large cap purchases were in actively managed funds with more diversification than the S&P 500 (banking on the market broadening out beyond the top 5-10 stocks.) On January 8 it rotated completely out of small cap value and mid-cap growth to purchase another broad (more diversified) large cap blend fund along with a Dividend Growth fund.
The * in quarterly is for the trend models. These models are watched daily but they trade infrequently based on readings of where each believe we are in the cycle. The trend systems can be susceptible to "whipsaws" as we saw with the recent sell and buy signals at the end of October and November. The goal of the systems is to miss major downturns in the market. Risks are high when the market has been stampeding higher as it has for most of 2023. This means sometimes selling too soon. As we saw with the recent trade, the systems can quickly reverse if they are wrong.
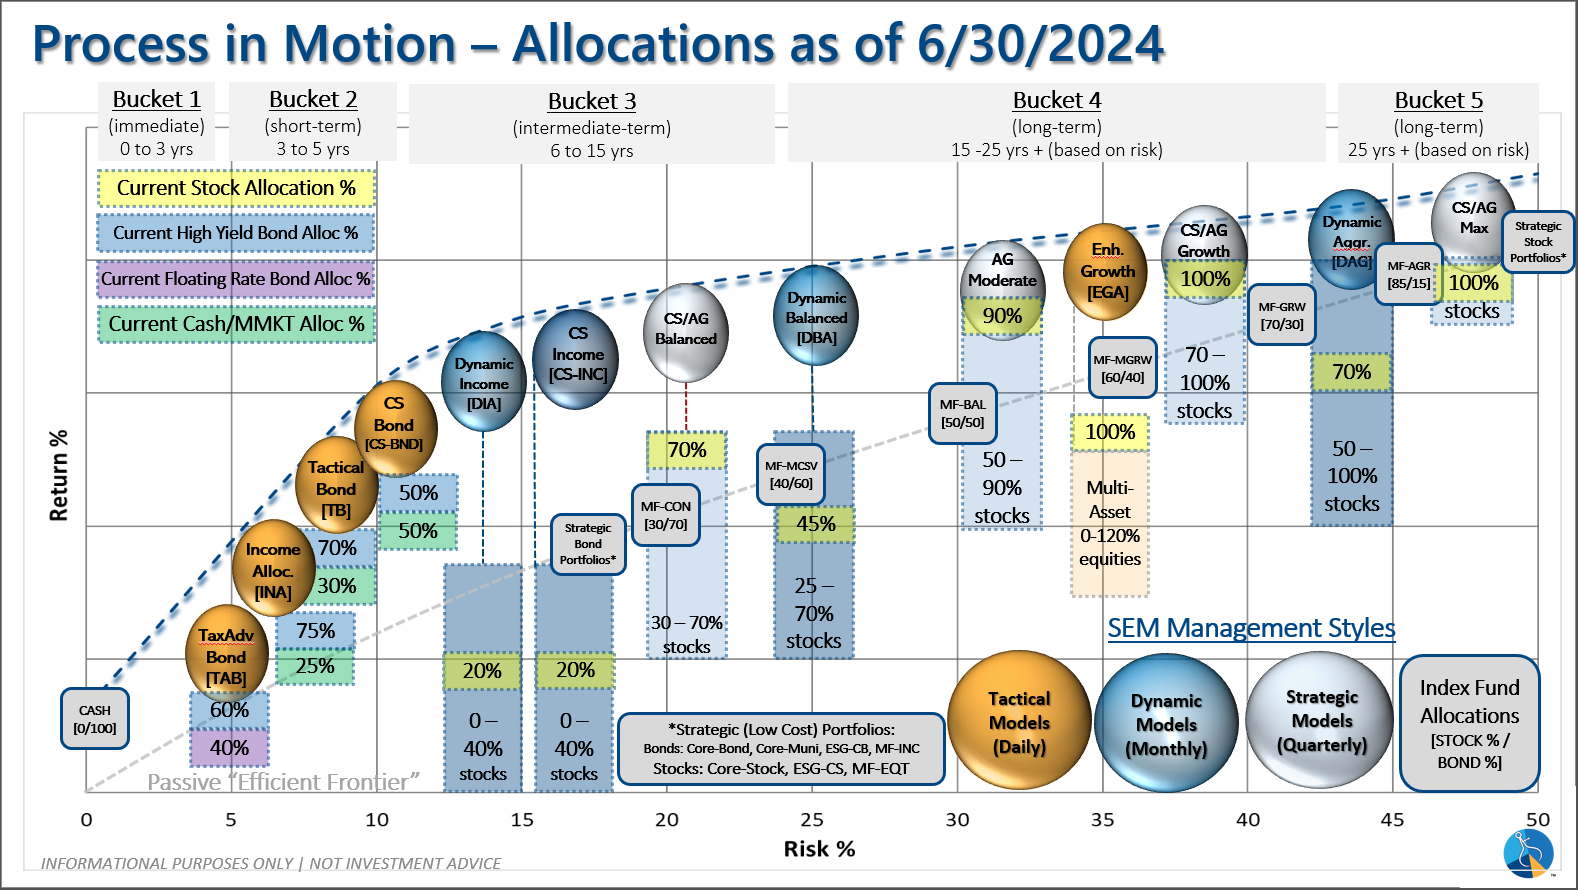
Overall, this is how our various models stack up based on the last allocation change:
Questions or comments - drop us a note?
Curious if your current investment allocation aligns with your overall objectives and risk tolerance? Take our risk questionnaire