
Long weekends are a good time to relax, reflect, and plan. Historically the end of Labor Day weekend also marked the time the 'head honchos' from Wall Street returned to the office with fresh ideas and some big portfolio adjustments to make. With everyone able to work remotely now, I'm not sure how much that still happens, but we often do see volume pick-up with some large asset allocation adjustment trades in September.
I read all kinds of articles over the weekend confidently declaring the path the market was going to take for the last 1/3 of the year. The Fed is all but certain to cut interest rates, this will most certainly reverse the decline we've been seeing in the labor market, while also most certainly not causing any resumption of inflation. This will also most certainly lead to a broadening rally in both stocks and bonds. That's the summary of nearly everything I read.
What could go wrong?
Lots of things.
First, as I shared last week, the mid-1990s was pretty much the only time the Fed managed to hike rates and then cut them without seeing a recession. Read about that here:

Second, the mere fact the Fed STARTS cutting rates will not change the dynamics of the labor market. Tech companies have been laying off thousands of employees. Retail businesses, especially those serving middle class and lower customers, are warning about a sharp slowdown in spending. Restaurants are reporting the same thing. Interest rates moving 0.25-0.50% lower isn't going to be enough to suddenly reverse that trend.
Third, the idea that every asset class is going to rally seems misguided. We've talked exhaustively about the yield curve and the problem it creates when it is inverted (not normal – short-term rates higher than long-term rates). Over the past 3 or 4 months we've seen the curve between 5 years and 20 years "normalize" a bit, but we still have a long way to go. Are short-term rates going to come down FASTER than long-term rates have already?
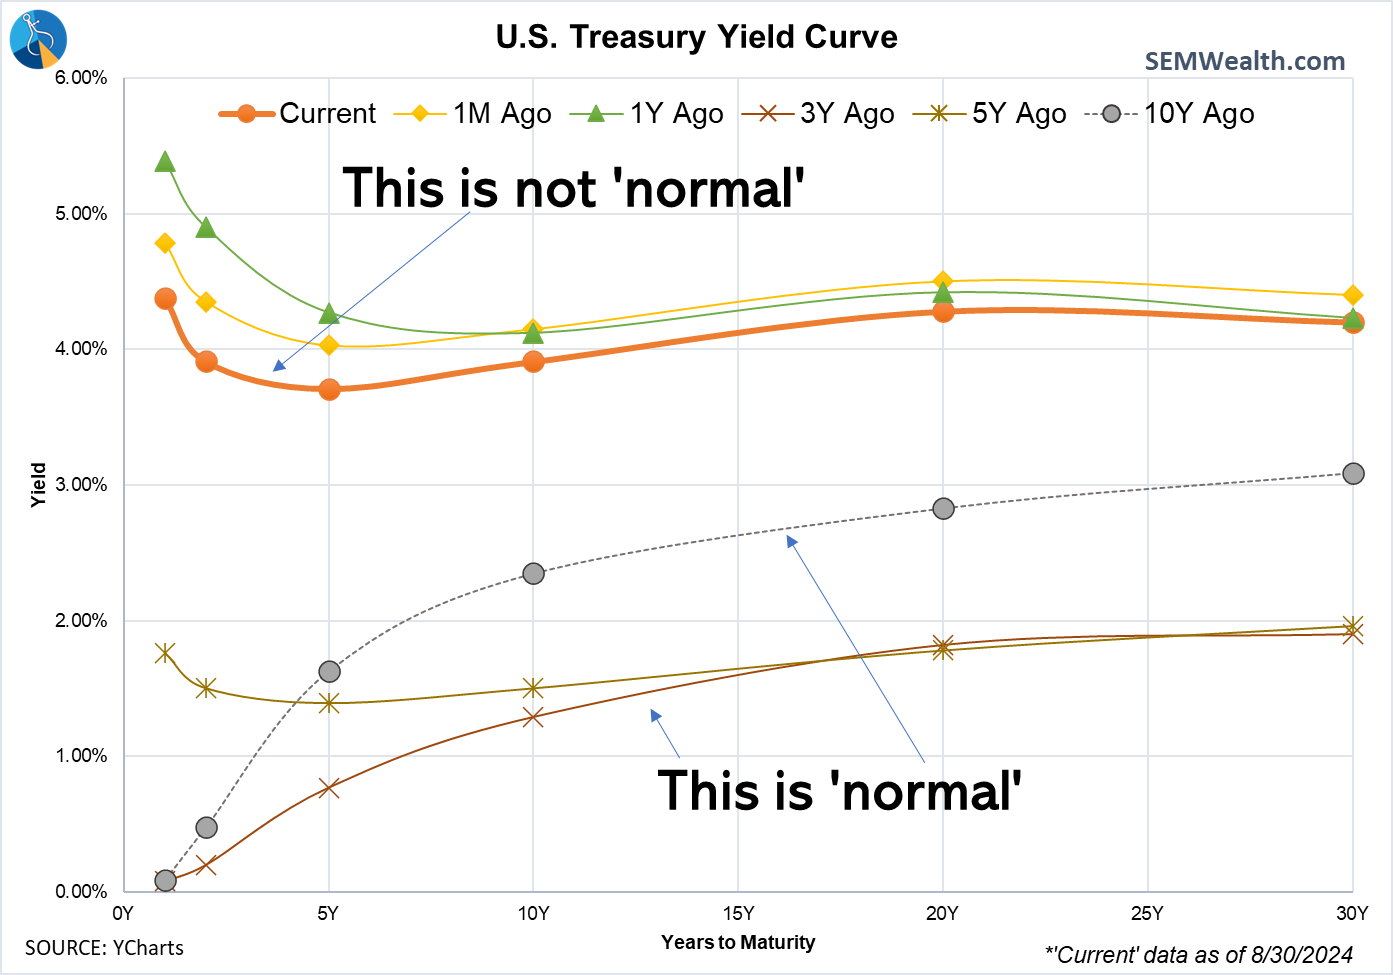
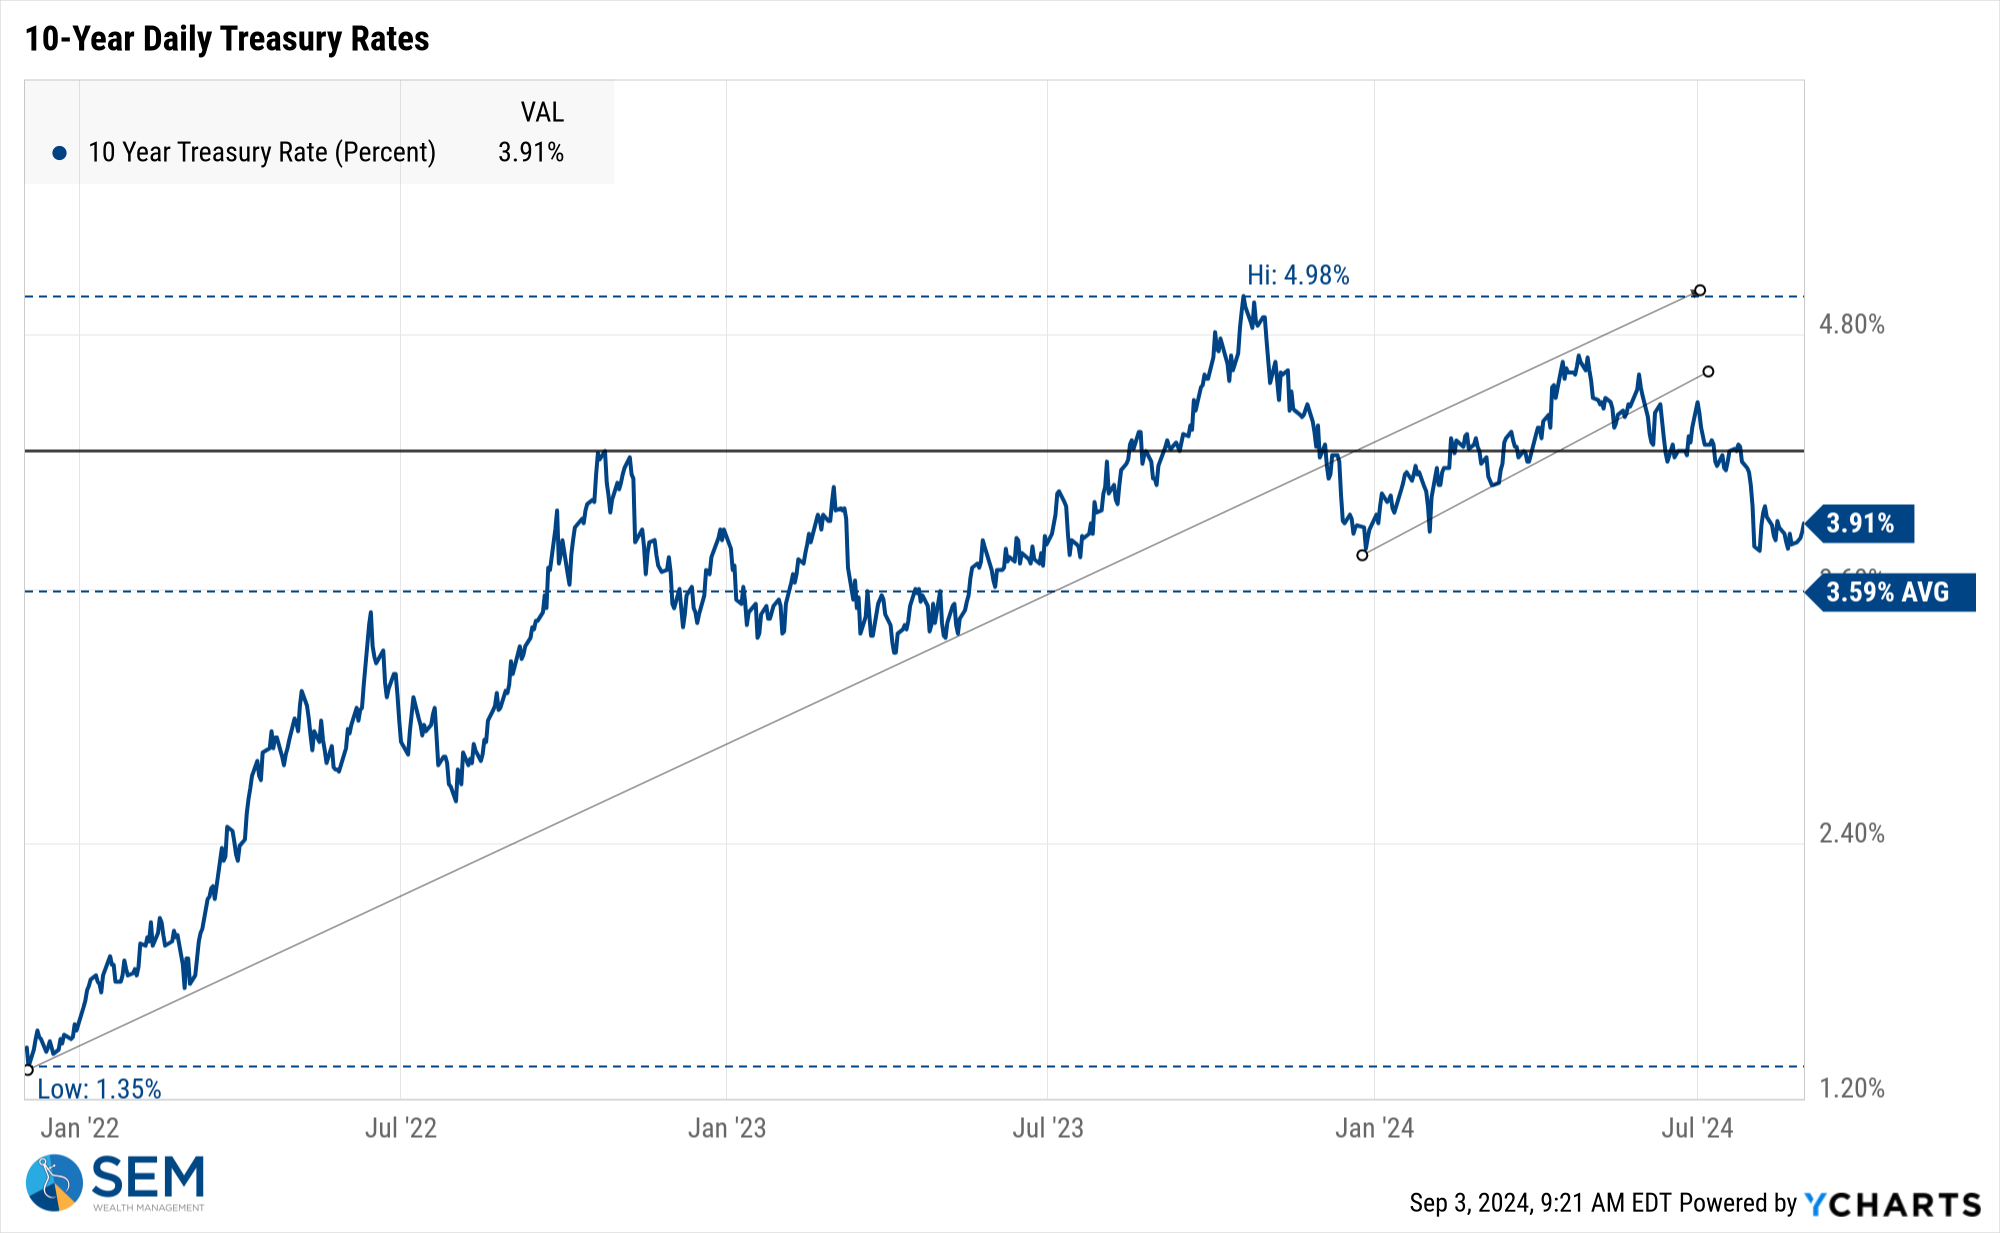
The yield on the 10-year Treasury is already down over 1% since last fall's peak at 4.98% and the curve still isn't normal.
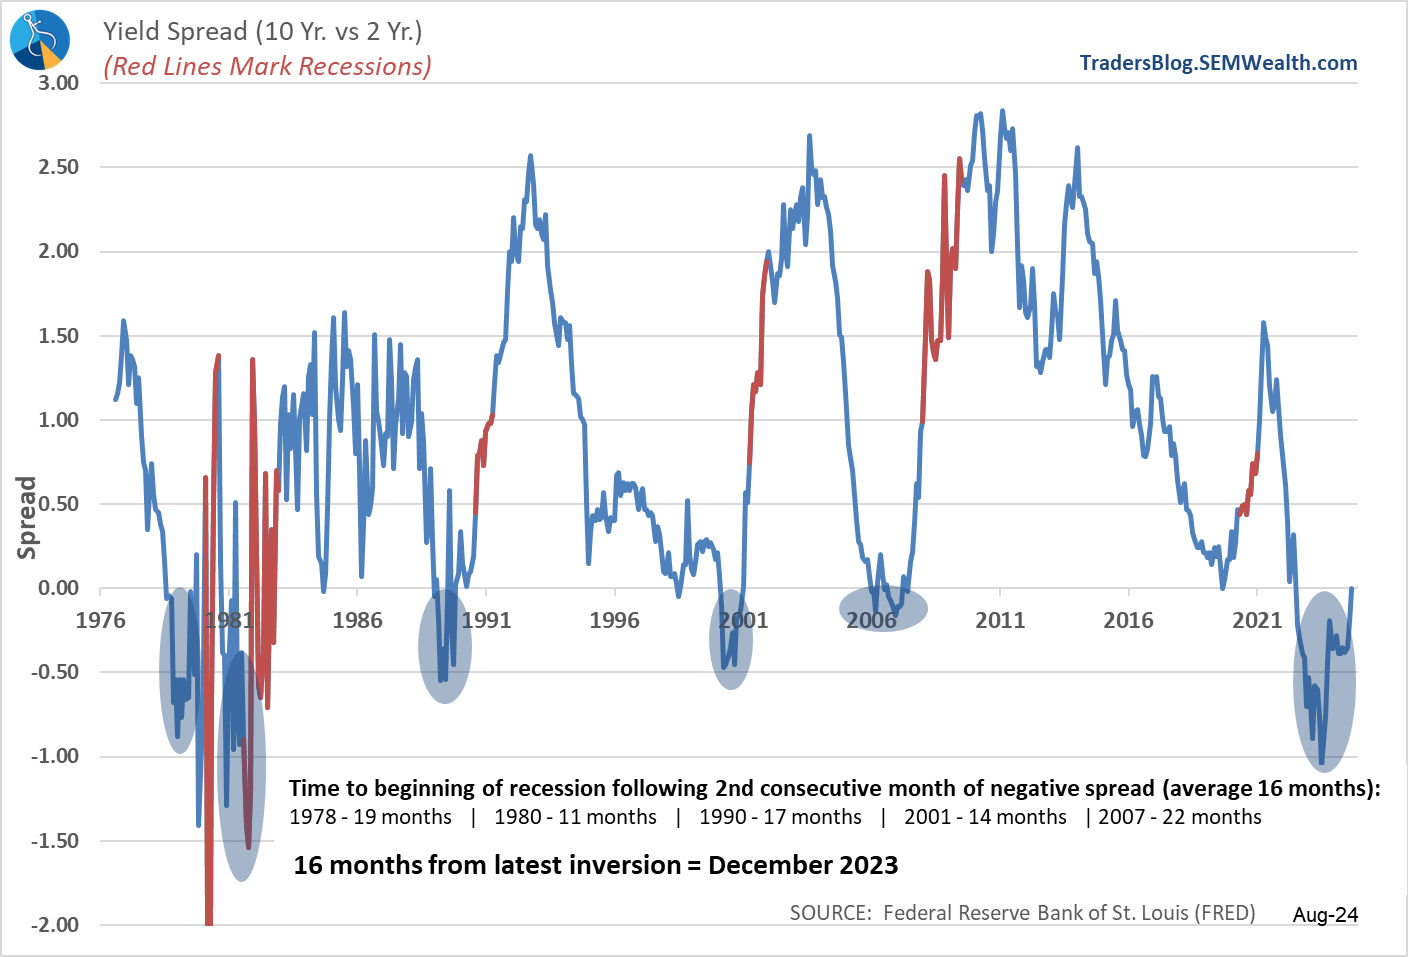
An inverted yield curve creates all kinds of disconnects in risk taking, funding of businesses, capital investment projects, real estate, and normal banking operations. Like a disease, the longer it stays untreated, the more long-term damage we will see. Another thing most people seem to be missing is in all other cases of an inverted yield curve the recession started AFTER the yield curve had already normalized. This is because it takes a while for the damage of the inverted yield curve to become apparent and the 'medicine' applied to the Fed takes some time to work.
Maybe it will be different this time.
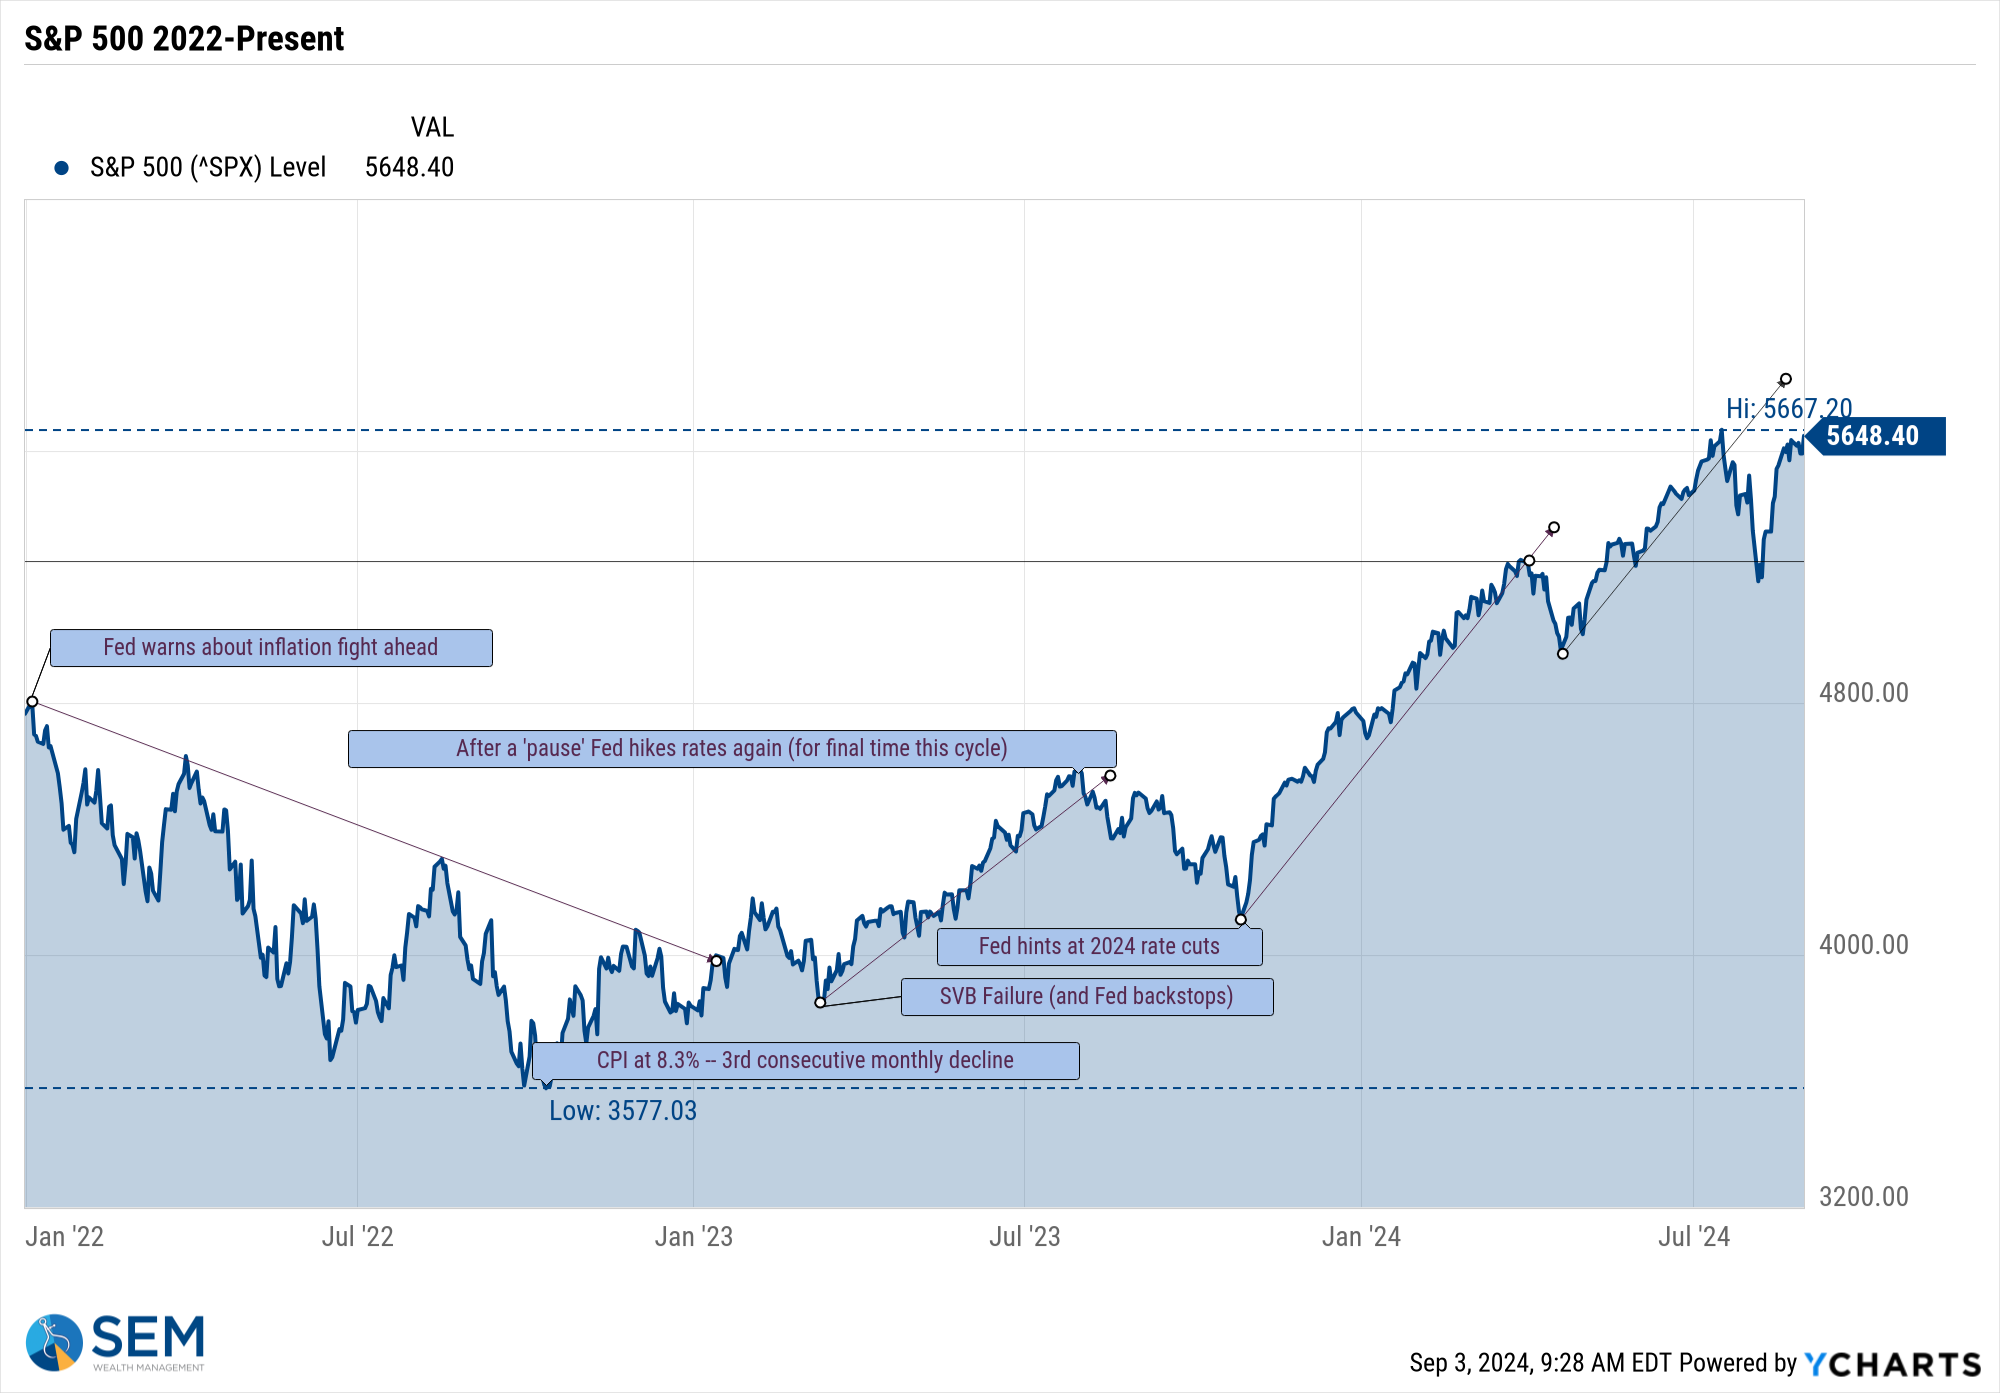
Finally, I always tend to worry when pretty much everybody believes the only thing that will happen is an across the board rally in every investment asset class. I would love to see that, but what basis does everyone have for this confidence? Stocks are nearly back to their all-time highs, completely wiping out the 'scare' of the weak jobs report last month.
Is everything once again right with the world?
Maybe, but that's just a guess. Possibly a dangerous guess if you're not able to withstand the type of drop in stocks and bonds which history tells us could happen at this point in the economic and market cycle.
Sentiment is bearishly high right now (when so many people are optimistic, who is left to buy?) Remember, at its core, stocks (or bonds) go up when more people buy than sell. They go down when more people sell than buy.
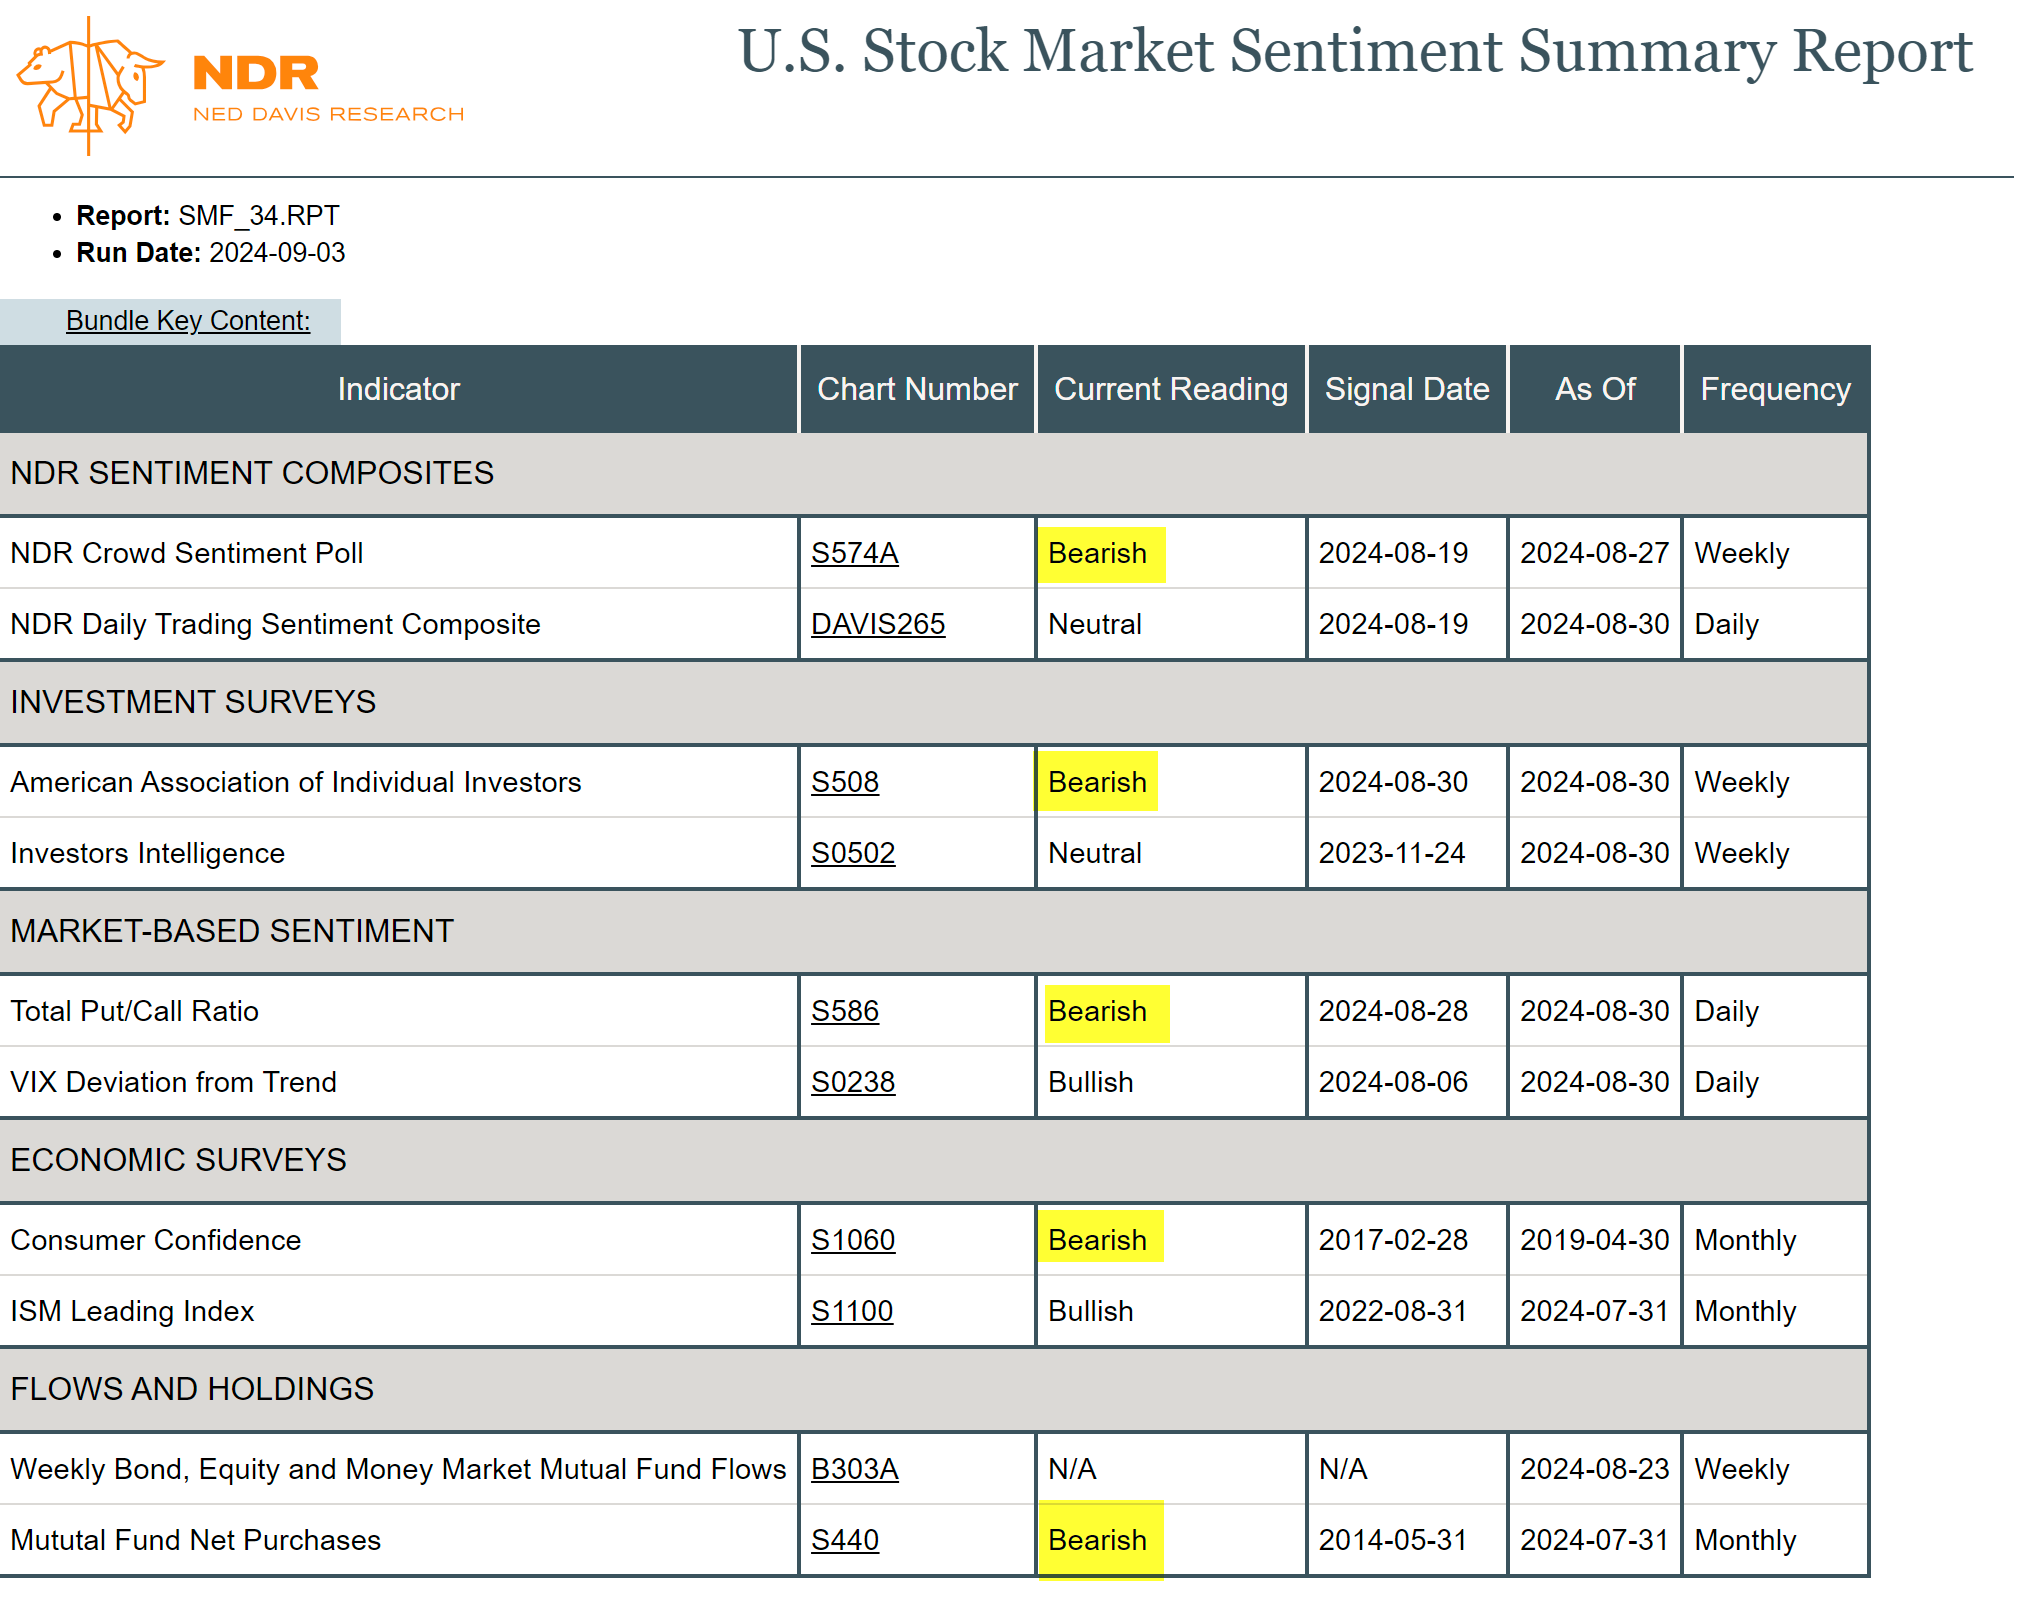
Sentiment indicators are not very good "timing" indicators, meaning the markets can continue moving higher (for a while). For our part we are playing this upward momentum as much as possible. The difference is we aren't GUESSING about how great (or bad) things will be based on what the Fed or economy or inflation may or may not do.
Why guess when you can SEM's time-tested, engineered, quantitative models making the decisions for you?
Note: The "Market Charts" section was skipped this week since several of the usual charts were already included above.
SEM Model Positioning
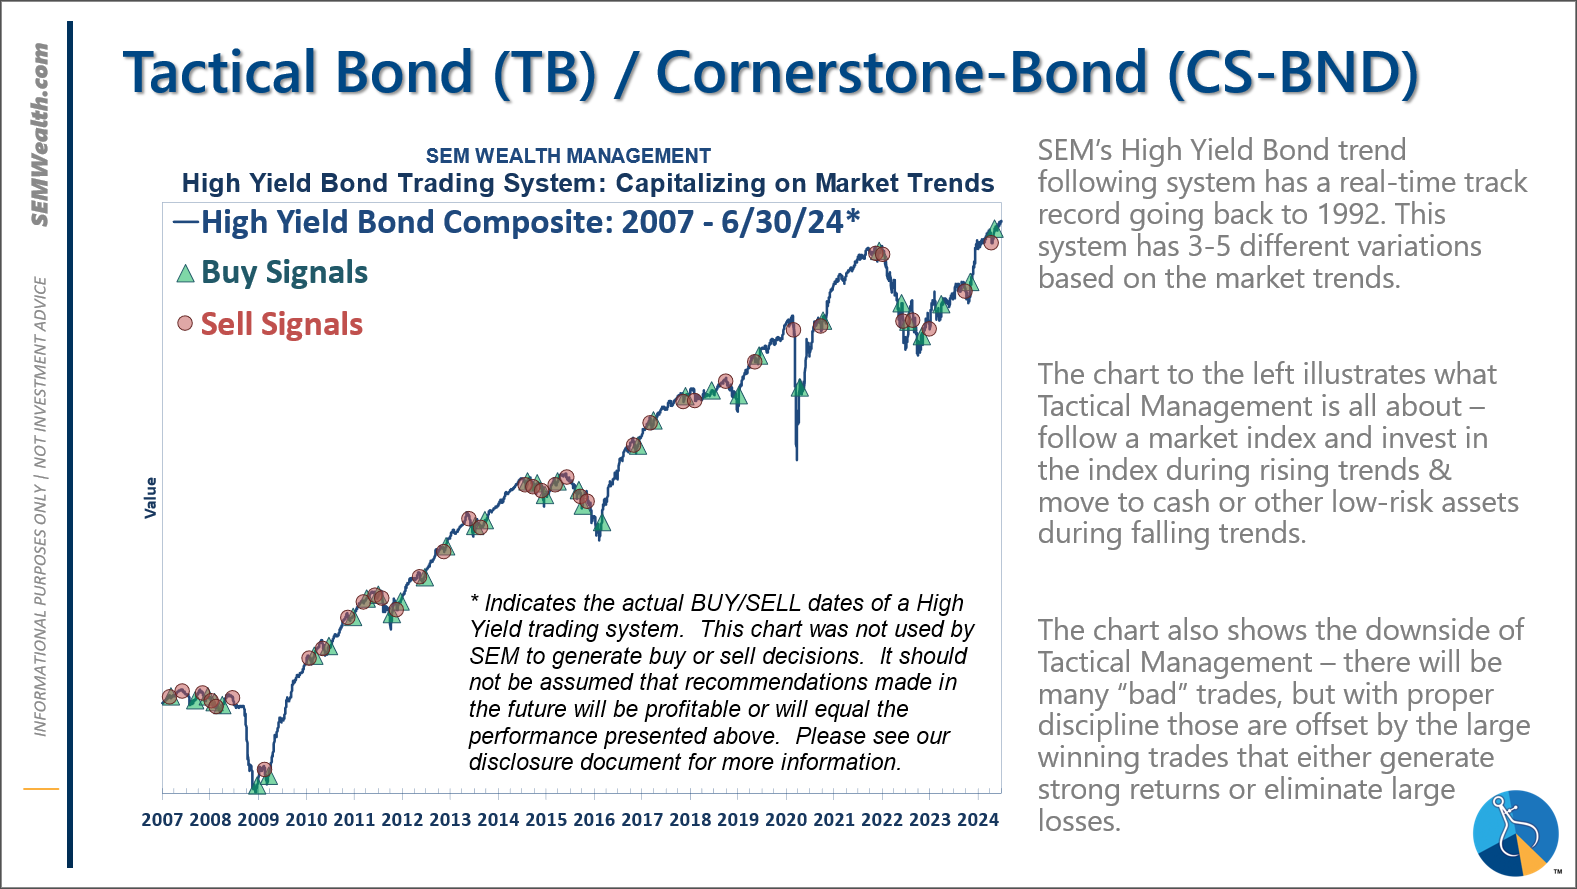
-Tactical High Yield had a partial buy signal on 5/6/24, reversing some of the sells on 4/16 & 17/2024 - the other portion of the signal remains on a sell as high yields continue to oscillate.
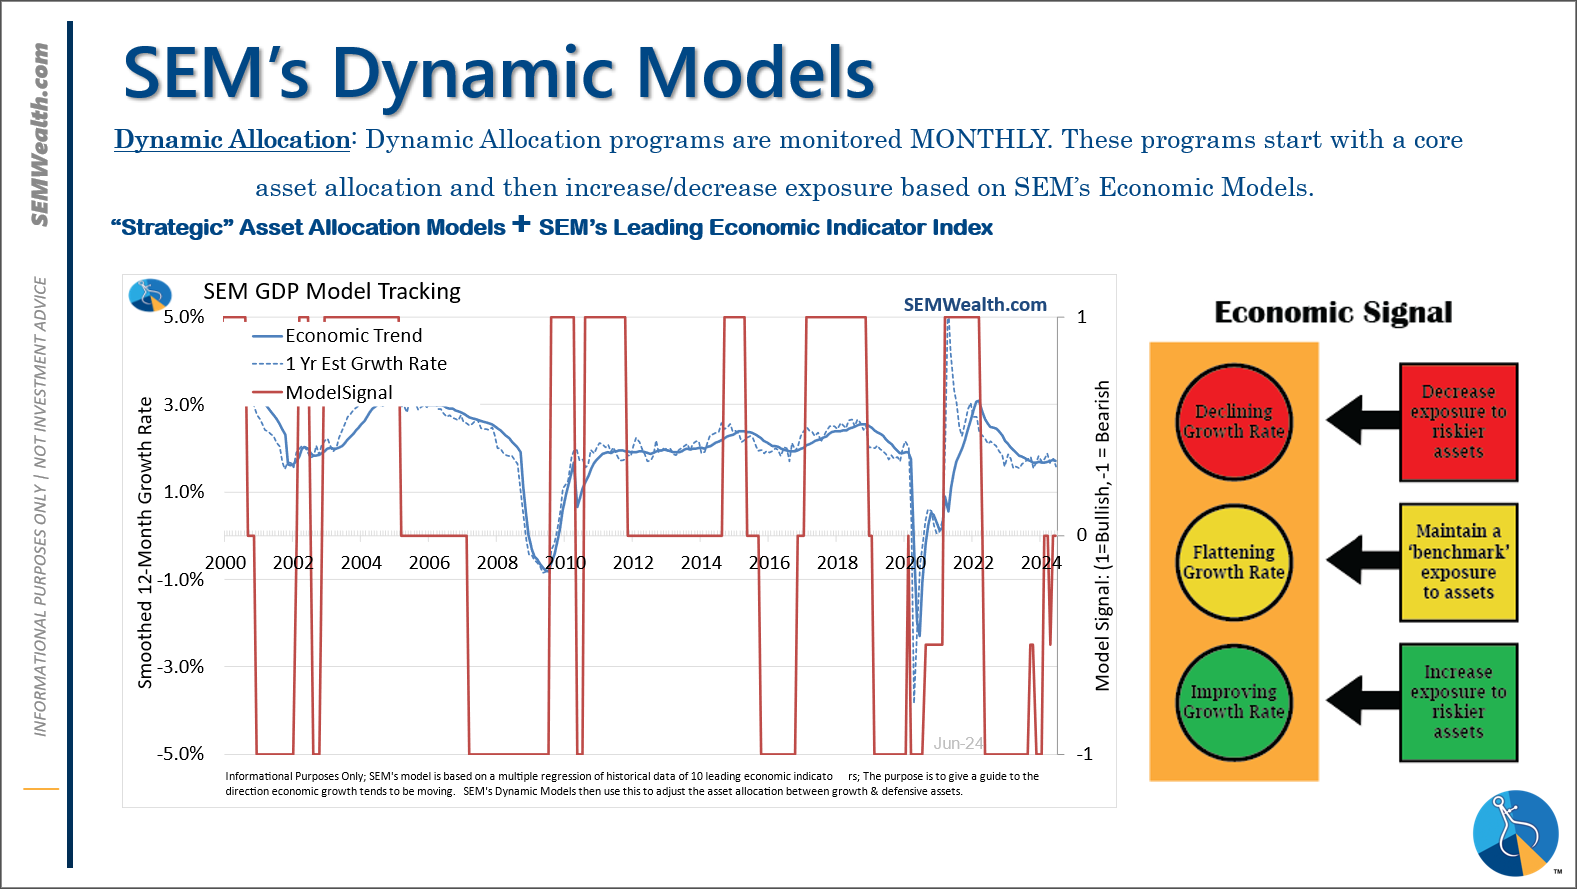
-Dynamic Models are 'neutral' as of 6/7/24, reversing the half 'bearish' signal from 5/3/2024. 7/8/24 - interest rate model flipped from partially bearish to partially bullish (lower long-term rates).
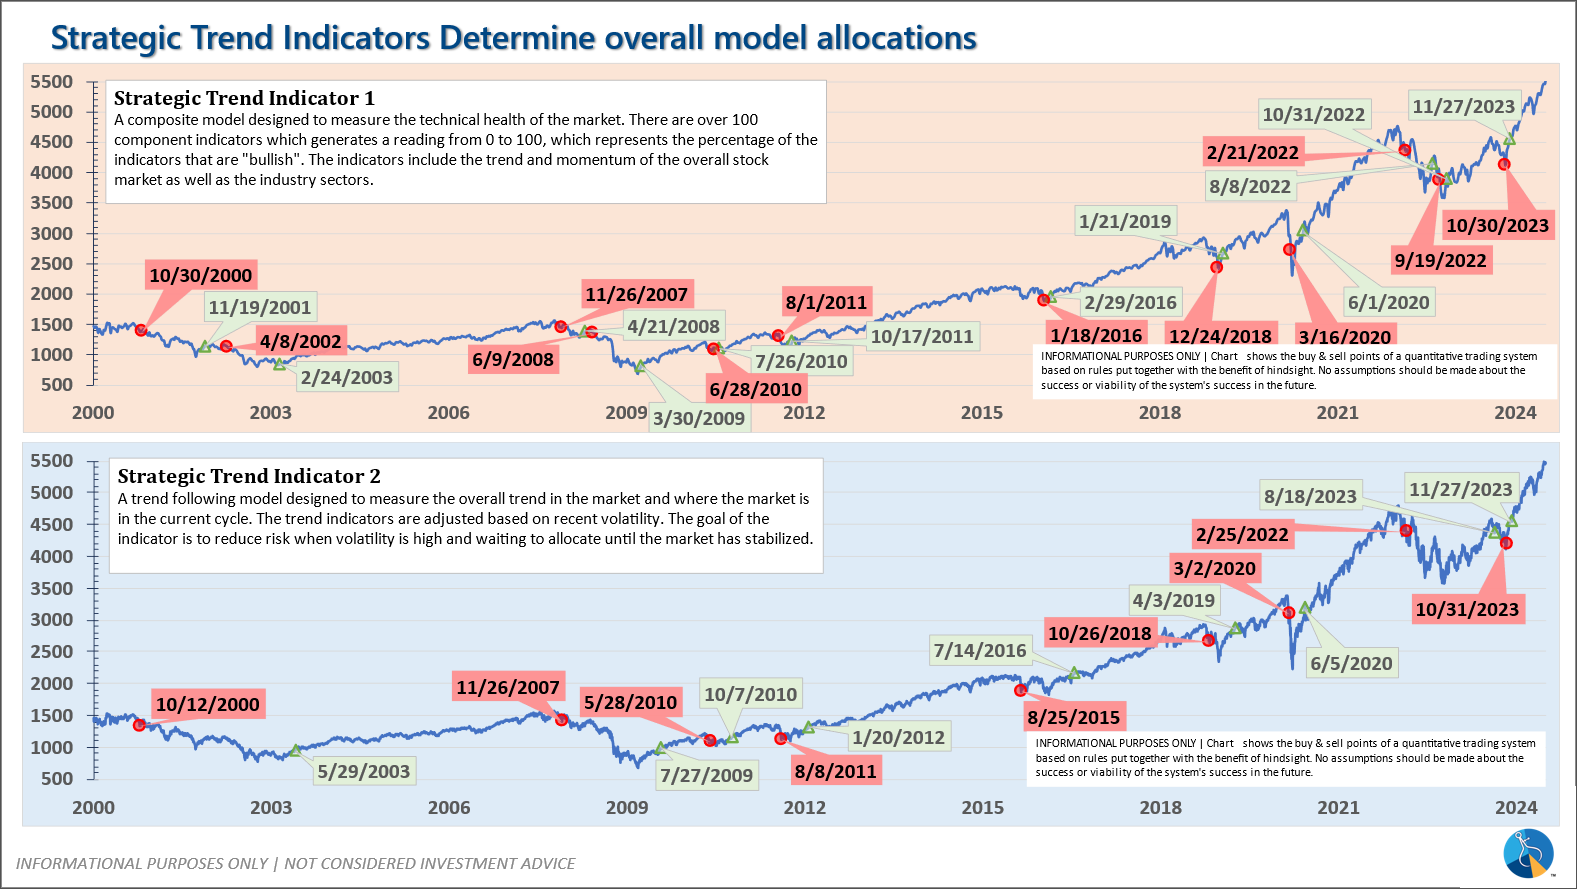
-Strategic Trend Models went on a buy 11/27/2023; 7/8/24 – small and mid-cap positions eliminated with latest Core Rotation System update – money shifted to Large Cap Value (Dividend Growth) & International Funds
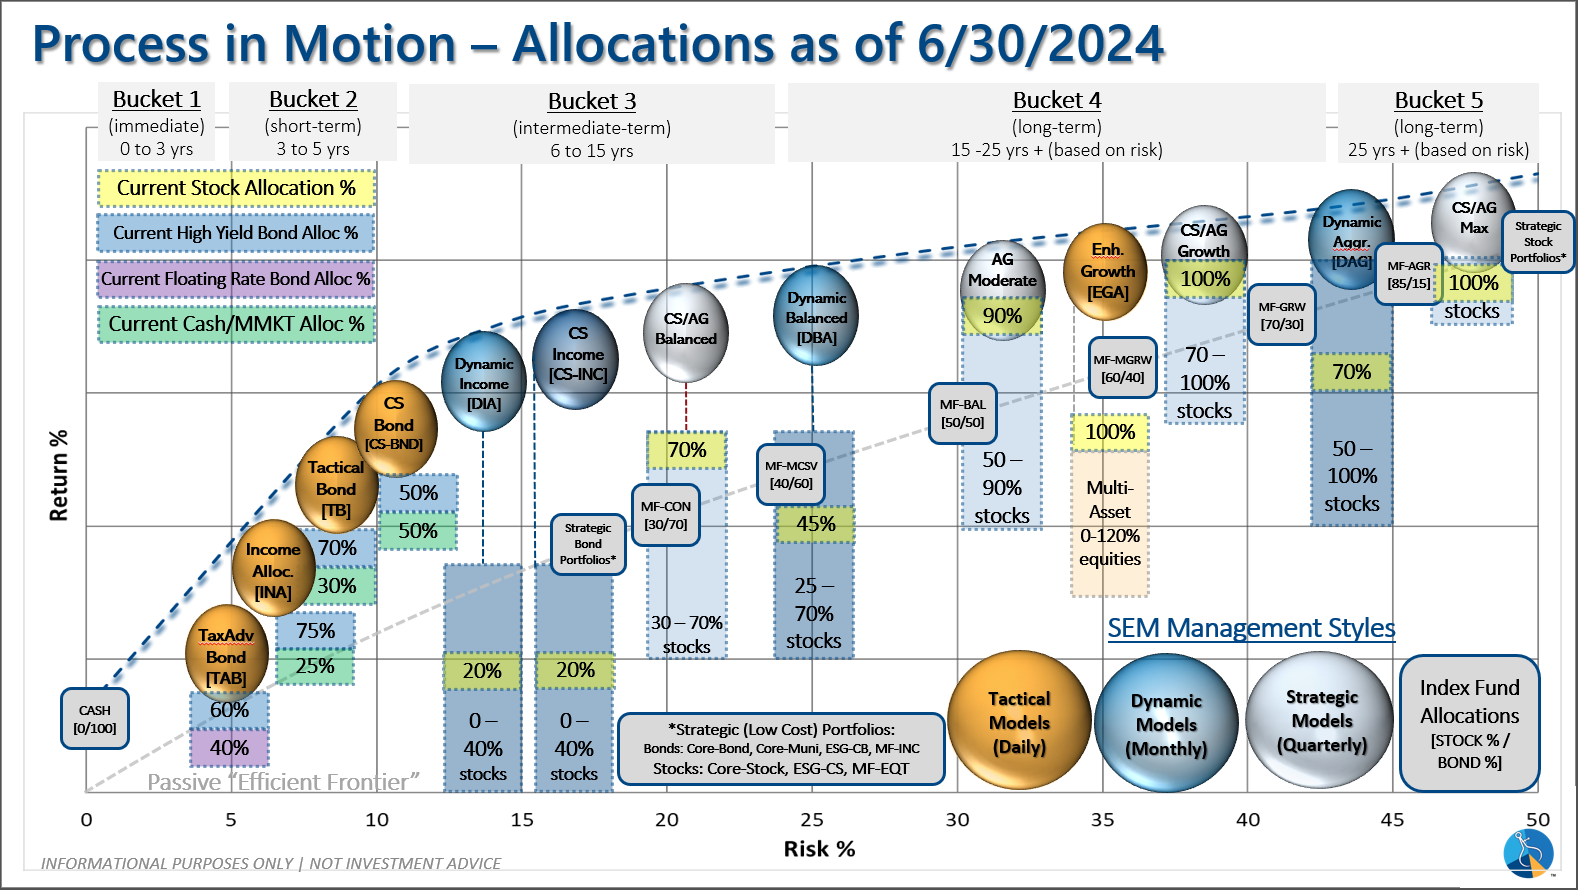
SEM deploys 3 distinct approaches – Tactical, Dynamic, and Strategic. These systems have been described as 'daily, monthly, quarterly' given how often they may make adjustments. Here is where they each stand.
Tactical (daily): On 5/6/24 about half of the signals in our high yield models switched to a buy. The other half remains in money market funds. The money market funds we are currently invested in are yielding between 4.8-5.3% annually.
Dynamic (monthly): The economic model was 'neutral' since February. In early May the model moved slightly negative, but reversed back to 'neutral' in June. This means 'benchmark' positions – 20% dividend stocks in Dynamic Income and 20% small cap stocks in Dynamic Aggressive Growth. The interest rate model is slightly 'bullish'.
Strategic (quarterly)*: BOTH Trend Systems reversed back to a buy on 11/27/2023
The core rotation is adjusted quarterly. On August 17 it rotated out of mid-cap growth and into small cap value. It also sold some large cap value to buy some large cap blend and growth. The large cap purchases were in actively managed funds with more diversification than the S&P 500 (banking on the market broadening out beyond the top 5-10 stocks.) On January 8 it rotated completely out of small cap value and mid-cap growth to purchase another broad (more diversified) large cap blend fund along with a Dividend Growth fund.
The * in quarterly is for the trend models. These models are watched daily but they trade infrequently based on readings of where each believe we are in the cycle. The trend systems can be susceptible to "whipsaws" as we saw with the recent sell and buy signals at the end of October and November. The goal of the systems is to miss major downturns in the market. Risks are high when the market has been stampeding higher as it has for most of 2023. This means sometimes selling too soon. As we saw with the recent trade, the systems can quickly reverse if they are wrong.
Overall, this is how our various models stack up based on the last allocation change:
Questions or comments - drop us a note?
Curious if your current investment allocation aligns with your overall objectives and risk tolerance? Take our risk questionnaire


