
Friday morning I had CNBC on while I made our twins' breakfast. It was the morning of the jobs report and I wanted to get a feel for the market's reaction. As is often the case one 'expert' would argue how good things are and another 'expert' would state his case for the exact opposite. My son said, "how can you tell which one is right?"
"You can't," was my response.
"What's the point then?" he asked.
"That's a good question," I replied. I then went on to explain I was watching more out of curiosity to see the tone of the analysts and what they were focusing on. Having done this the first Friday of every month for over 26 years it is telling to watch the reaction. This month's reaction was heated, full of rhetoric, and mixed with plenty of comments about how it is difficult to get a read on the economy because of the unprecedented measures used during and after the pandemic.
Our conversation continued about those measures, why they had to happen, the role of the Federal Reserve, and how investors can use the data. Near the end, my son said, "I don't think I'd want to take my advice from any of these people."
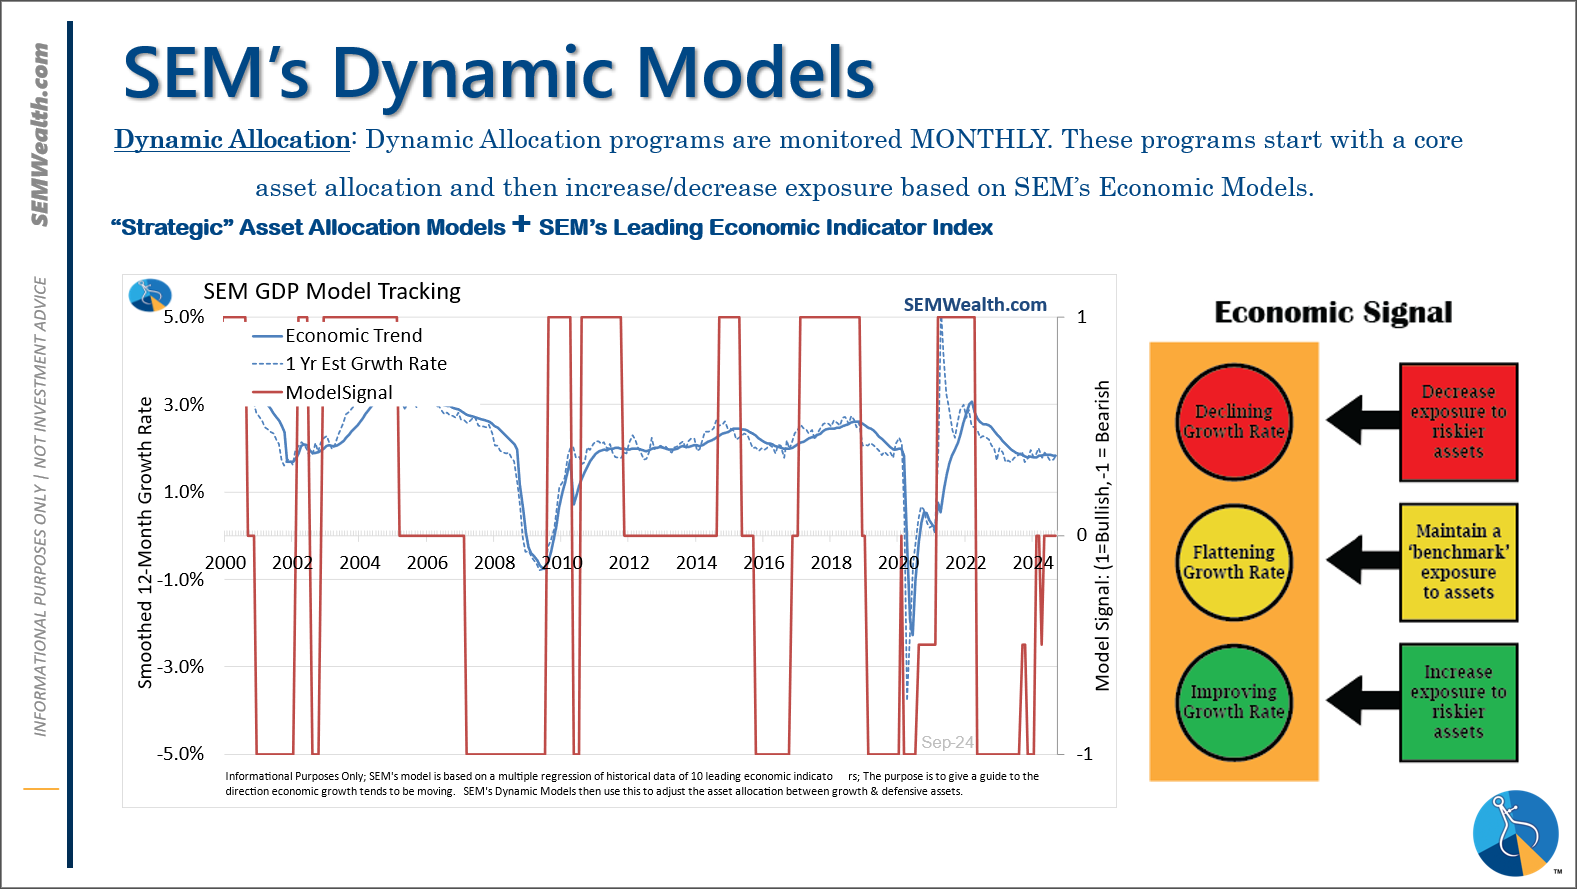
"Neither would I," I replied and then went on to summarize what he already knew – this is yet another reason at SEM we stick to the data, not our opinions when making investment decisions. Each month following the jobs report, we close the month on our economic model. For newer readers, this model is a quantitative model I developed back in 1995 to give a more clear reading about the direction of the economy. I first began watching CNBC (formerly known as the Financial News Network) back in 1992, so after several years of watching these 'experts' argue and dissect every economic reading, I wanted something a bit more clear.
The model is not designed to make absolute, concrete predictions about the next move in the economy. My testing found (and continues to find) it is very difficult to predict the exact performance of the economy. Instead the model tells us what state the economy is currently in based on the underlying data:
1.) Accelerating: The pace of growth is INCREASING at a level ABOVE the long-term average.
2.) Neutral: The pace of growth is relatively FLAT and is indicating growth slightly BELOW average.
3.) Slowing: The pace of growth is DECELERATING and is indicating growth well BELOW average.
The 'average' long-term growth rate is around 3.1% (although the model dynamically adjusts). Historically the stock and bond markets are the most volatile when the model is 'neutral'. This makes sense because we have conflicting data – some is showing improvement and some deterioration. It leaves all the 'experts' vehemently arguing about the direction of the economy.
This is where we are today.
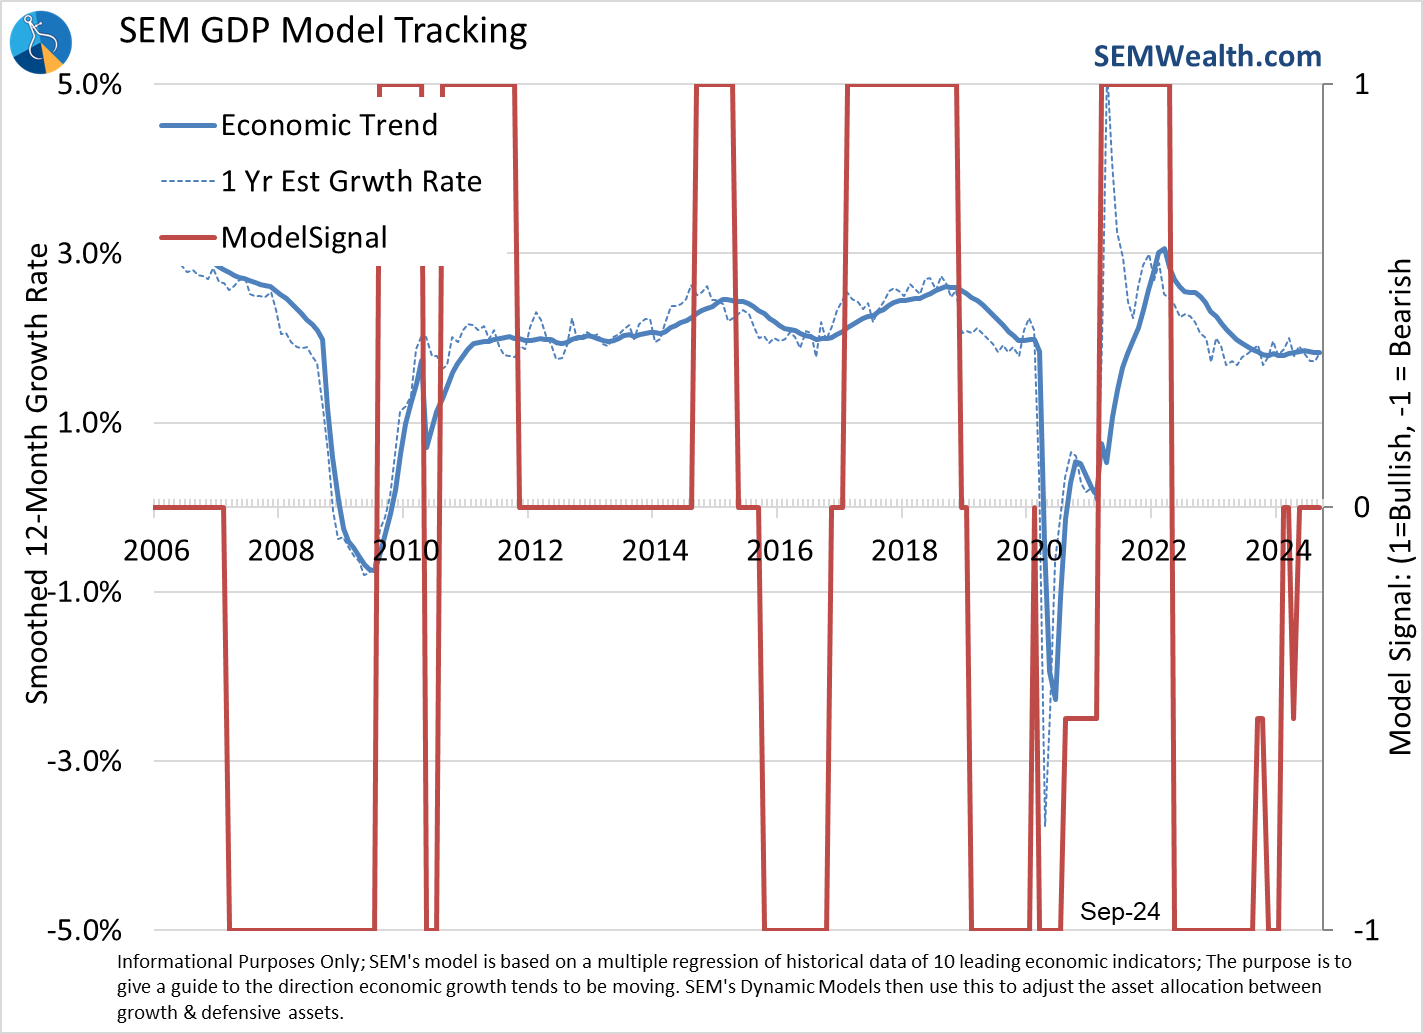
Looking at our dashboard of indicators it is obvious to me guessing about the direction of the economy could not be more difficult at this time. Both the 2-year trend and the GDP Indicator makes it clear – we don't currently have a trend.
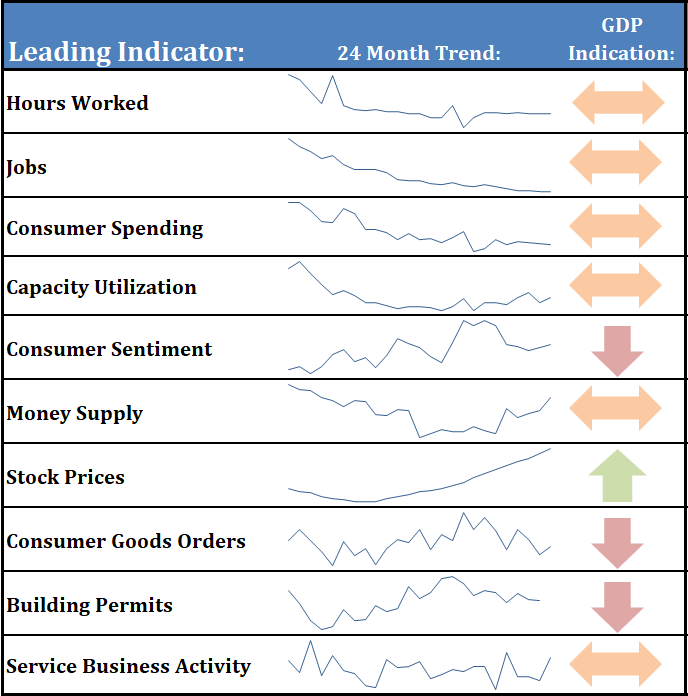
The ferocity of the debate last Friday (and for the past several months) has been about whether or not we are heading towards recession, if inflation will continue to decelerate, and what the Fed should do based on these two conflicting indicators. The economic data last week was overall quite positive, which is good if you want the economy to grow at a pace to support the above average growth expectations priced into the market. It's bad news if you are hoping to see the Fed slash rates even further to help support the above average growth expectations priced into the market.
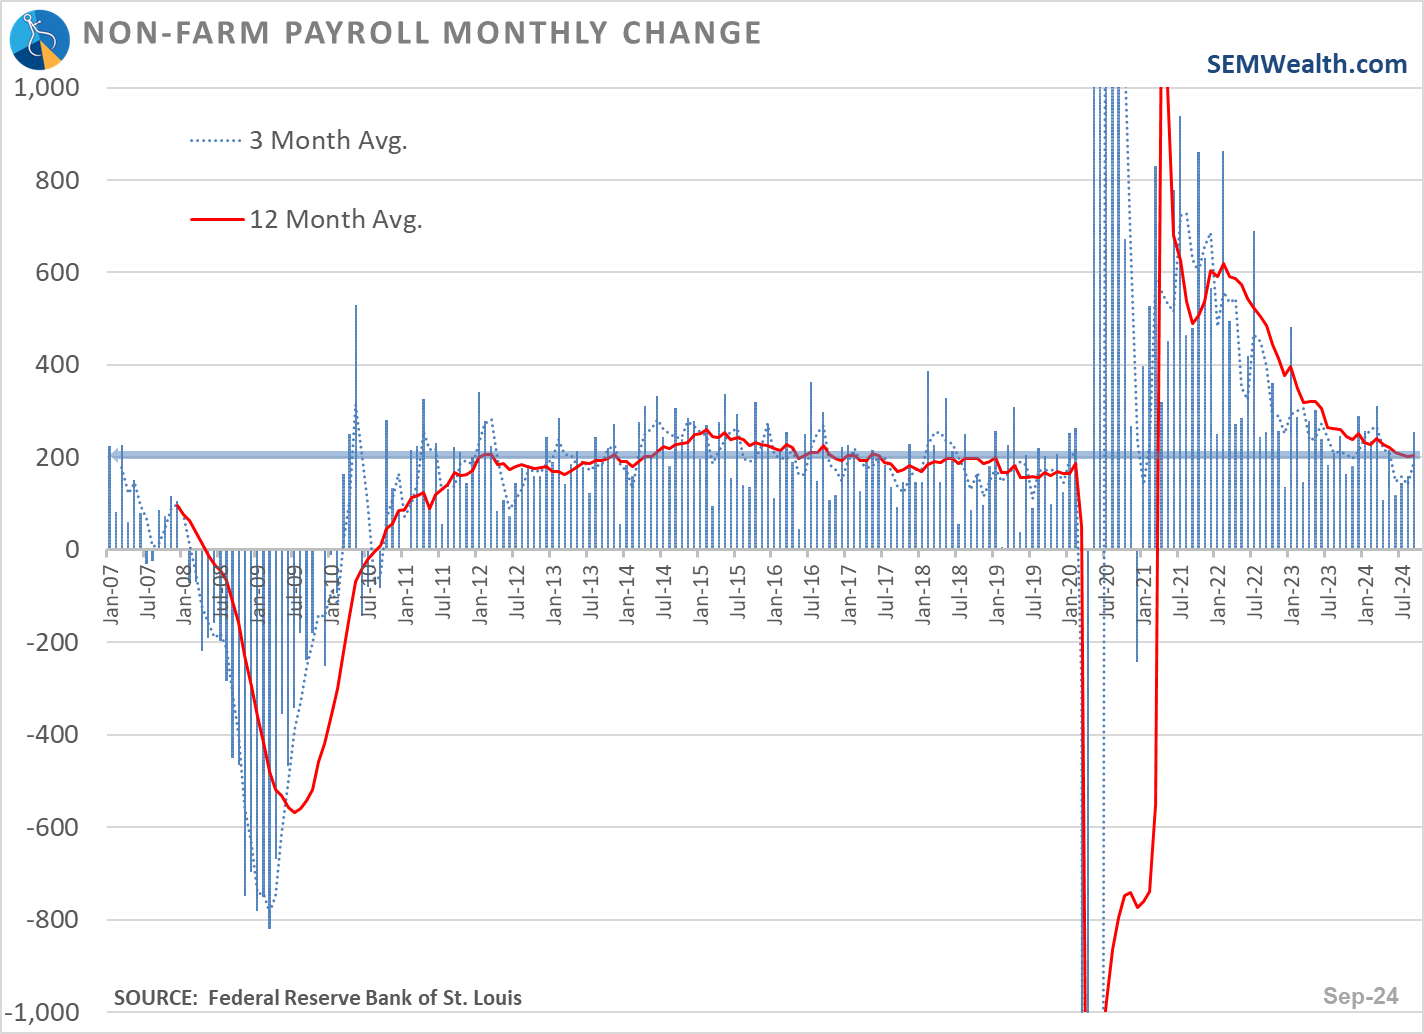
The labor market still appears to be healthy. We've seen improvement in the numbers each of the past 5 months, bringing the 12-month average above 200,000. This is slightly better than what we saw from 2017-2019.
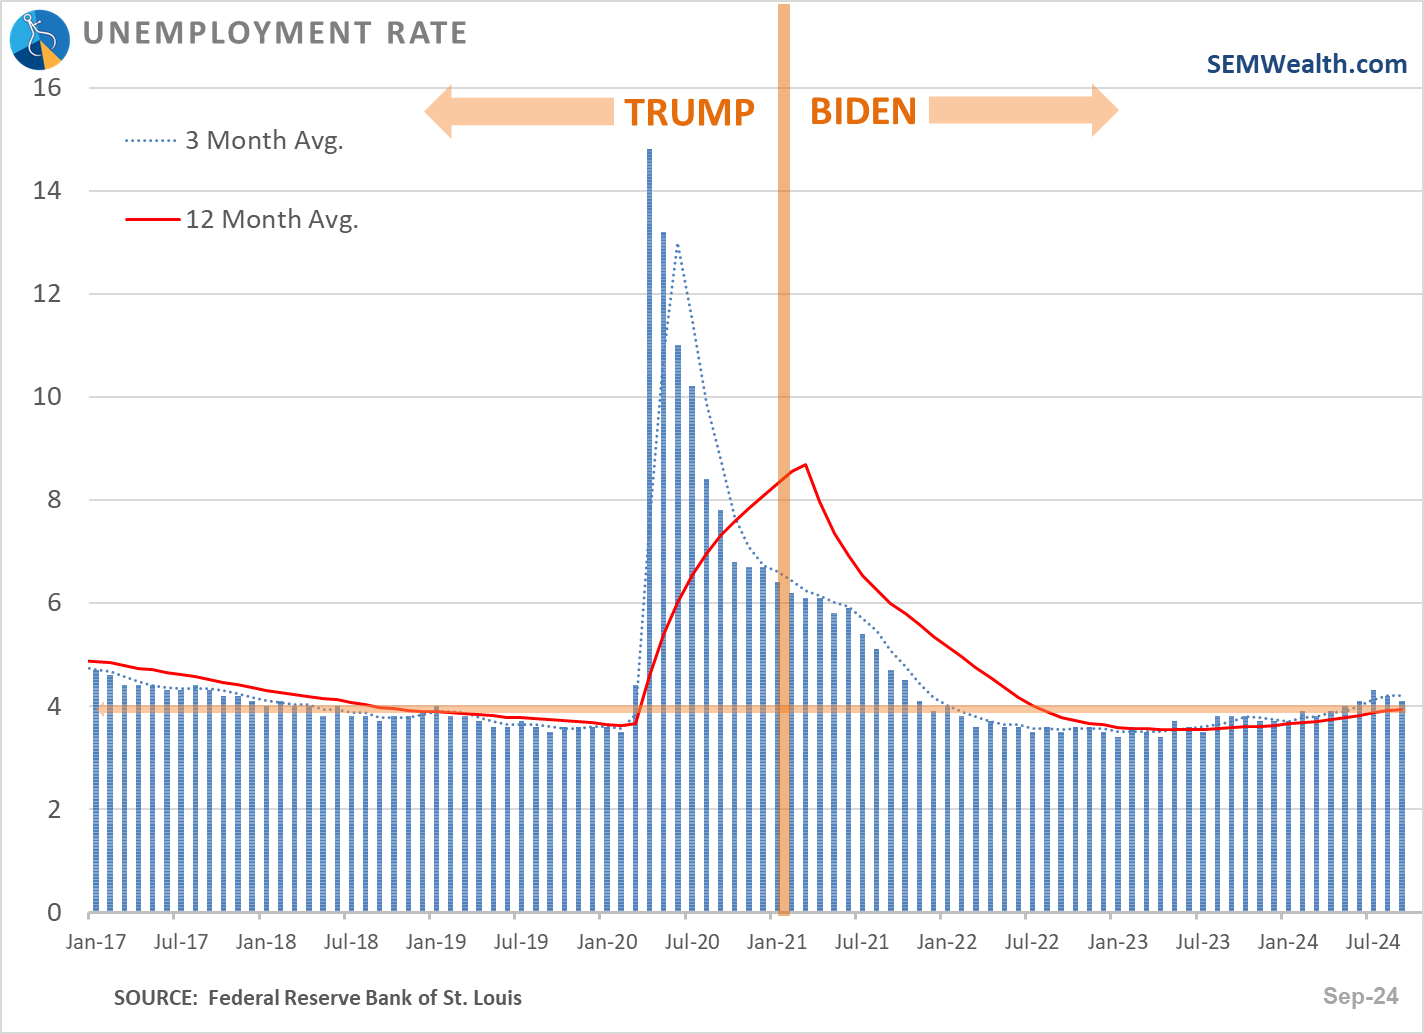
The unemployment rate fell for the third consecutive month with the 12-month average back to February 2020 levels.
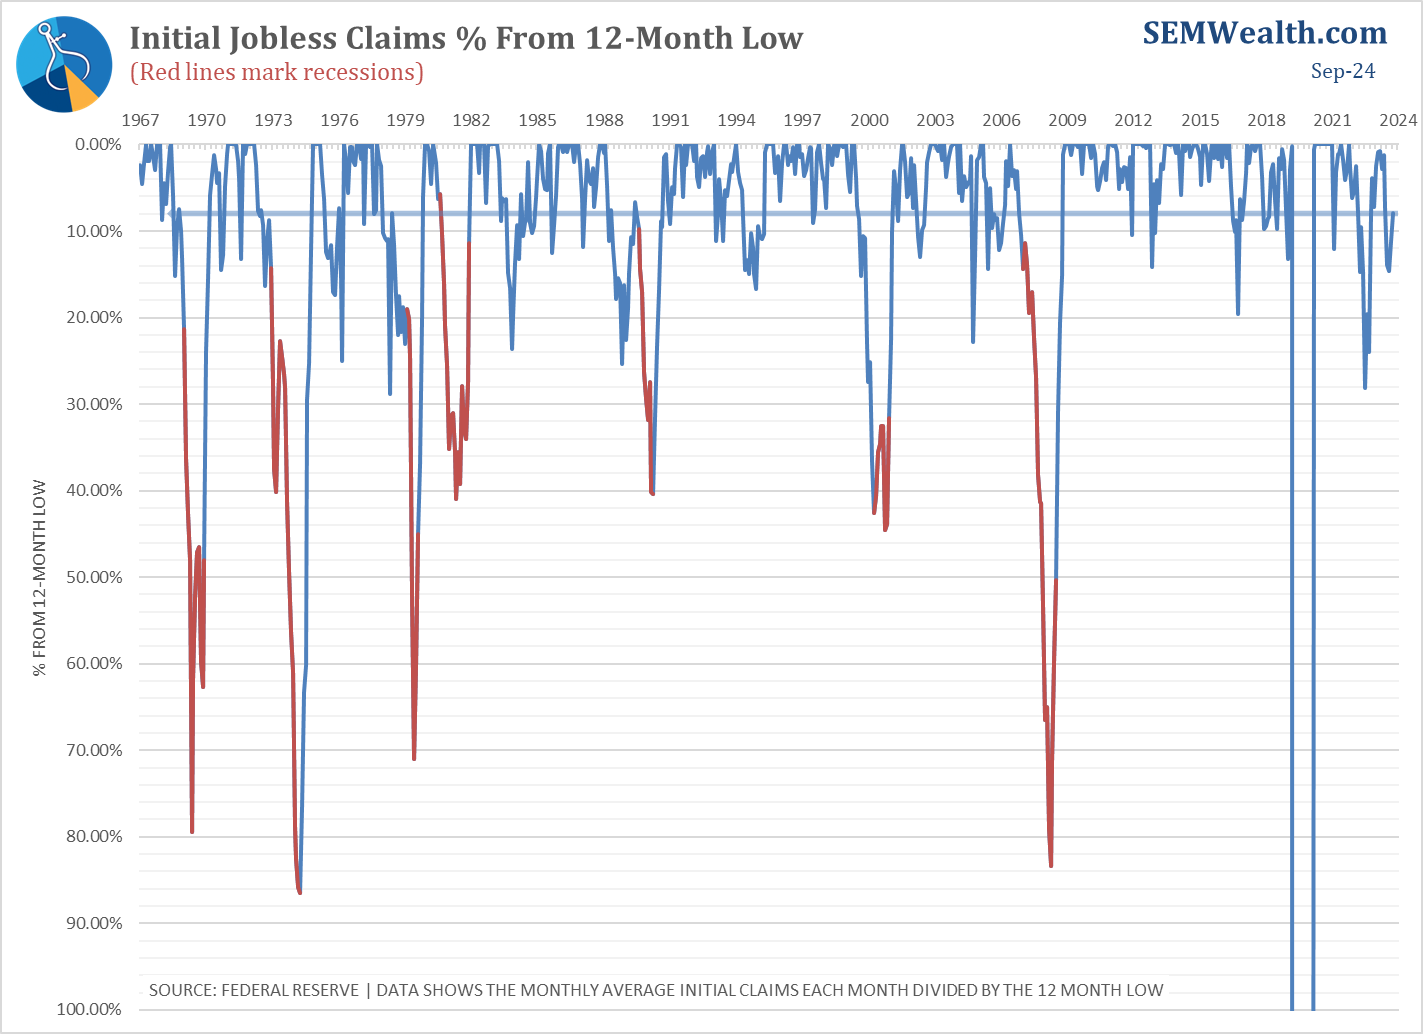
Unemployment claims have also been decreasing the past few months.
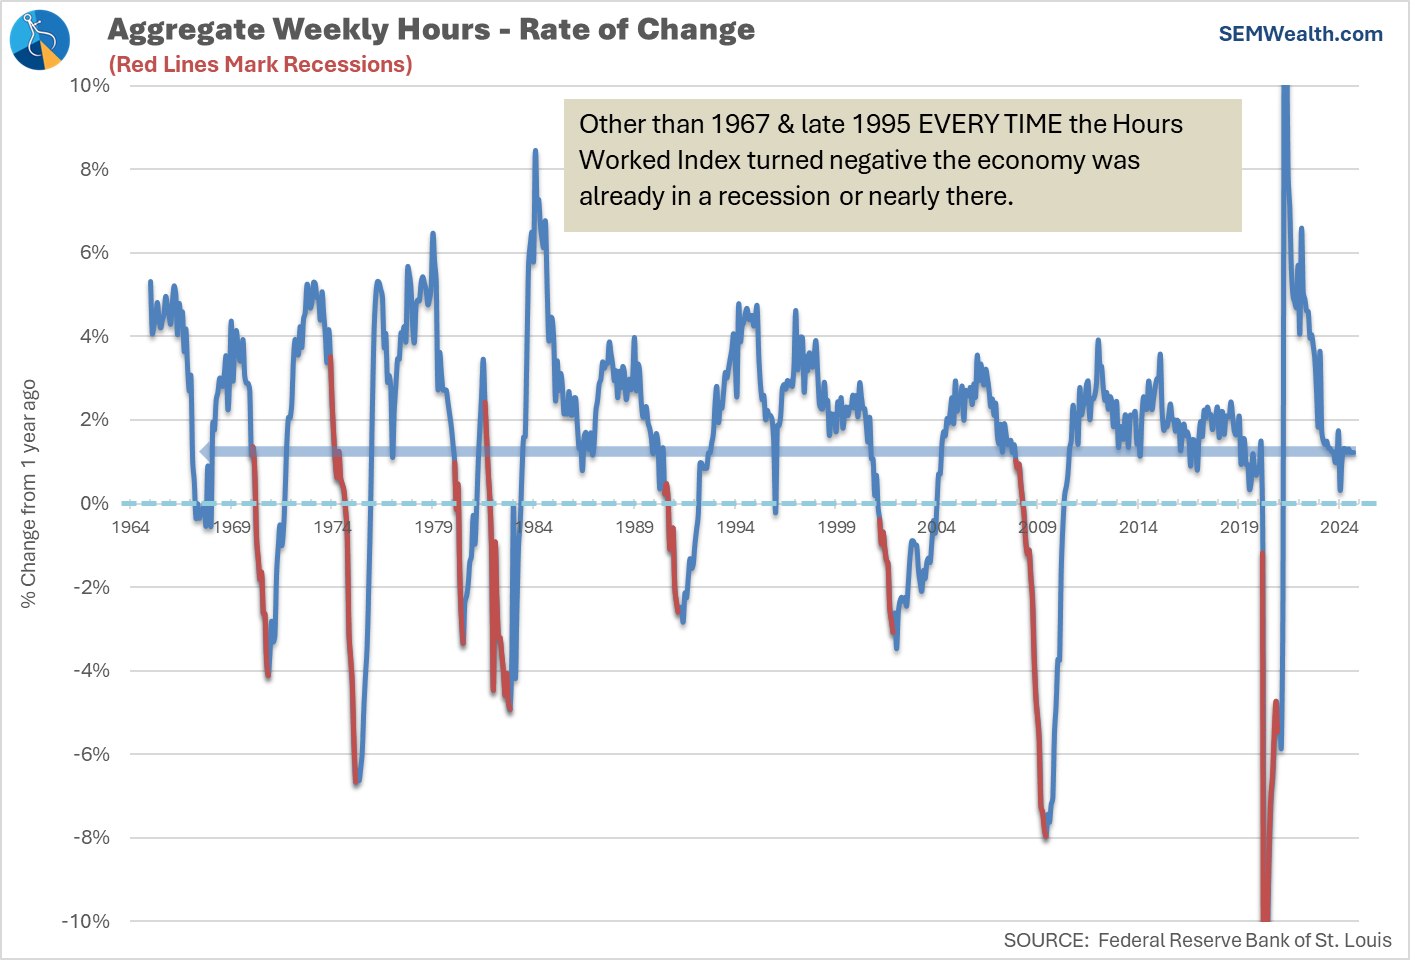
In addition the Hours Worked index continues to hold steady. A drop in this index along with a spike in unemployment claims is usually a clear sign we are heading towards a recession. We're clearly not there yet.
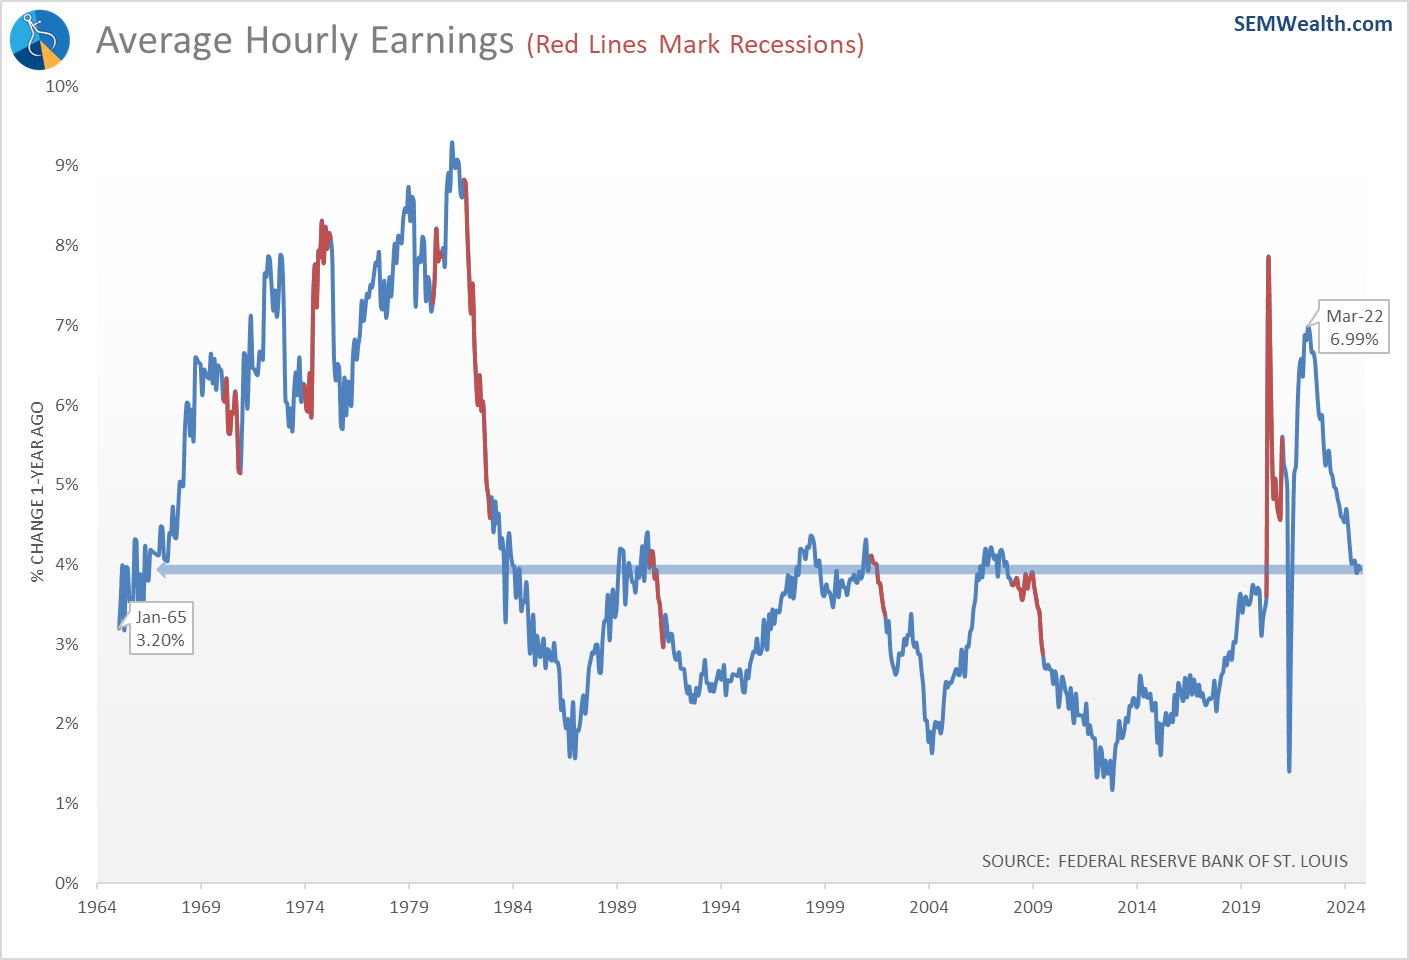
Average Earnings are also still growing at a nice, healthy pace just under 4%. As shown in the chart, that is still the highest level we've experienced since before the housing bubble burst.
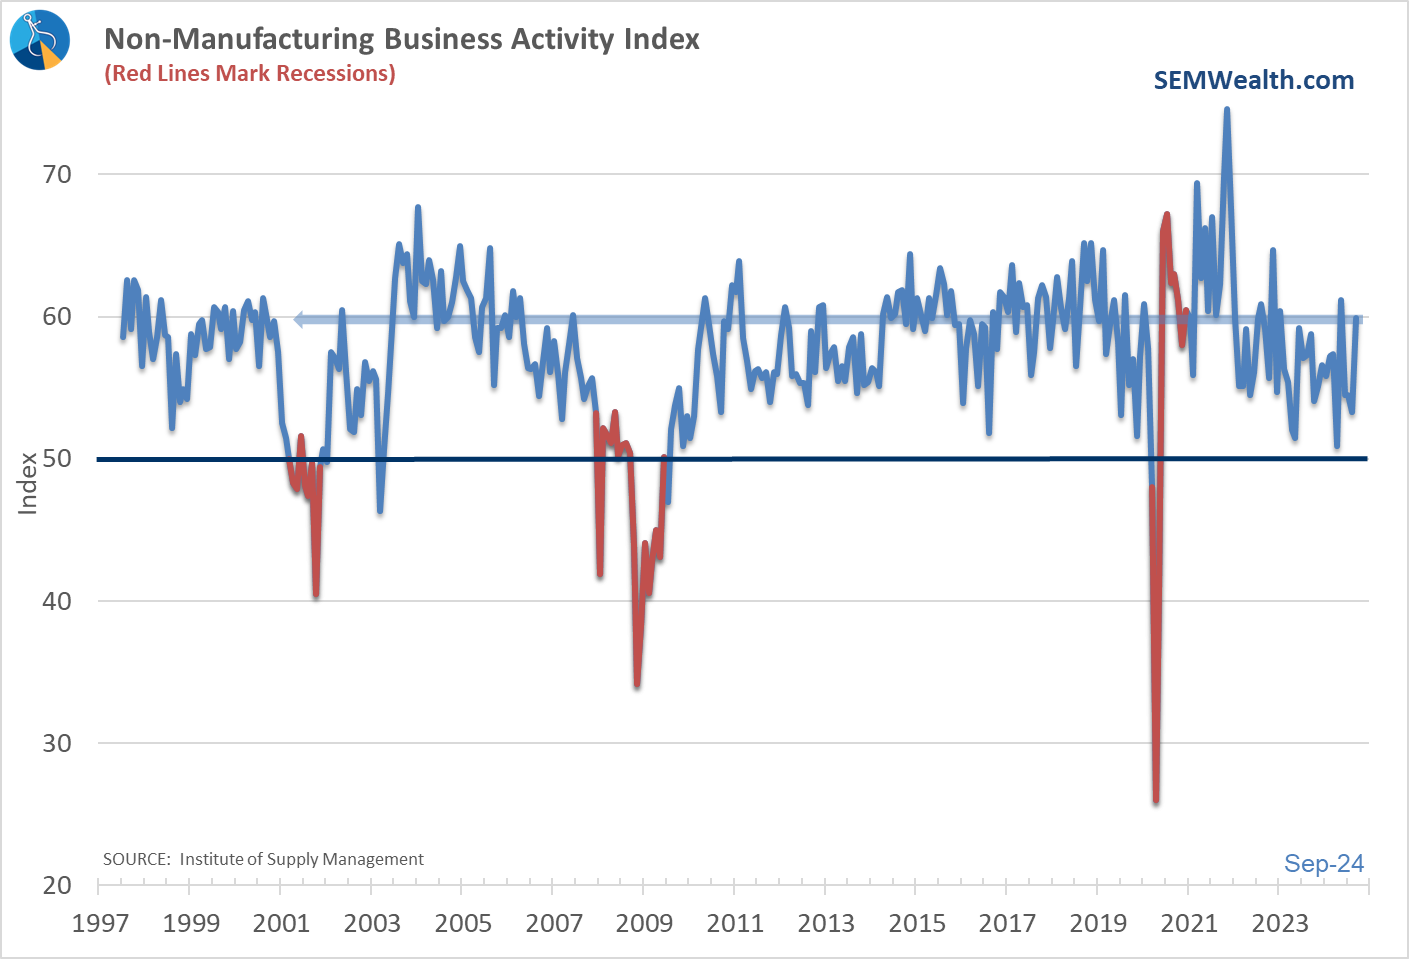
Another key piece of the economy – service businesses rebounded nicely in September. Earlier this summer it appeared service businesses were headed towards 'contraction' territory. That is no longer the case.
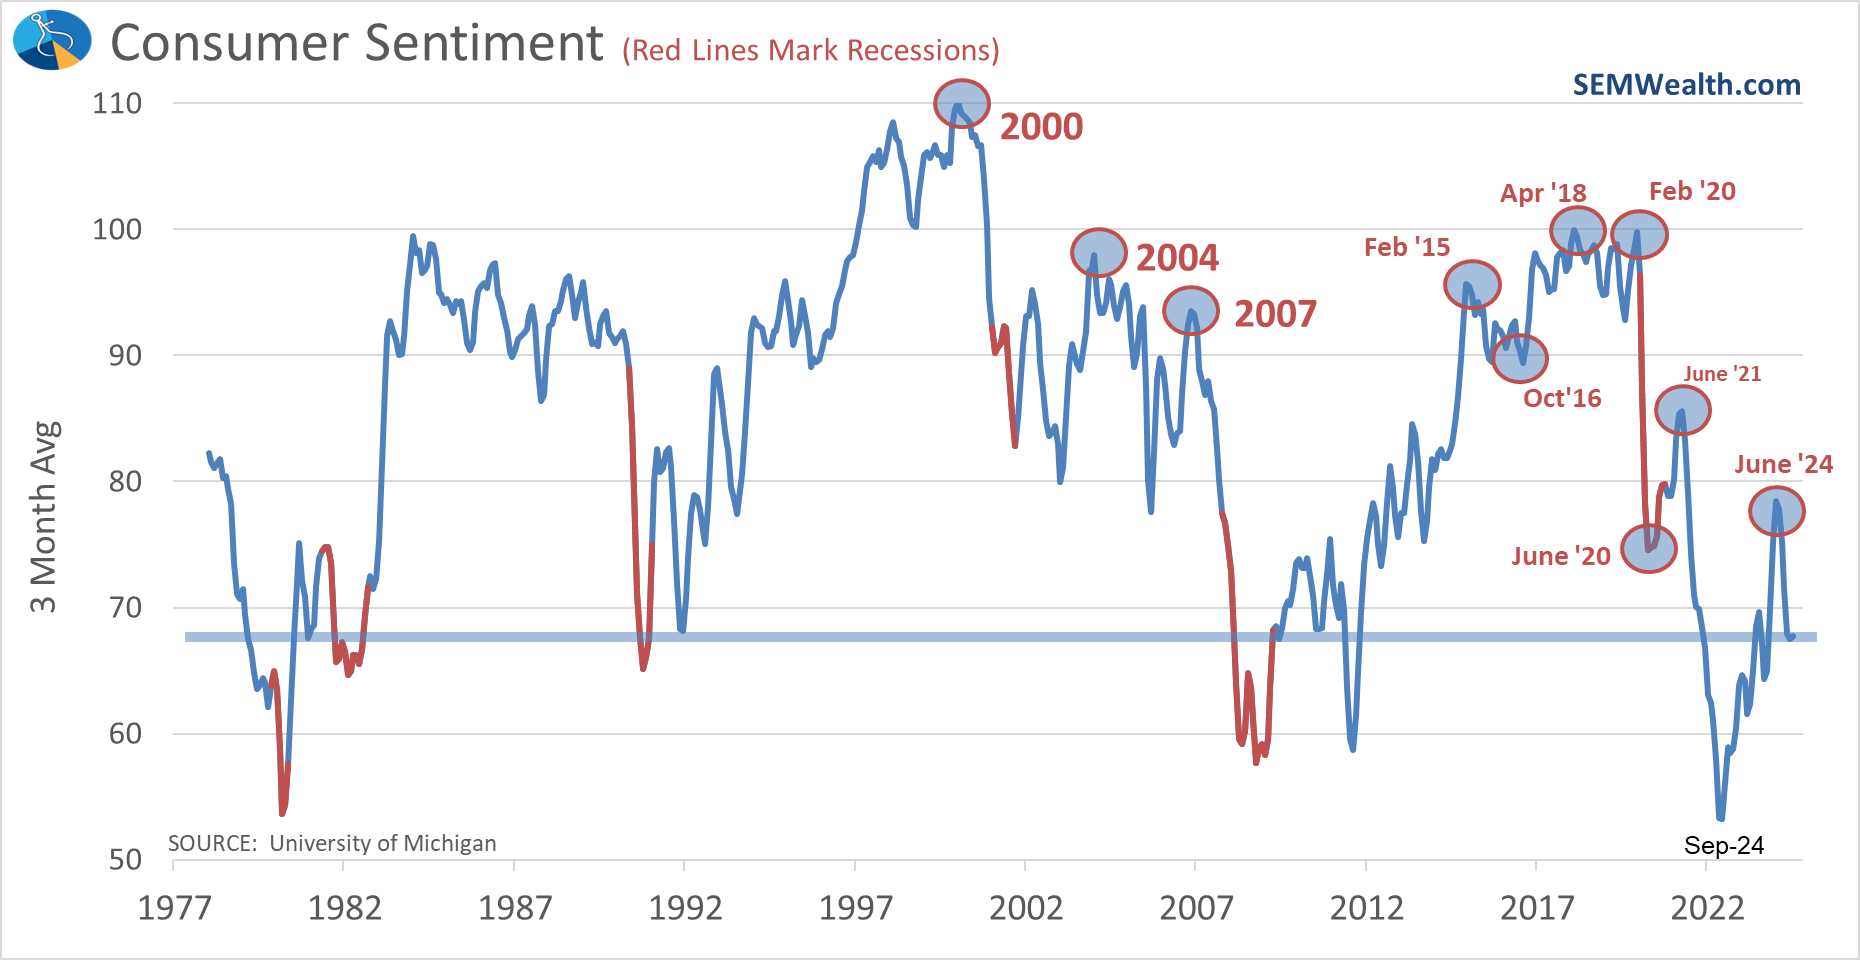
Last week we went through the better than expected consumer spending data along with data that shows possible strains in the balance between income and spending. We also highlighted the continued negative Consumer Sentiment numbers.

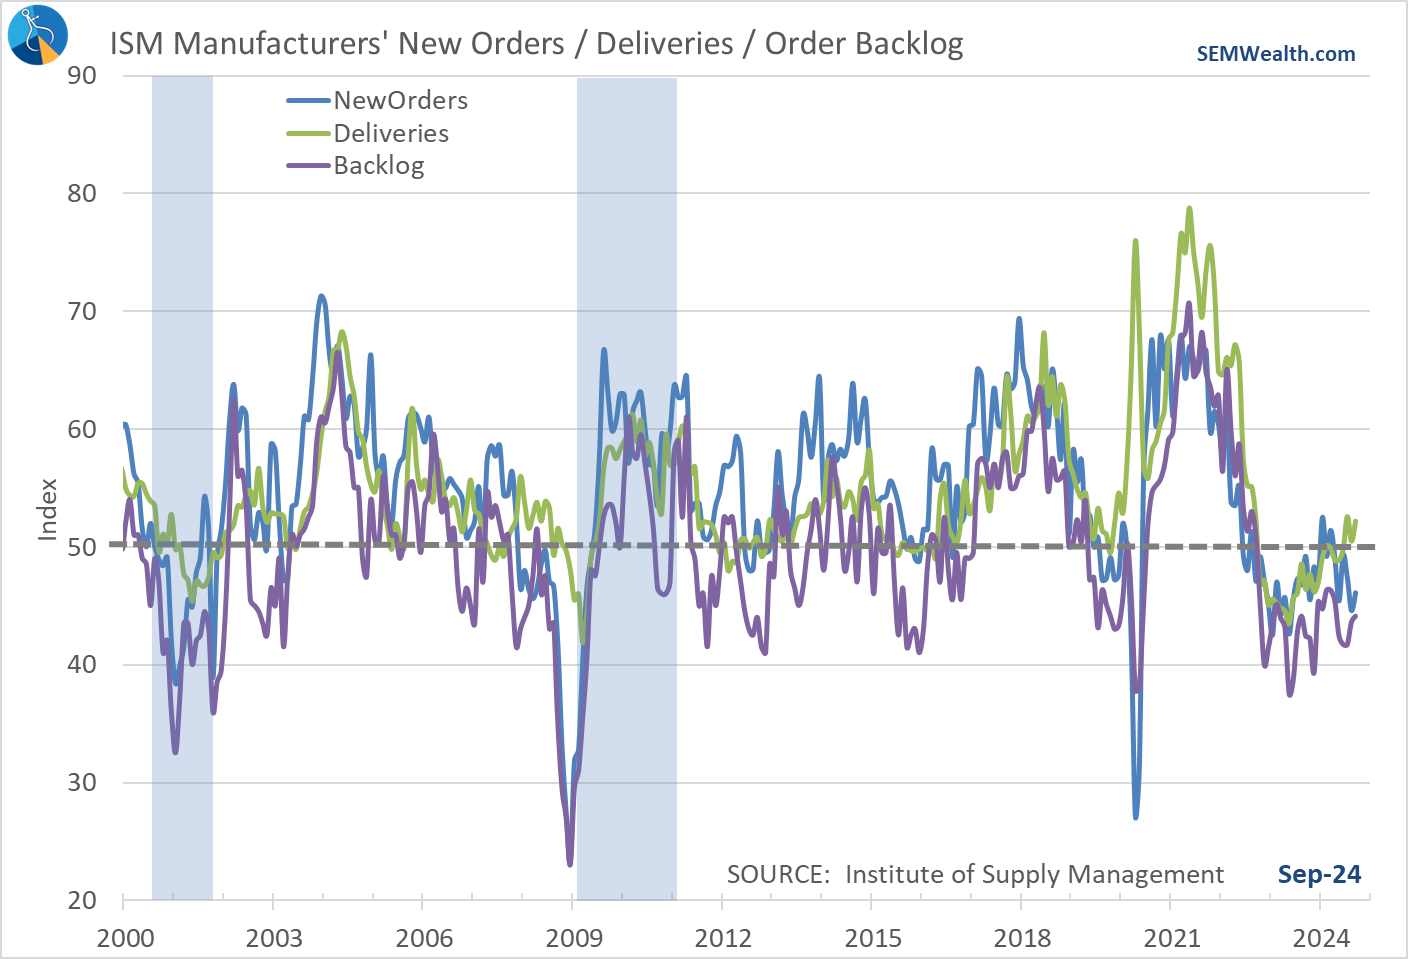
The manufacturing sector also remains weak, although Supplier Deliveries are showing a bit of improvement beneath the surface.
The other negative indicator in our model remains Building Permits.
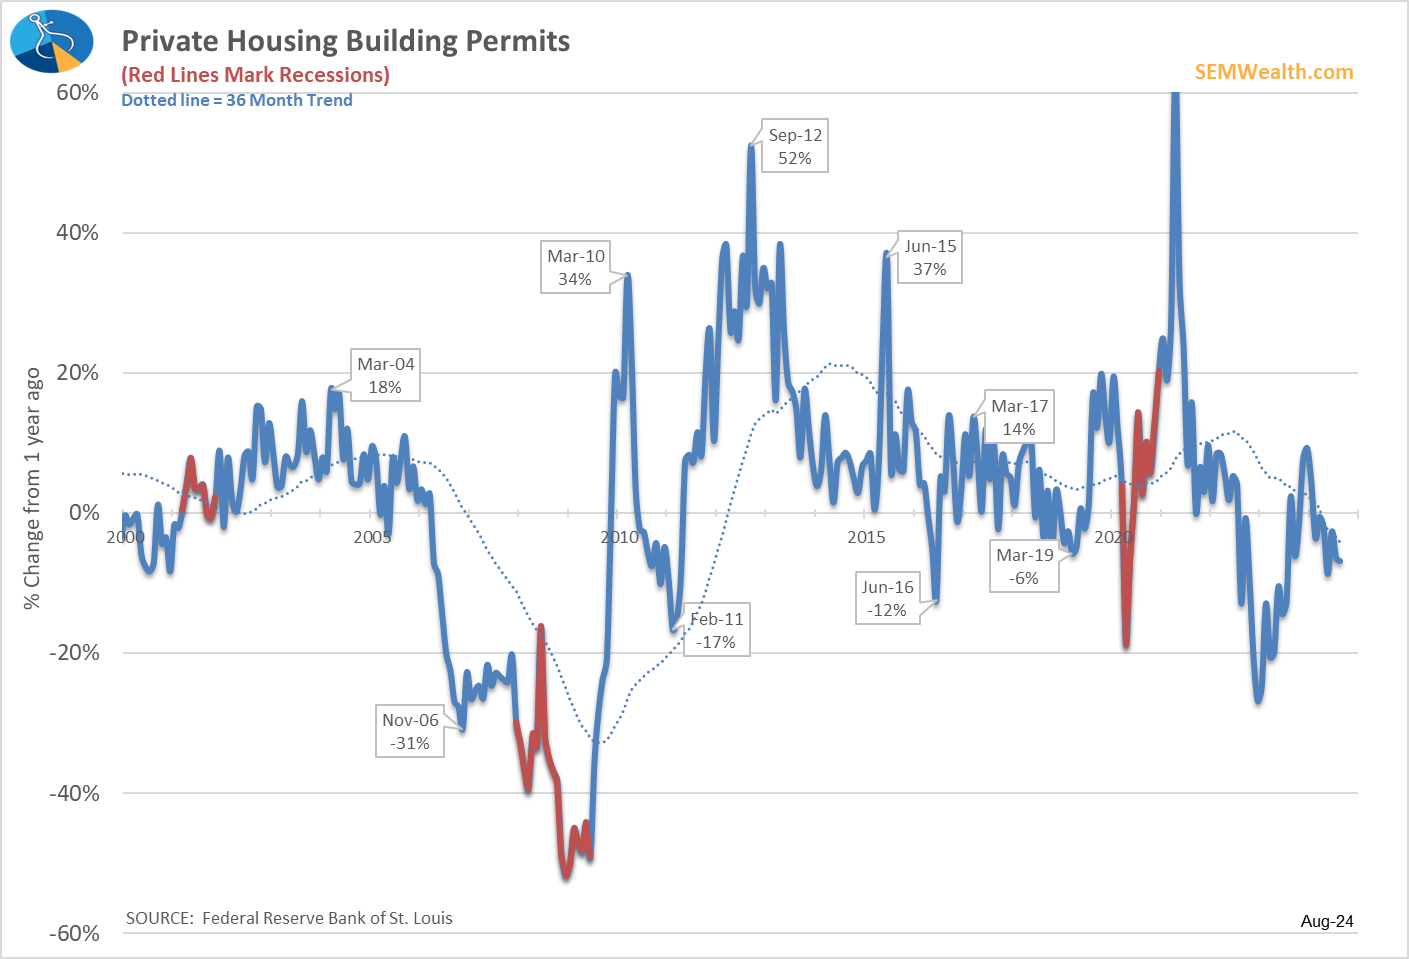
There was some hope that the Fed's rate cuts would spur housing, but that is not always the case. We discussed this in our quarterly newsletter posted last week:

The only 'positive' indicator is the stock market, which in the whole scheme of things is ultimately the only thing that matters.
For more on the stock market and the current interest rate environment, check out the section below.
Market Charts
The subtitle of this section for most of 2024 could be "higher highs lead to higher highs......until something substantial comes along to change the trend." That remains the case for the stock market.
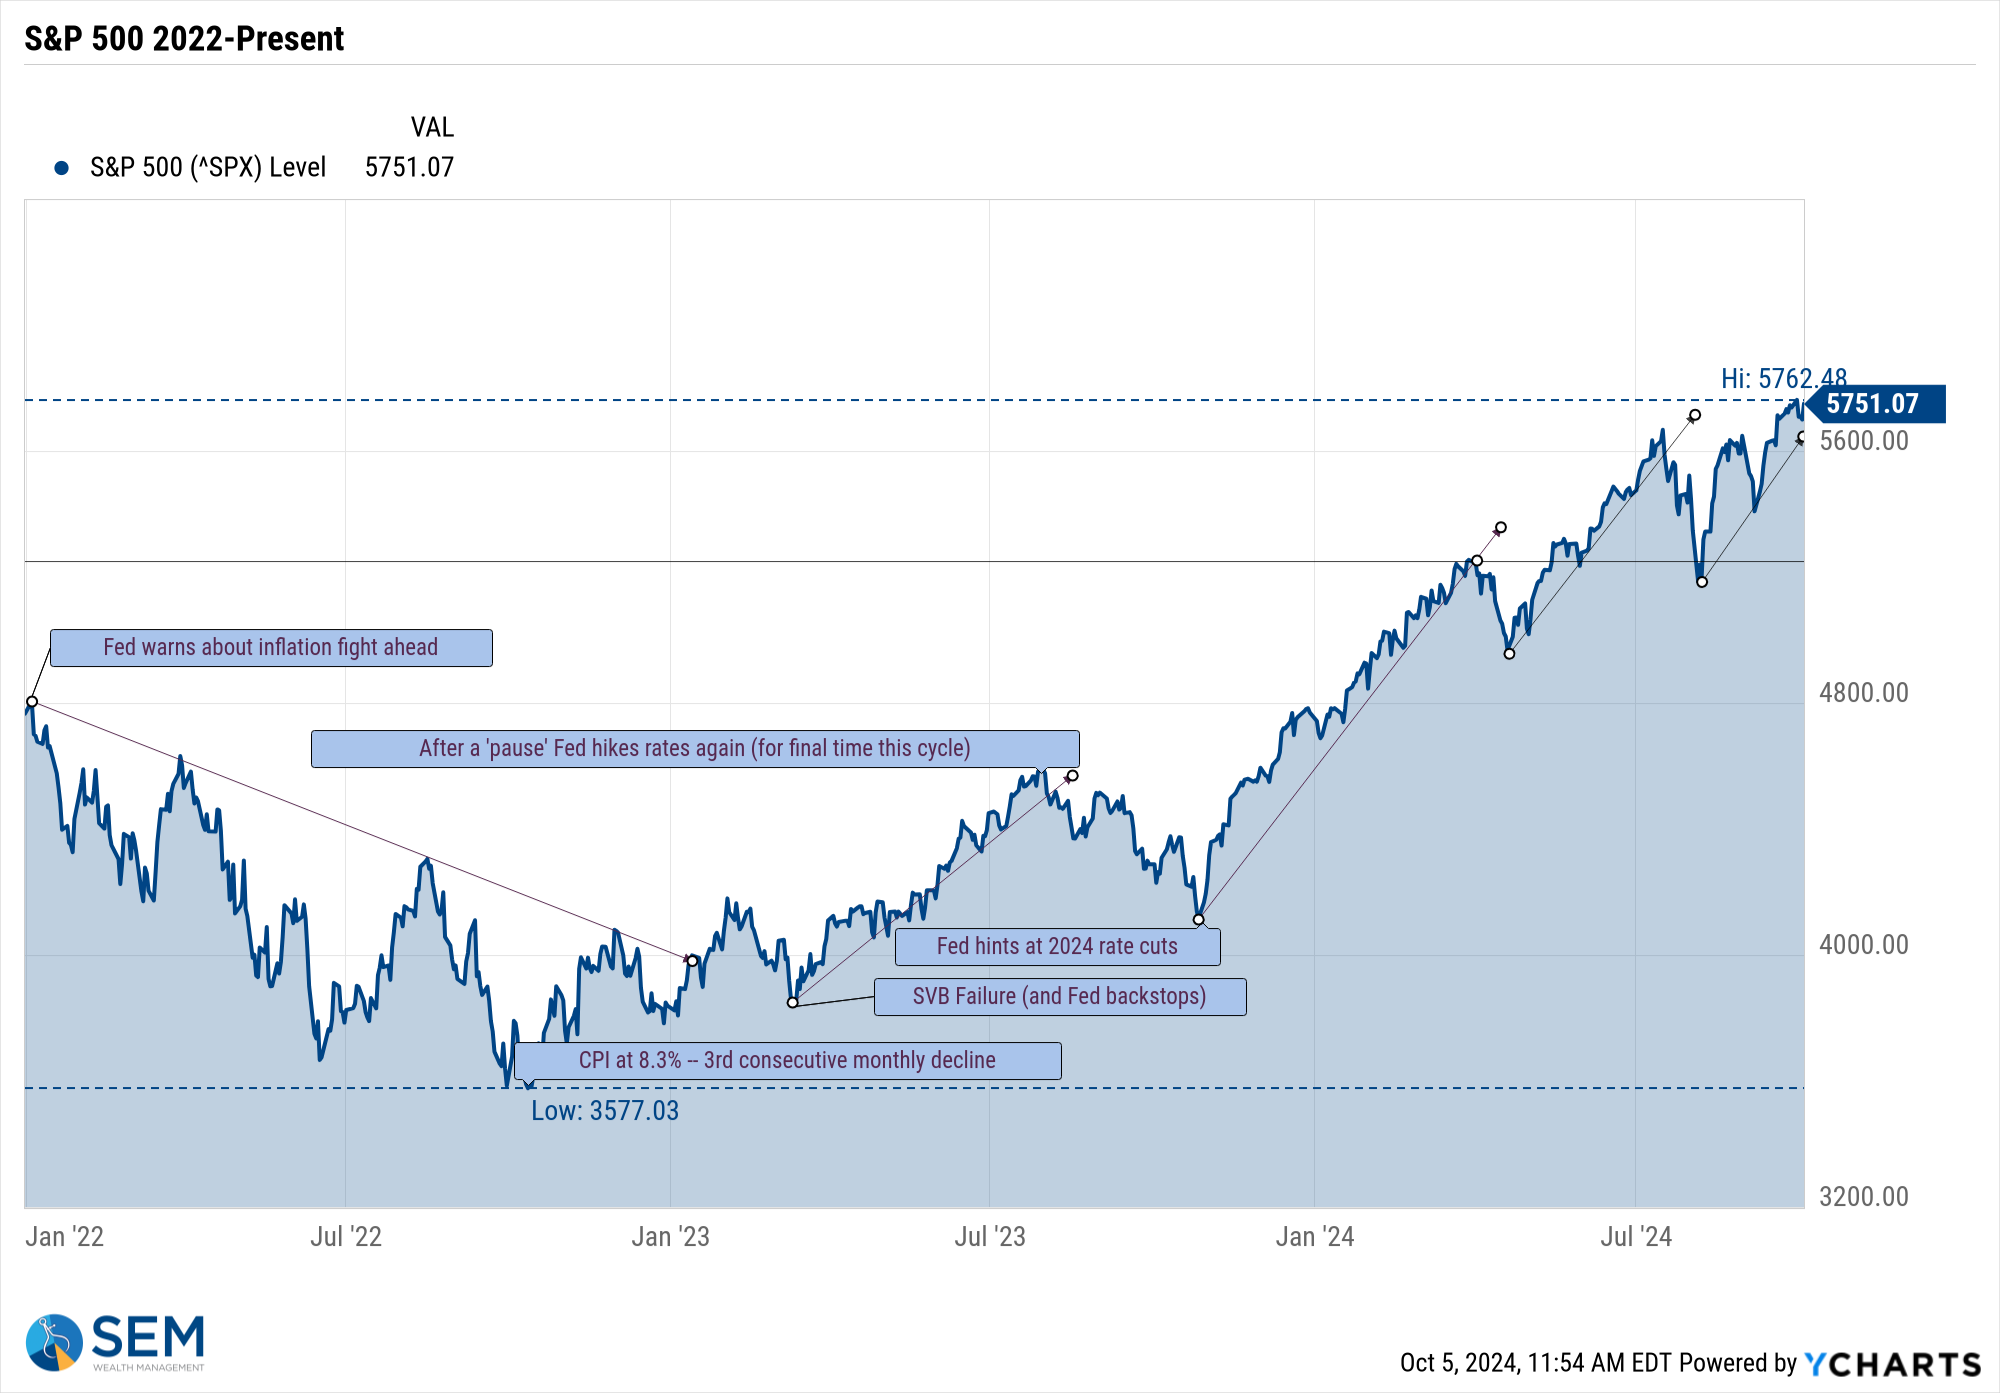
For the past 16 years, "buying the dip" has proven to be a quite successful strategy. Other than the brief bear markets in 2020 and 2022, investors have had little reason to be worried.
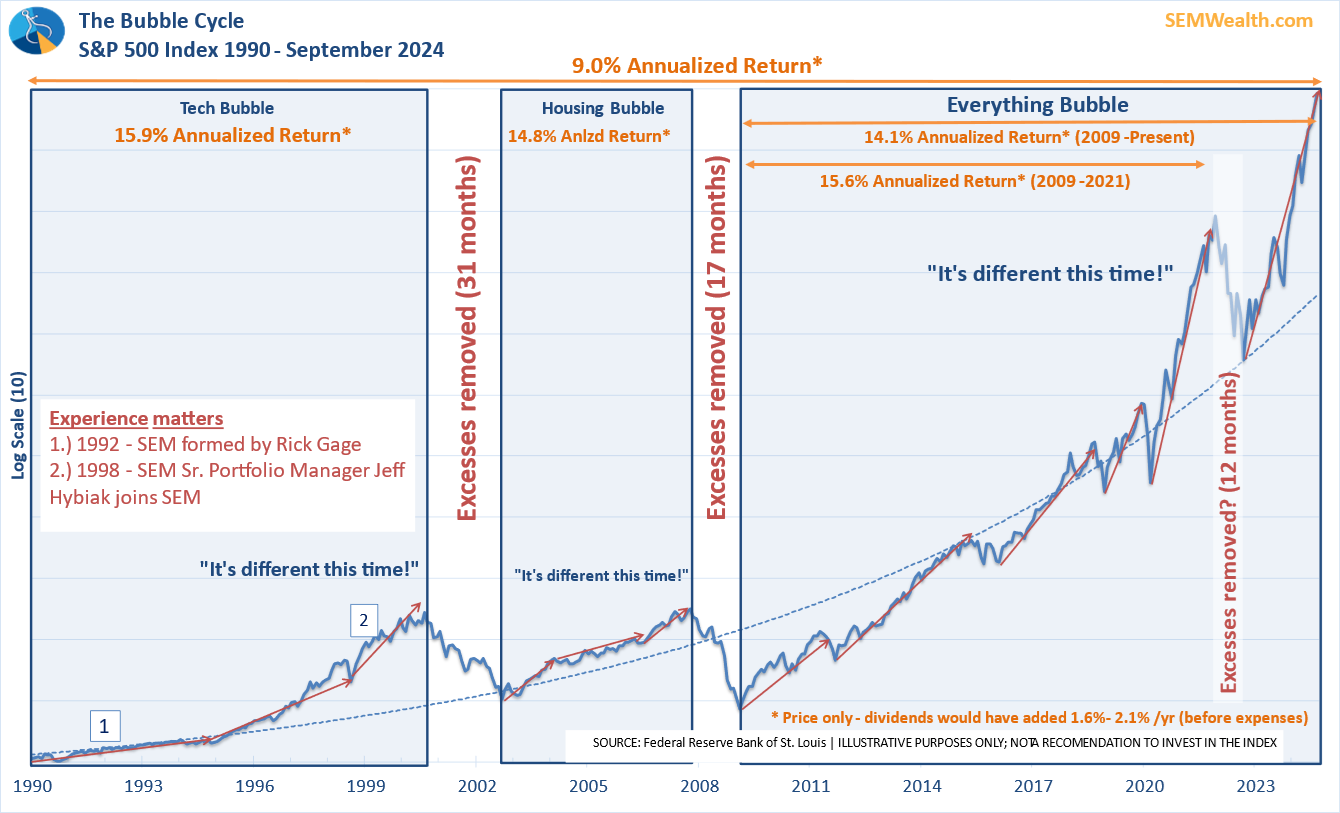
As we said during the bear markets of 2020 & 2022, the 'normal' 20% drop only becomes a problem if the economy also enters a recession (another reason to watch SEM's economic model). During expansionary bull markets, the appetite for risk continues to increase. This allows companies who probably should not be receiving funding to receive relatively cheap funds. The Fed has helped that along in both 2008-09 and especially during the pandemic. The problem is over the long-term stocks cannot mathematically grow faster than the underlying economy. The excesses created during the expansion are quickly removed when the economy cannot generate the types of growth rates investors are expecting.
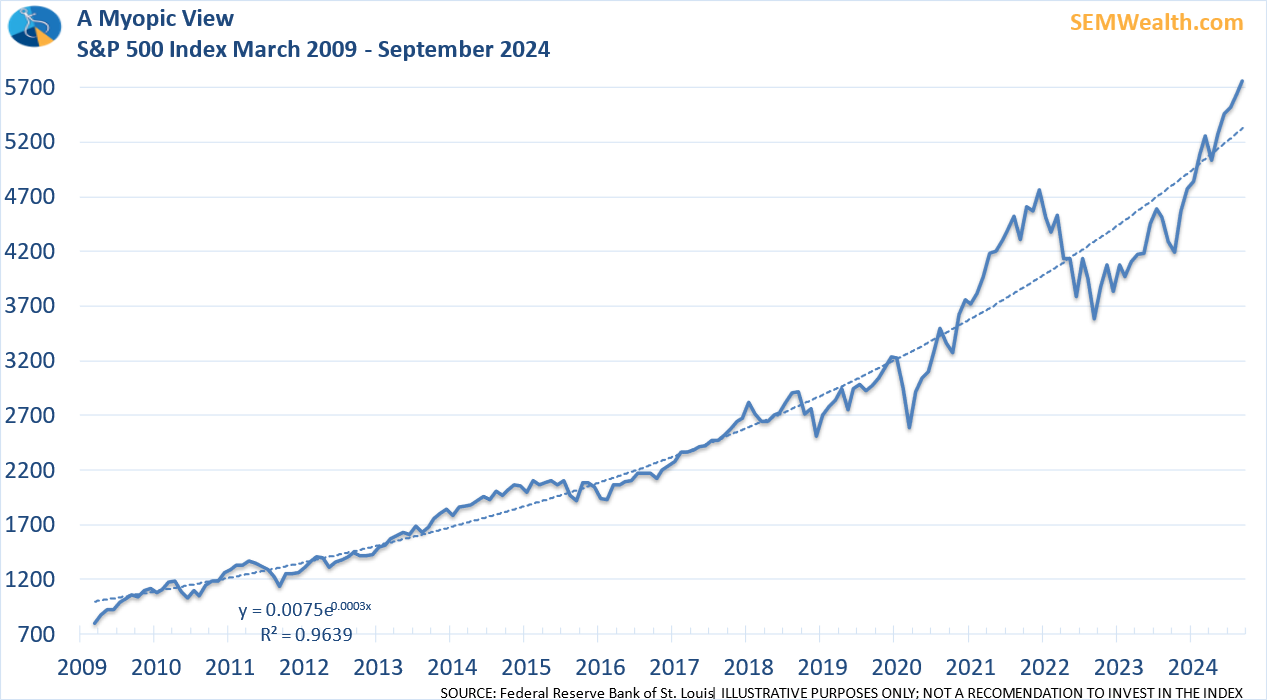
For those who believe "it's different this time" this chart serves as a reminder of what happens when excesses are removed and the stock market reverts back to its long-term average return.
Again, we do not need to be overly concerned until our economic model turns 'bearish', but we should be careful jumping into riskier assets only because we want higher returns, especially given the reaction to the rate cuts so far by the bond market.
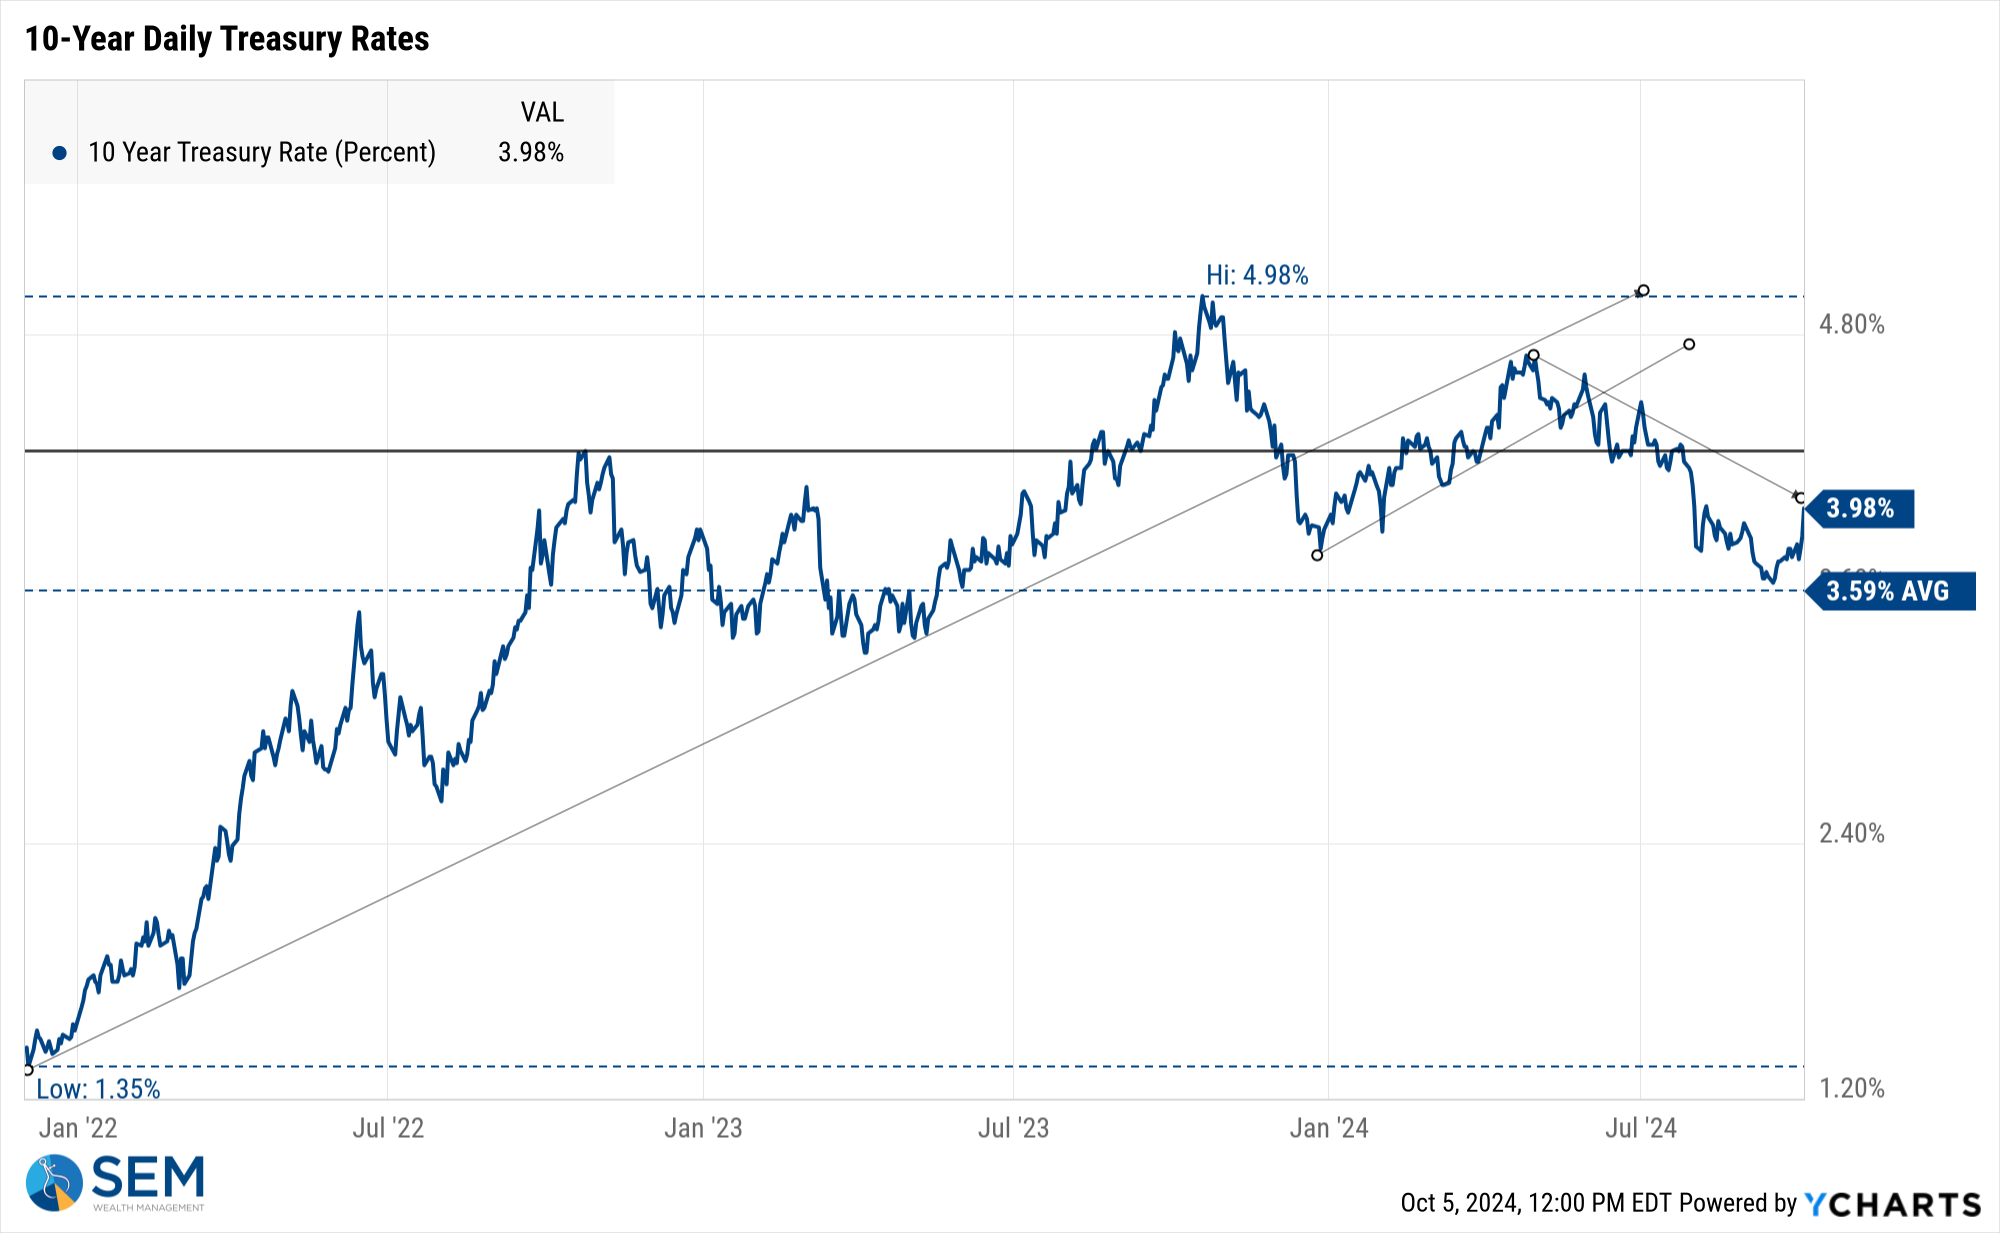
The overall trend in long-term rates is what really matters. The Fed can control short-term rates, but the free market sets the long-term rate. Rates are still 1% below the peak at the end of 2023, but they have moved up nearly 1/2% since the Fed cut short-term rates. The trend is still down, but this is worth watching.
SEM Model Positioning
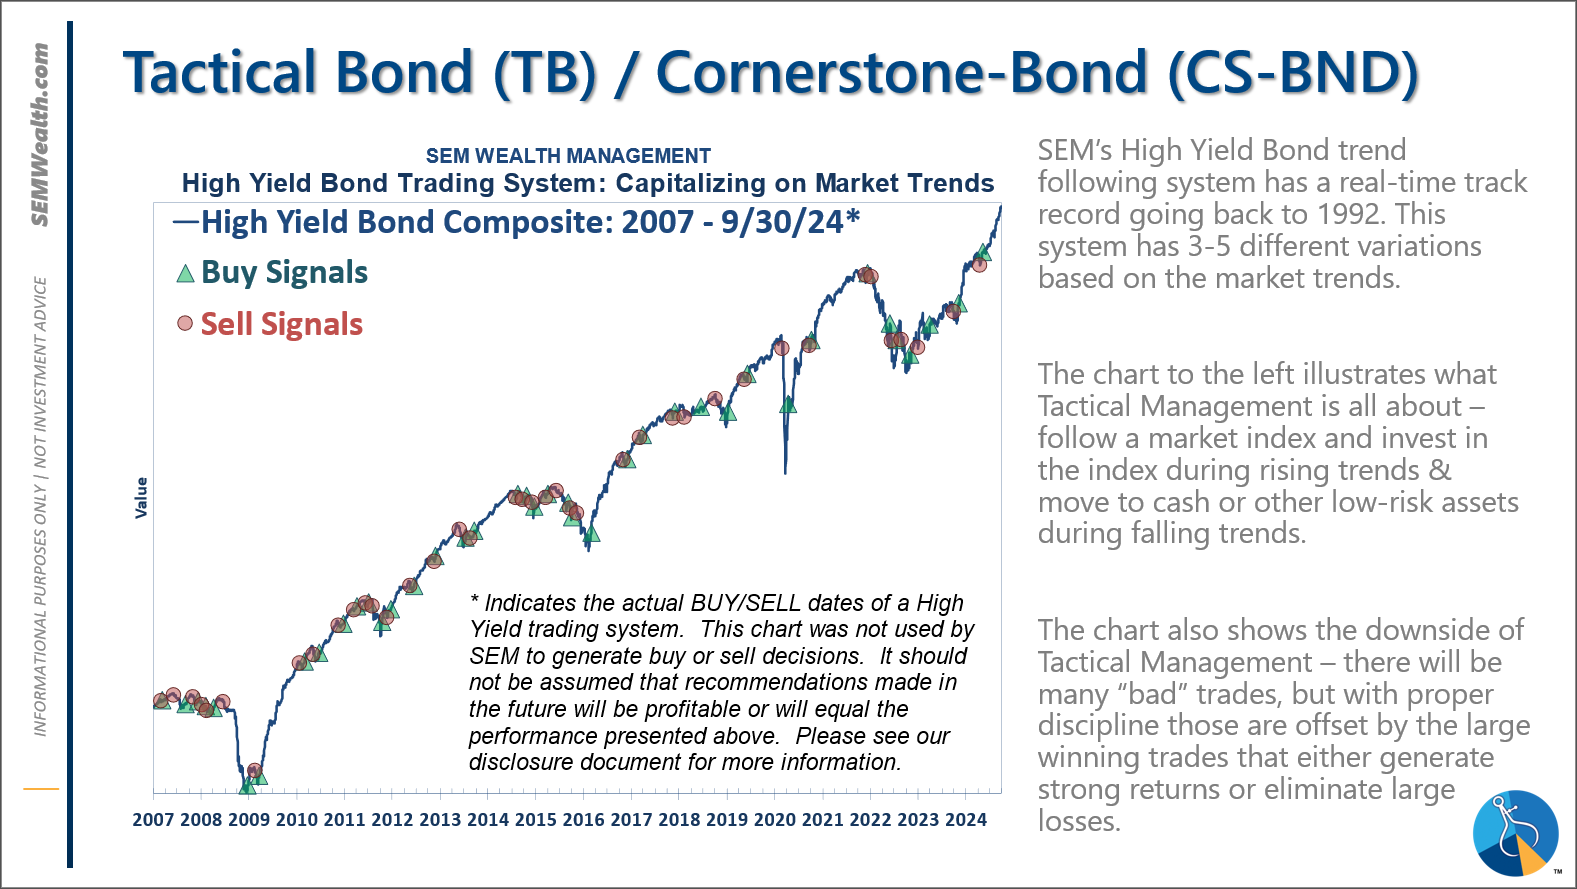
-Tactical High Yield had a partial buy signal on 5/6/24, reversing some of the sells on 4/16 & 17/2024 - the other portion of the signal remains on a sell as high yields continue to oscillate.
-Dynamic Models are 'neutral' as of 6/7/24, reversing the half 'bearish' signal from 5/3/2024. 7/8/24 - interest rate model flipped from partially bearish to partially bullish (lower long-term rates).
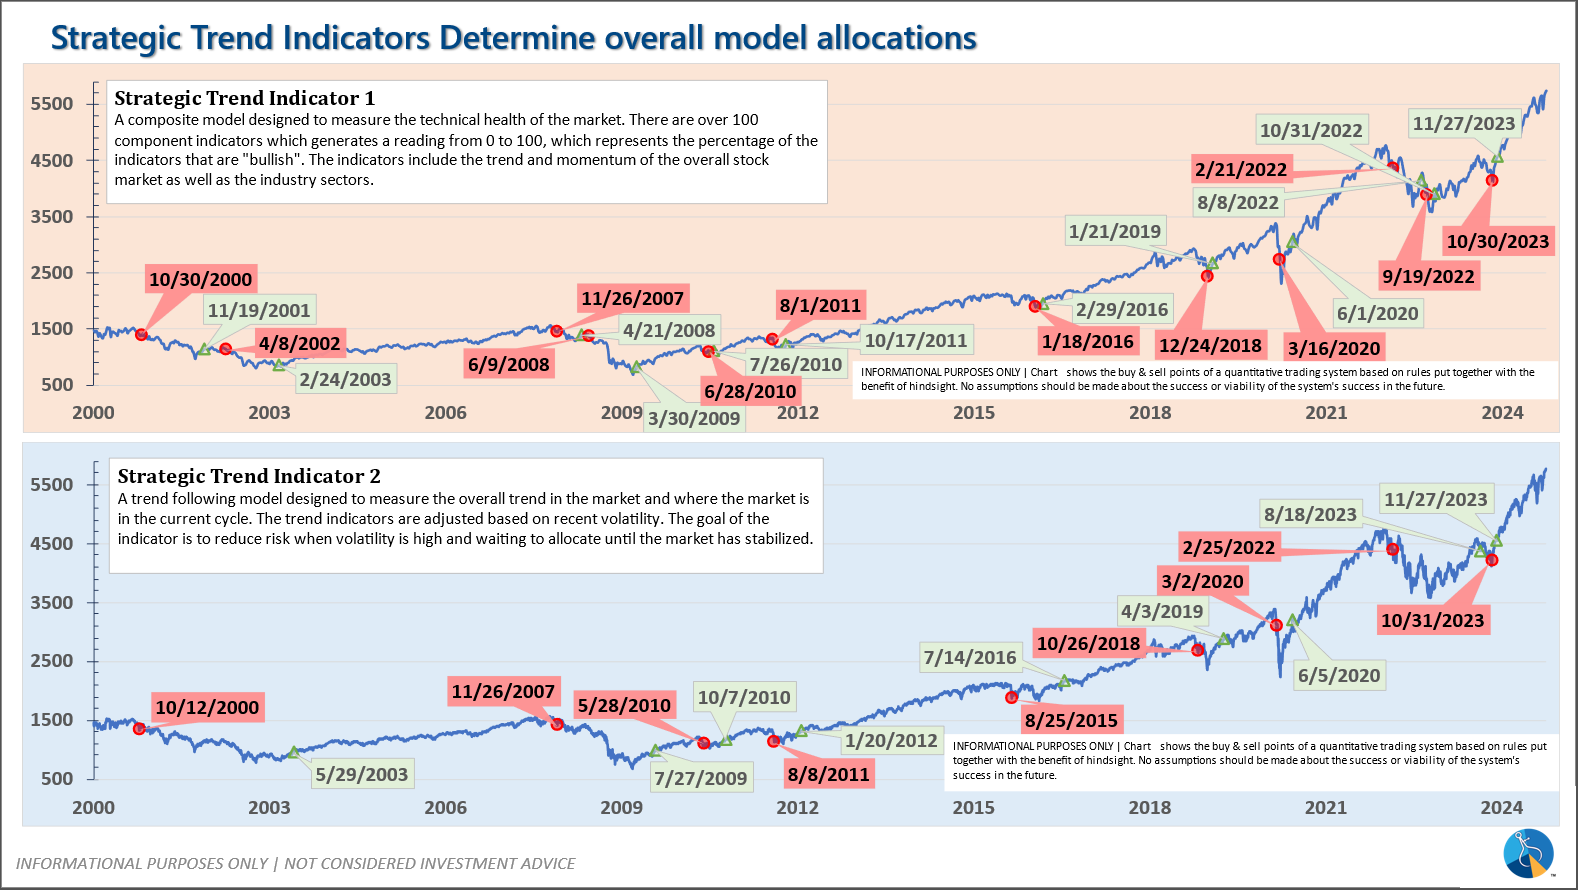
-Strategic Trend Models went on a buy 11/27/2023; 7/8/24 – small and mid-cap positions eliminated with latest Core Rotation System update – money shifted to Large Cap Value (Dividend Growth) & International Funds
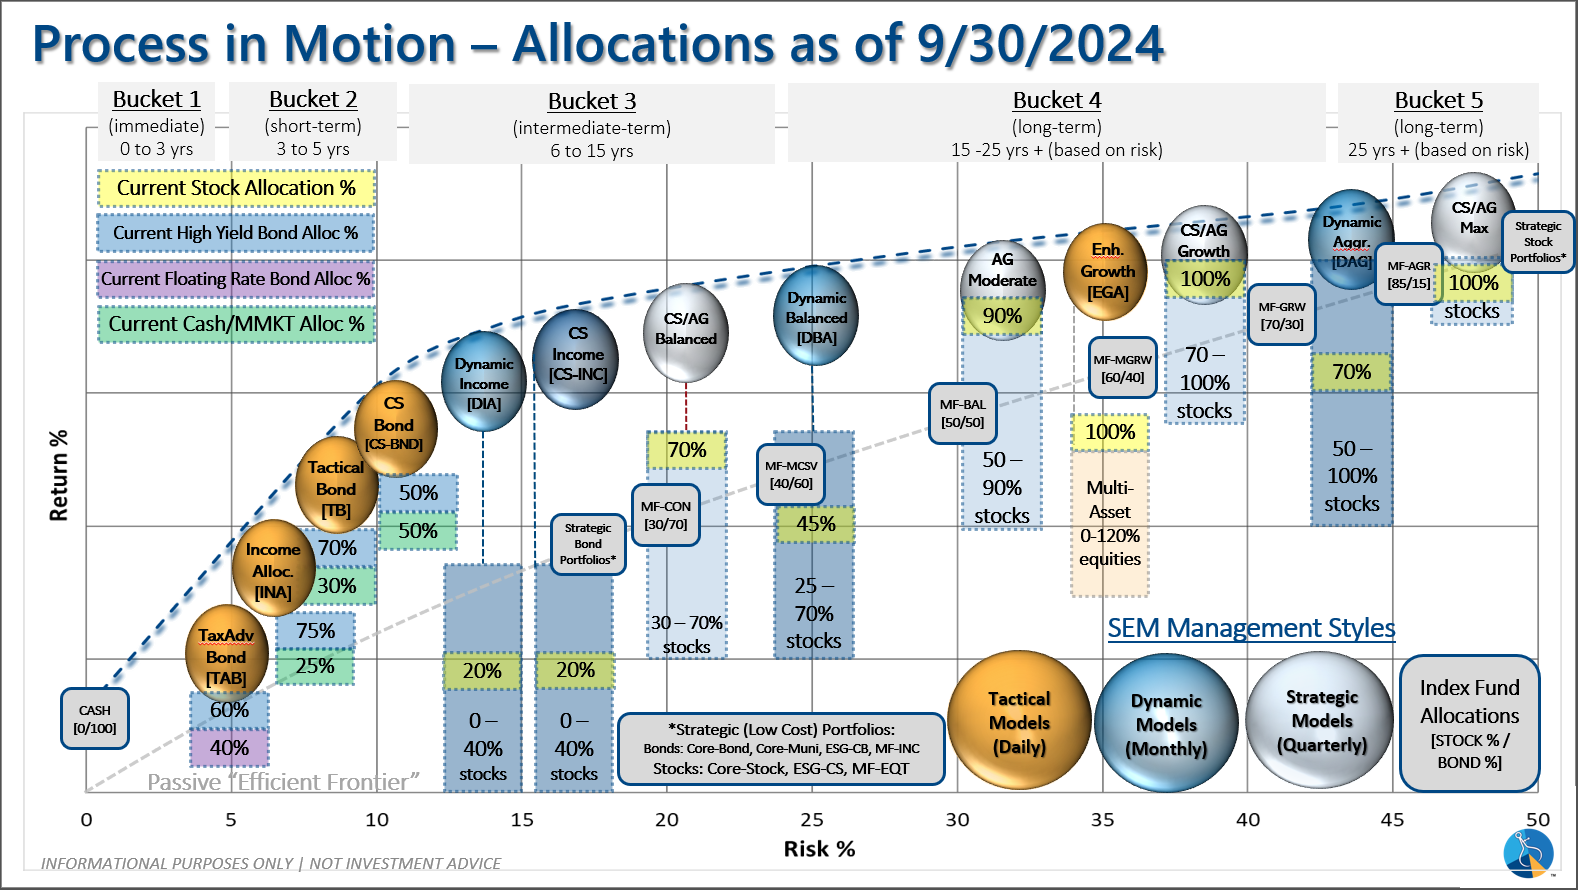
SEM deploys 3 distinct approaches – Tactical, Dynamic, and Strategic. These systems have been described as 'daily, monthly, quarterly' given how often they may make adjustments. Here is where they each stand.
Tactical (daily): On 5/6/24 about half of the signals in our high yield models switched to a buy. The other half remains in money market funds. The money market funds we are currently invested in are yielding between 4.3-4.8% annually.
Dynamic (monthly): The economic model was 'neutral' since February. In early May the model moved slightly negative, but reversed back to 'neutral' in June. This means 'benchmark' positions – 20% dividend stocks in Dynamic Income and 20% small cap stocks in Dynamic Aggressive Growth. The interest rate model is slightly 'bullish'.
Strategic (quarterly)*: BOTH Trend Systems reversed back to a buy on 11/27/2023
The core rotation is adjusted quarterly. On August 17 it rotated out of mid-cap growth and into small cap value. It also sold some large cap value to buy some large cap blend and growth. The large cap purchases were in actively managed funds with more diversification than the S&P 500 (banking on the market broadening out beyond the top 5-10 stocks.) On January 8 it rotated completely out of small cap value and mid-cap growth to purchase another broad (more diversified) large cap blend fund along with a Dividend Growth fund.
The * in quarterly is for the trend models. These models are watched daily but they trade infrequently based on readings of where each believe we are in the cycle. The trend systems can be susceptible to "whipsaws" as we saw with the recent sell and buy signals at the end of October and November. The goal of the systems is to miss major downturns in the market. Risks are high when the market has been stampeding higher as it has for most of 2023. This means sometimes selling too soon. As we saw with the recent trade, the systems can quickly reverse if they are wrong.
Overall, this is how our various models stack up based on the last allocation change:
Questions or comments - drop us a note?
Curious if your current investment allocation aligns with your overall objectives and risk tolerance? Take our risk questionnaire


