
There are a lot of adages thrown around the investing world. One of the most common is "buy low, sell high." It makes sense. If you want to get the best return on anything, you want to buy it at the lowest price possible. As humans, it is not so easy to implement.
If we are looking to buy a car, a refrigerator, or a house, we get EXCITED when the price drops. The more prices go up, the less likely we are to purchase those items. Investments seem to be the only thing where the more they go down in value, the less likely we are to purchase them. Conversely, the more they go UP, the more we WANT to buy them.
This of course eventually comes back to haunt those who allow their assessment of the investment markets to be correlated to the direction they are going. The problem is, our human brains believe we are smart enough to get out before the ride is over. Or worse, they believe that "it's different this time," and there is justification for permanently higher valuation levels.
I won't go through all the academics behind owning a stock. At its core, when you buy a stock you become an owner which means you have a share of all the future profits of the company. The return you get on that share will depend both on how much the profits of the company will grow over the long-term AND how much you paid for your share of the profits. If either the growth rate of profits, or how much others are willing to pay for the share of the profits goes down, the value of the stock will also go down.
The problem is since humans are the ones determining both the expected growth rate of profits AND how much they are worth today, both are susceptible to our own emotions. This means believing the current trends will likely continue for the foreseeable future. The helps stocks go up more than they probably should, but it inevitably leads to stocks going down than they probably should when growth rates slow.
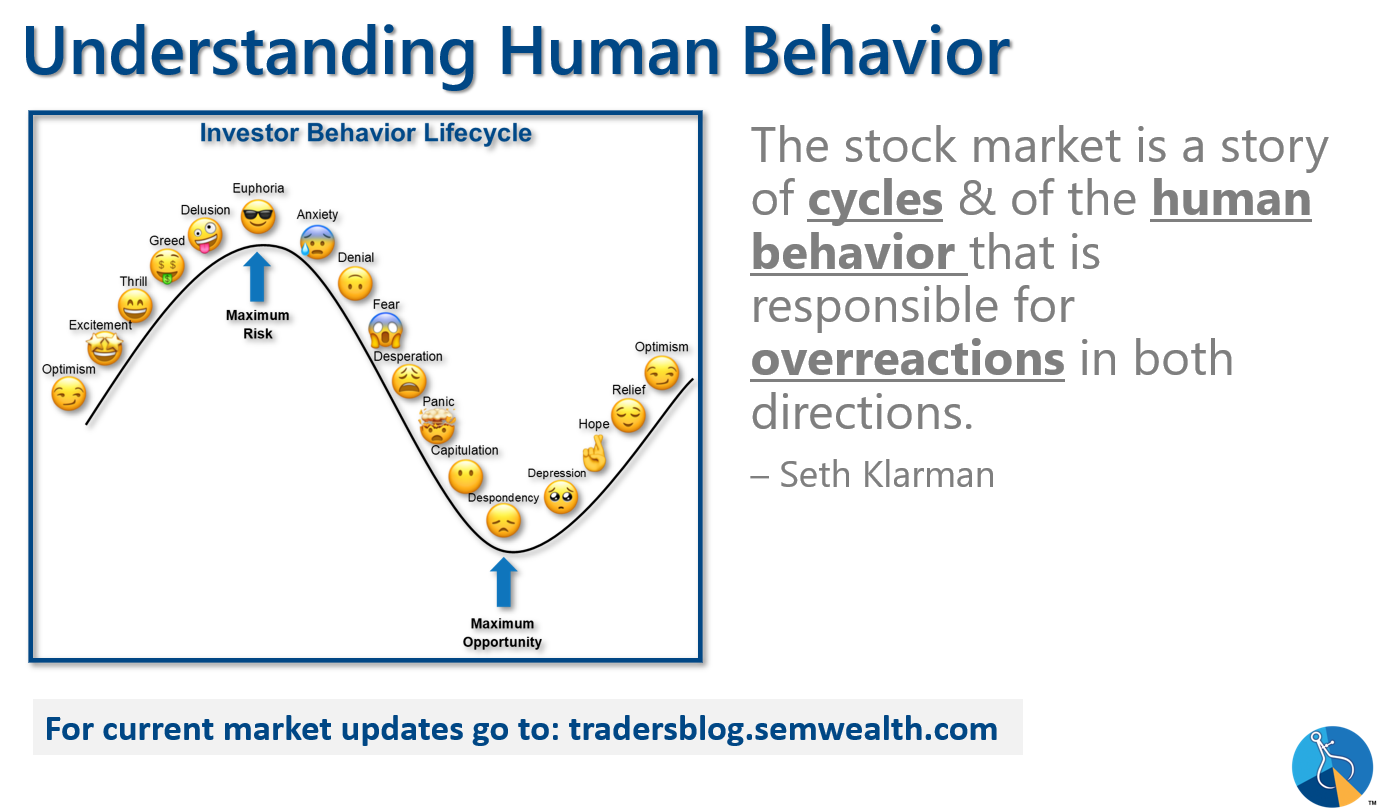
We show this slide frequently when discussing the cycle of the stock market (and our own behavior). Everybody goes through this cycle. The difference is we have all different magnitudes. The stock market overall goes through the same cycle.
This is why at SEM we follow a data driven approach. Valuation measurements are not good 'timing' mechanisms. An overvalued market can become even more overvalued. They can serve as a WARNING. There are a lot of different indicators of valuations. The most common is the Price/Earnings (P/E) ratio, although our studies show it is the least reliable predictor of future returns.
Despite that, most people investors have heard of the P/E ratio. I like using it as a measure of investor sentiment. The higher the P/E ratio, the more optimistic the market is. We've talked for nearly a year now about the hope placed in the Federal Reserve and their ability to keep the market chugging along without a recession. The P/E currently is showing the market is currently more optimistic than any other rate cutting cycle.
$SPX P/E Ratios at the beginning of Fed easing cycles:
— David Marlin (@Marlin_Capital) October 1, 2024
2024 has the highest P/E at the start of a Fed cutting cycle in 60+ years.$SPY $QQQ $TSLA $NVDA $AAPL $MSFT pic.twitter.com/9CDxbAhxUt
This chart also highlights something we've been warning about for quite some time – the last 3 times the Fed attempted to 'save' the economy they were too late and despite cutting rates the economy still entered a recession.
Stay tuned next week for Part II of "Buy high, sell higher?"
Market Charts
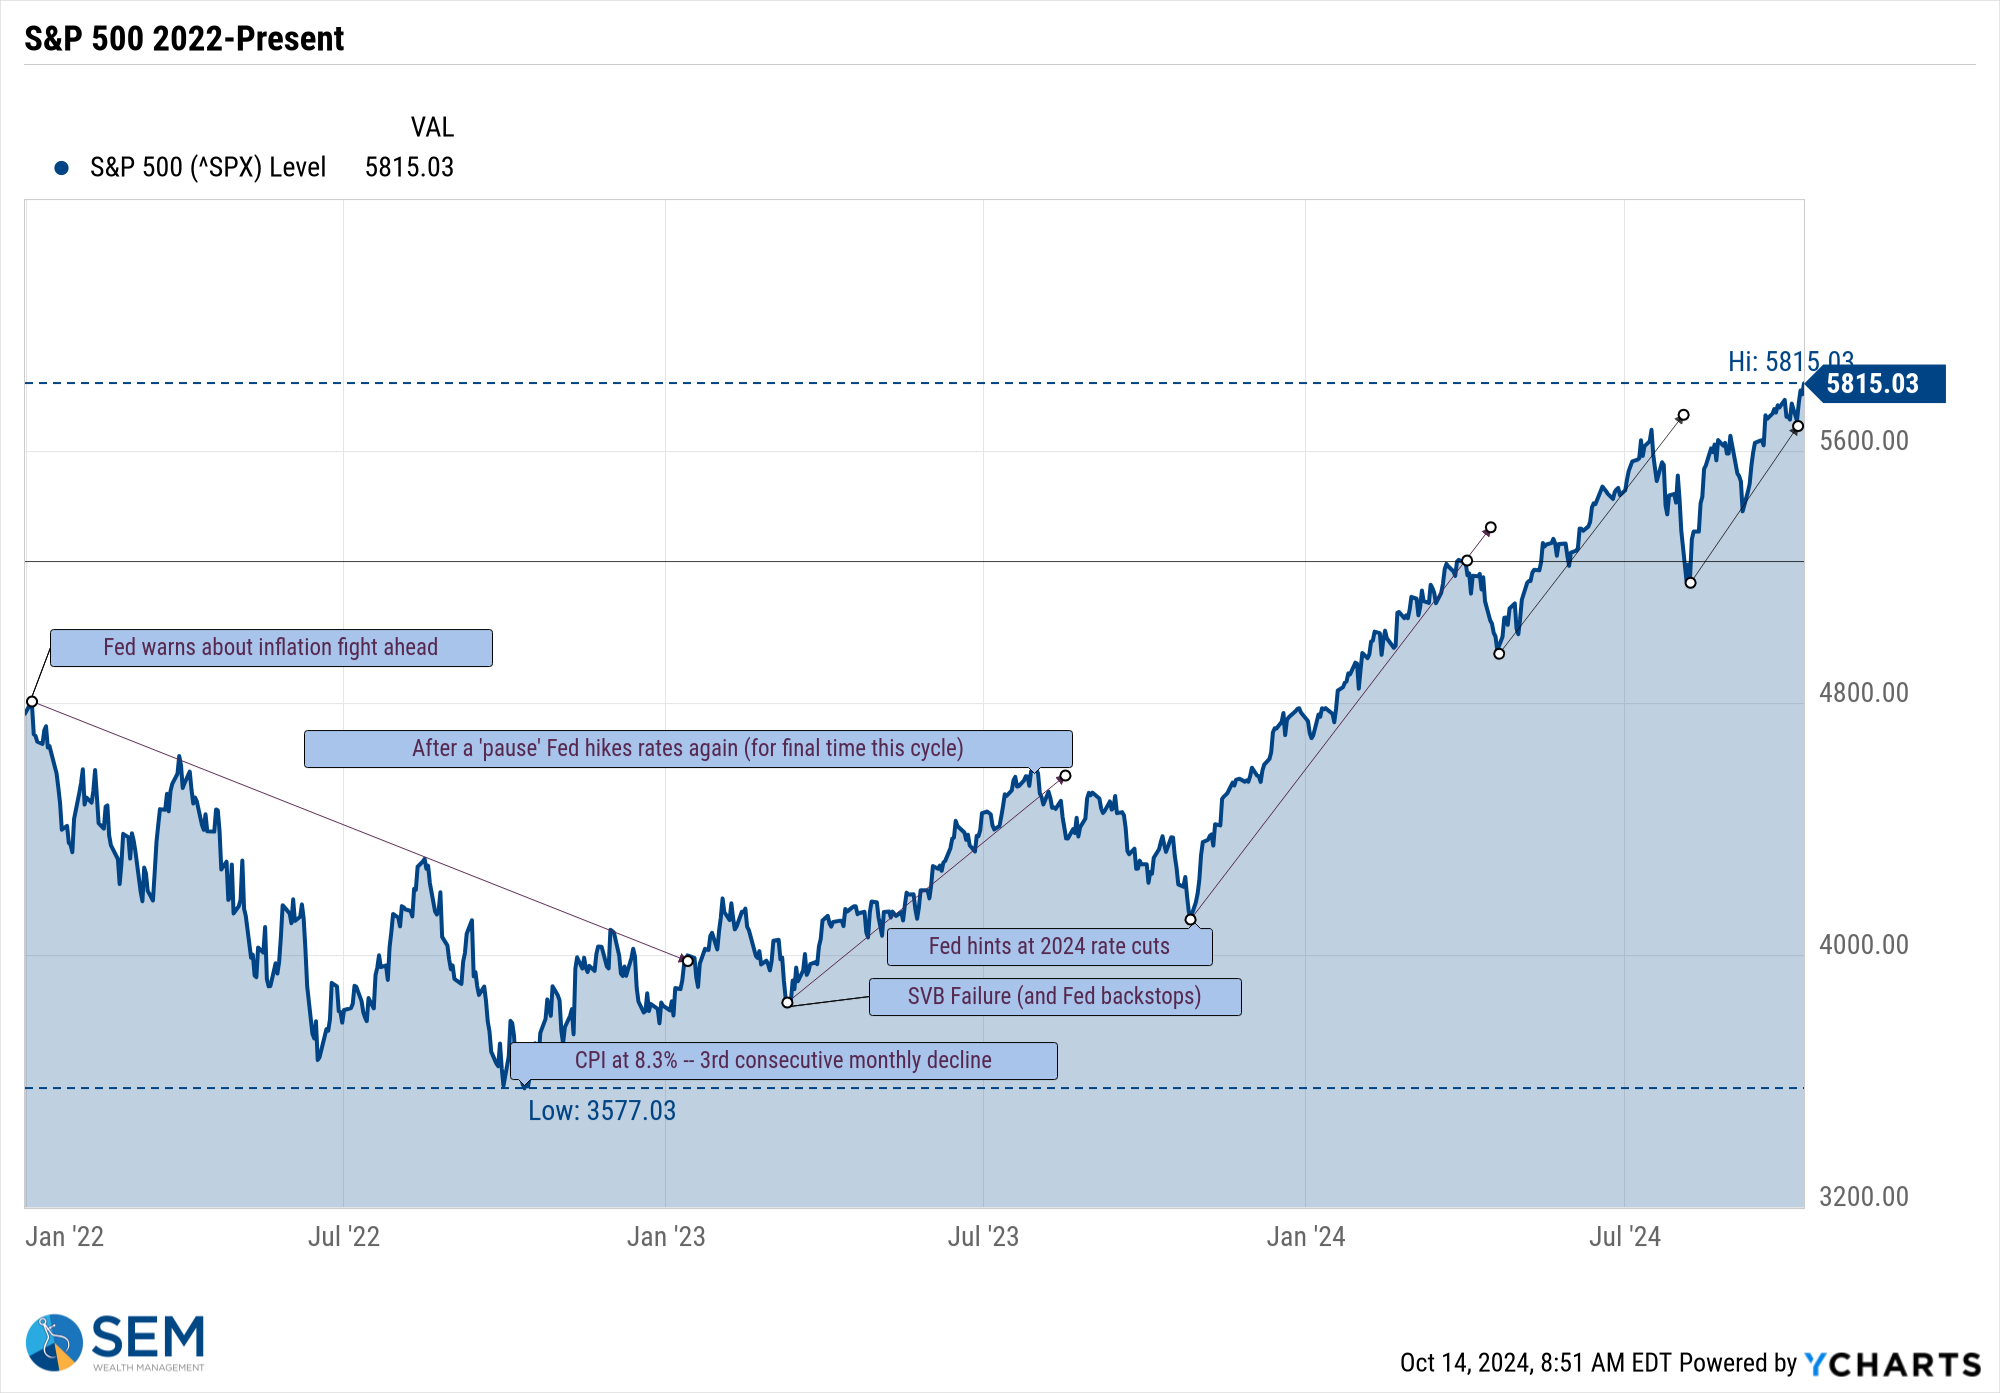
As I've done most of the year, I will start this section with "higher highs tend to lead to higher highs........until something significant comes along to change it."
That remains the case for the S&P 500.
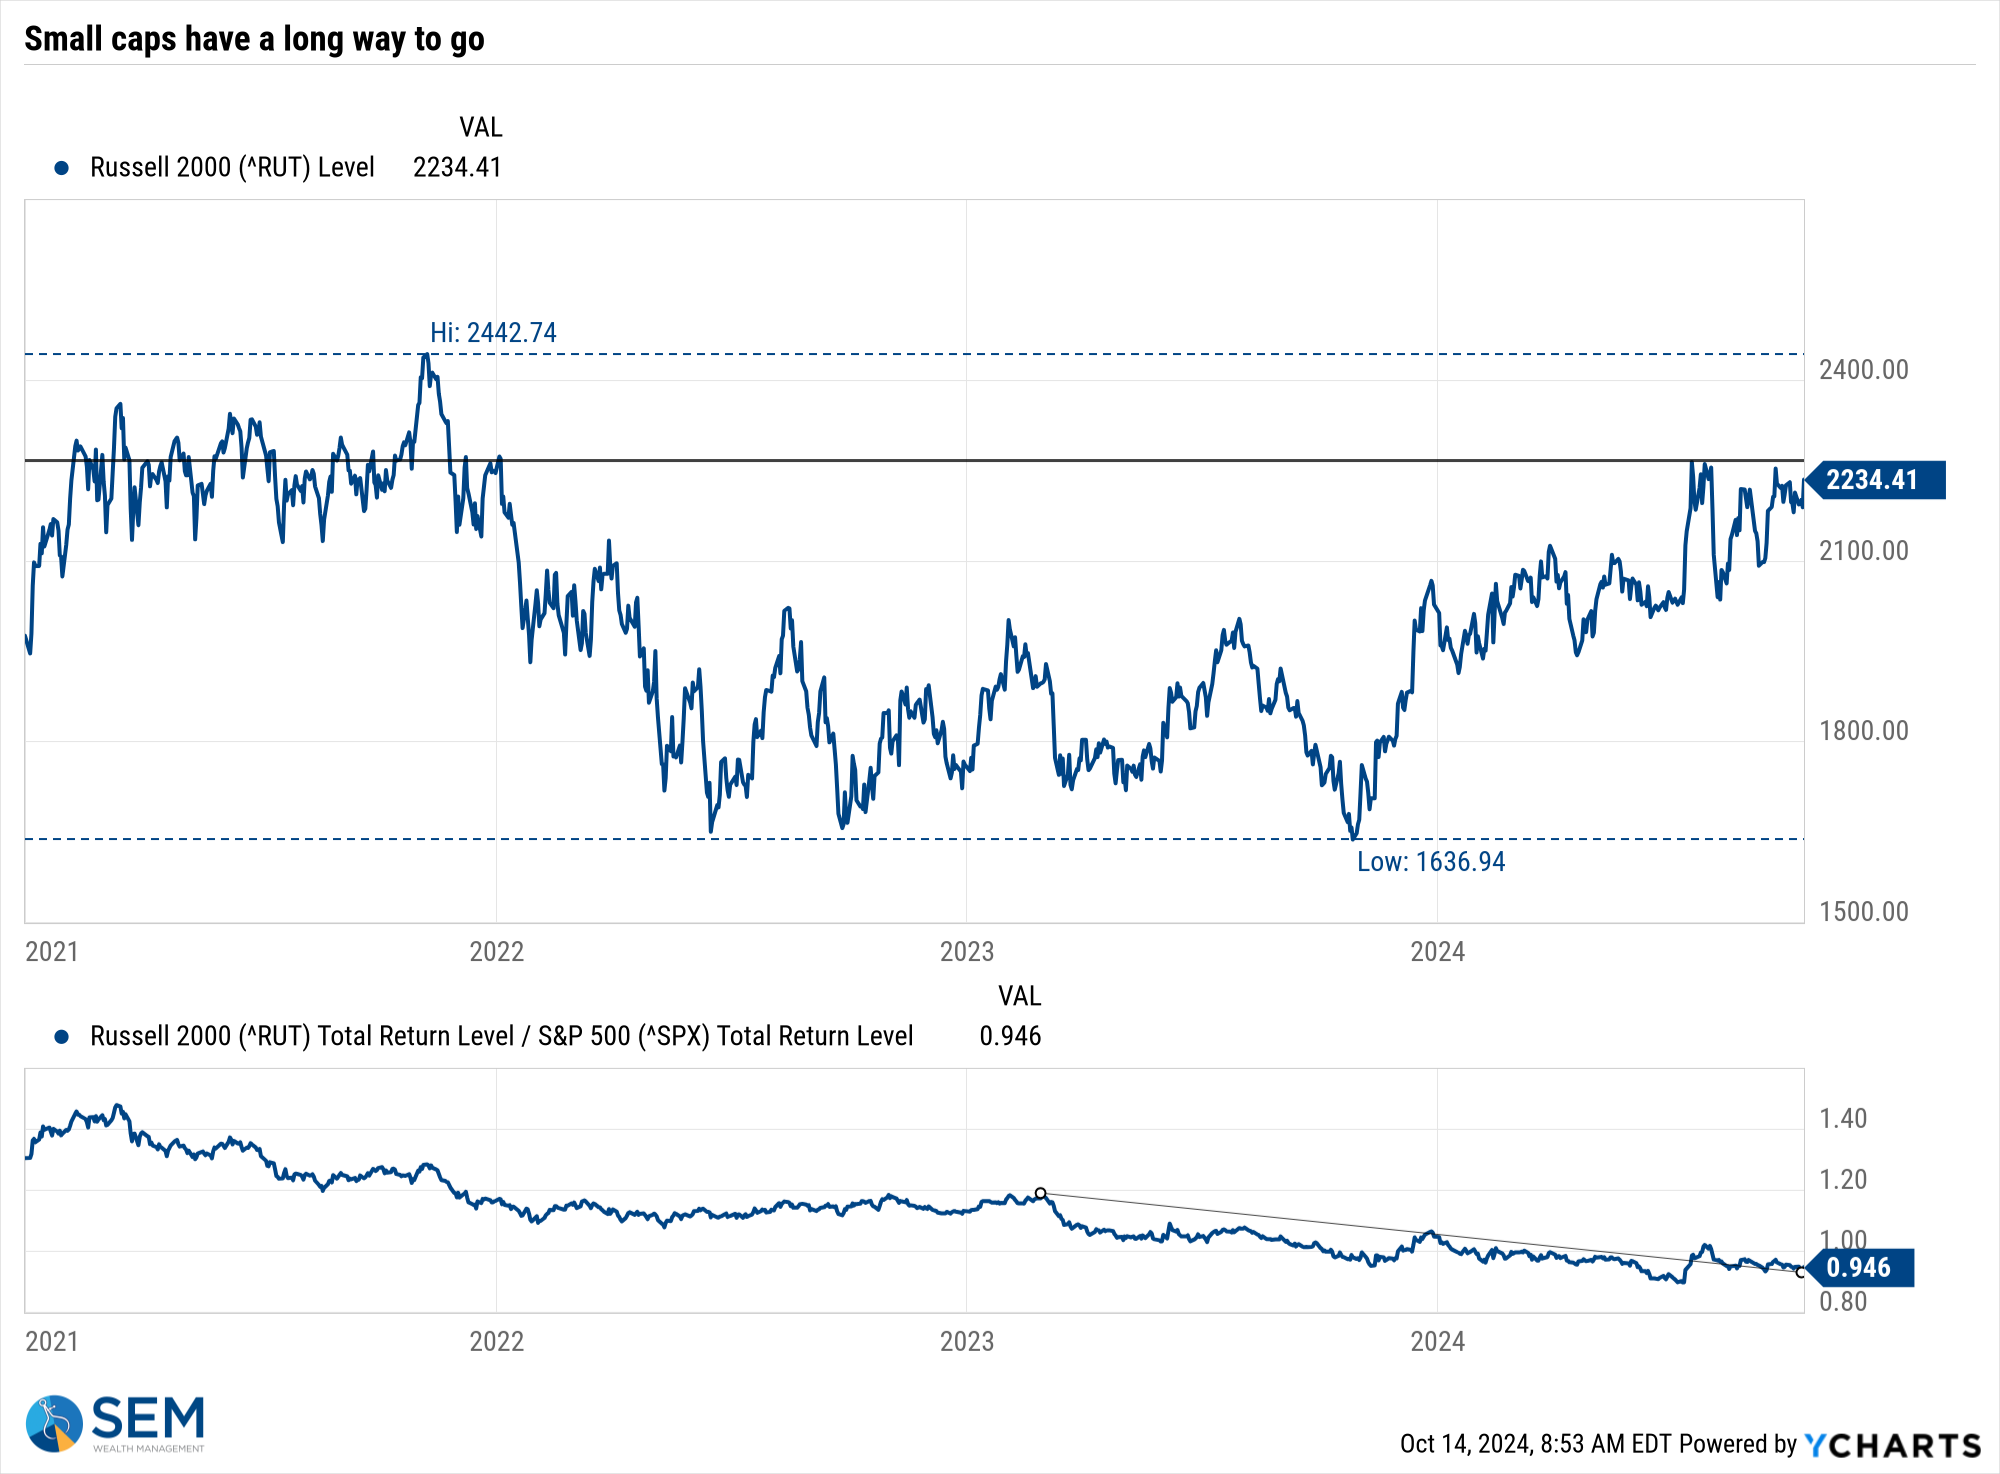
As I've also said for over a year, if everything was so great for the economy, small caps would be beating large caps because they have the most potential for growth relative to the mega cap companies. Instead, small caps continue to lag large caps which tells me the record highs for stocks are more driven by speculators than actual investors.
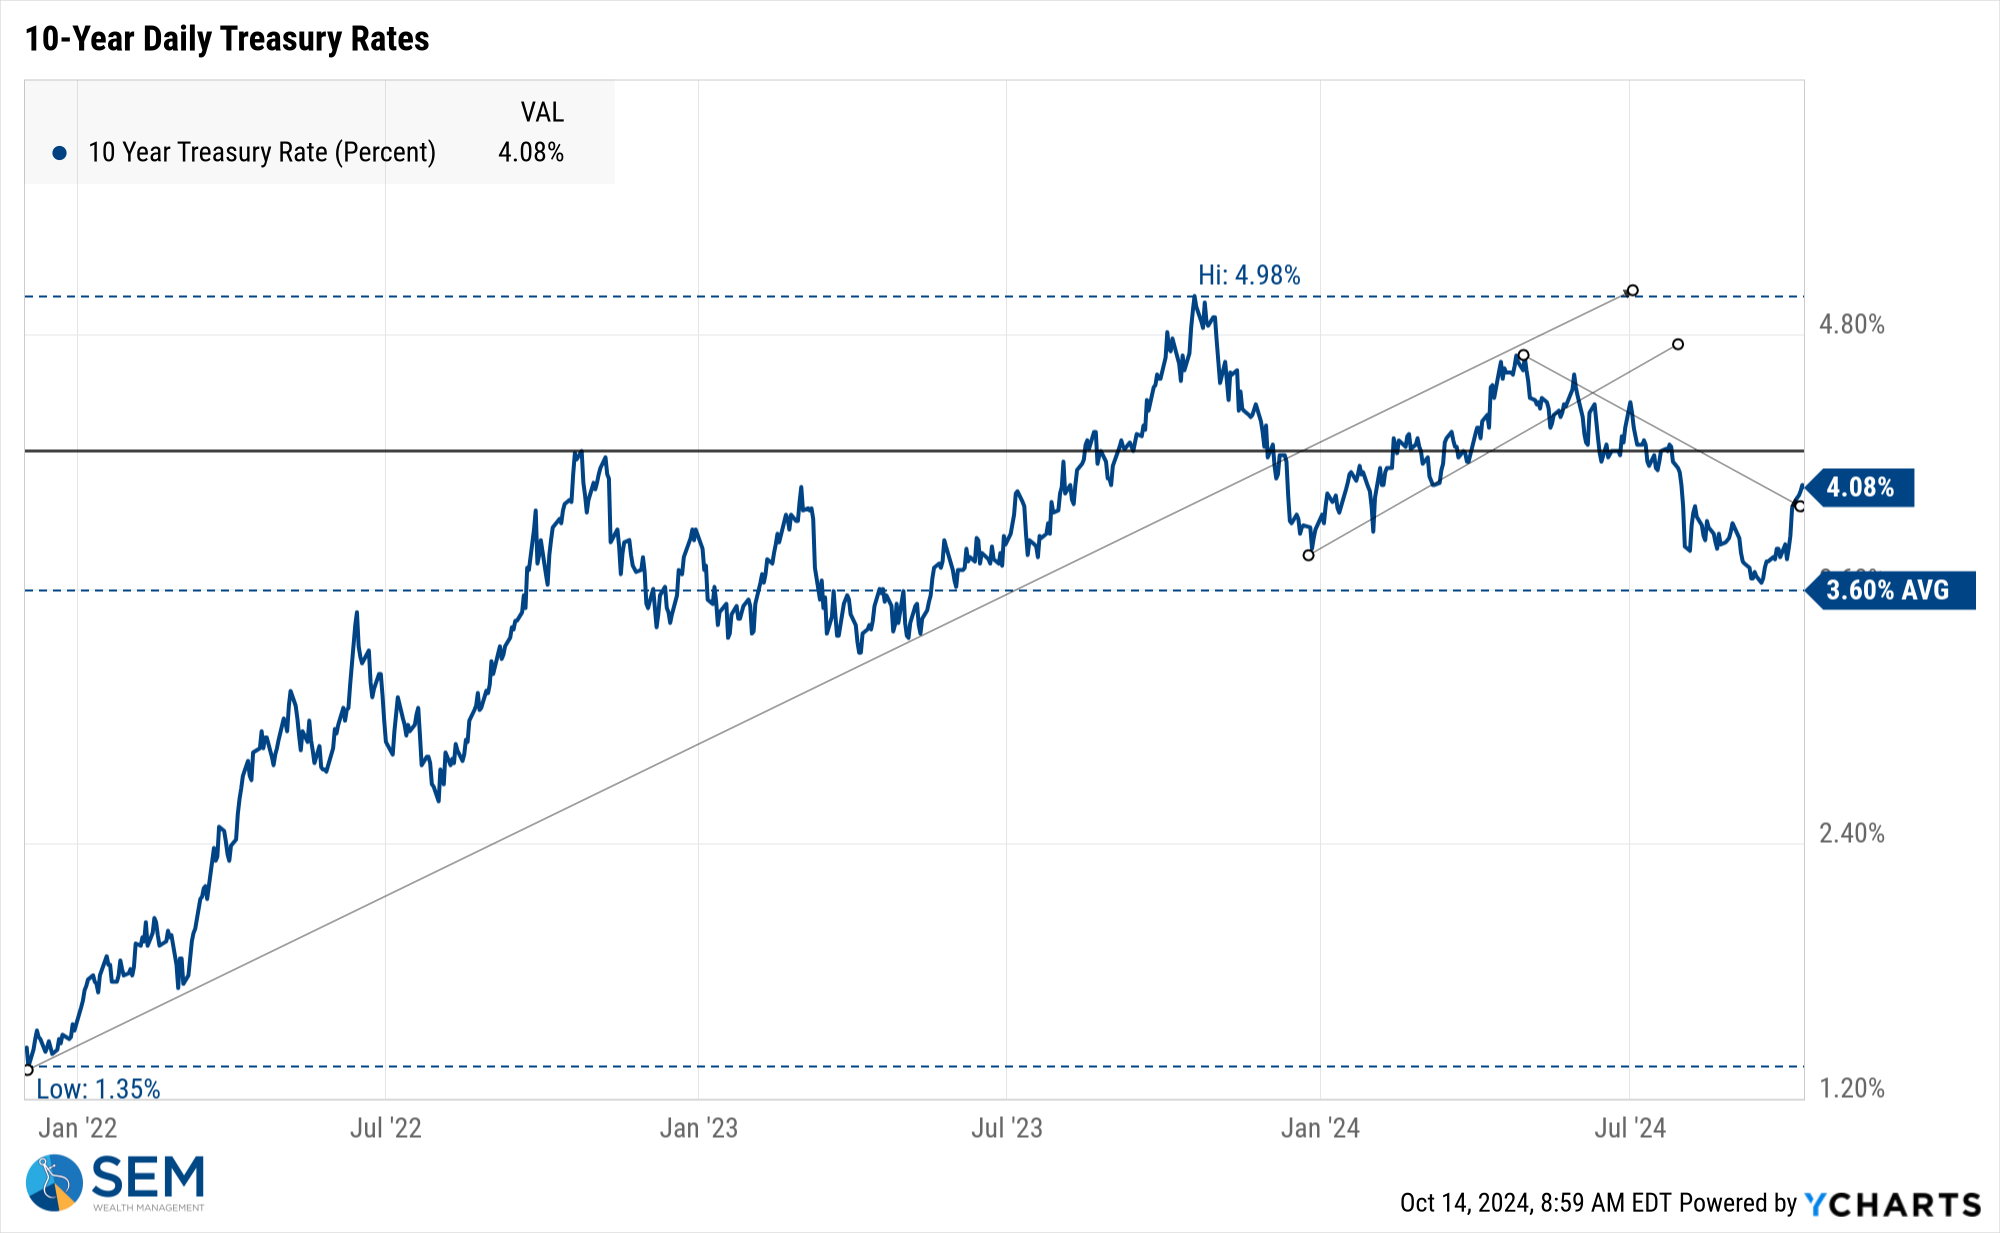
A bigger concern remains the bond market. Despite the Fed cutting rates, the rest of the interest rate curve has been INCREASING, which will make things more difficult for smaller companies and thus the overall economy. Note the trend in all other rates over the past few weeks.
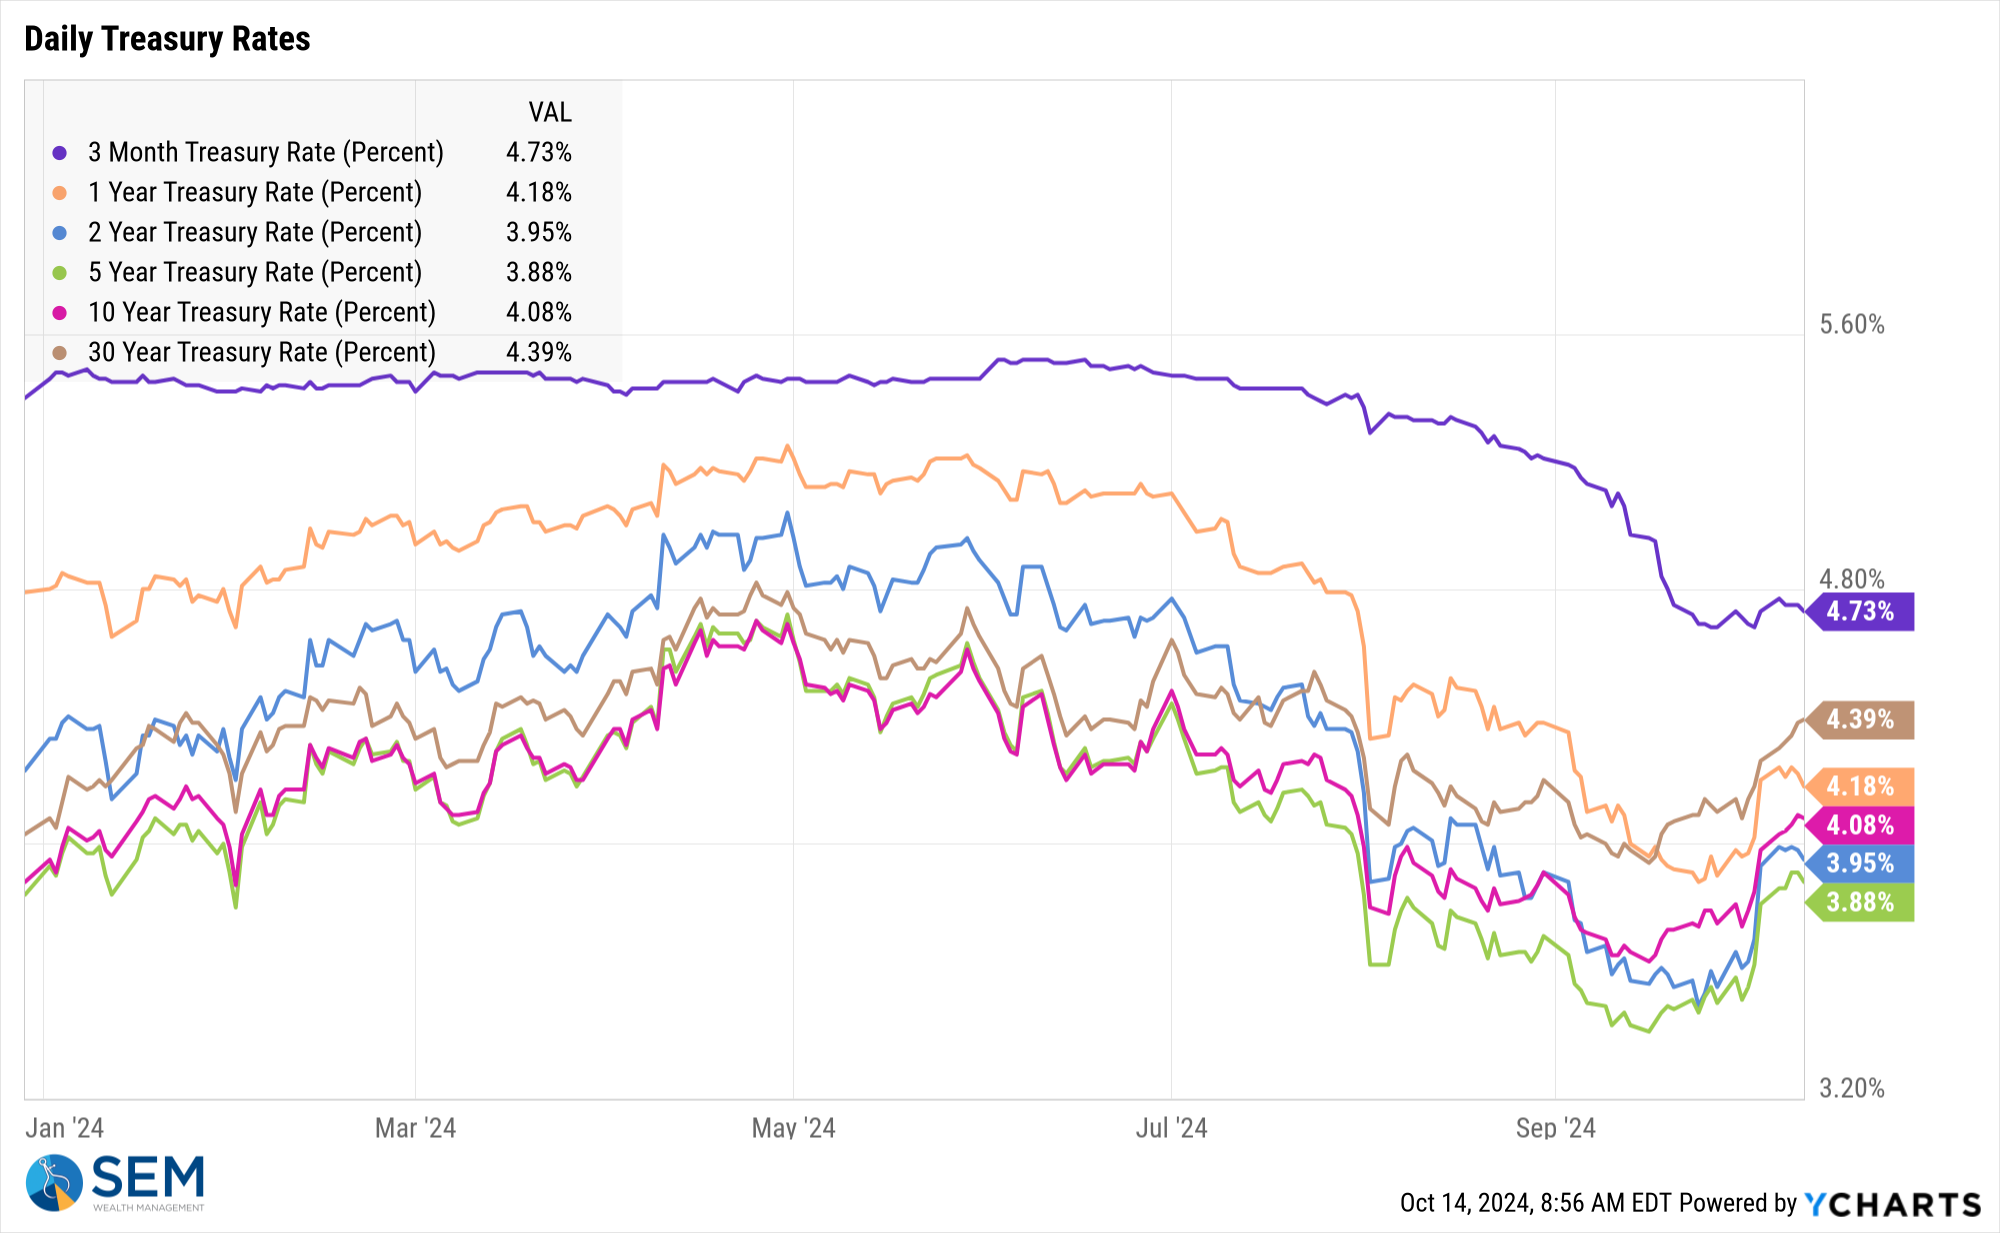
While the Fed can control short-term borrowing costs, the free market controls the rest. Most important rates such as mortgages are tied to the longer-term Treasury market, which makes the 10-year Treasury yield the most important to watch.
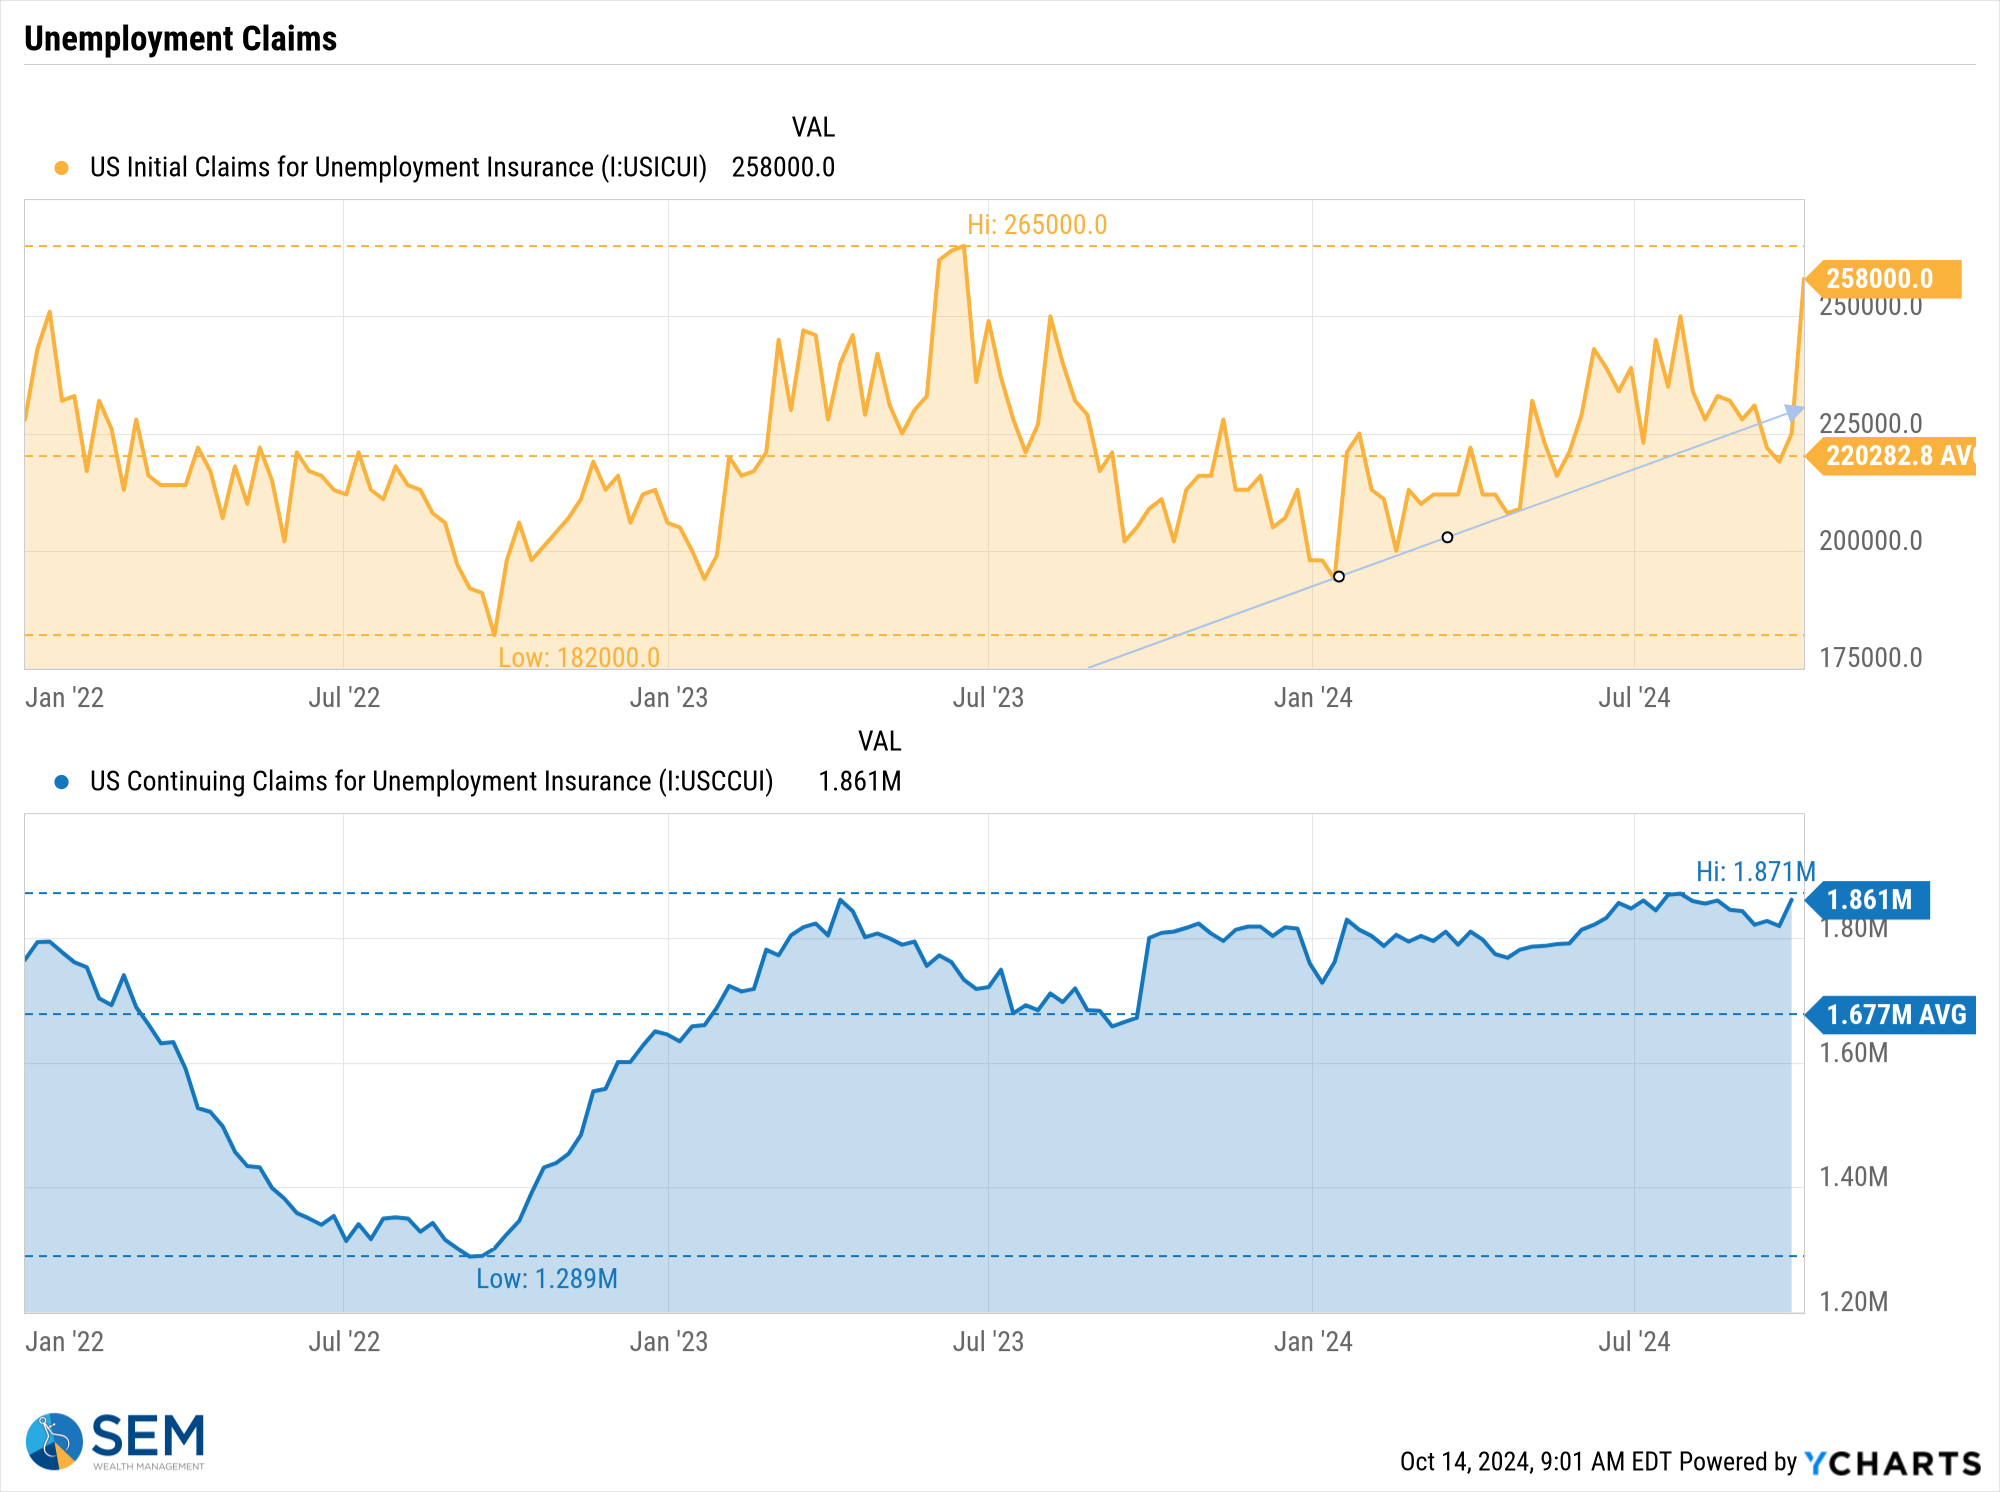
Something to keep an eye on is the Thursday release of unemployment claims. Last week we saw both initial and continuing claims shoot higher. If this continues for a few more weeks it could be a flashing alarm that the Fed is too late to save the economy from a recession.
For now, nothing has changed, but our systems are on high alert.
SEM Model Positioning
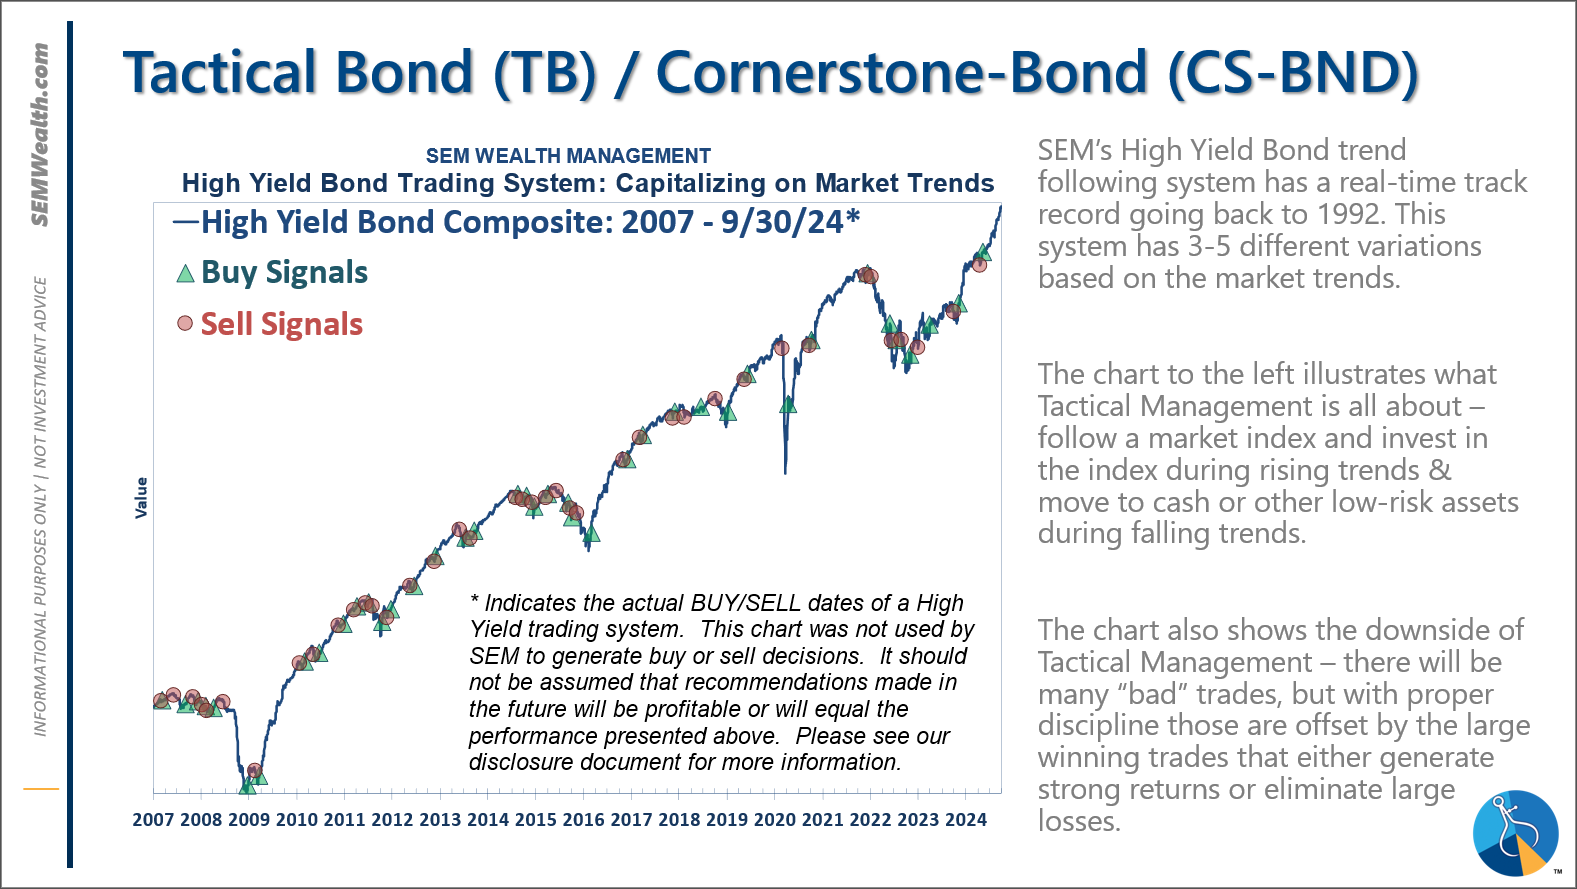
-Tactical High Yield had a partial buy signal on 5/6/24, reversing some of the sells on 4/16 & 17/2024 - the other portion of the signal remains on a sell as high yields continue to oscillate.
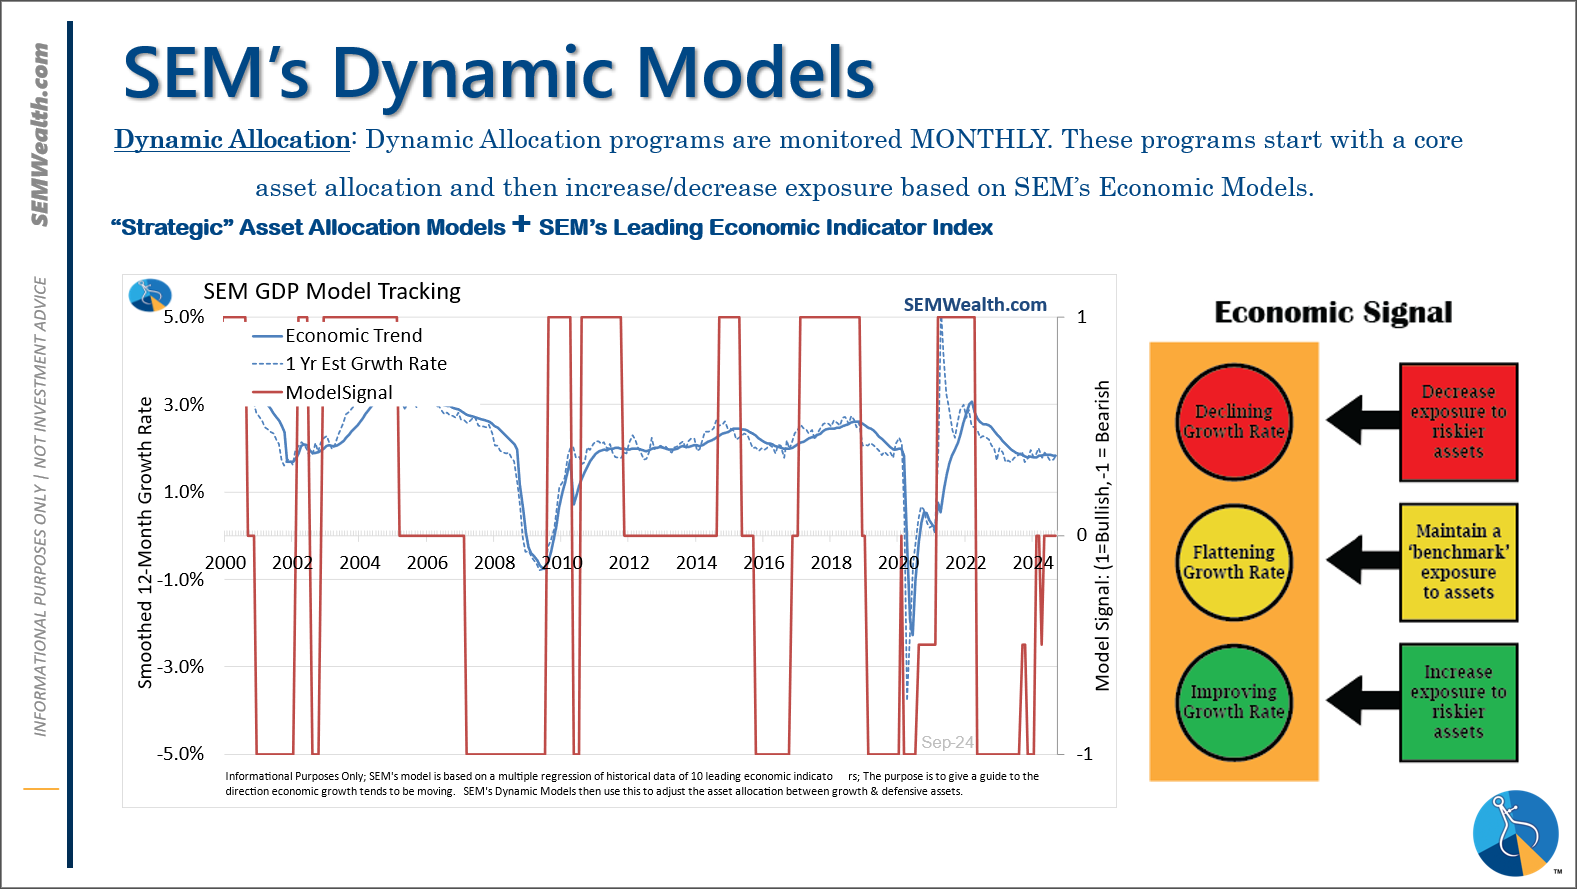
-Dynamic Models are 'neutral' as of 6/7/24, reversing the half 'bearish' signal from 5/3/2024. 7/8/24 - interest rate model flipped from partially bearish to partially bullish (lower long-term rates).
-Strategic Trend Models went on a buy 11/27/2023; 7/8/24 – small and mid-cap positions eliminated with latest Core Rotation System update – money shifted to Large Cap Value (Dividend Growth) & International Funds
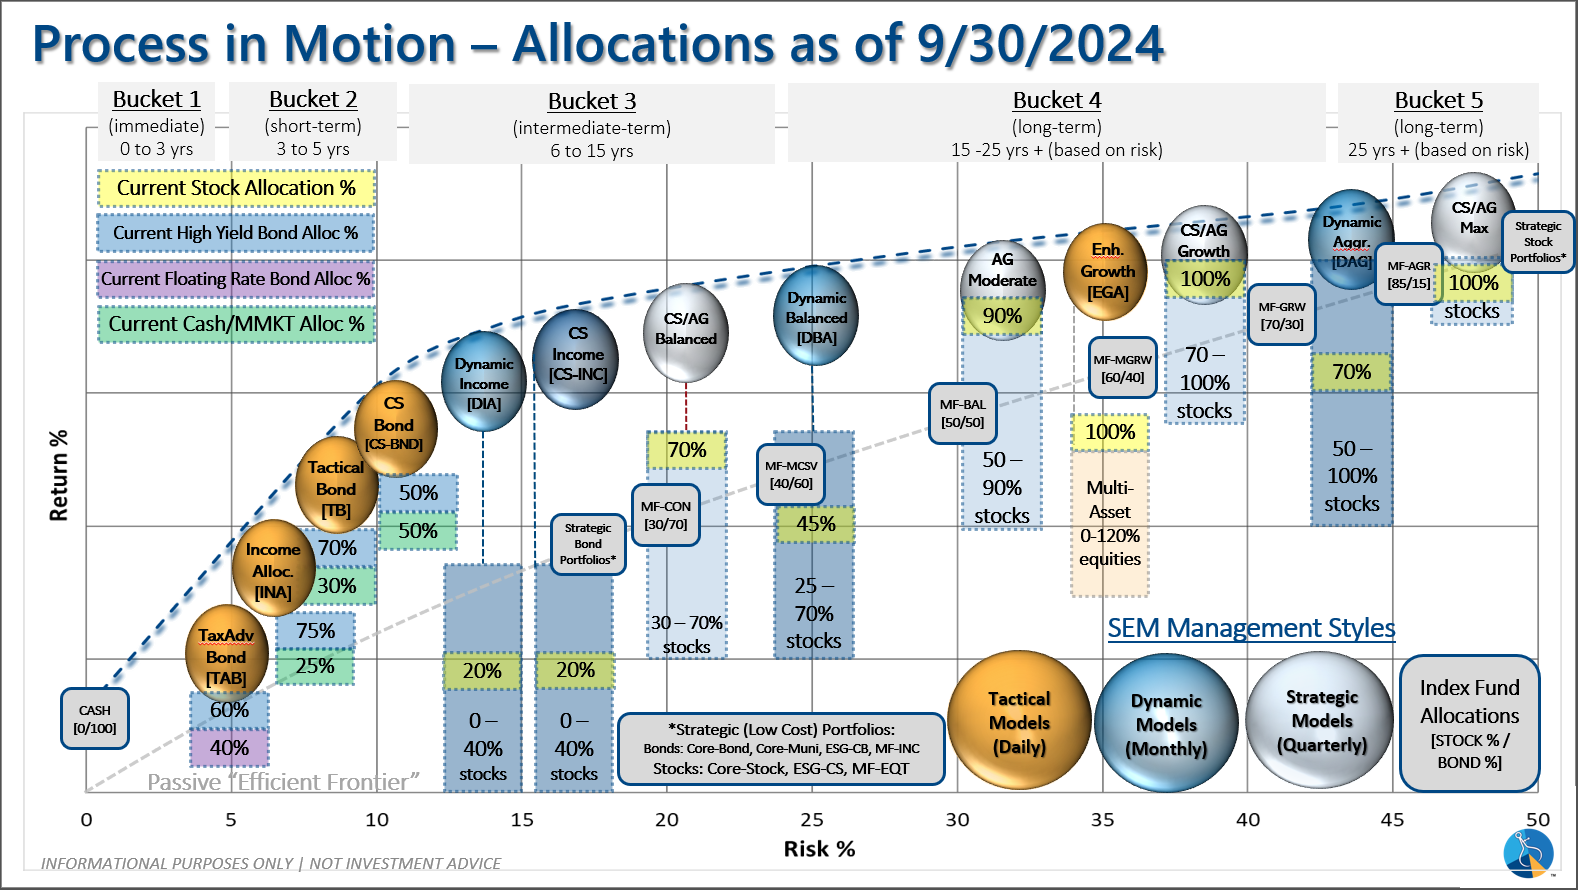
SEM deploys 3 distinct approaches – Tactical, Dynamic, and Strategic. These systems have been described as 'daily, monthly, quarterly' given how often they may make adjustments. Here is where they each stand.
Tactical (daily): On 5/6/24 about half of the signals in our high yield models switched to a buy. The other half remains in money market funds. The money market funds we are currently invested in are yielding between 4.3-4.8% annually.
Dynamic (monthly): The economic model was 'neutral' since February. In early May the model moved slightly negative, but reversed back to 'neutral' in June. This means 'benchmark' positions – 20% dividend stocks in Dynamic Income and 20% small cap stocks in Dynamic Aggressive Growth. The interest rate model is slightly 'bullish'.
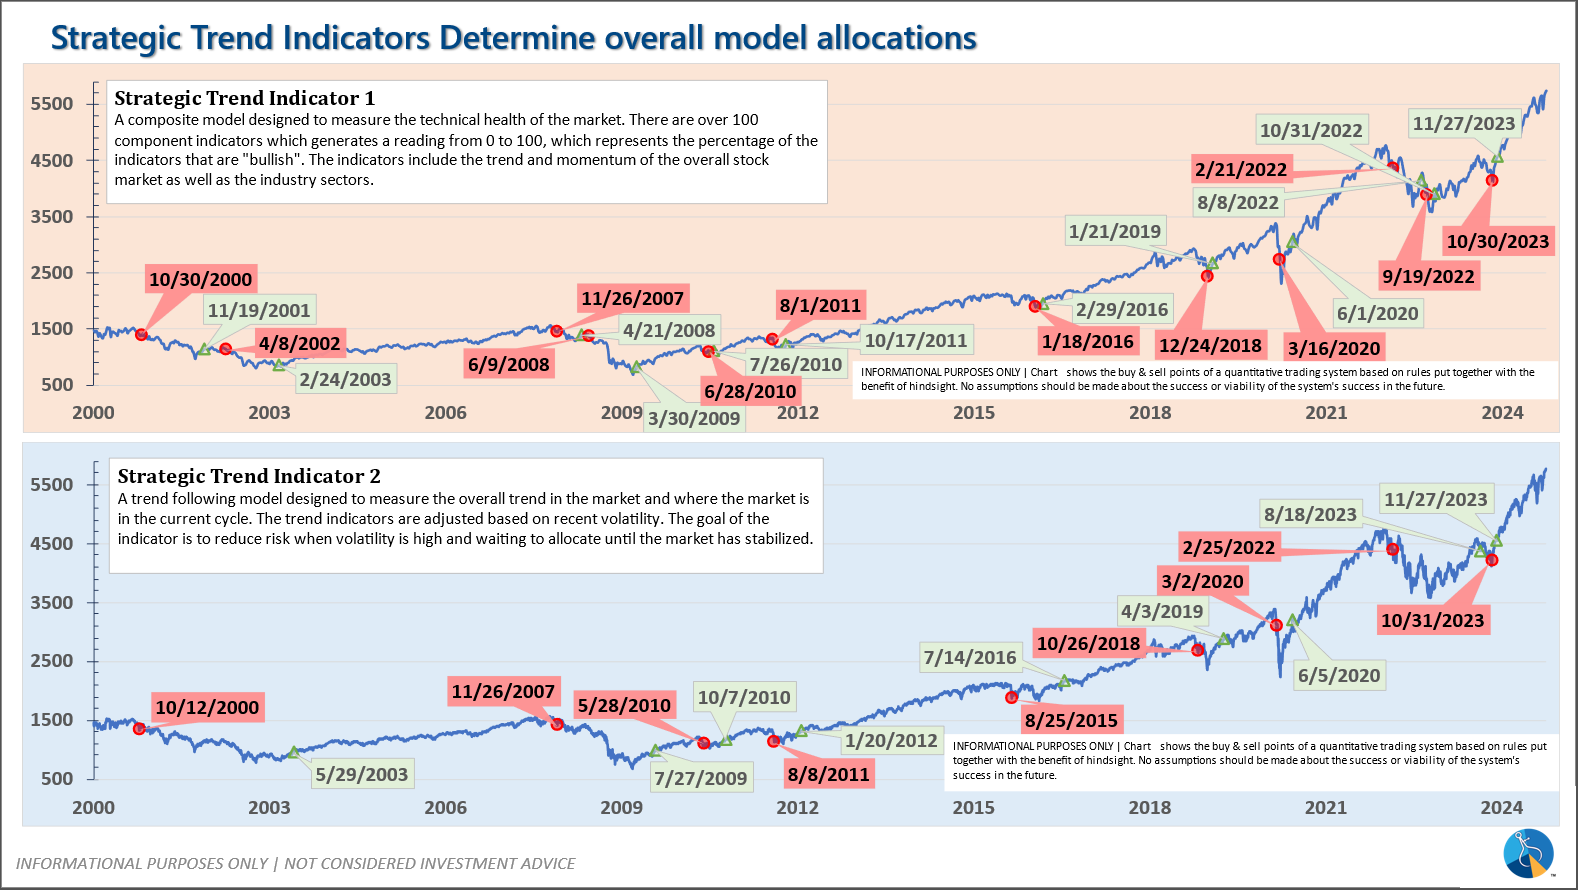
Strategic (quarterly)*: BOTH Trend Systems reversed back to a buy on 11/27/2023
The core rotation is adjusted quarterly. On August 17 it rotated out of mid-cap growth and into small cap value. It also sold some large cap value to buy some large cap blend and growth. The large cap purchases were in actively managed funds with more diversification than the S&P 500 (banking on the market broadening out beyond the top 5-10 stocks.) On January 8 it rotated completely out of small cap value and mid-cap growth to purchase another broad (more diversified) large cap blend fund along with a Dividend Growth fund.
The * in quarterly is for the trend models. These models are watched daily but they trade infrequently based on readings of where each believe we are in the cycle. The trend systems can be susceptible to "whipsaws" as we saw with the recent sell and buy signals at the end of October and November. The goal of the systems is to miss major downturns in the market. Risks are high when the market has been stampeding higher as it has for most of 2023. This means sometimes selling too soon. As we saw with the recent trade, the systems can quickly reverse if they are wrong.
Overall, this is how our various models stack up based on the last allocation change:
Questions or comments - drop us a note?
Curious if your current investment allocation aligns with your overall objectives and risk tolerance? Take our risk questionnaire


