"You have to start my term from November 5th, okay? Or November 6th if you want ... November 5th, because the market's gone through the roof. Enthusiasms doubled. It's doubled in the last short while." - President-elect Donald Trump 11/14/2024
I don't know about you, but my inbox continues to be bombarded by post-election analysis and predictions for the market and economy. I've not signed up for a single one because anybody who says they can predict what will happen in the next 3 months, 6 months, or even next 12 months is either delusional or purposely lying to you. The one thing we learned during President Trump's first term is you never know what's going to happen.
Last week's blog is important to review for anybody who believes everything will be great the next 4 years. If you know anybody on the President-elect's economic team, I'd love to have a chat with them about how economics actually works.

During the first Trump term I often would discuss "good" Trump vs. "bad" Trump. I wasn't making a statement on him as a person or president, but simply what his various statements, executive orders, ad hoc comments as he boarded a helicopter, or tweets meant for the stock market or economy. He was elected to fix LONG-TERM problems, but more often than not both Donald Trump and the American people look at SHORT-TERM stock market moves to gauge whether or not it is a good idea.
The more Donald Trump focuses on the stock market, the less likely he will accomplish any of the big picture things he promised. His statement last Thursday evening about giving him credit for the moves in the stock market (somehow starting with the day of the election) is hopefully not a sign that he is going to change his policies based on short-term fluctuations in the stock market.
Yes the move the DAY AFTER the election was impressive, but the market has moved back down to where it was the morning after the election.

If we give President Trump credit for the move from November 6 to today, does that mean we give President Biden credit for the move from late August until November 5? Does President Biden also get credit for the stock market moves from the time Donald Trump lost the election in 2020?

Even with the big drop in 2022, the annualized return from election to election was 14.3%. Is that the benchmark we should evaluate Trump 2.0?
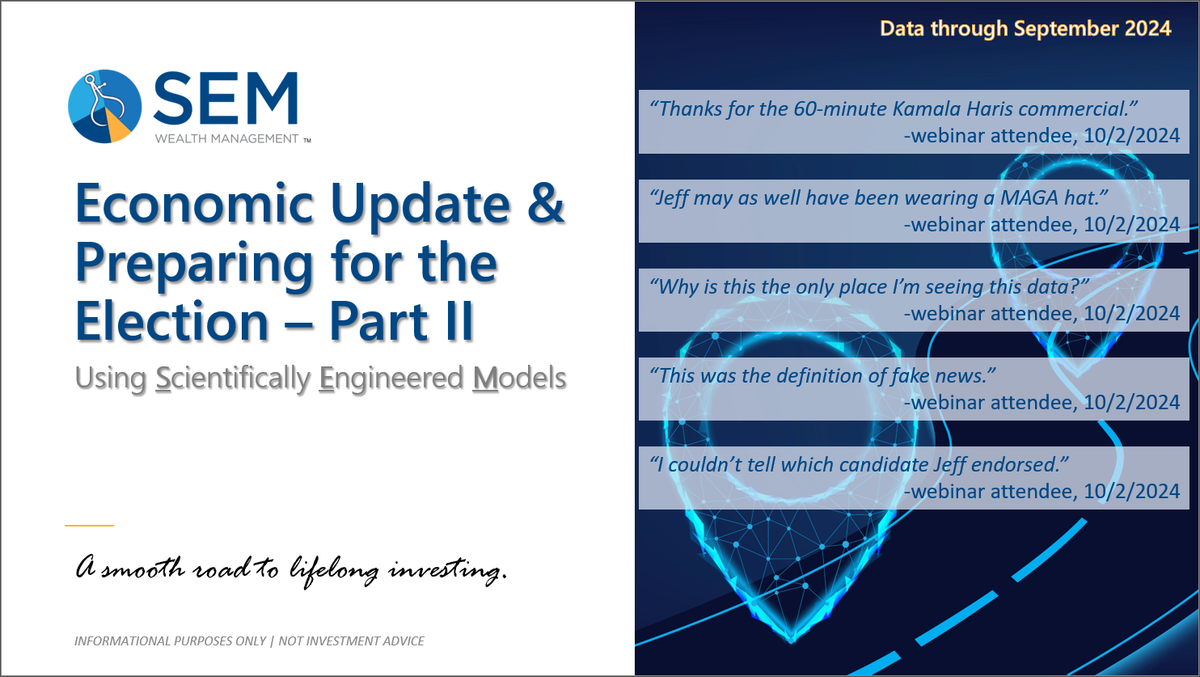
Obviously the answer is NO. Please, please, please go back and read last week's blog. Better yet, watch our pre-election webinar where we look at the DATA.
My hope for our country is we will stop evaluating everything based on short-term stock market fluctuations. It needs to start at the top. As I've mentioned since before the election, we are DUE for a recession. We are DUE for a bear market correction of over 20%. It doesn't matter who is president, both the market and economy are over-extended and a pullback would be HEALTHY as it creates opportunities for long-term investment. Trying to assign credit (or blame) on short-term moves creates a government that only considers short-term fluctuations and ignores the long-term necessary changes which must happen.
If there is ever a reason to use SEM's quantitative, unemotional approach the moves last week show the value it can bring. We aren't stuck dissecting the latest comment from the President-elect or chasing an irrationally exuberant market if the data doesn't tell us to do so.
Market Charts
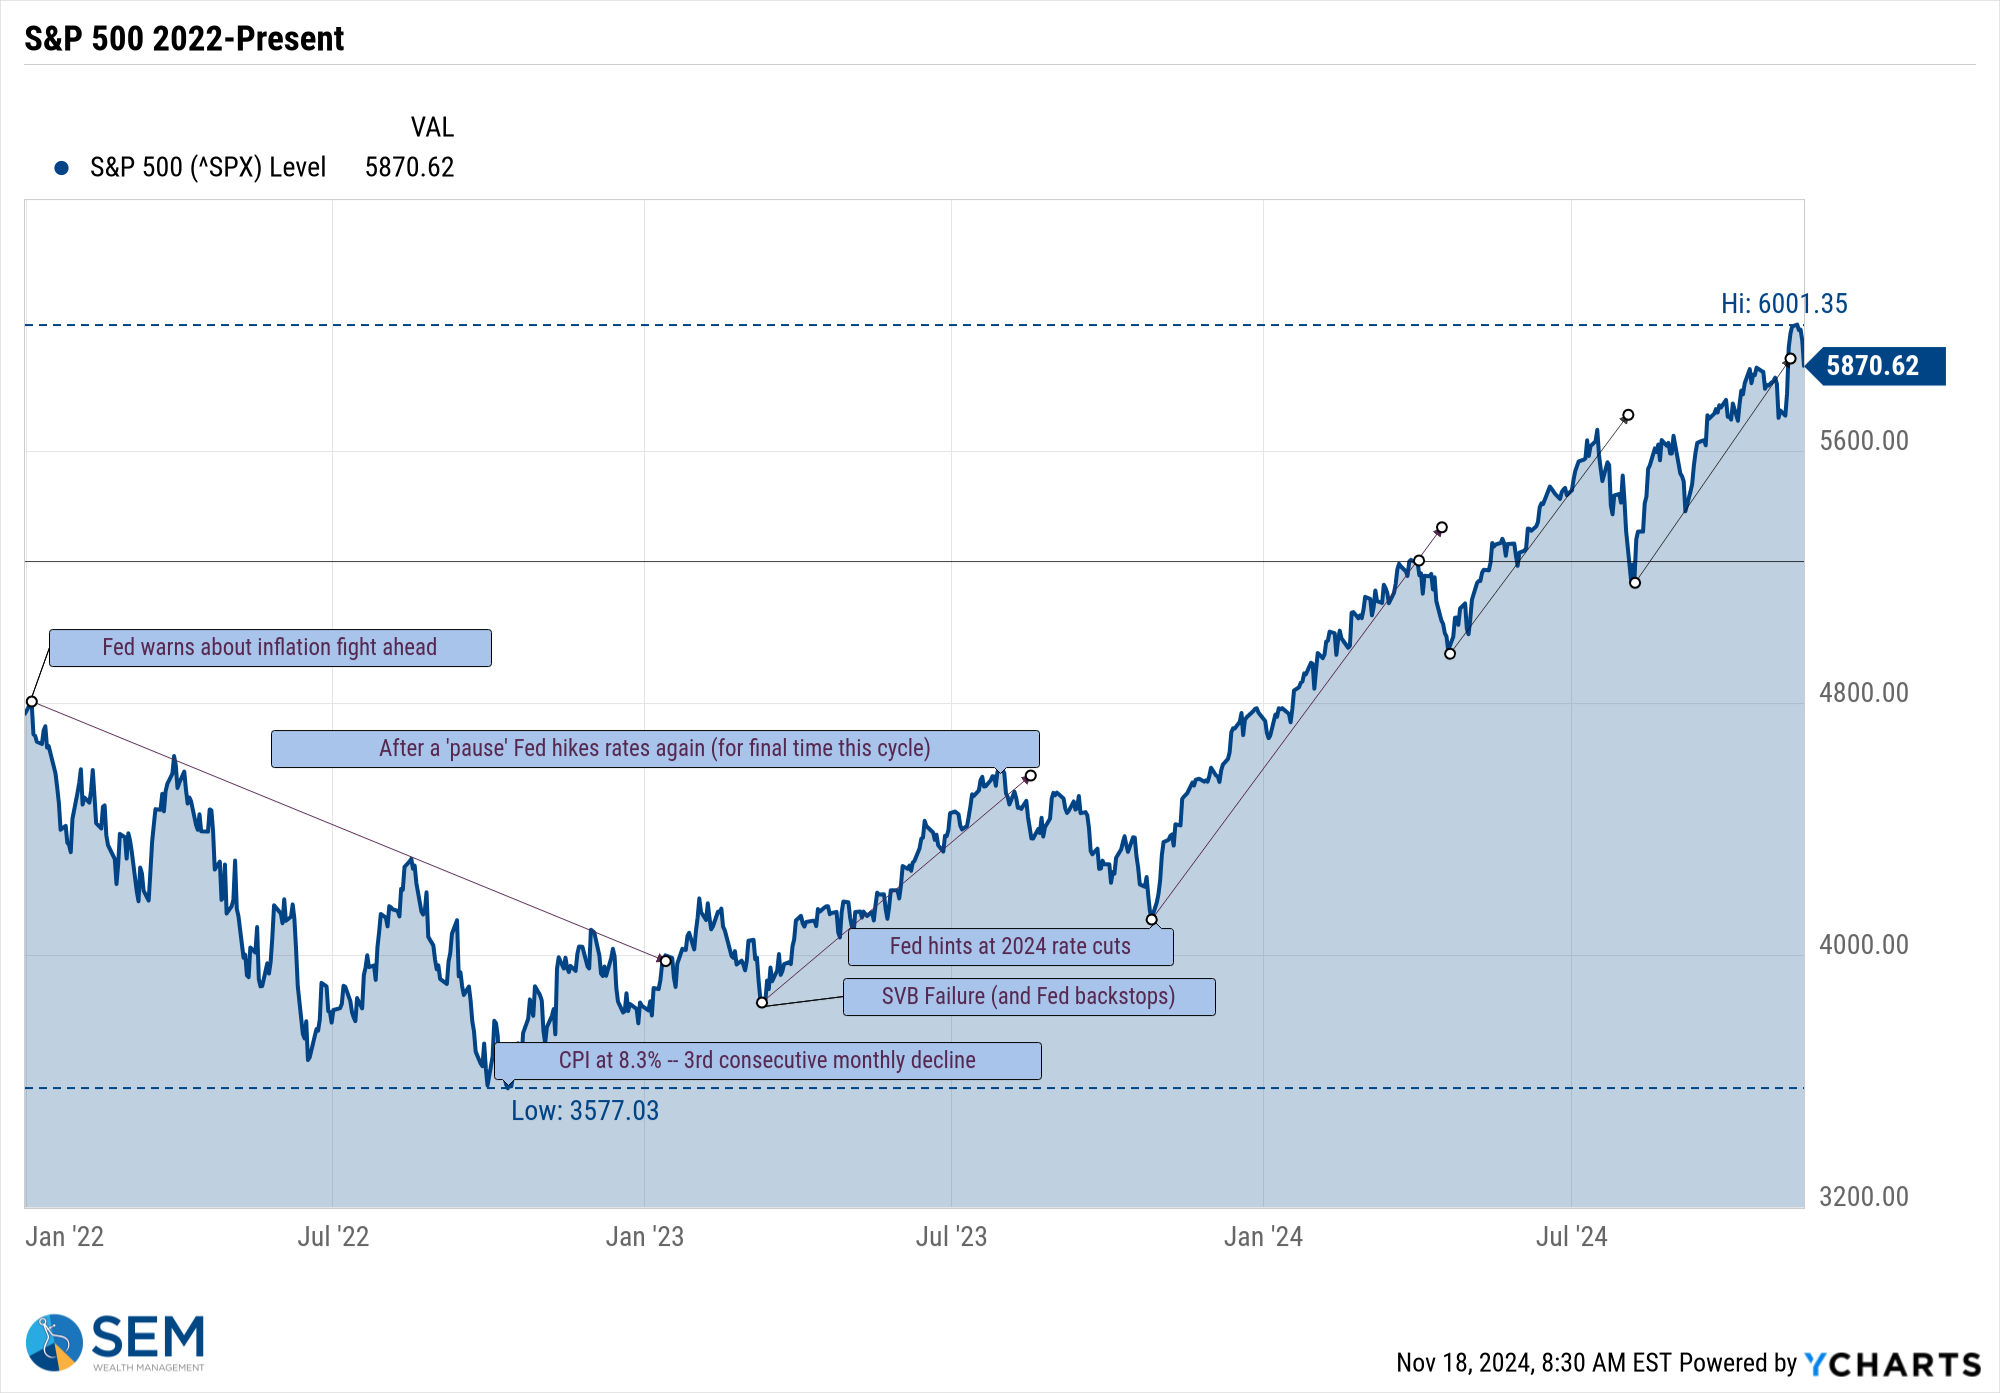
The S&P 500 is still in an uptrend off of the lows from a year ago. As I mentioned last week, the 1-year returns are unsustainable. Following 30-40% gains in a single year, the market nearly always corrects to alleviate the extremely overbought position.
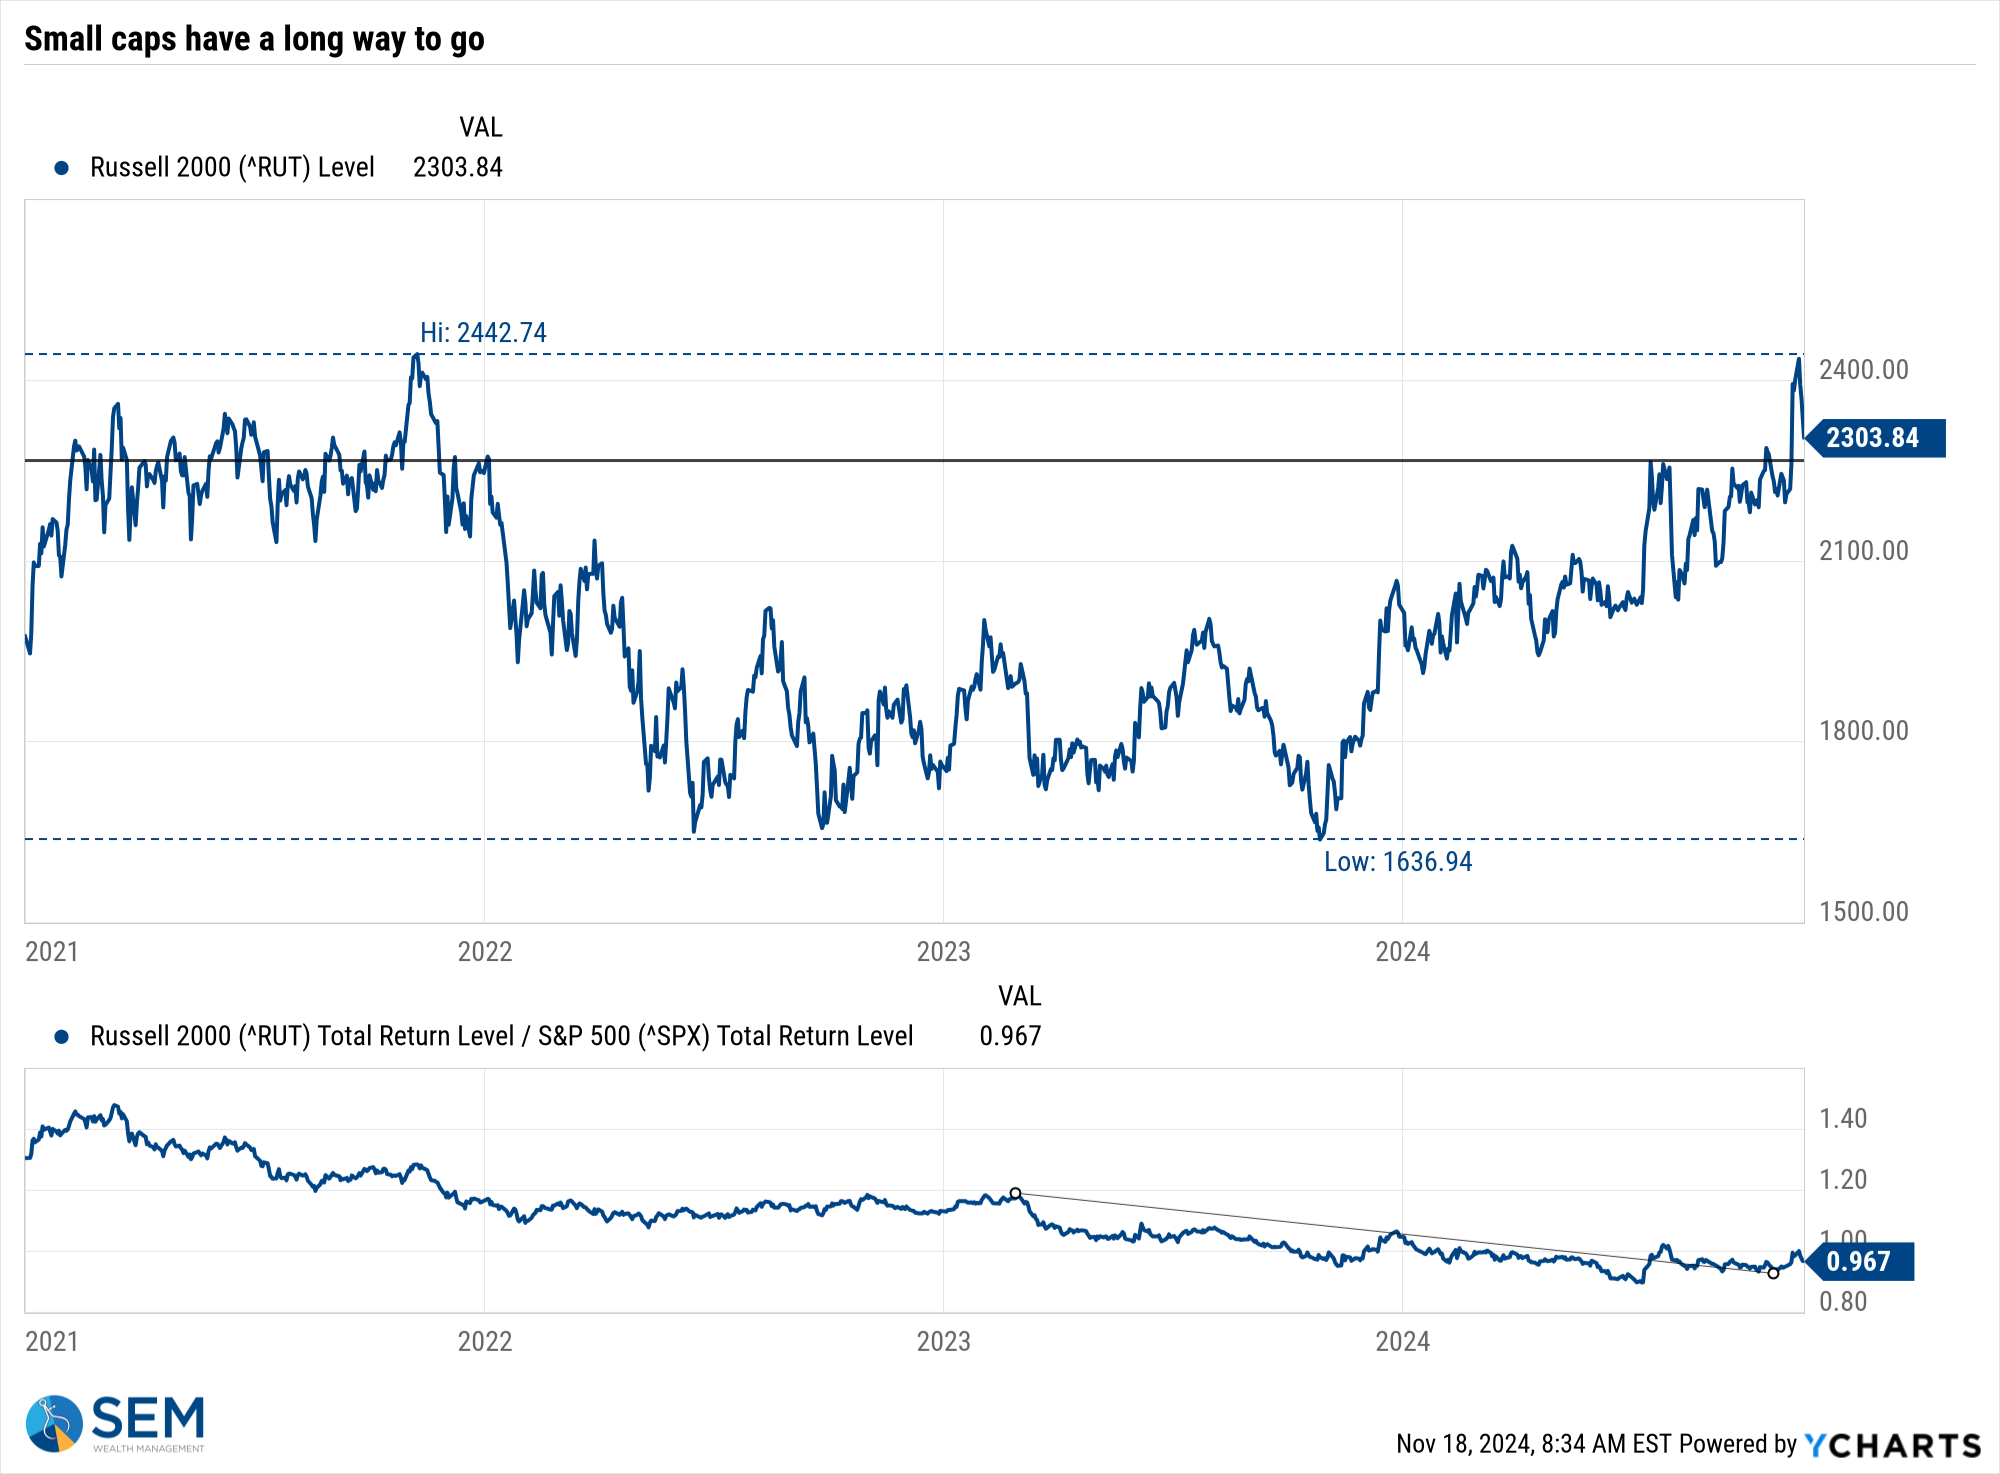
Small caps continue to be a better measure of the health of the underlying economy and faith investors have in it. After the brief rally last week, small caps gave back nearly the entire move Thursday and Friday.
The more pressing issue is the bond market. Since the Fed started cutting rates as they declared "mission accomplished" on their inflation fight, longer-term rates have said "not so fast". On Friday Fed Chair Jerome Powell finally admitted what the bond market was saying the past two months – the fight isn't quite over and moving too far too fast the opposite way could do more harm than good.
Note how all of the longer-term rates have moved UP since the Fed started cutting rates.
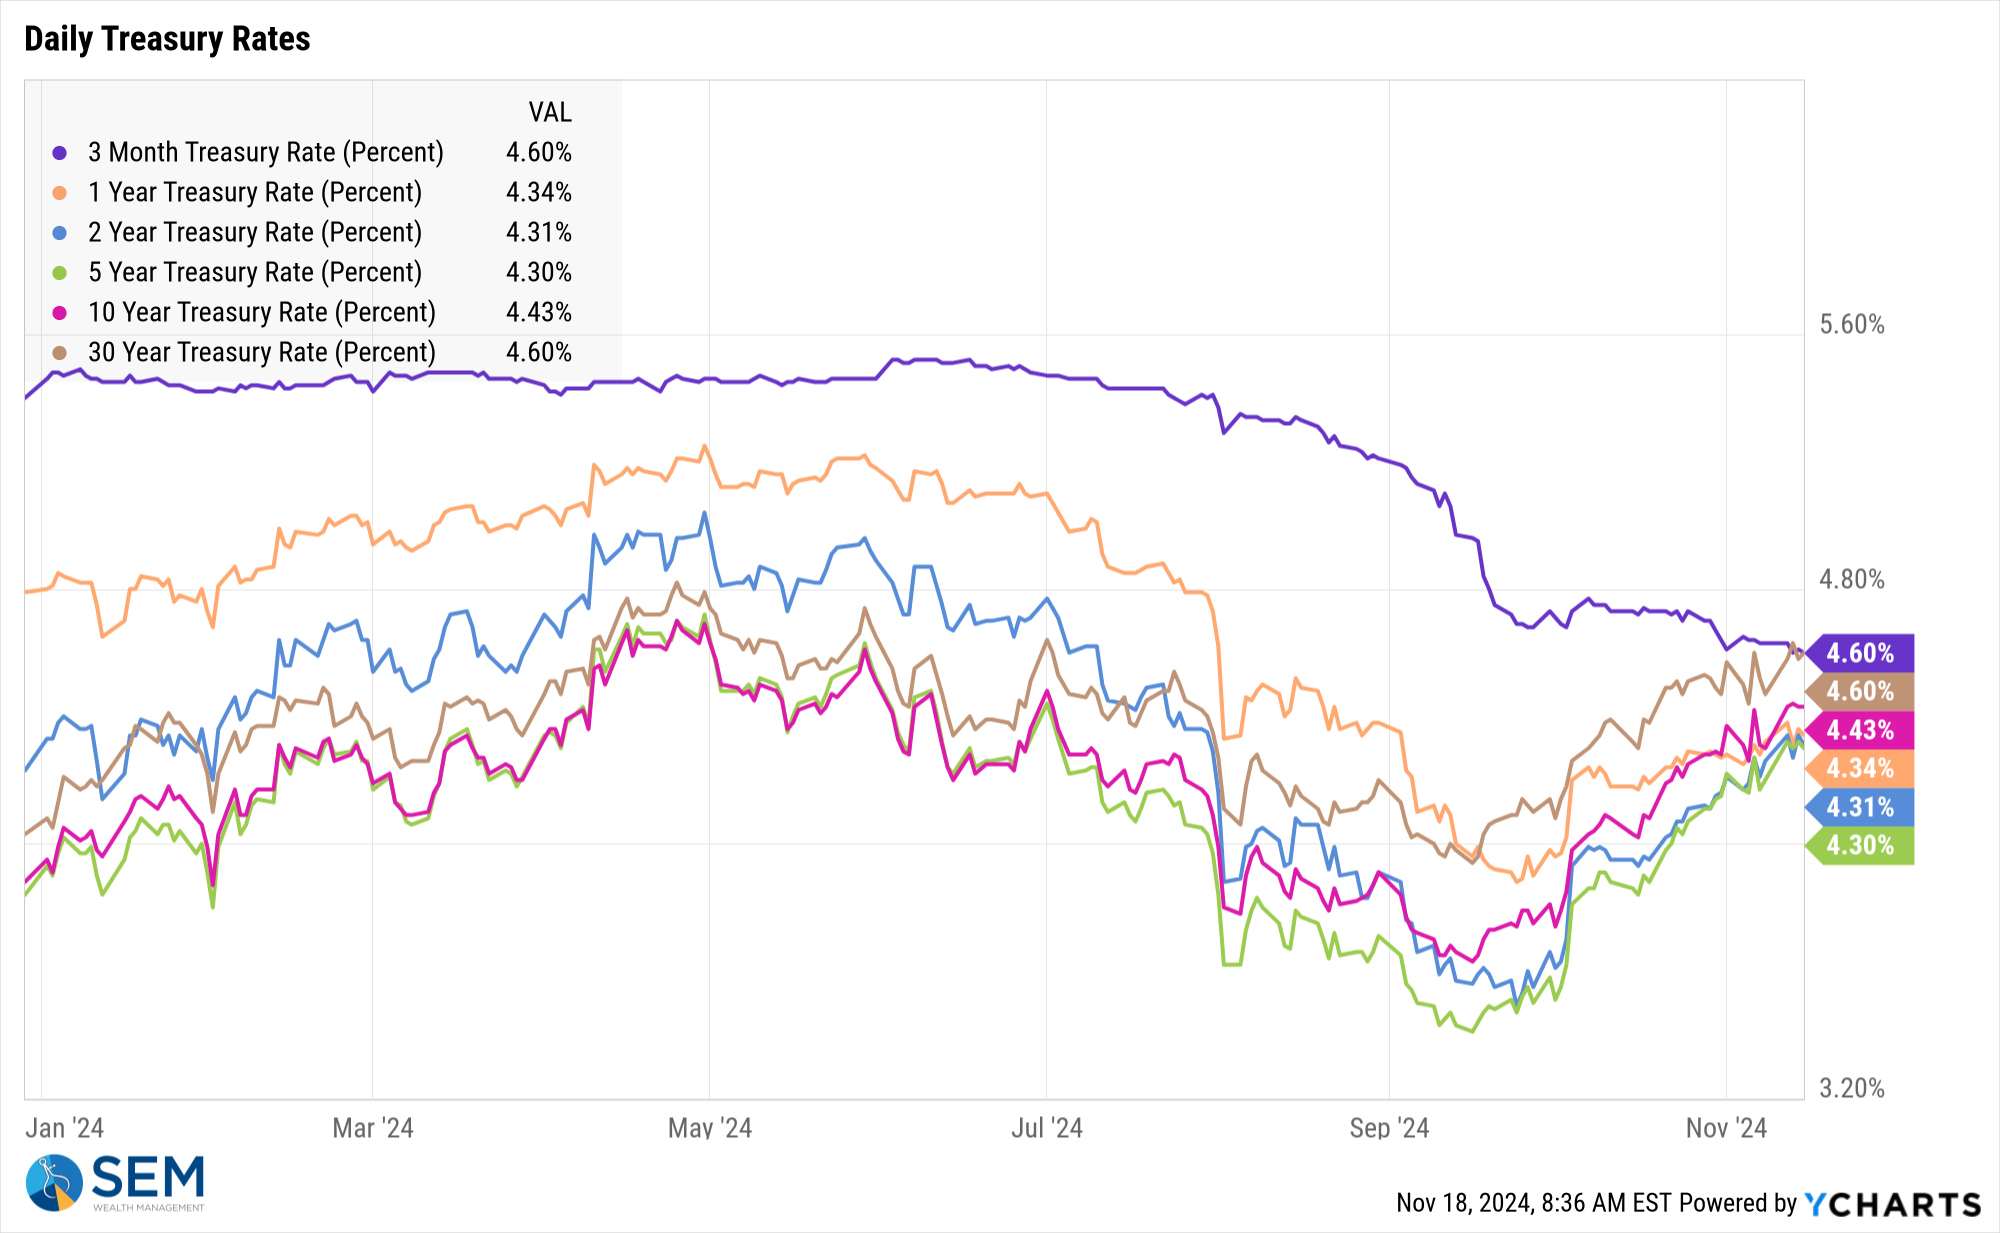
Keep your eye on the 10-year yield. President Trump's ability to implement most of his policy promises will depend on the ability for the US to borrow money at reasonable interest rates.
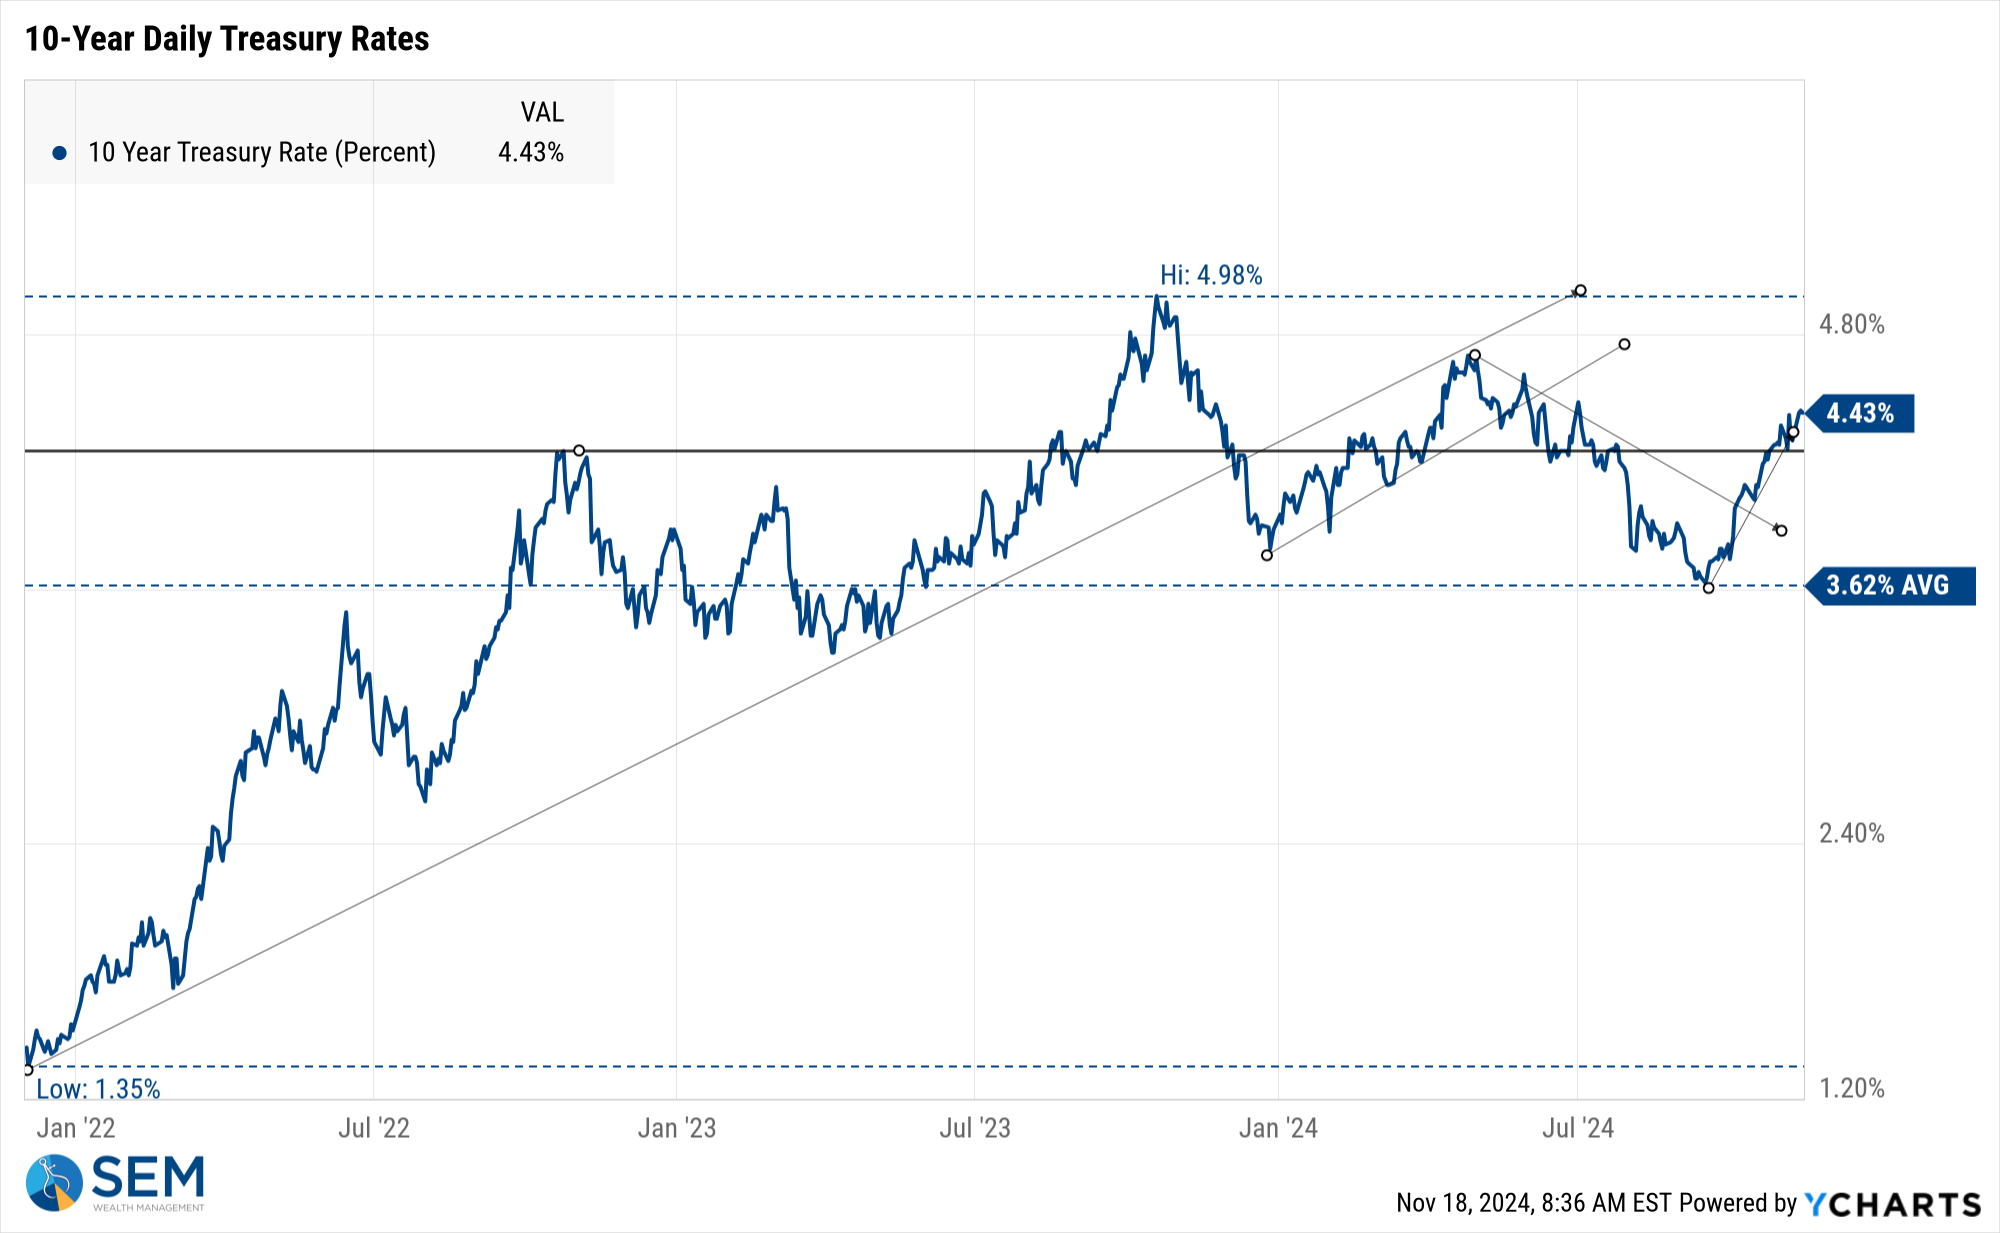
Simply creating the "Department of Government Efficiency (DOGE)" does not tell the world the US is serious about reigning in our long-term deficits. If DOGE is able to have real authority and finds a way to cut trillions (not billions) from the government expenditures, it is a good start. Call me cynical, but saying you are going to cut waste and actually doing it is dramatically different.
SEM Model Positioning
-Tactical High Yield had a partial buy signal on 5/6/24, reversing some of the sells on 4/16 & 17/2024 - the other portion of the signal remains on a sell as high yields continue to oscillate.
-Dynamic Models are 'neutral' as of 6/7/24, reversing the half 'bearish' signal from 5/3/2024. 7/8/24 - interest rate model flipped from partially bearish to partially bullish (lower long-term rates).
-Strategic Trend Models went on a buy 11/27/2023; 7/8/24 – small and mid-cap positions eliminated with latest Core Rotation System update – money shifted to Large Cap Value (Dividend Growth) & International Funds
SEM deploys 3 distinct approaches – Tactical, Dynamic, and Strategic. These systems have been described as 'daily, monthly, quarterly' given how often they may make adjustments. Here is where they each stand.
Tactical (daily): On 5/6/24 about half of the signals in our high yield models switched to a buy. The other half remains in money market funds. The money market funds we are currently invested in are yielding between 4.3-4.8% annually.

Dynamic (monthly): The economic model was 'neutral' since February. In early May the model moved slightly negative, but reversed back to 'neutral' in June. This means 'benchmark' positions – 20% dividend stocks in Dynamic Income and 20% small cap stocks in Dynamic Aggressive Growth. The interest rate model is slightly 'bullish'.

Strategic (quarterly)*: BOTH Trend Systems reversed back to a buy on 11/27/2023
The core rotation is adjusted quarterly. On August 17 it rotated out of mid-cap growth and into small cap value. It also sold some large cap value to buy some large cap blend and growth. The large cap purchases were in actively managed funds with more diversification than the S&P 500 (banking on the market broadening out beyond the top 5-10 stocks.) On January 8 it rotated completely out of small cap value and mid-cap growth to purchase another broad (more diversified) large cap blend fund along with a Dividend Growth fund.
The * in quarterly is for the trend models. These models are watched daily but they trade infrequently based on readings of where each believe we are in the cycle. The trend systems can be susceptible to "whipsaws" as we saw with the recent sell and buy signals at the end of October and November. The goal of the systems is to miss major downturns in the market. Risks are high when the market has been stampeding higher as it has for most of 2023. This means sometimes selling too soon. As we saw with the recent trade, the systems can quickly reverse if they are wrong.

Overall, this is how our various models stack up based on the last allocation change:

Questions or comments - drop us a note?
Curious if your current investment allocation aligns with your overall objectives and risk tolerance? Take our risk questionnaire


