
It's always interesting how the narratives can shift for the stock market. From the election in November until the middle of February the story was how the "pro-business" policies of President Trump would unlock impressive economic growth, low inflation, lower interest rates, and thus higher than average earnings growth. This of course would lead to another year of above average returns for stocks.
Then in mid-February, with the primary focus from the White House being on tariffs and not the other policies, the narrative shifted. Inflation was not coming down and in fact could rise. The threat of tariffs meant consideration of a decline in profit margins, revenue, and earnings. The "Liberation Day" announcement on April 2 was far more dire than most had anticipated. The fact the President and Treasury Secretary did not seem to care about the market impact only created more fear.
Then on April 9 the President reversed course and delayed most of the tariffs. Since that time the narrative has shifted to "the President brilliantly used the high tariffs to open negotiations and the US will come out ahead."
It's obviously still too early to tell what will happen and as I mentioned last week, a lot can change with a single Truth Social post from the President. That leaves us to take a look at the data. We haven't really seen too much in the way of actual new tariffs levied, but we have had some. We just wrapped up the month for SEM's Economic Model and for now we stand at the same place we have since last June. Not terrible, but also not great.
Keep reading for all the details.
SEM Economic Update
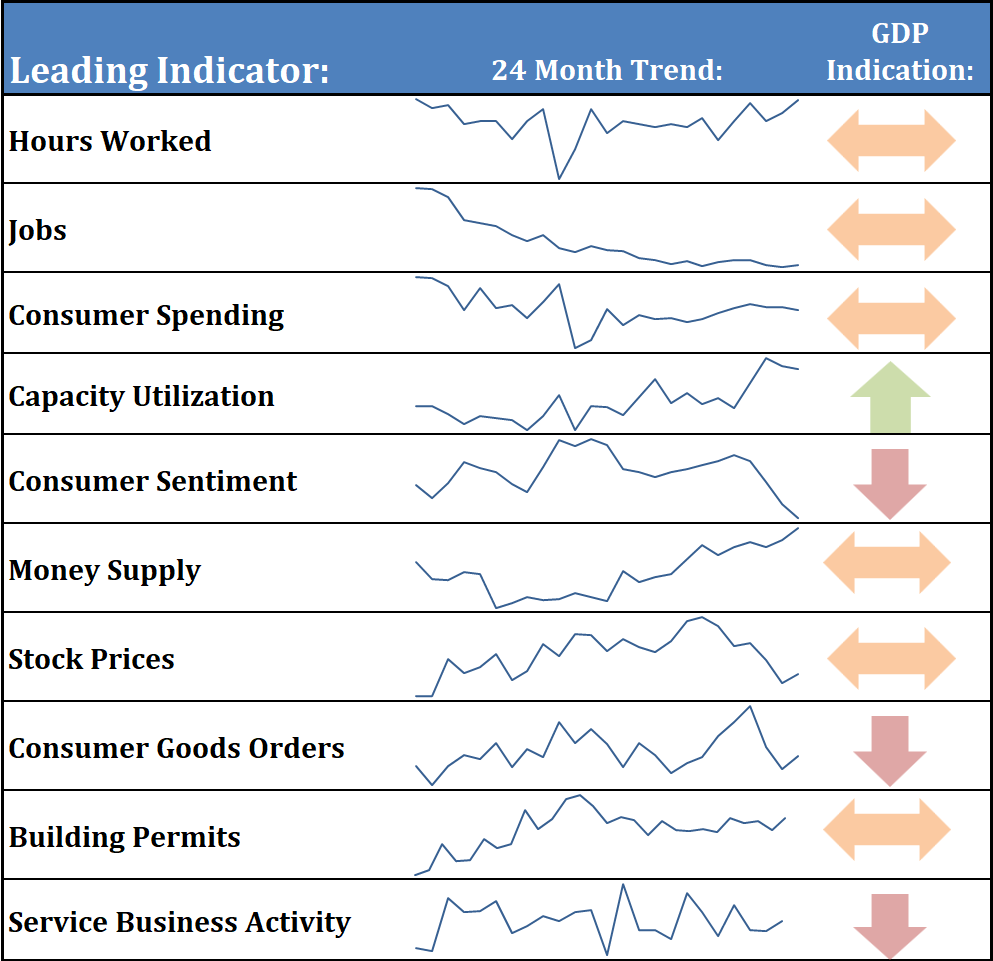
Here's a look at our dashboard, which is very little changed from last month.
What I thought was more interesting was our heatmap, which shows the trend in the indicators.
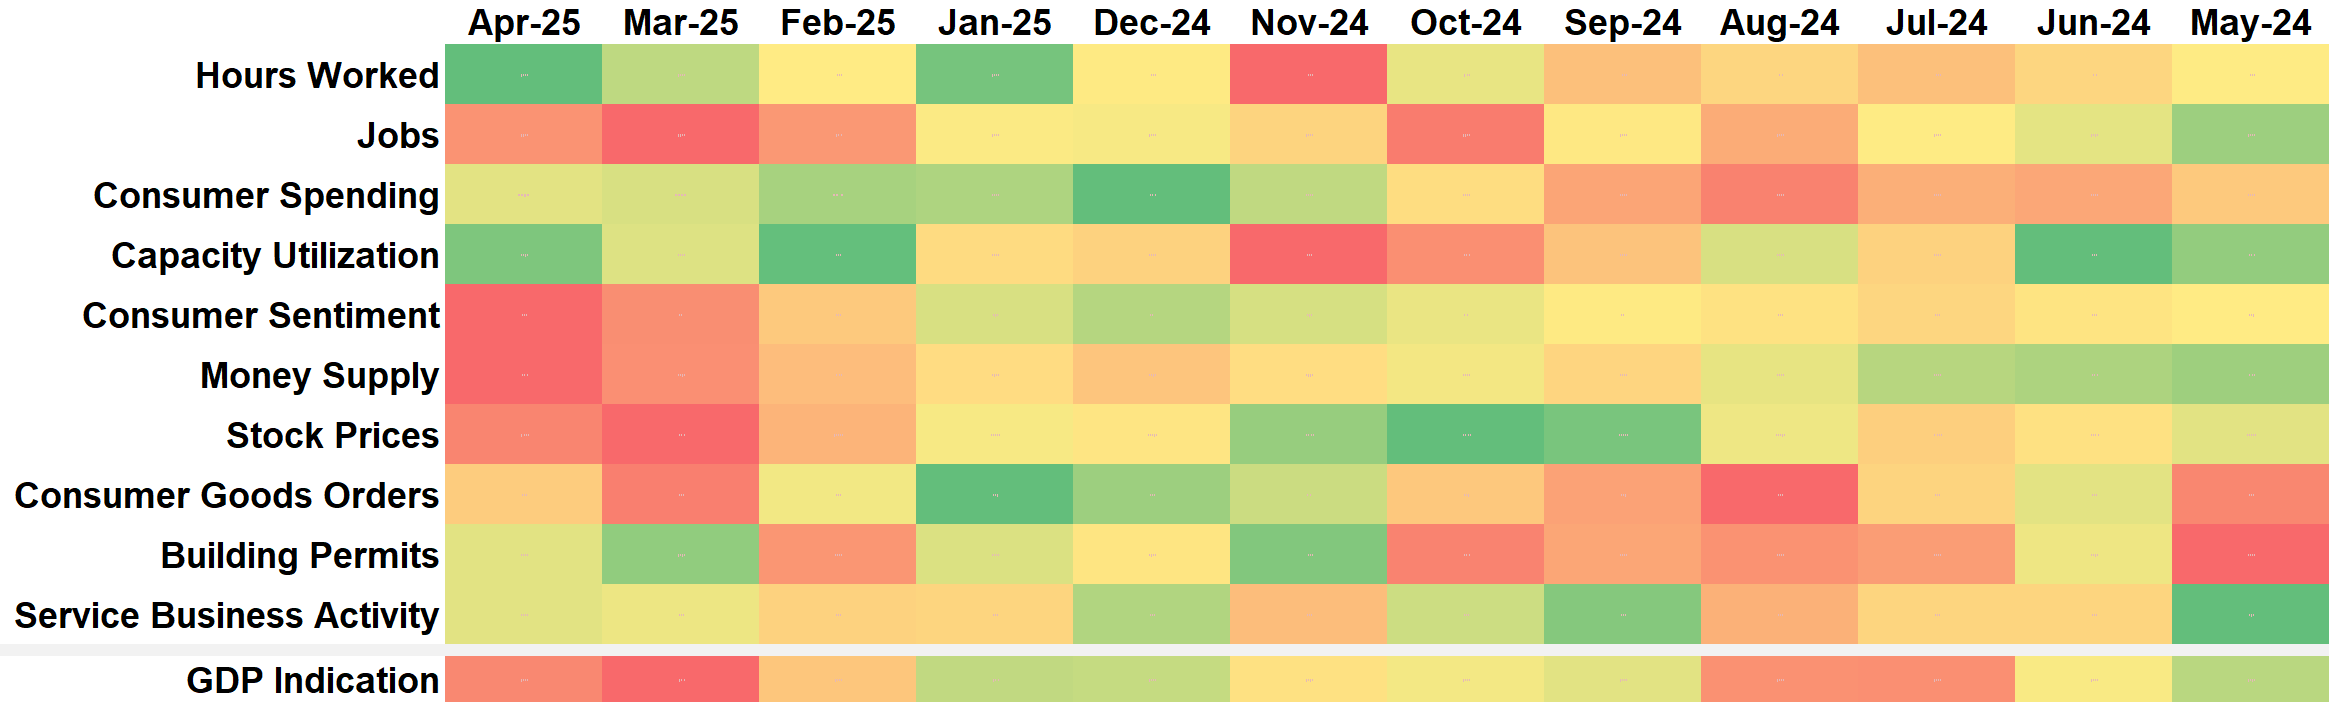
We can break this into a few categories:
Strong Indicators
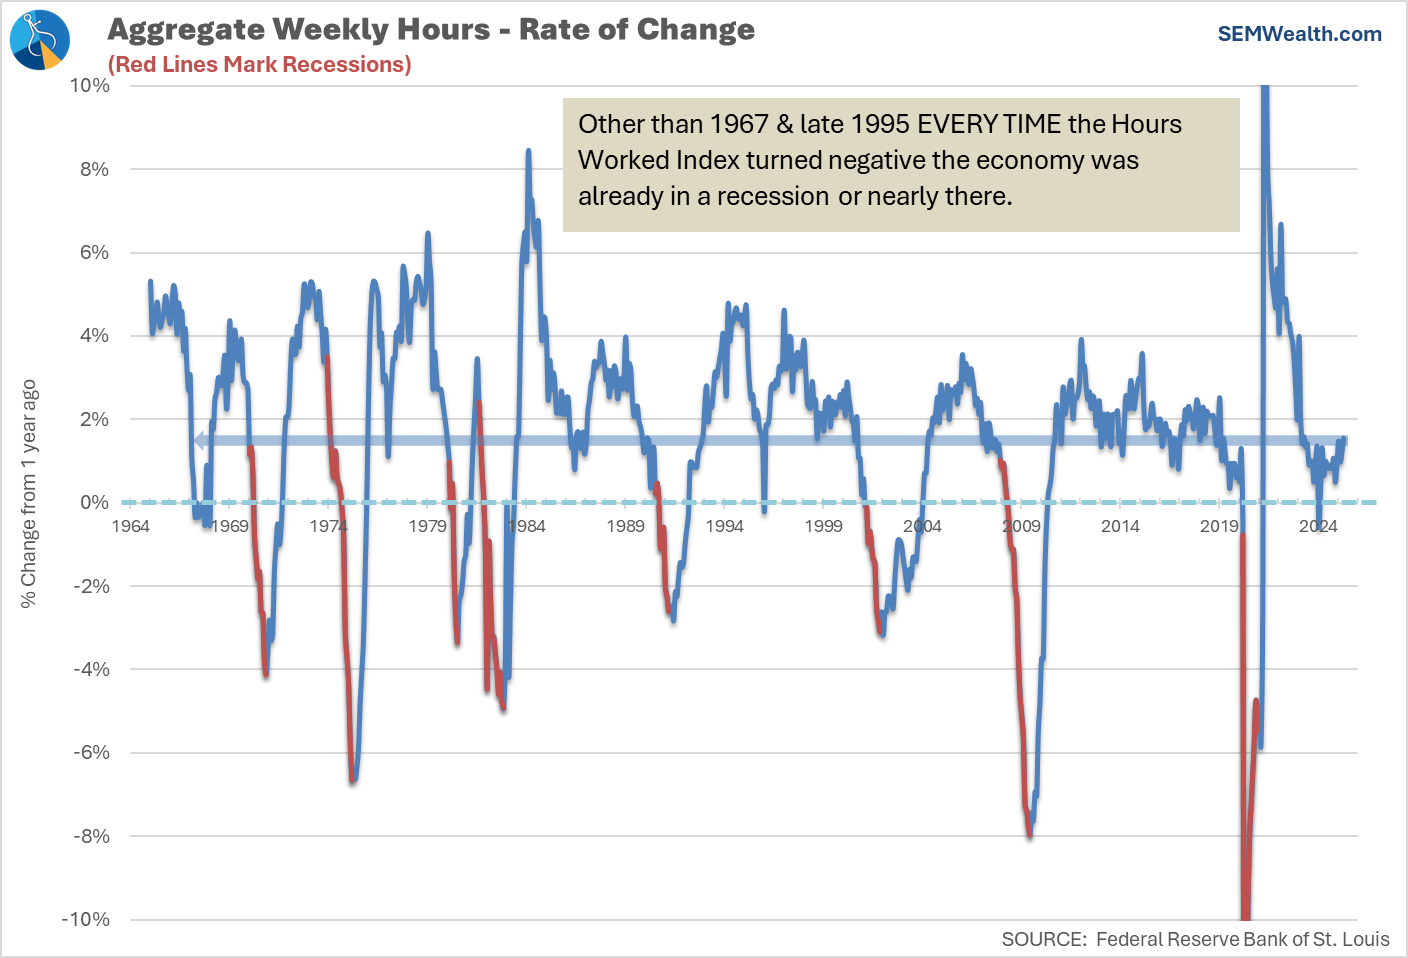
Hours worked is one of our most reliable indicators and it remains impressively strong.
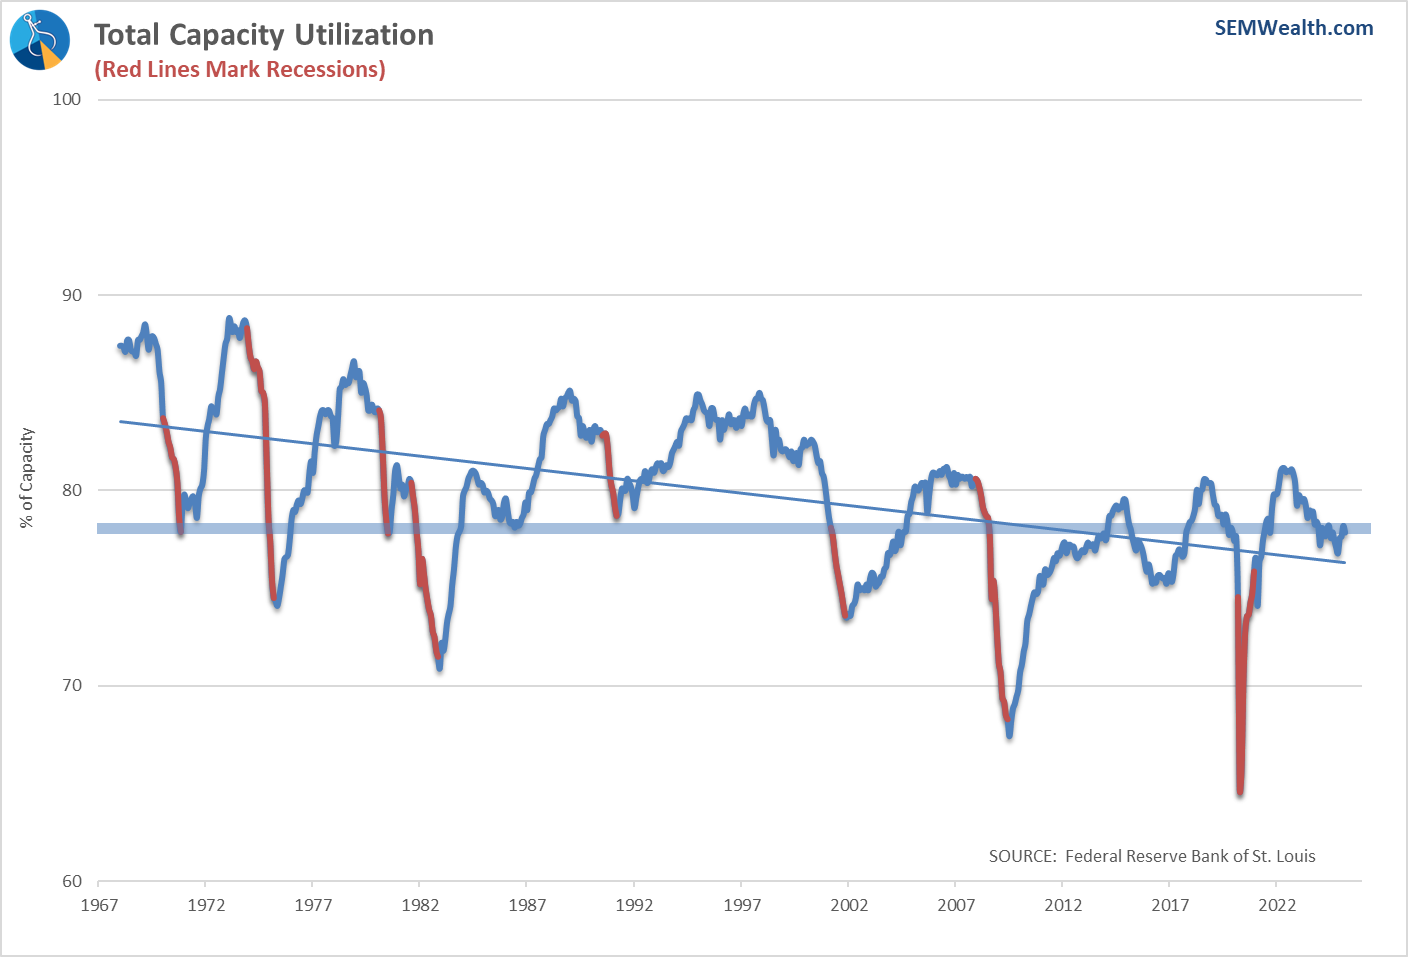
I know it's early in the Trade War, but it is certainly a positive sign we are seeing more of our factory capacity ramping up.
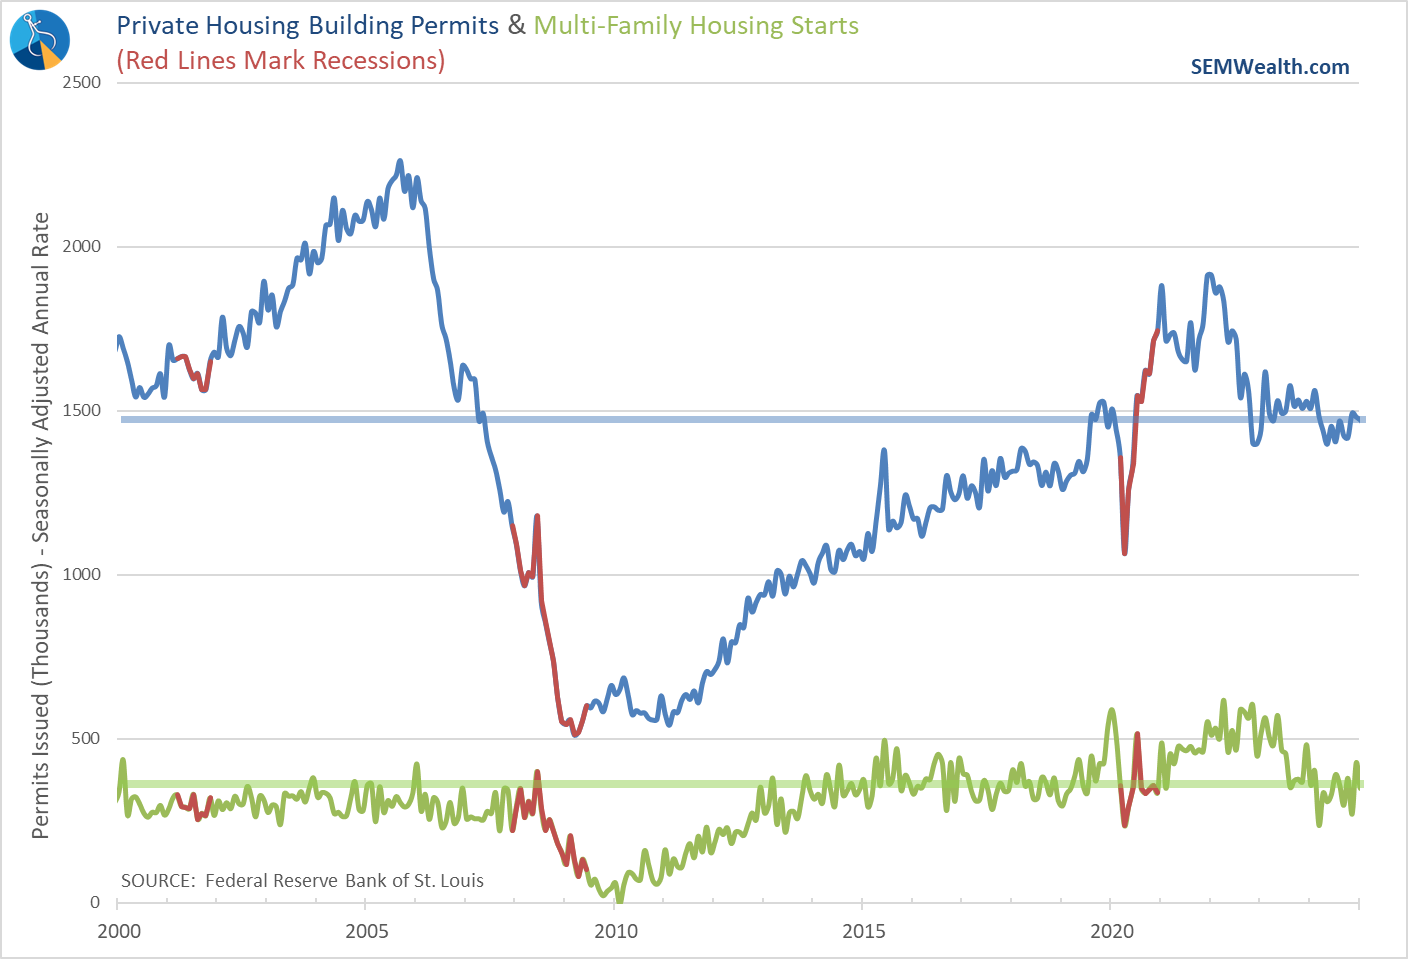
We've also seen building permits and housing starts holding up despite uncertainty and higher interest rates.
Areas to Watch
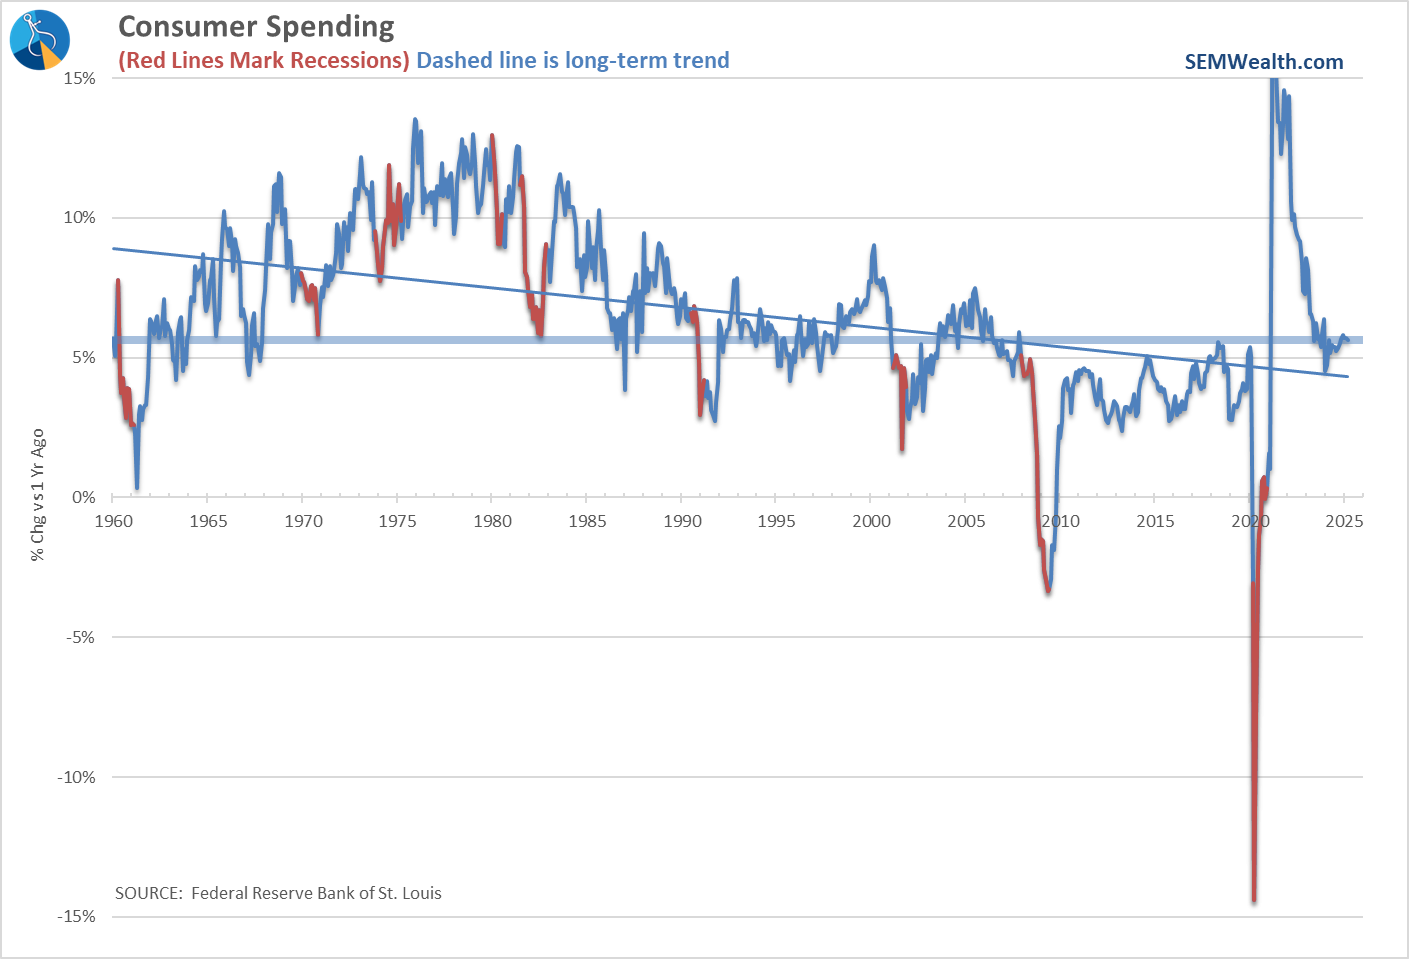
Consumer spending has remained strong, but the momentum appears to be waning.
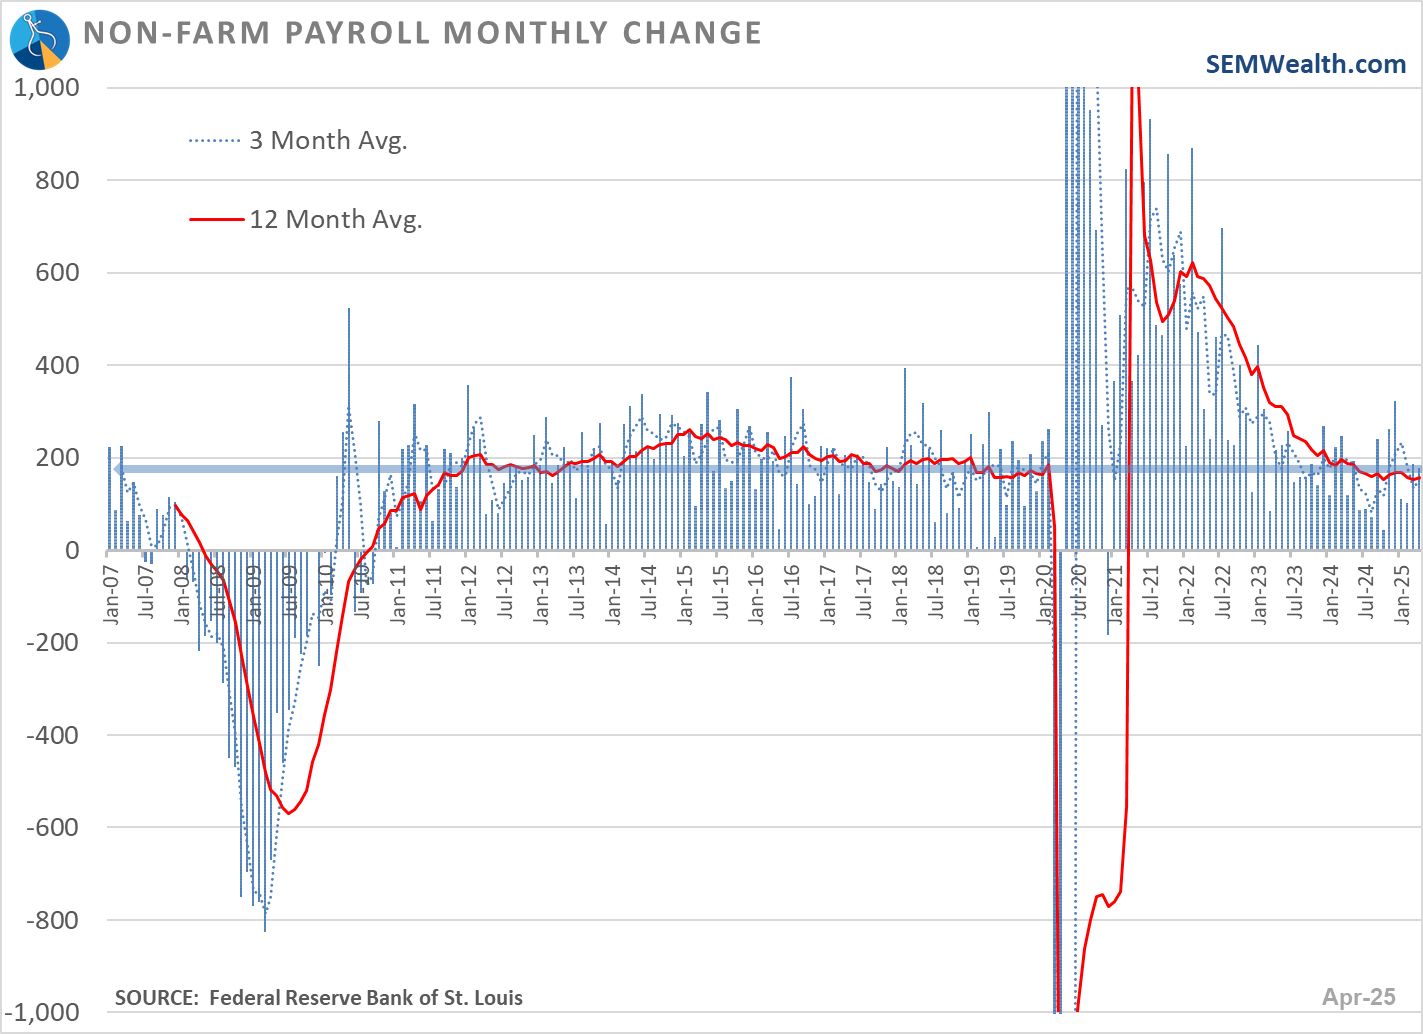
The same can be said about the growth in the number of jobs.
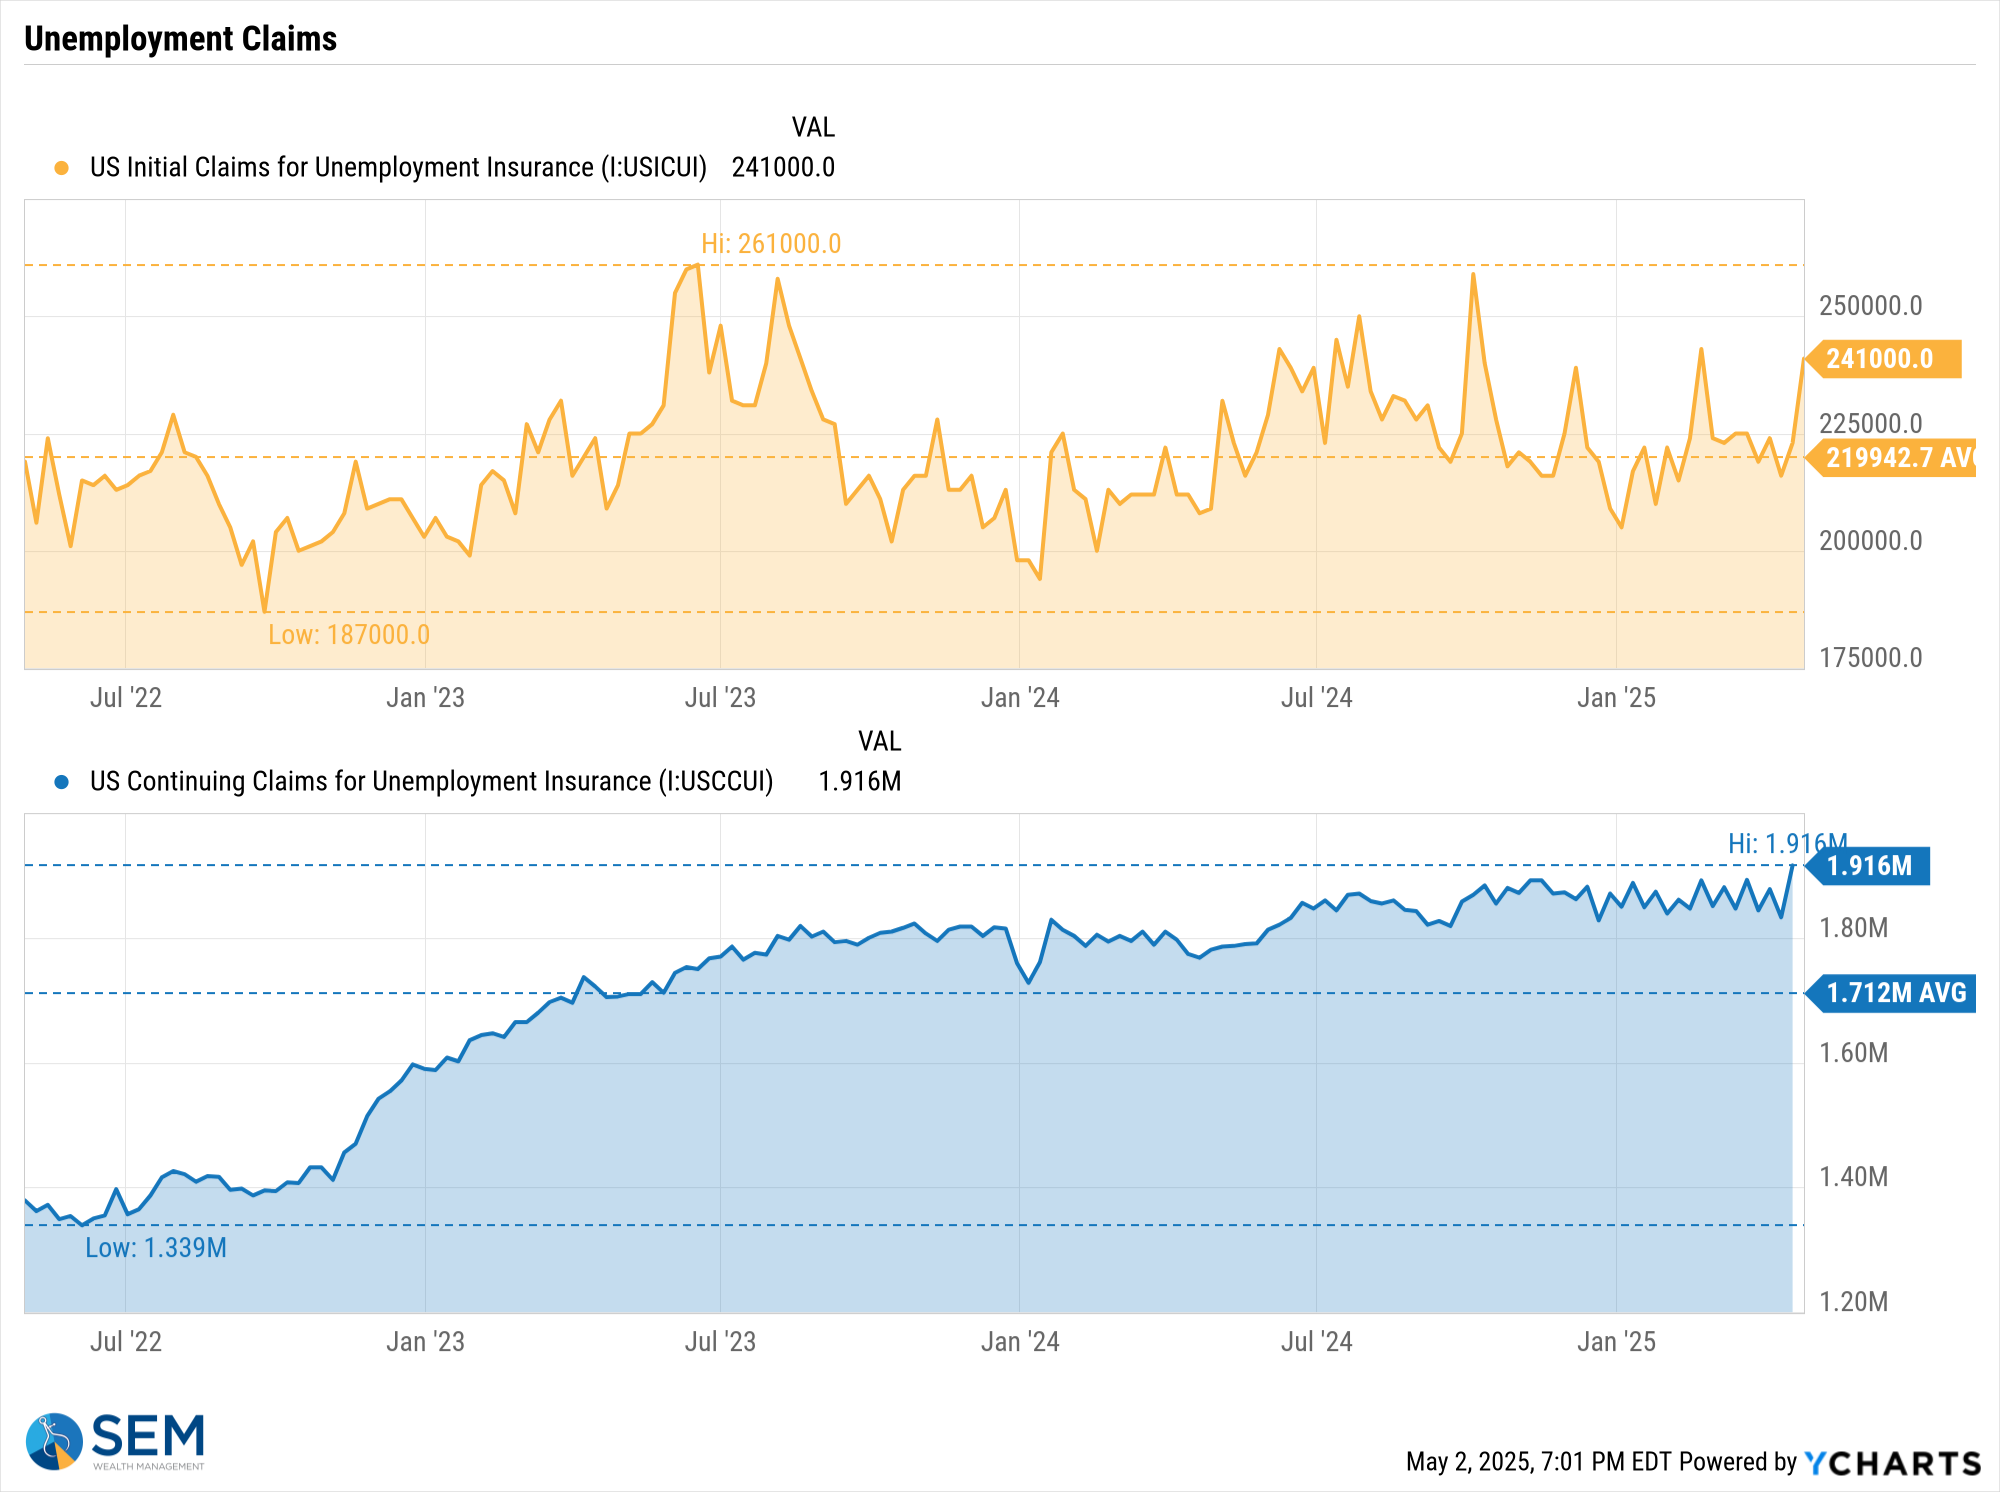
The indicator I'm watching most closely is Jobless Claims. I like this release because it comes out every Thursday using data compiled from the states. This gives us a much more clear picture of early signs of weakness in the labor market. Last week claims spiked a bit, but the weekly data can be noisy. Continuing claims remain a concern as they sit at their recent highs. This is an indication that while we may not be seeing widespread layoffs occurring, if you do lose your job you may have a hard time finding a new one.
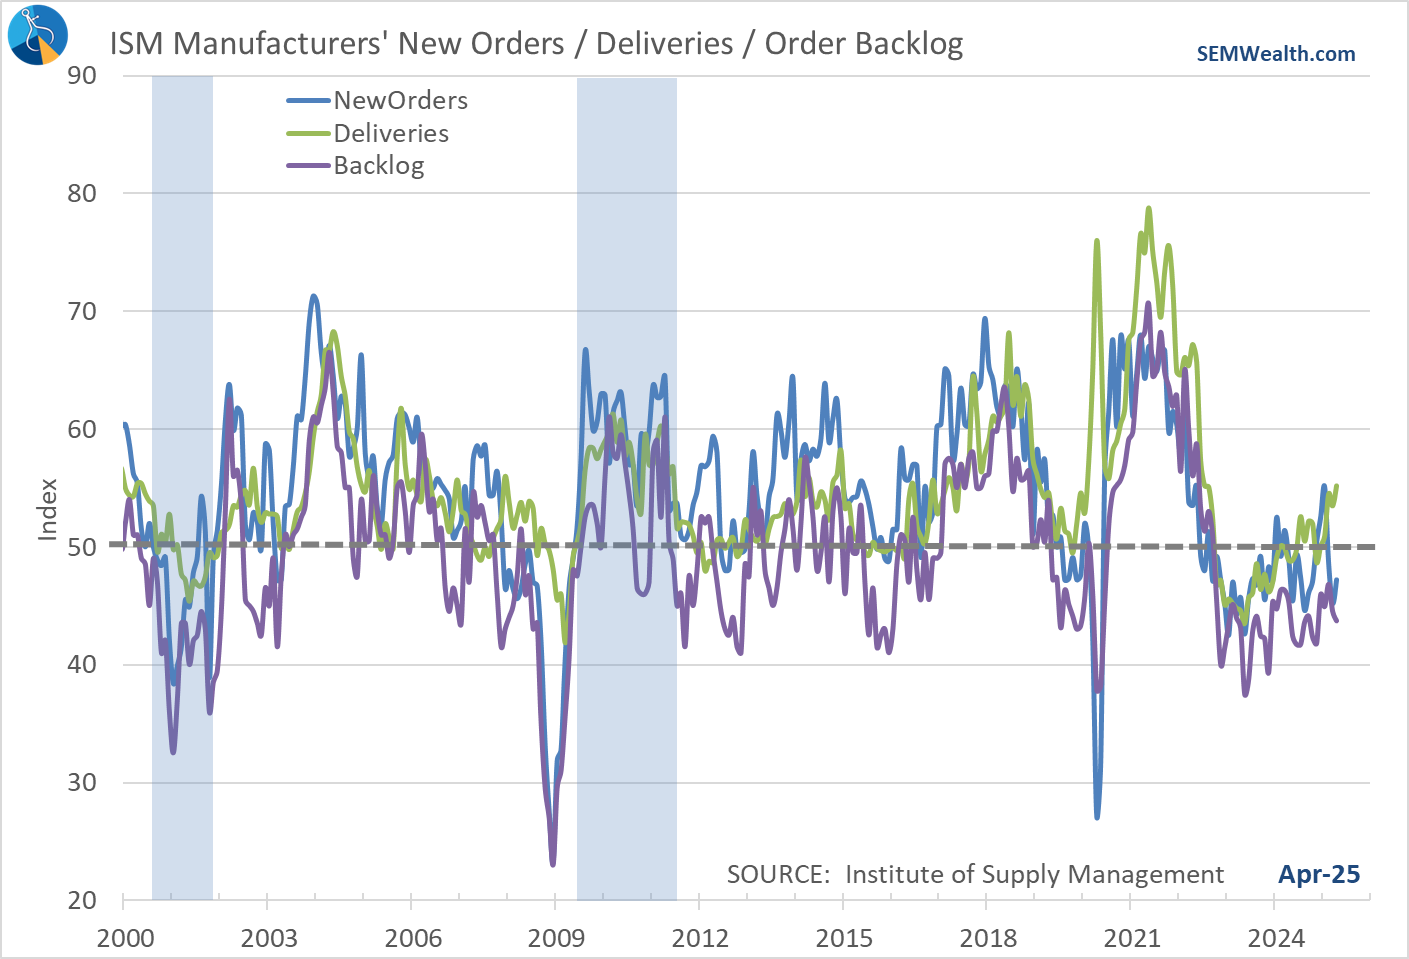
Manufacturing orders are also a bit of a concern with 2 of the 3 indicators in "contraction" territory:
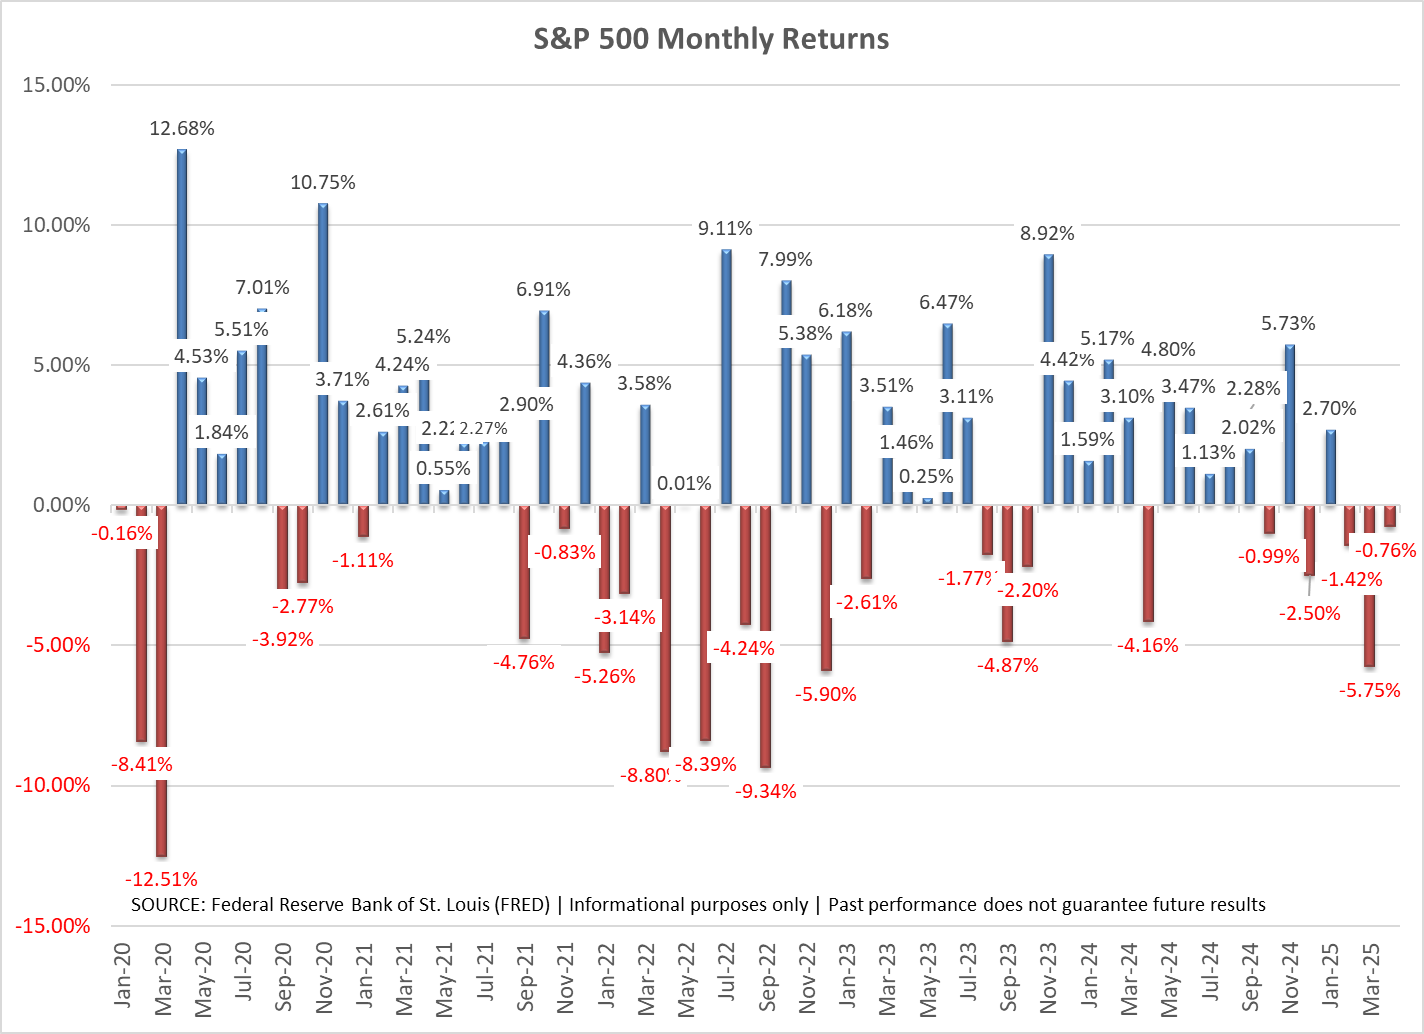
Stock prices are also a useful indicator as the direction of stocks is typically based on the perceived direction in earnings. April was the 3rd consecutive down month and 5th of the last 7. While earnings estimates have not officially come down, clearly there is some concern that this may be happening.
Worrisome Indicators
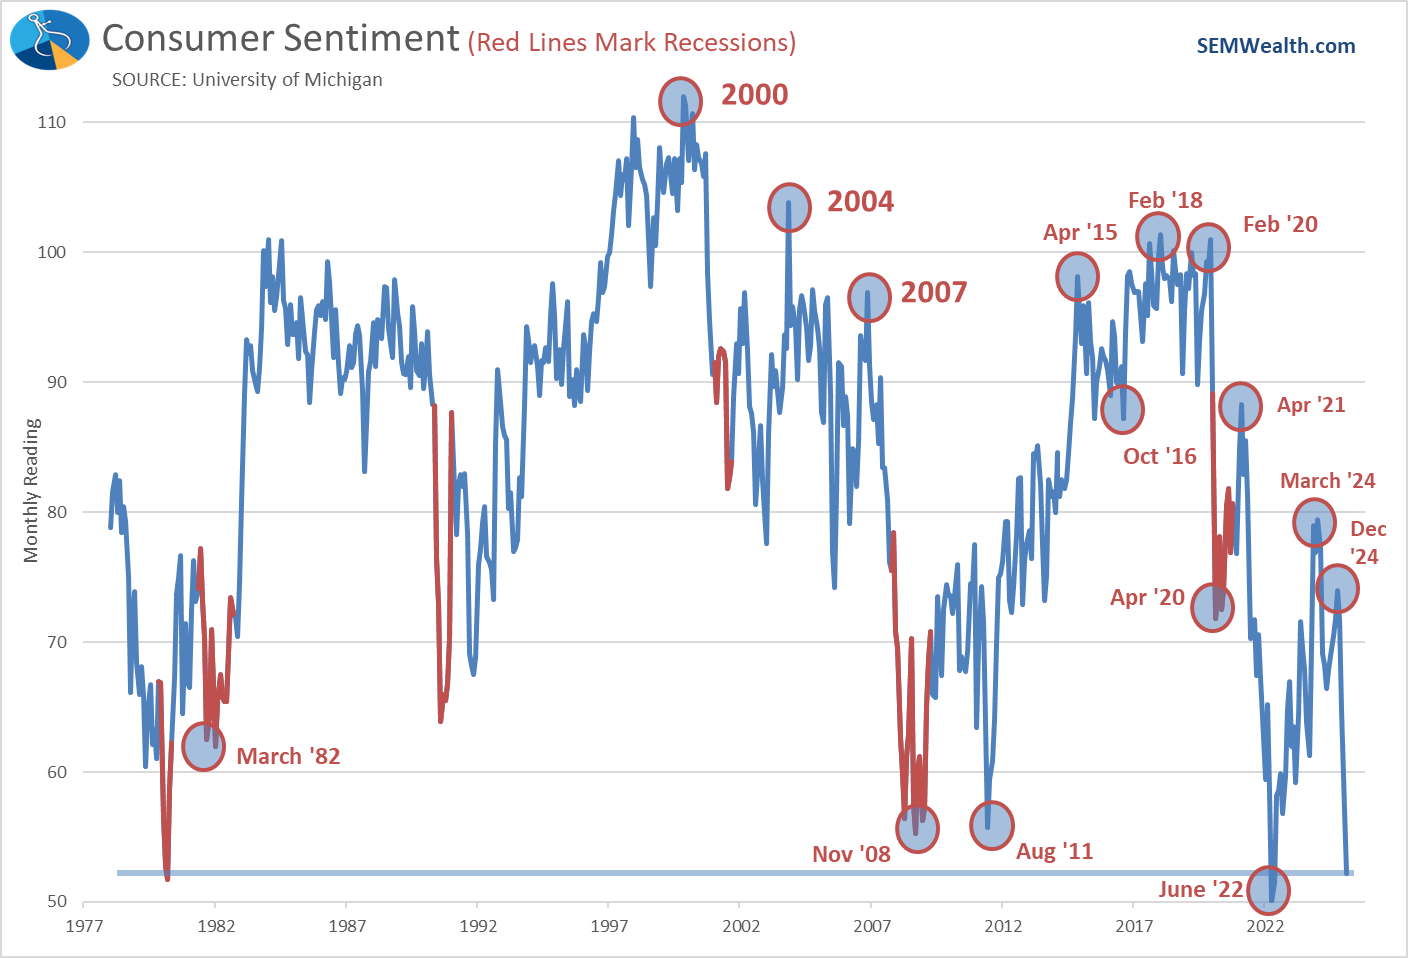
Consumers have not felt worse about the economy since June 2022 when inflation was approaching 10%. The only other time they have felt worse was back in 1980. We've not seen this yet show up in the "hard" data, but it is something that could be signs of problems ahead.
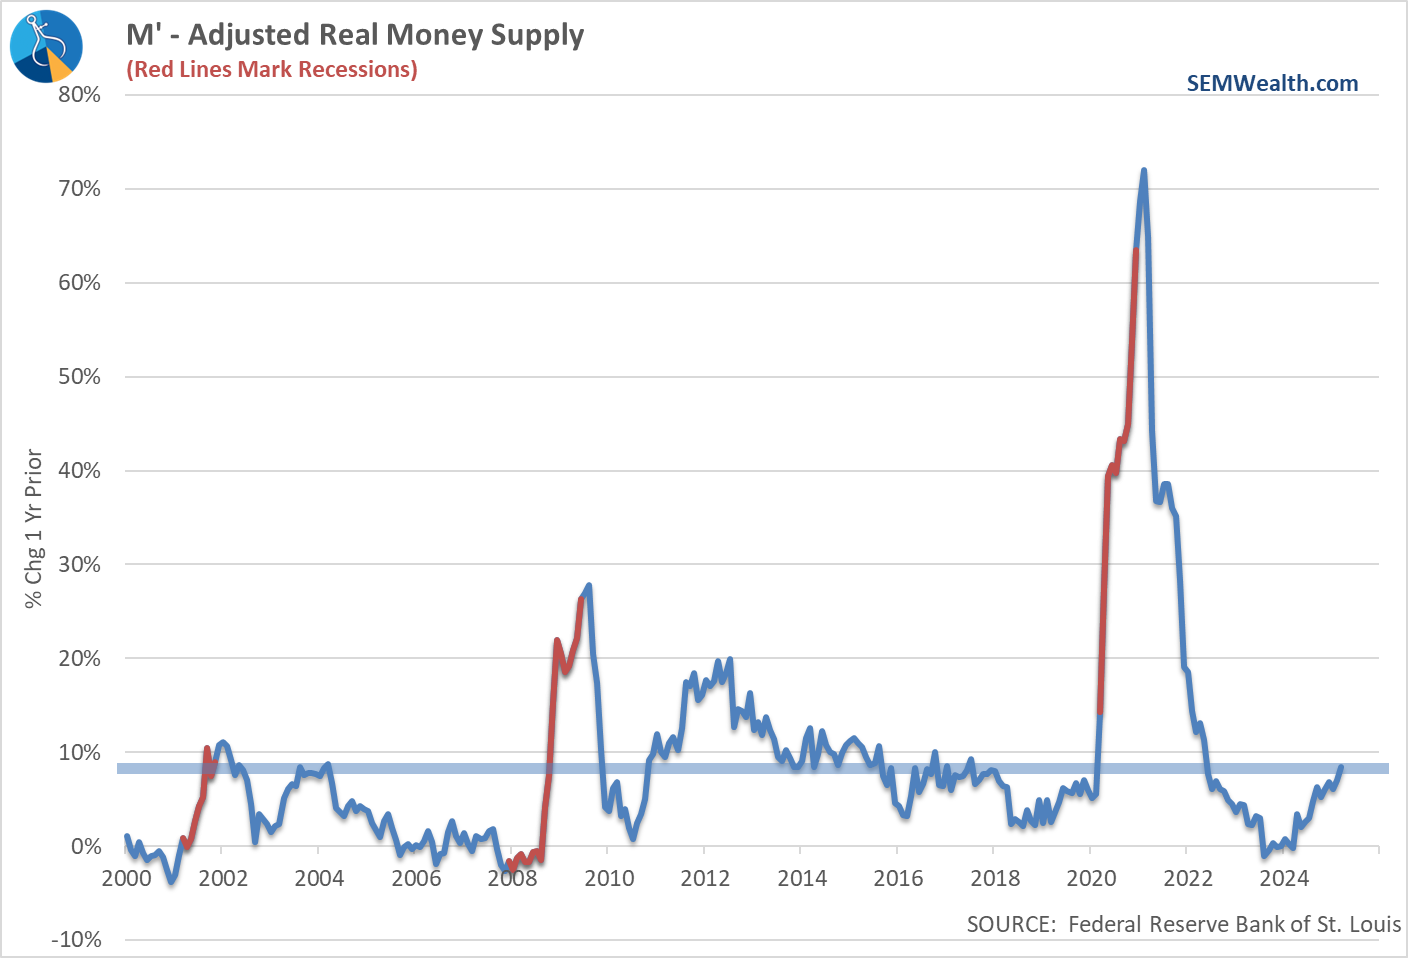
Despite the President constantly criticizing the Fed and demanding interest rates be lowered, the Fed has been easing policy. They've been increasing the money supply at a rapid rate, which is usually signs the Fed sees some problems in the financial system beneath the surface.
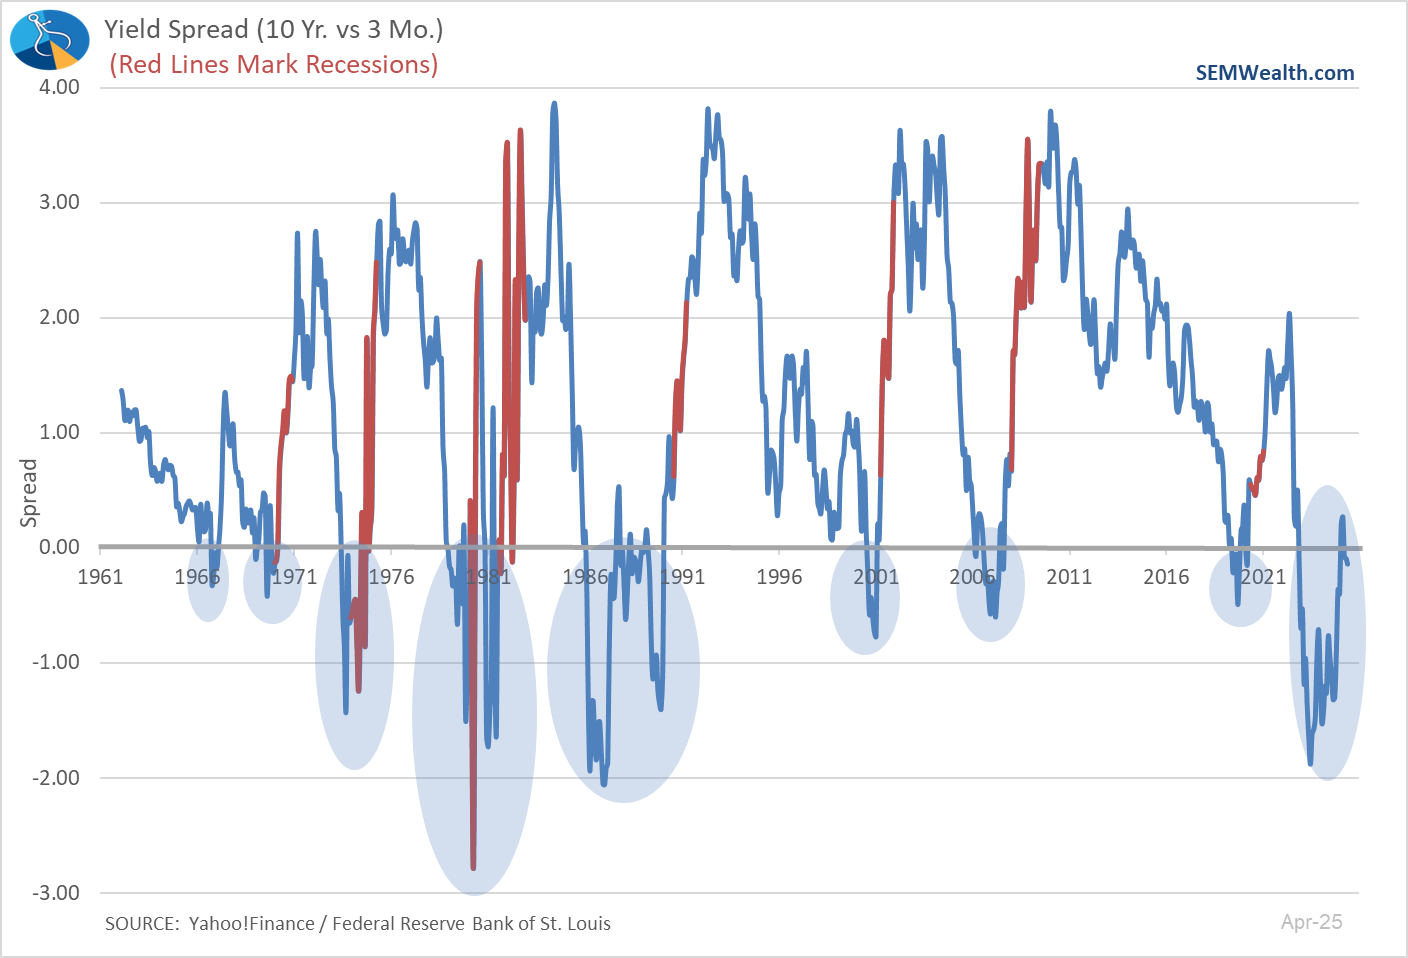
We've also seen the bond market again show signs of concern, with the yield curve again inverting, like it did ahead of the 2020 recession and the 2 consecutive quarters of negative GDP in 2022.
It's not a Recession!
The first quarter official GDP report showed a decline in the economy. This was before the "Liberation Day" tariffs were announced. This has led to many predicting a 2nd consecutive quarter of negative GDP. What this means is 3 months from now some people will likely be arguing that we are in a recession. We saw the same thing happen in 2022. I thought I'd ask my "fancy Google" app, Chat GPT to define a recession. And this is what it said:
A recession in the U.S. is generally defined as a significant decline in economic activity that spreads across the economy and lasts more than a few months. This decline is typically visible in real GDP, real income, employment, industrial production, and retail sales.
Two Common Definitions:
- Traditional (NBER) Definition:
- The NBER considers a range of indicators and does not rely solely on GDP.
- They date recessions after they begin, often retroactively.
- Rule-of-Thumb Definition:
- Two consecutive quarters of declining real GDP.
- This is a simplified shorthand often used in media and by market participants, but not the official definition.
The National Bureau of Economic Research (NBER), the official arbiter in the U.S., defines a recession as:
“A significant decline in economic activity that is spread across the economy and lasts more than a few months.”
Source: ChatGPT 4o
I found the "rule of thumb" interesting because it even said "used in media and by market participants". My prediction:
The media outlets and people who screamed "recession" in 2022 will suddenly be explaining that just because we had 2 consecutive quarters of negative GDP it doesn't mean we are in a recession, because employment, spending, and productivity remain strong. The people who said this exact same thing in 2022, will suddenly be redefining a recession as 2 consecutive quarters of negative GDP.
You've been warned.
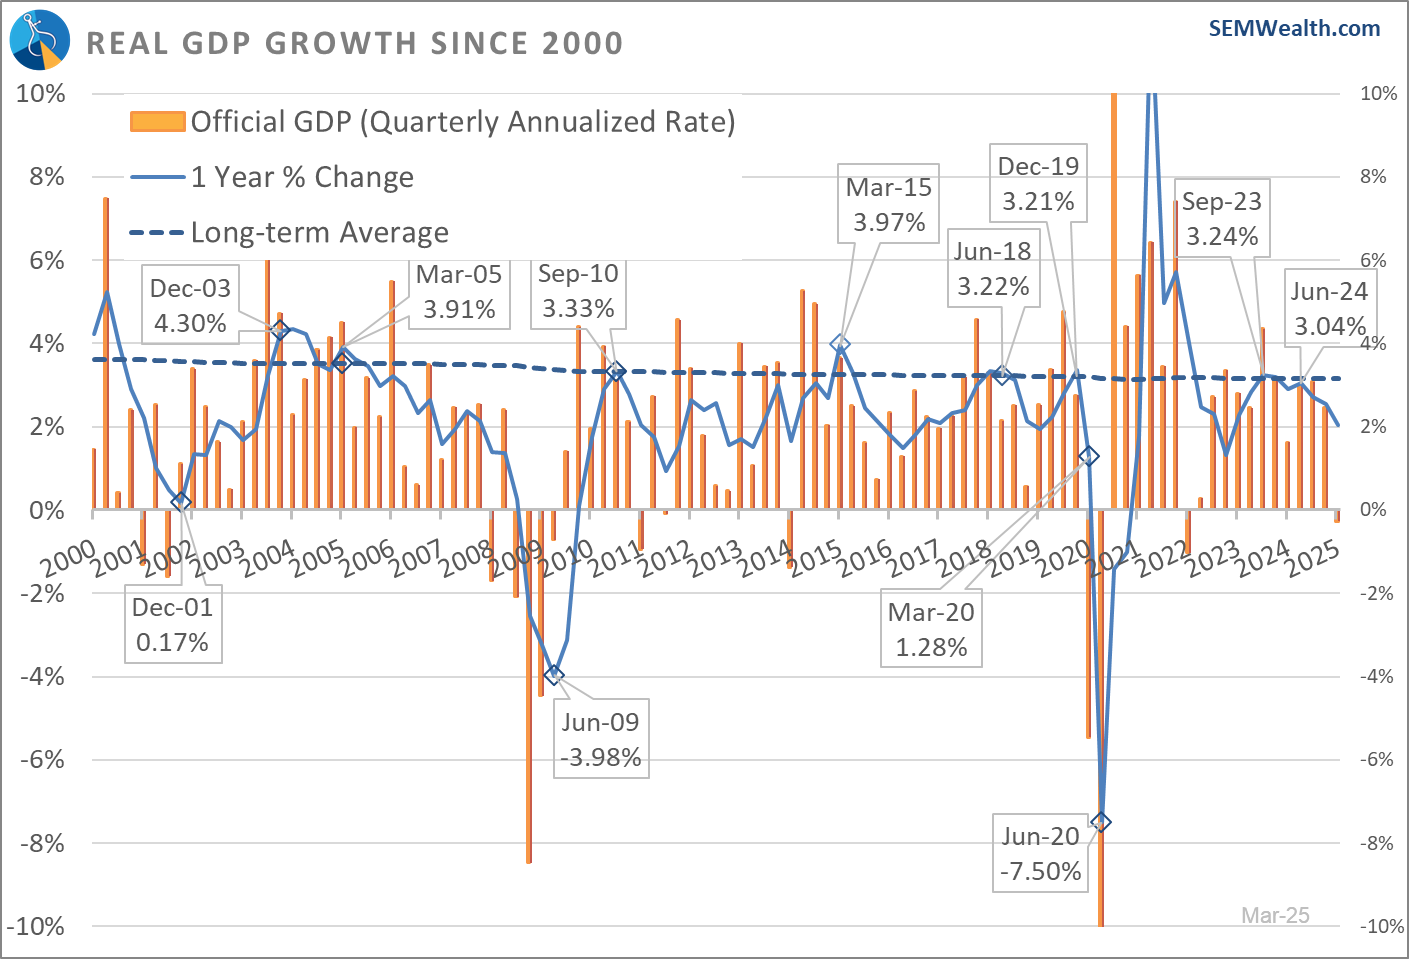
At SEM, we use the actual 12 month change in GDP as a more reliable indicator. That number shows GDP at 2%, which is below the long-term average of 3% and a significant slowing since the peak in September 2023, but not a recession. The 12 month number will typically be lower during a recession and will be matched with a LOSS in jobs, a decline in personal income, and a drop in spending.
Our model remains neutral through April. It may switch to bearish in May if the April data weakens much more.

Sell in May?
It seems to be an annual tradition when the calendar turns to May — we hear people start suggesting it may be a good time to implement the old adage of "sell in May and go away". I won't go into the reason this used to be a good idea and why it still occasionally works. What I will do is what I've done every year – provide the data which shows why it is sometimes a good idea and sometimes a terrible idea.
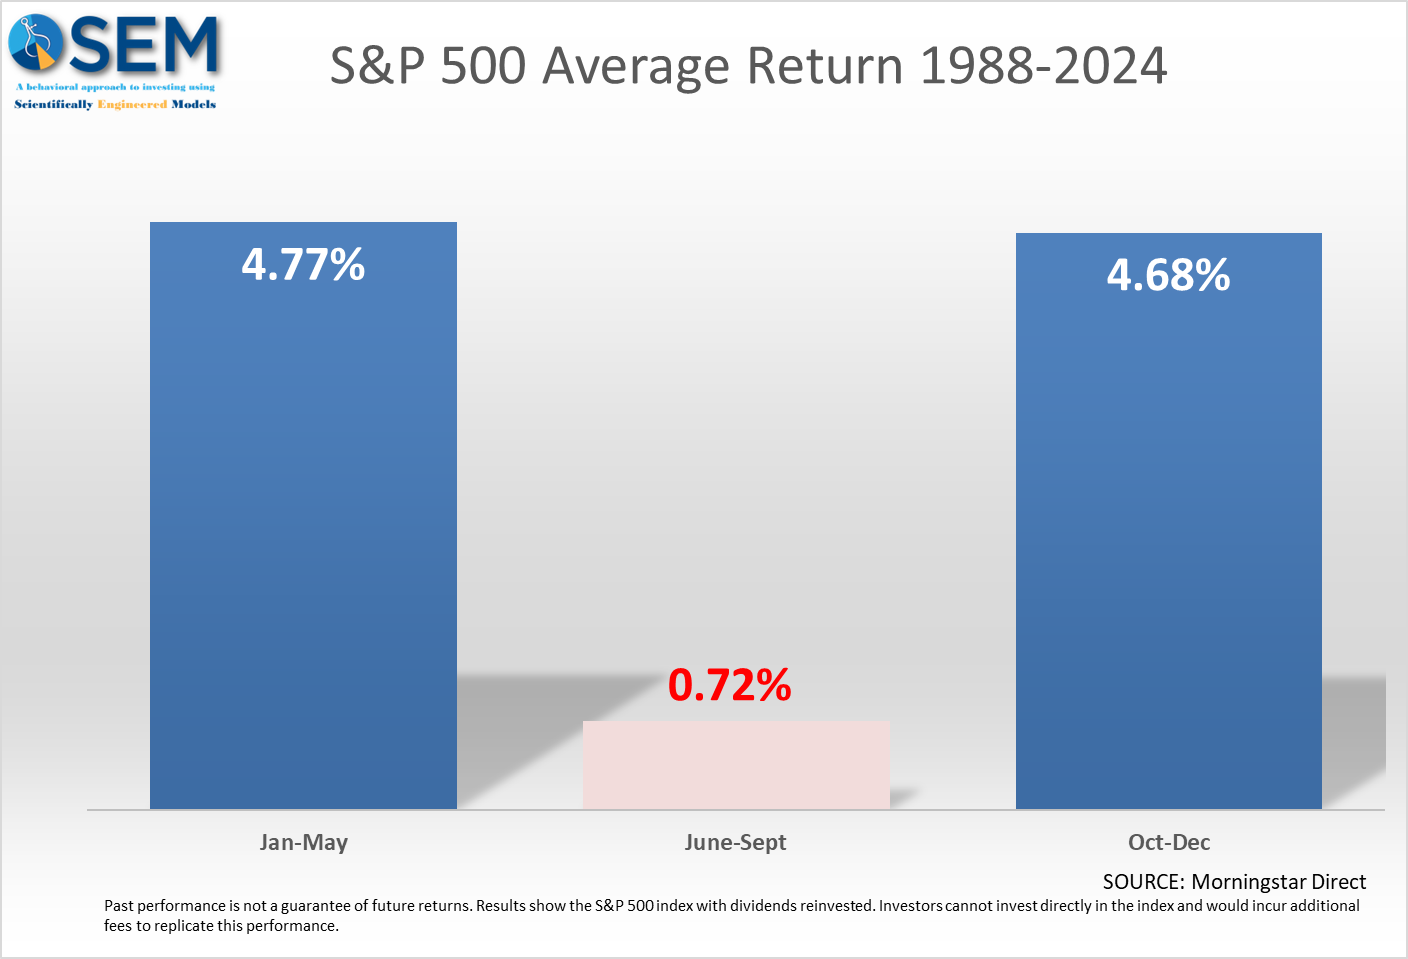
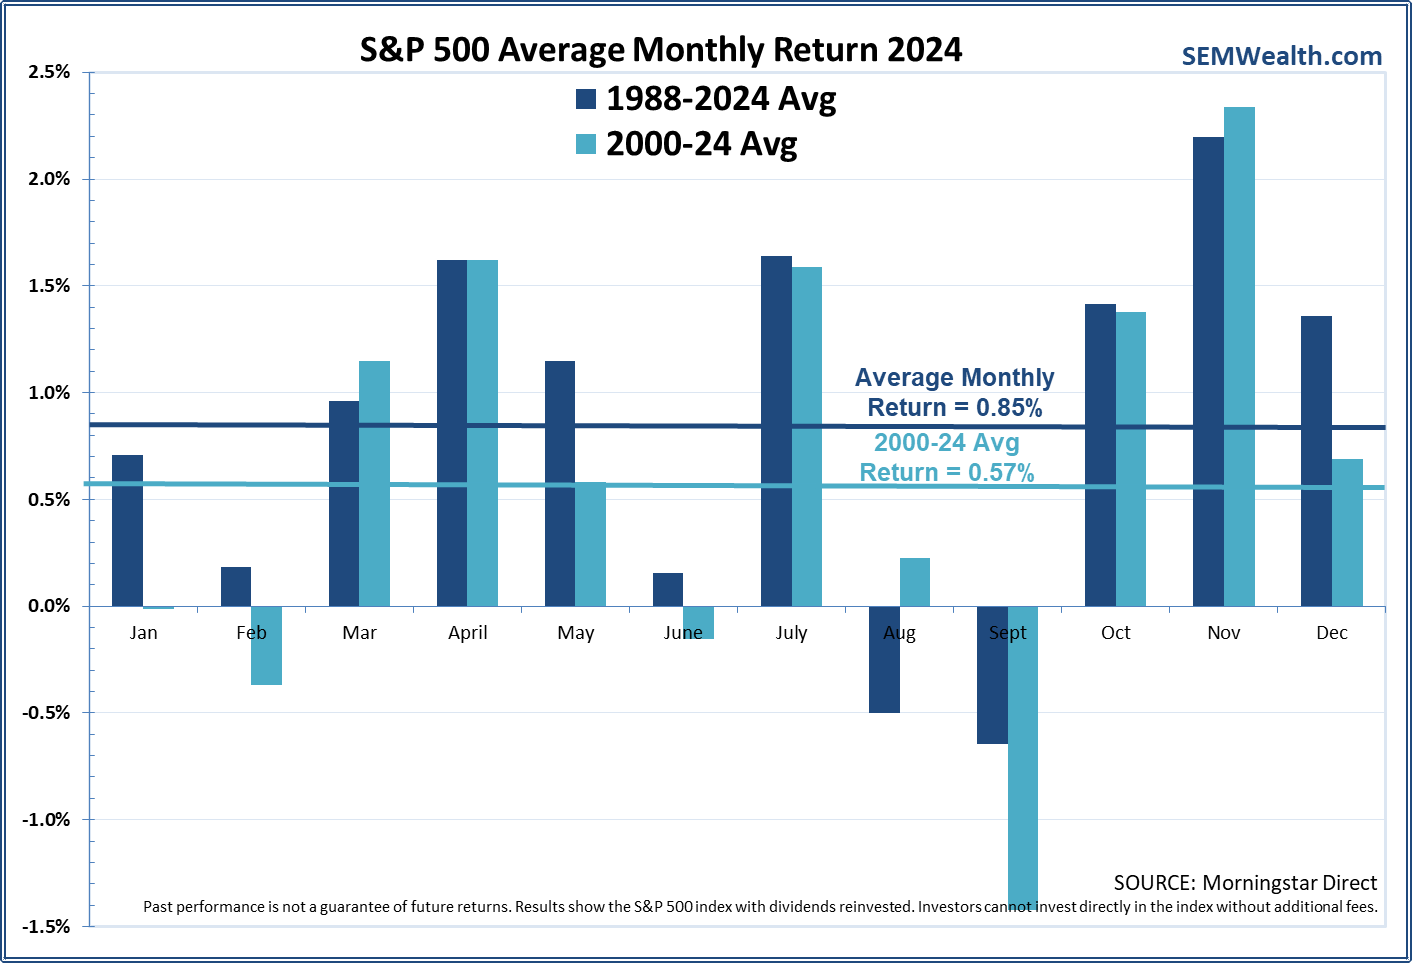
First off, I am not sure why this starts being discussed at the beginning of May as May tends to be a fairly positive month overall. I've always suggested if you wanted to follow this strategy you would wait until the end of May. Here is the combined data behind that strategy. Obviously if you could sit out the "flat" times in the market and only be invested during the "good" times, it sounds great.
In terms of being positive, the summer months also tend to be "below" average although January and February are also typically less likely to be positive than the other months.
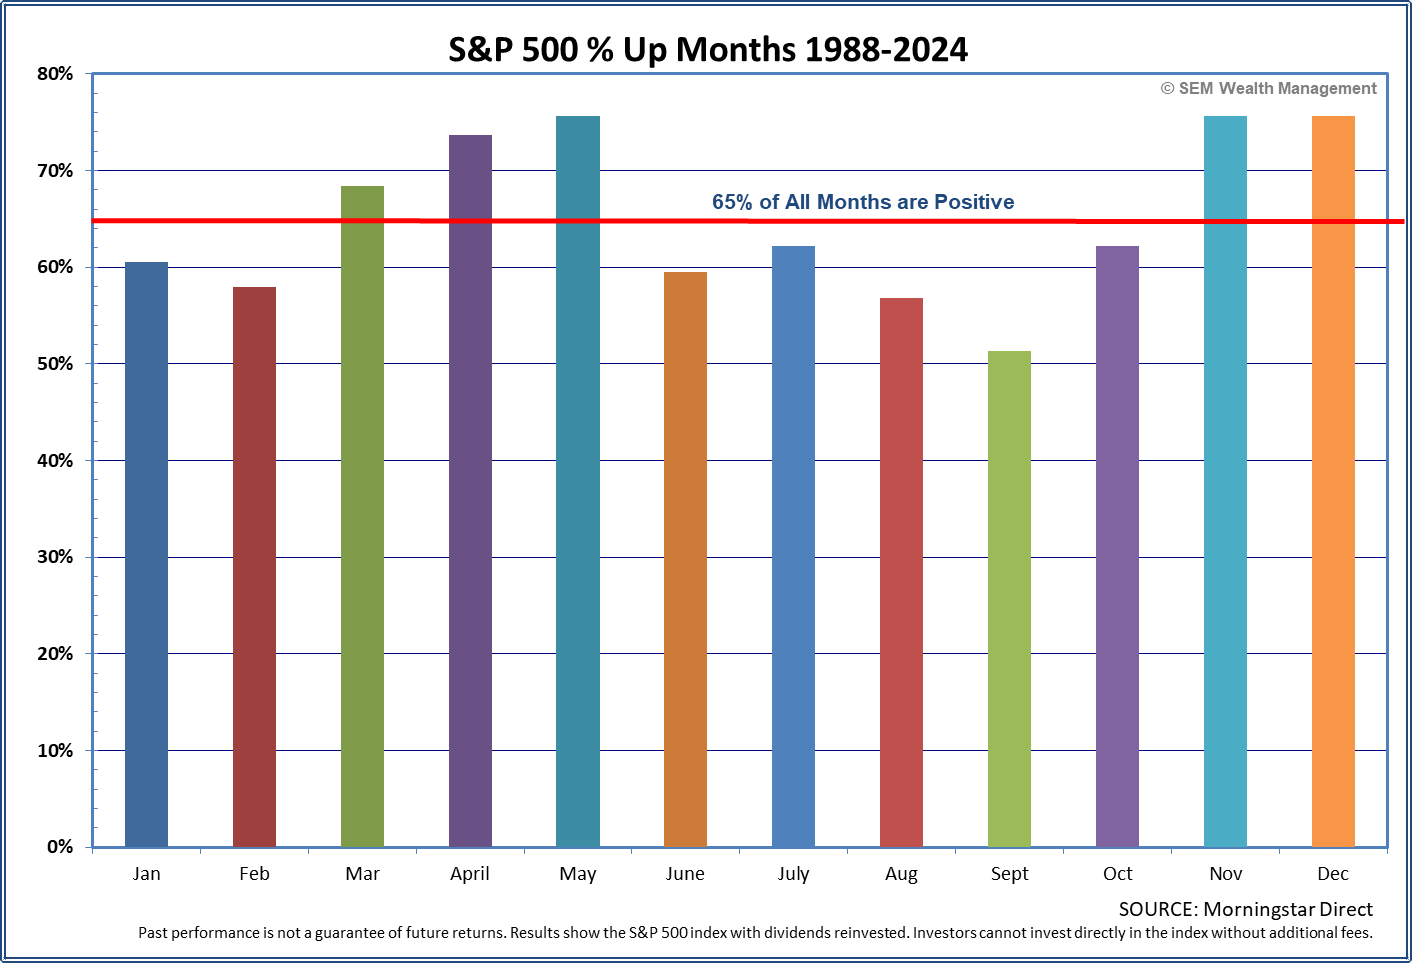
However, when you look at the monthly numbers you see a couple of things – first, the long-term data has not held up the last 25 years. Secondly, July tends to be a month where very strong returns may occur, so if you followed the "sell in May" strategy, you'd miss what could be a great month.
Before you start following a "sell at the end of May, buy back at the beginning of July, sell at the end of July, and buy back in October" strategy (based on the data above), take a look at the "bad" months the "sell in May" strategy is trying to avoid. As you can see 2016-2021 all saw positive returns.
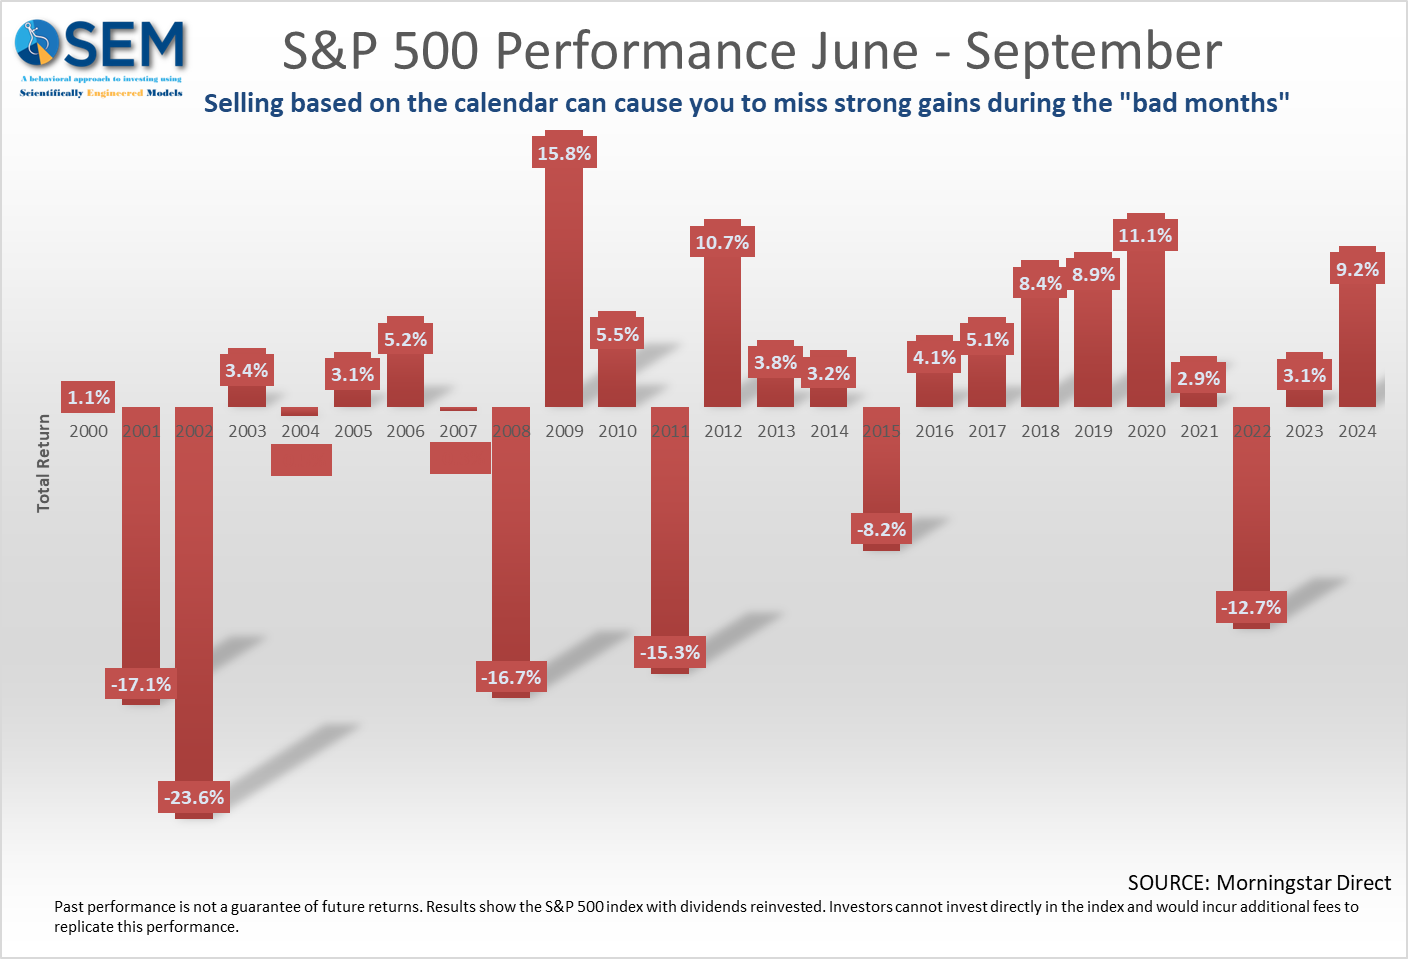
SEM does not follow any calendar or seasonal strategies such as "sell in May". We've found that those ideas typically get "arbitraged" out of the market as more and more people attempt to get ahead of other traders to take advantage of it.
Market Charts
The S&P 500 has been up 9 straight days since the President backed off his threat to fire Fed Chair Jerome Powell and also suggested deals were being made with many of our trading partners including China. No deals have been announced, but the lack of anything negative has unleashed the impressive rally.
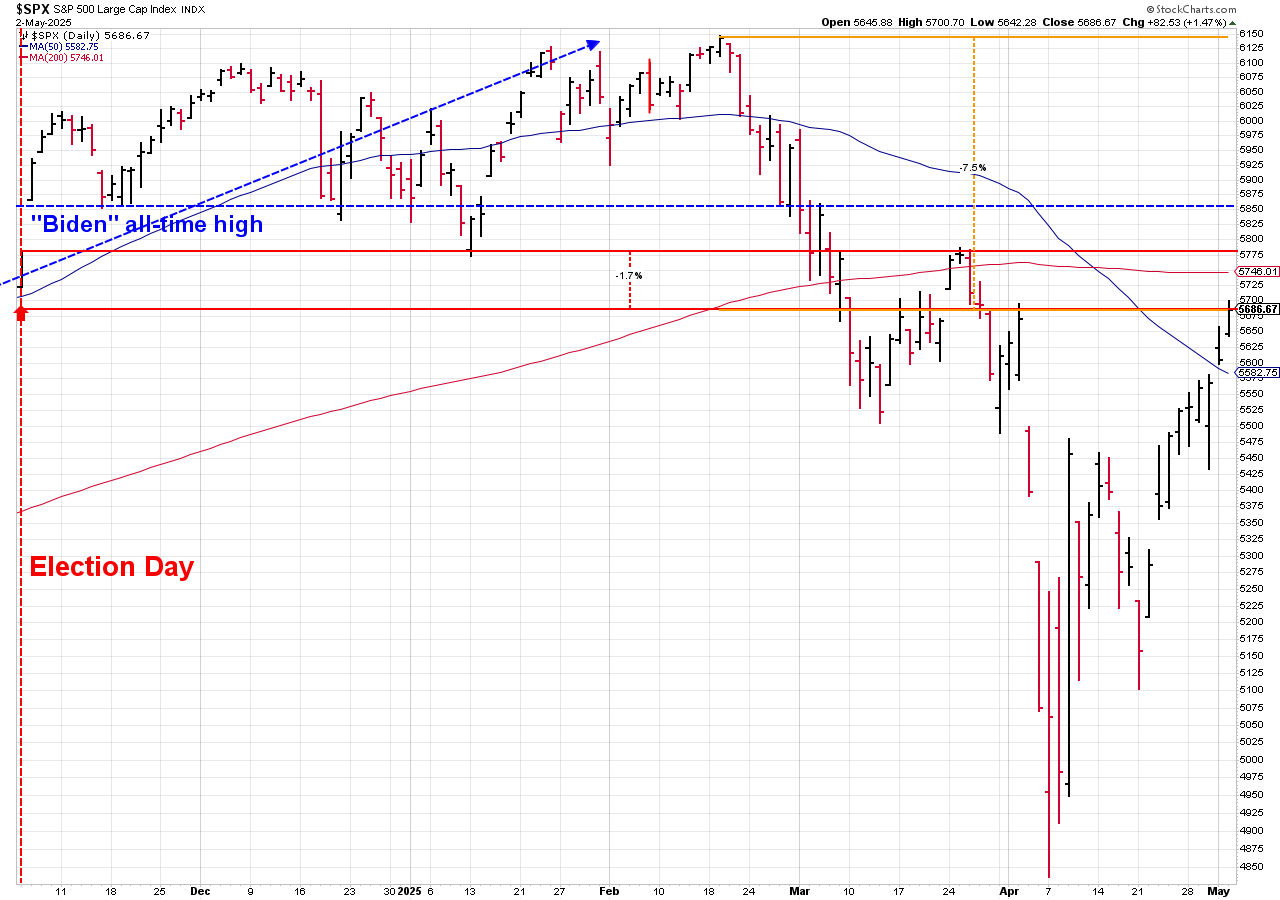
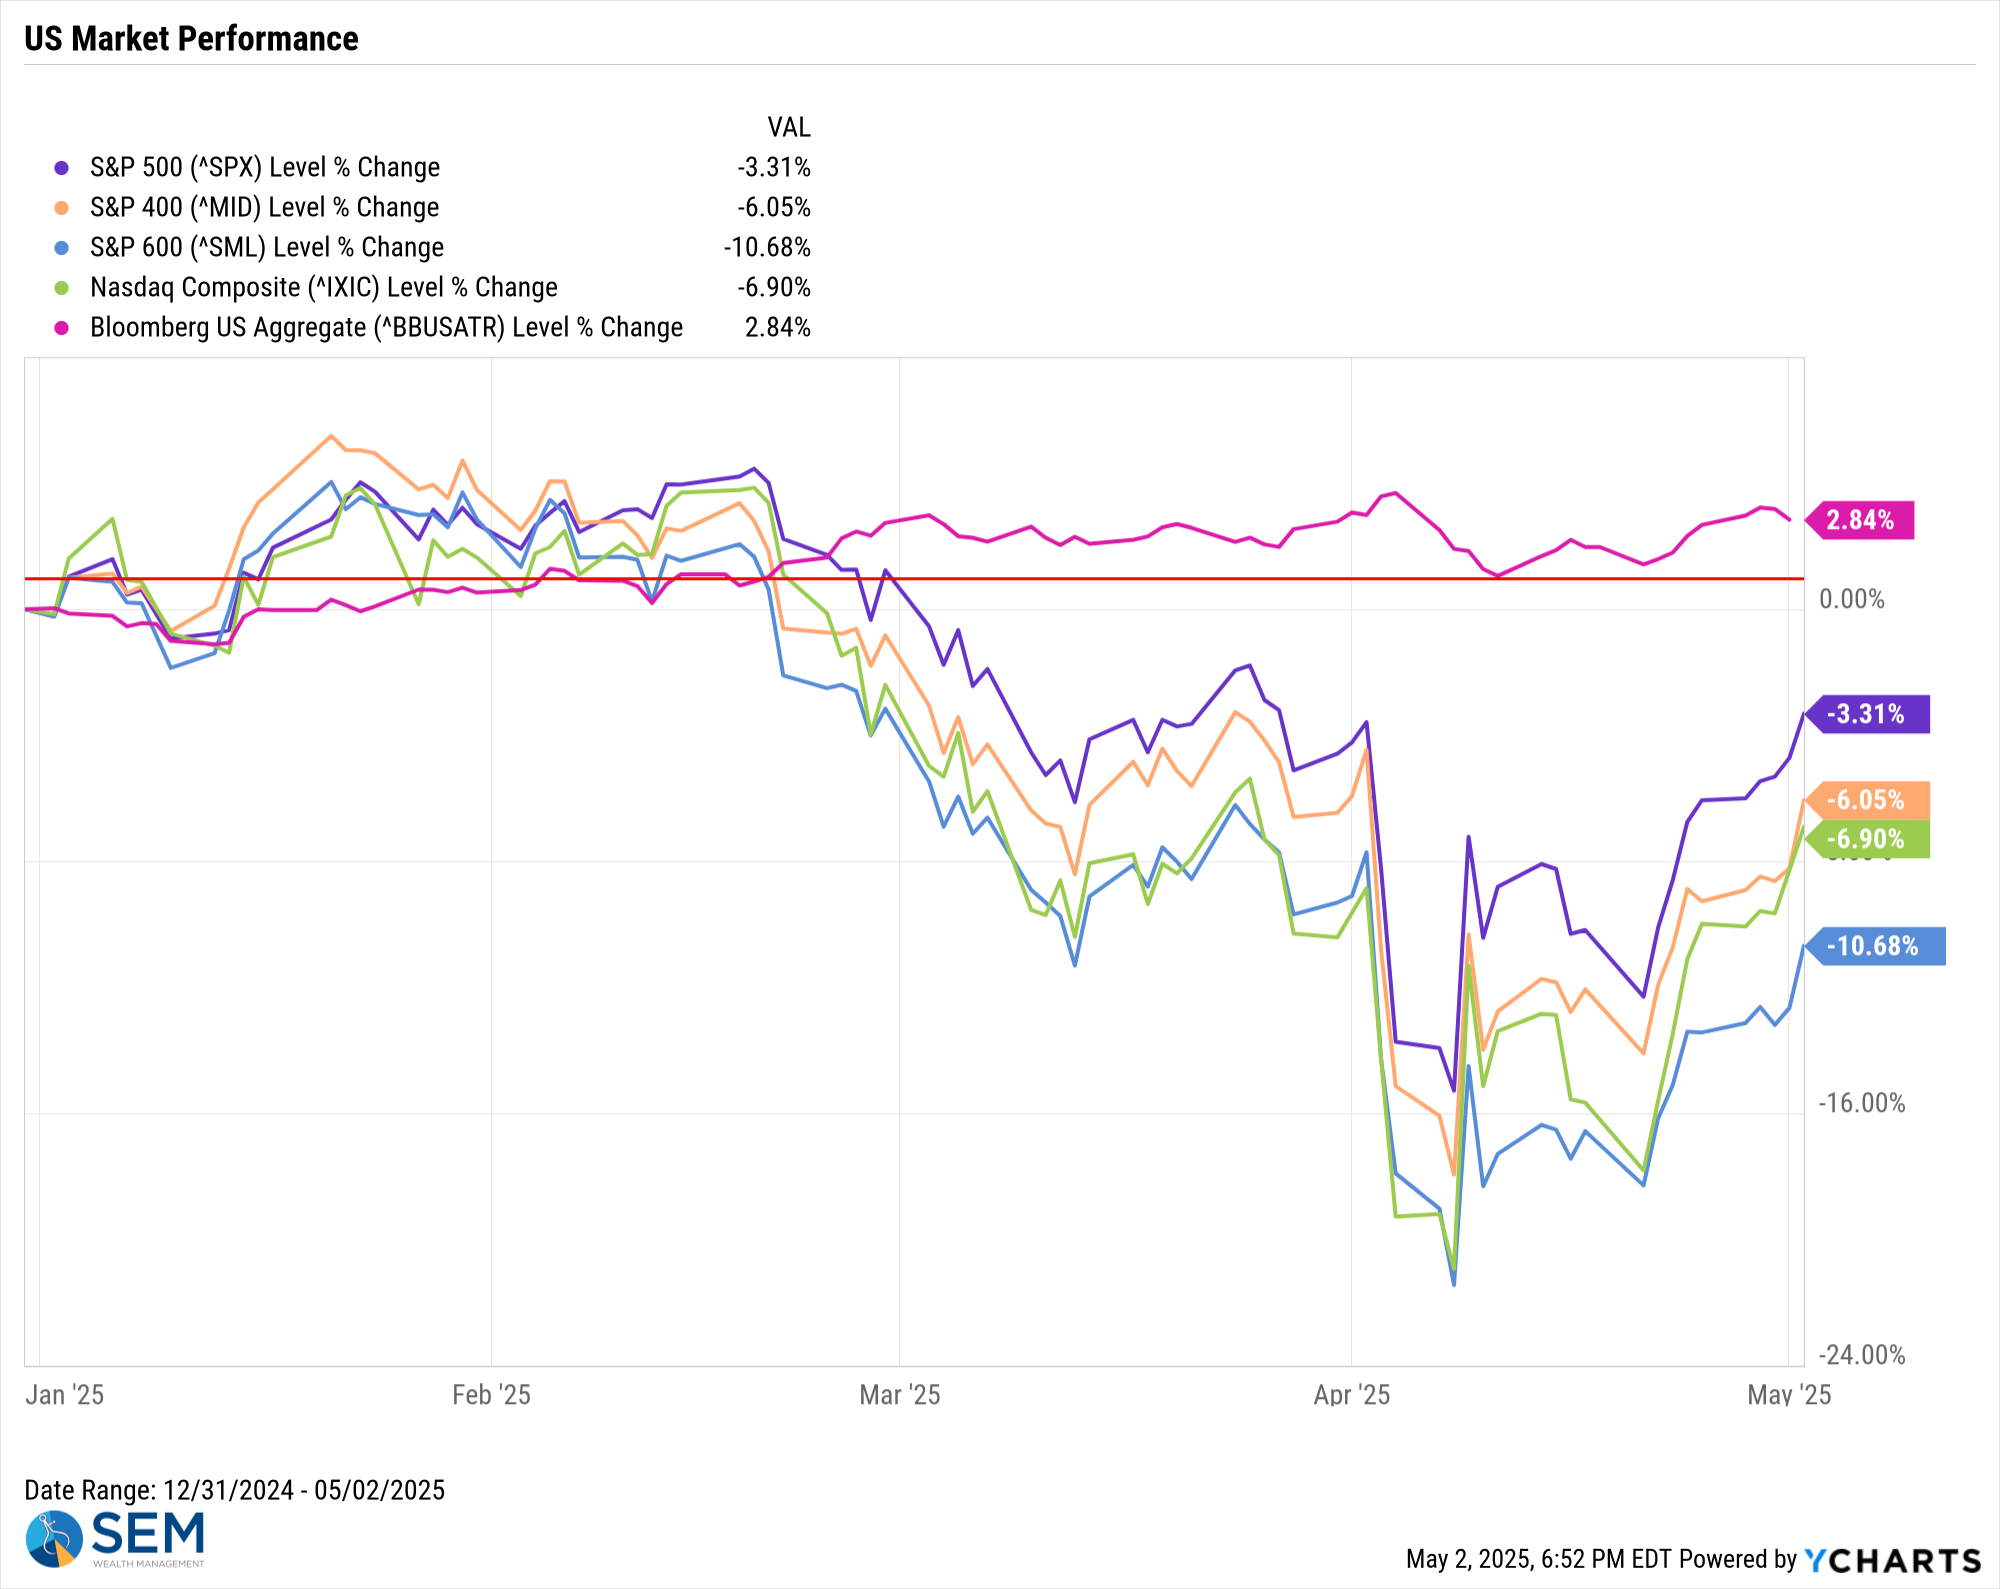
Stocks are now down less than 2% since election day, although they are still 7.5% off the highs from late February.
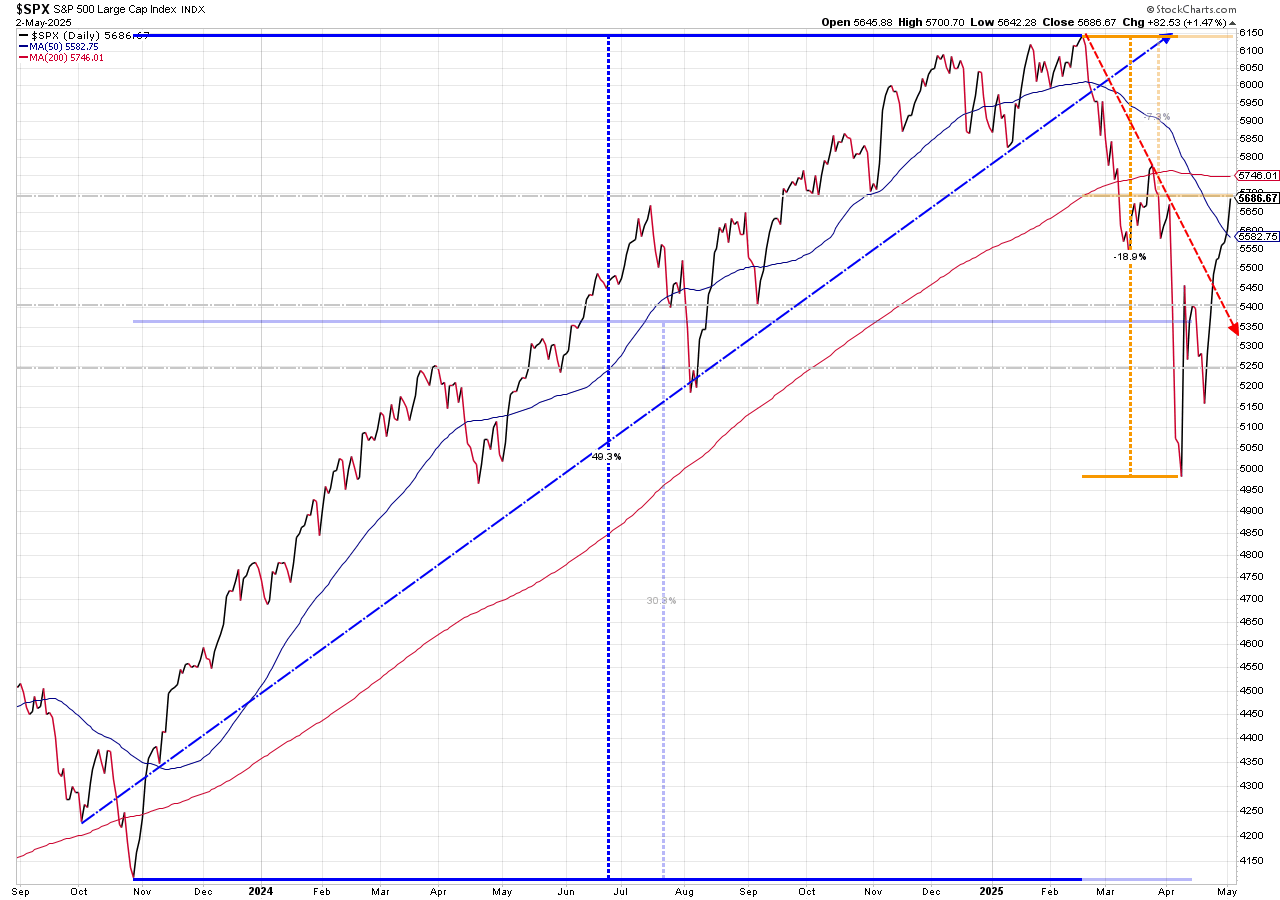
More importantly, the S&P 500 has blasted back through the "gaps" created from the "Liberation Day" sell-offs and broken back above the 50-day moving average. It is also nearly back to the 200-day moving average, a measure many people use as the long-term trend.
Small caps have yet to return to the outperformance ranks like we saw to start the year. They lost more than large caps on the way down and have recovered less of their losses, which is a sign the market is not yet convinced the coast is clear for the economy.
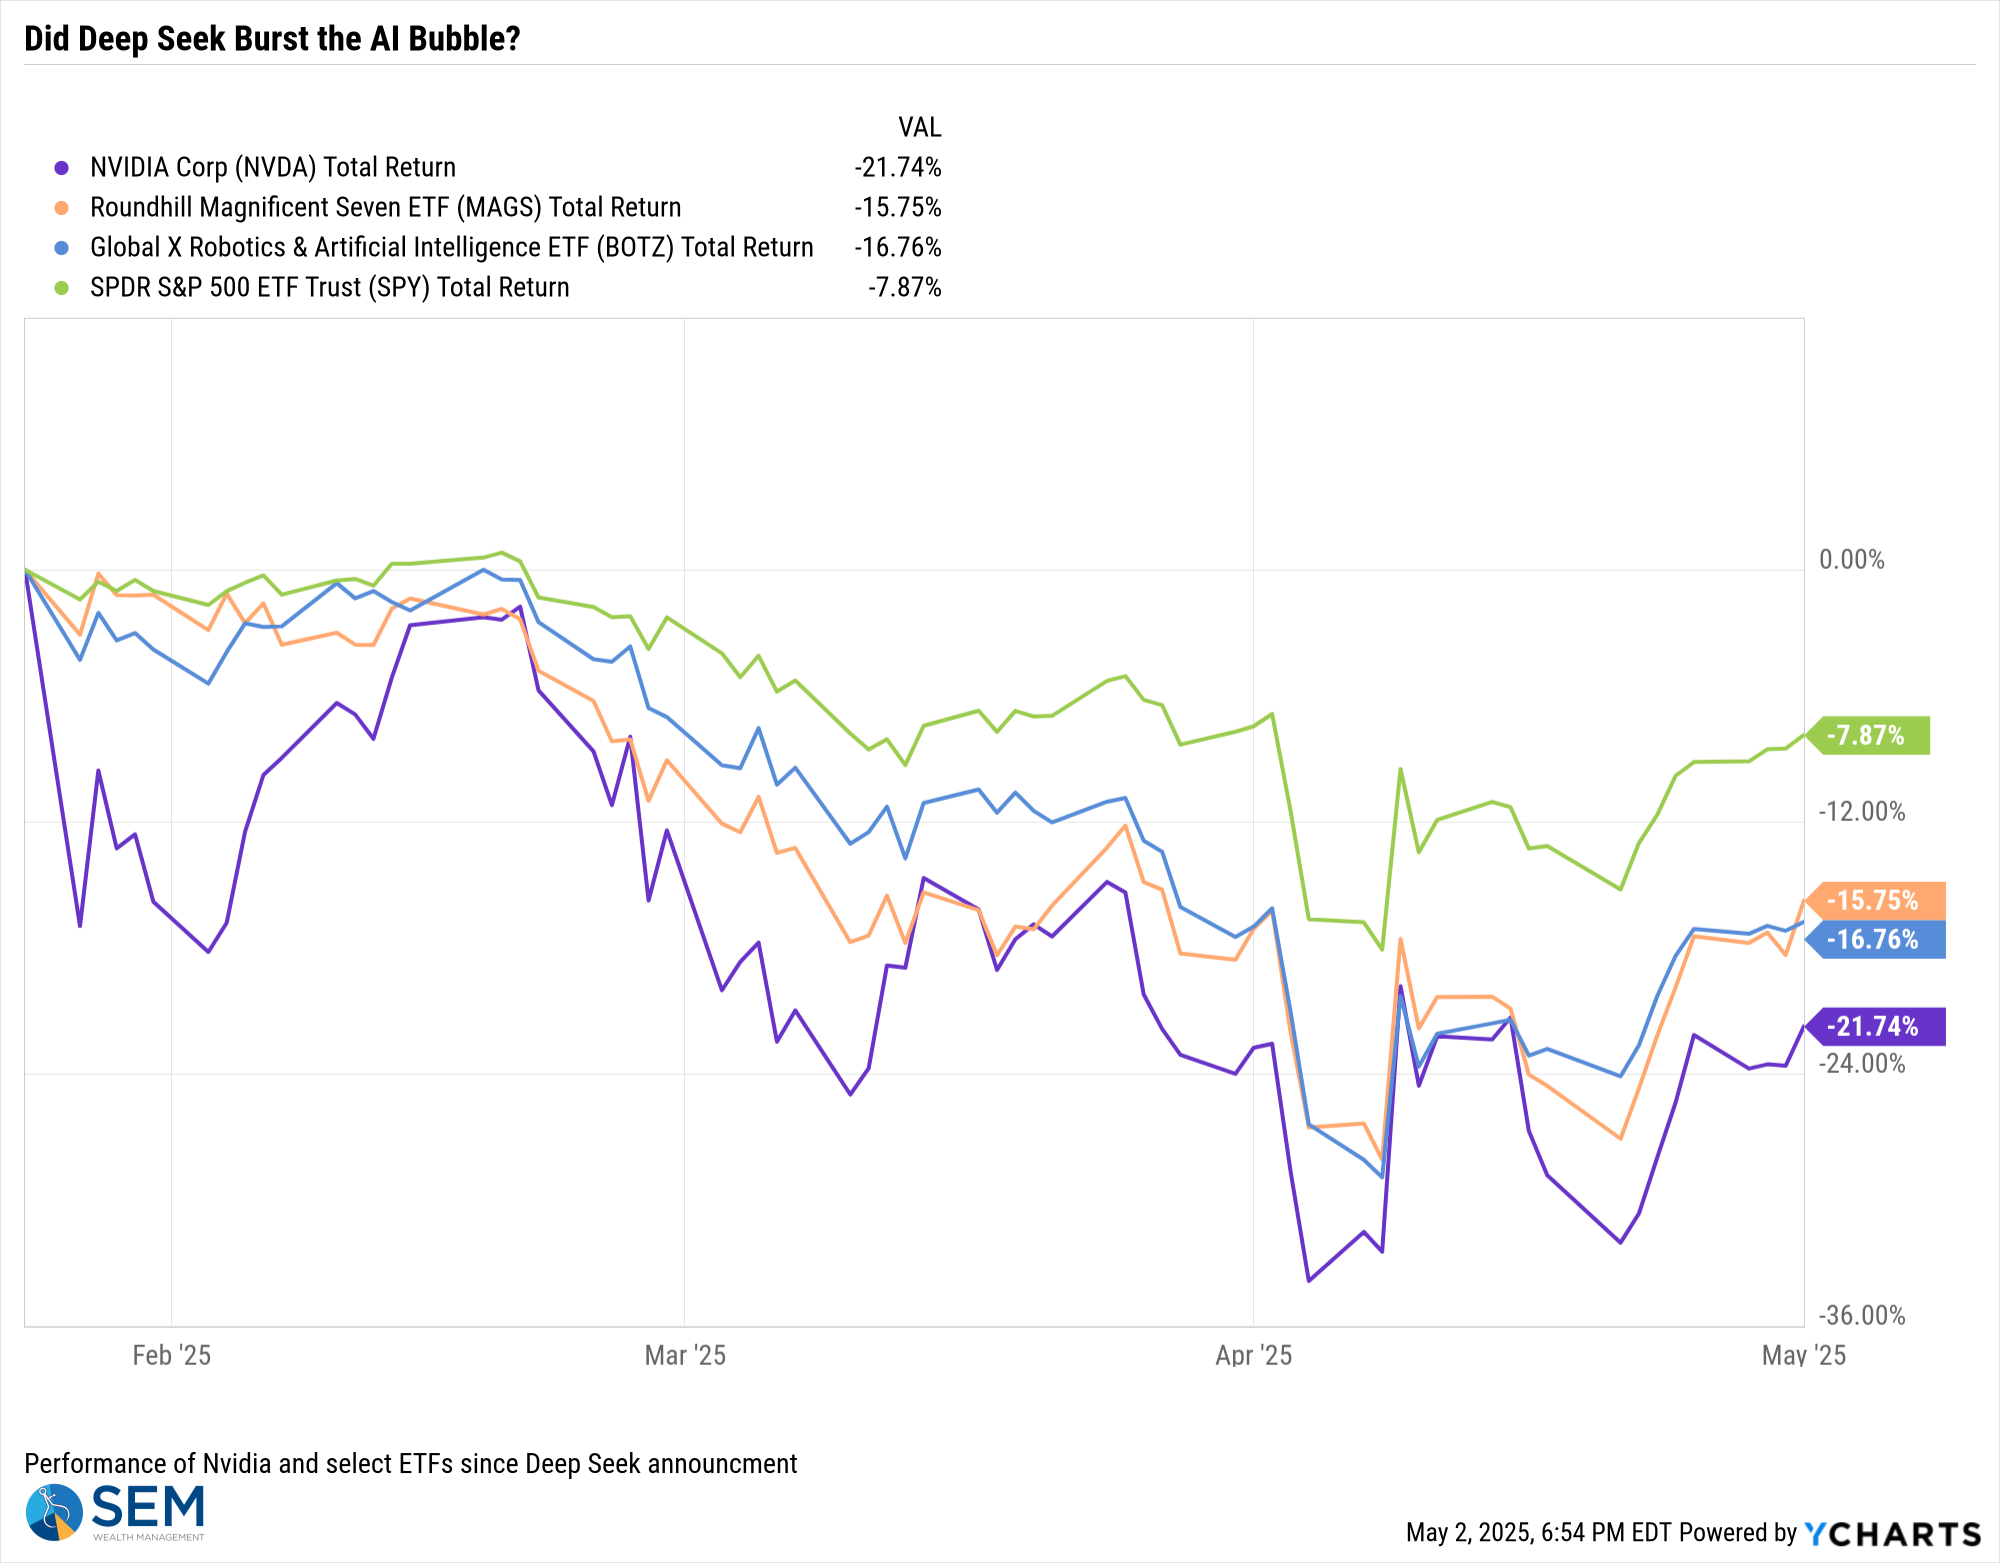
Zooming in on tech, despite a good week the prior week, Nvidia is still suffering from the Deep Seek announcement as is the rest of the AI space, which has left the so-called Magnificent Seven among the worst performers of the year.
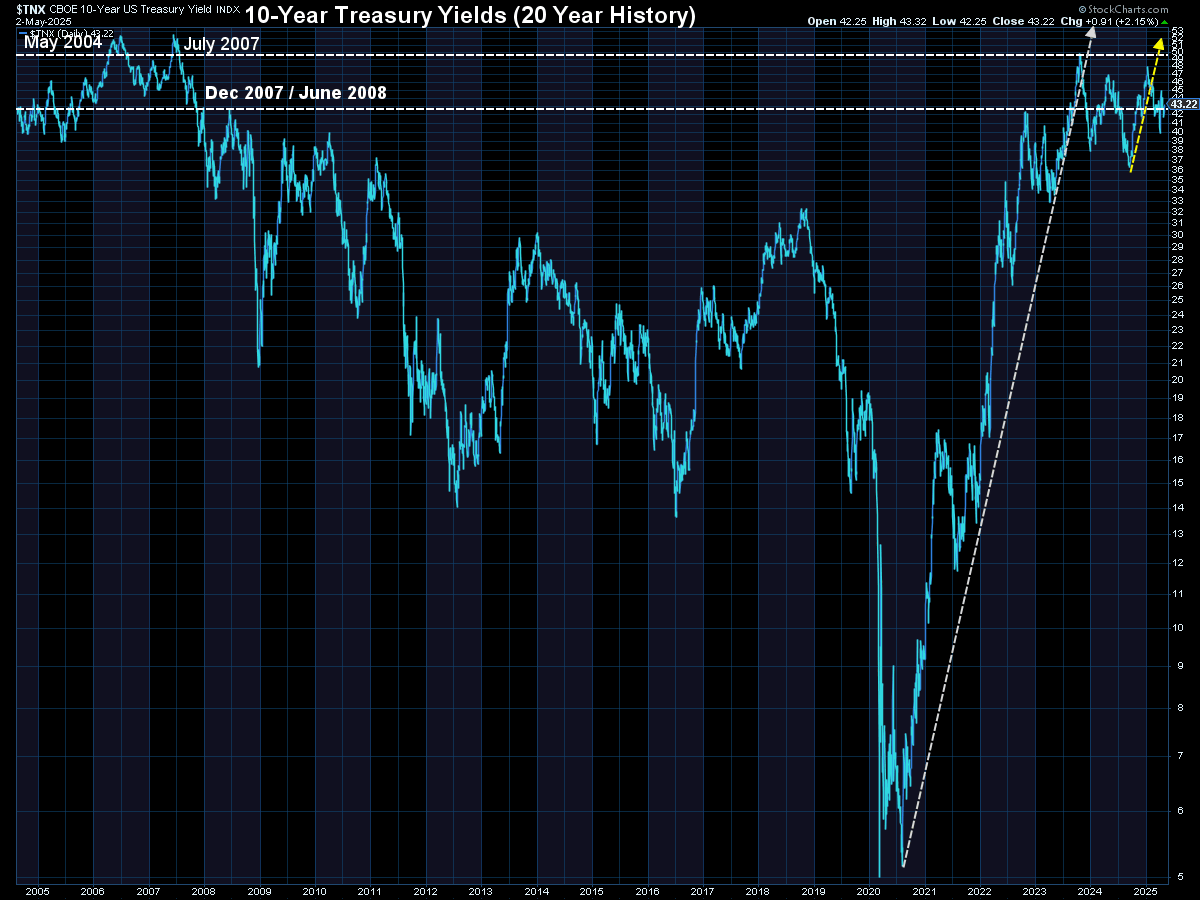
Turning to bonds, I'm bringing back the long-term chart of the 10-year Treasury yield for perspective. Yields are back to the levels we last saw in the pre-Financial crisis era. This means borrowing costs are higher than we've seen in 15 years for nearly everything. This is going to be a drag on growth and something that will make it more expensive to implement some of the President's policies, such as tax cuts.
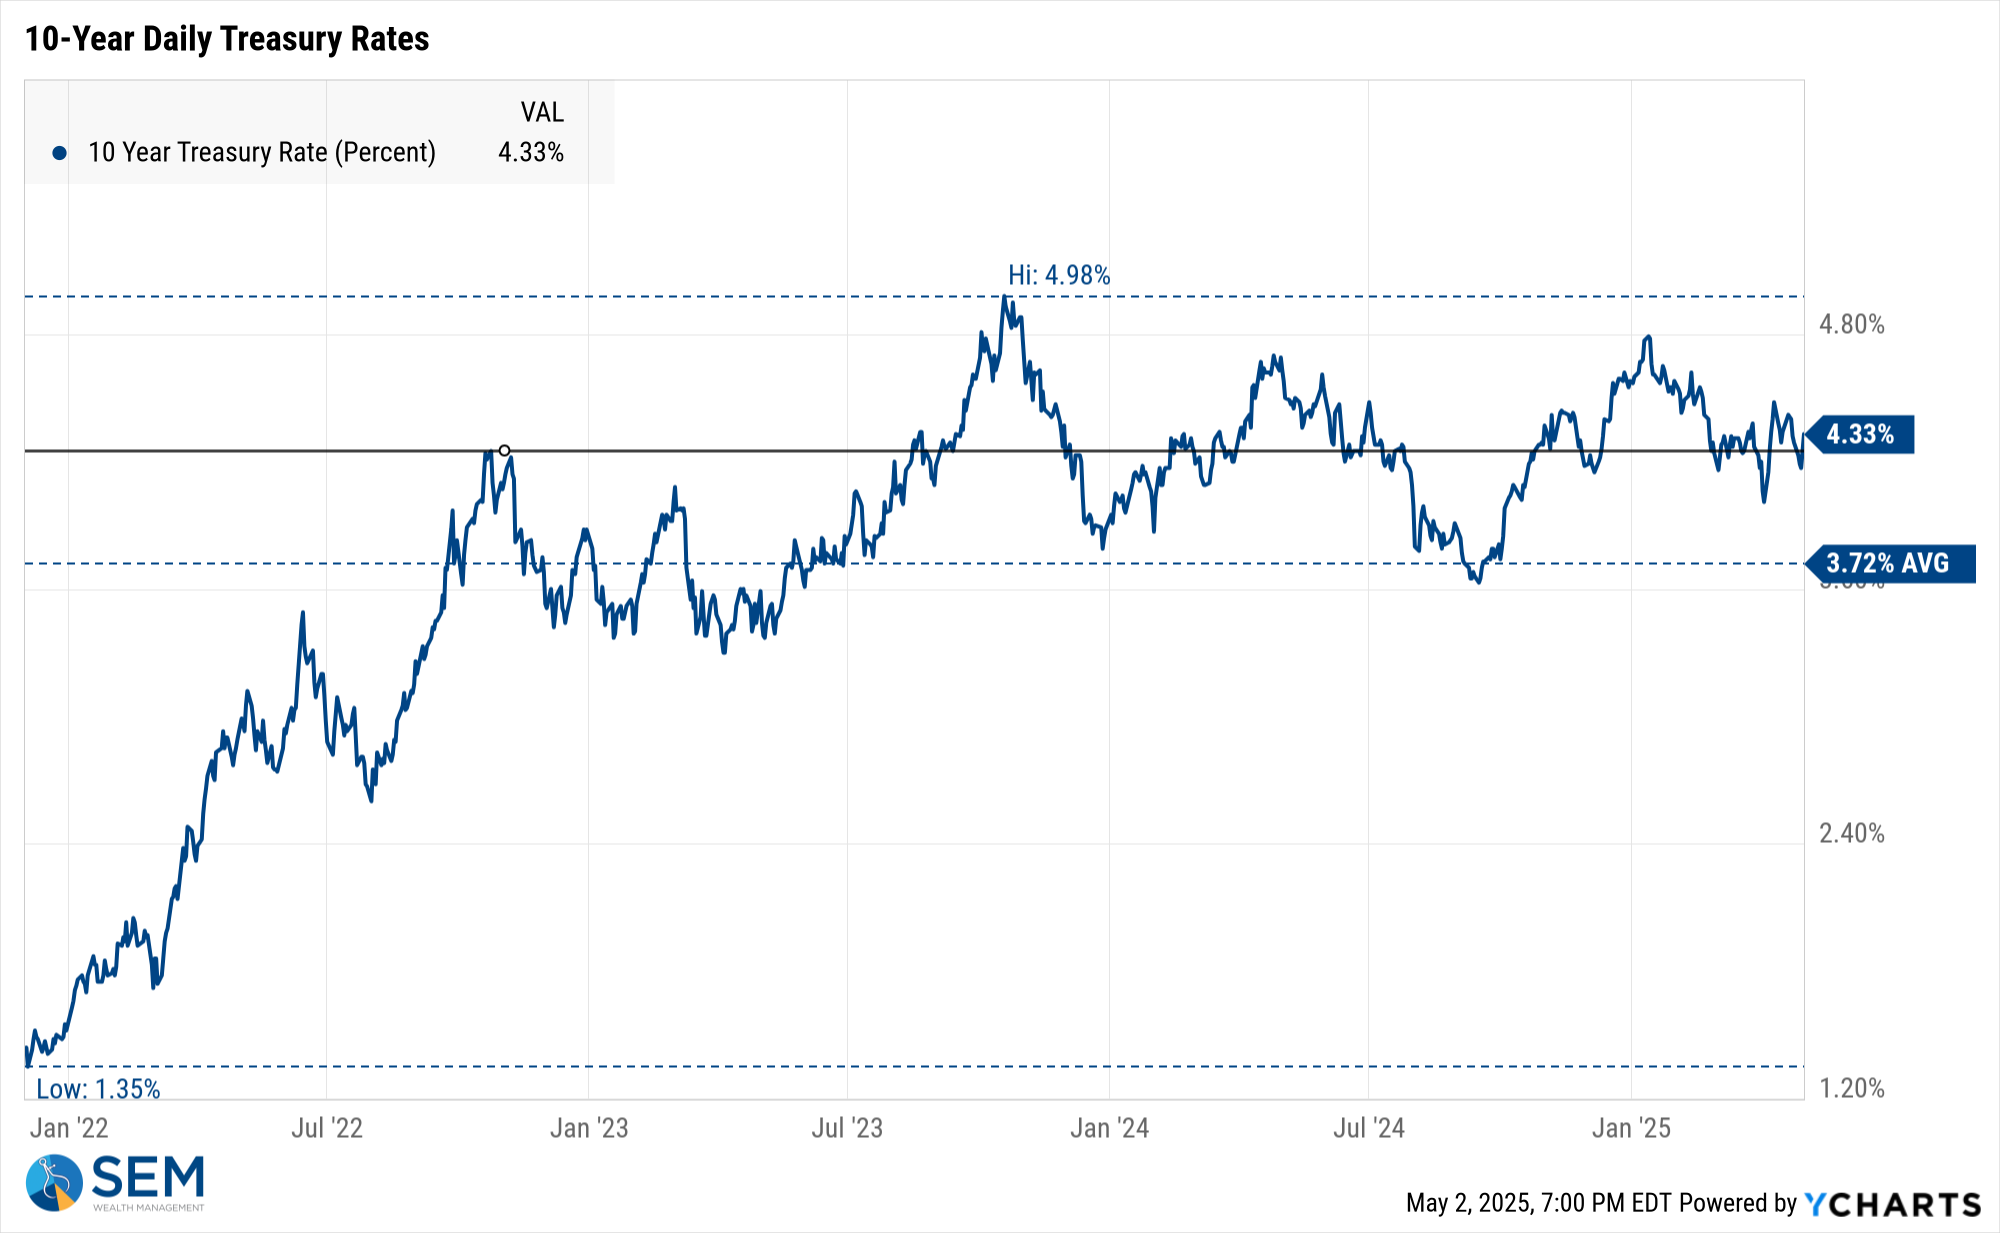
Looking at the shorter-term, we can see bond yields continuing to stabilize, remaining in the range they've been in since the middle of 2023.
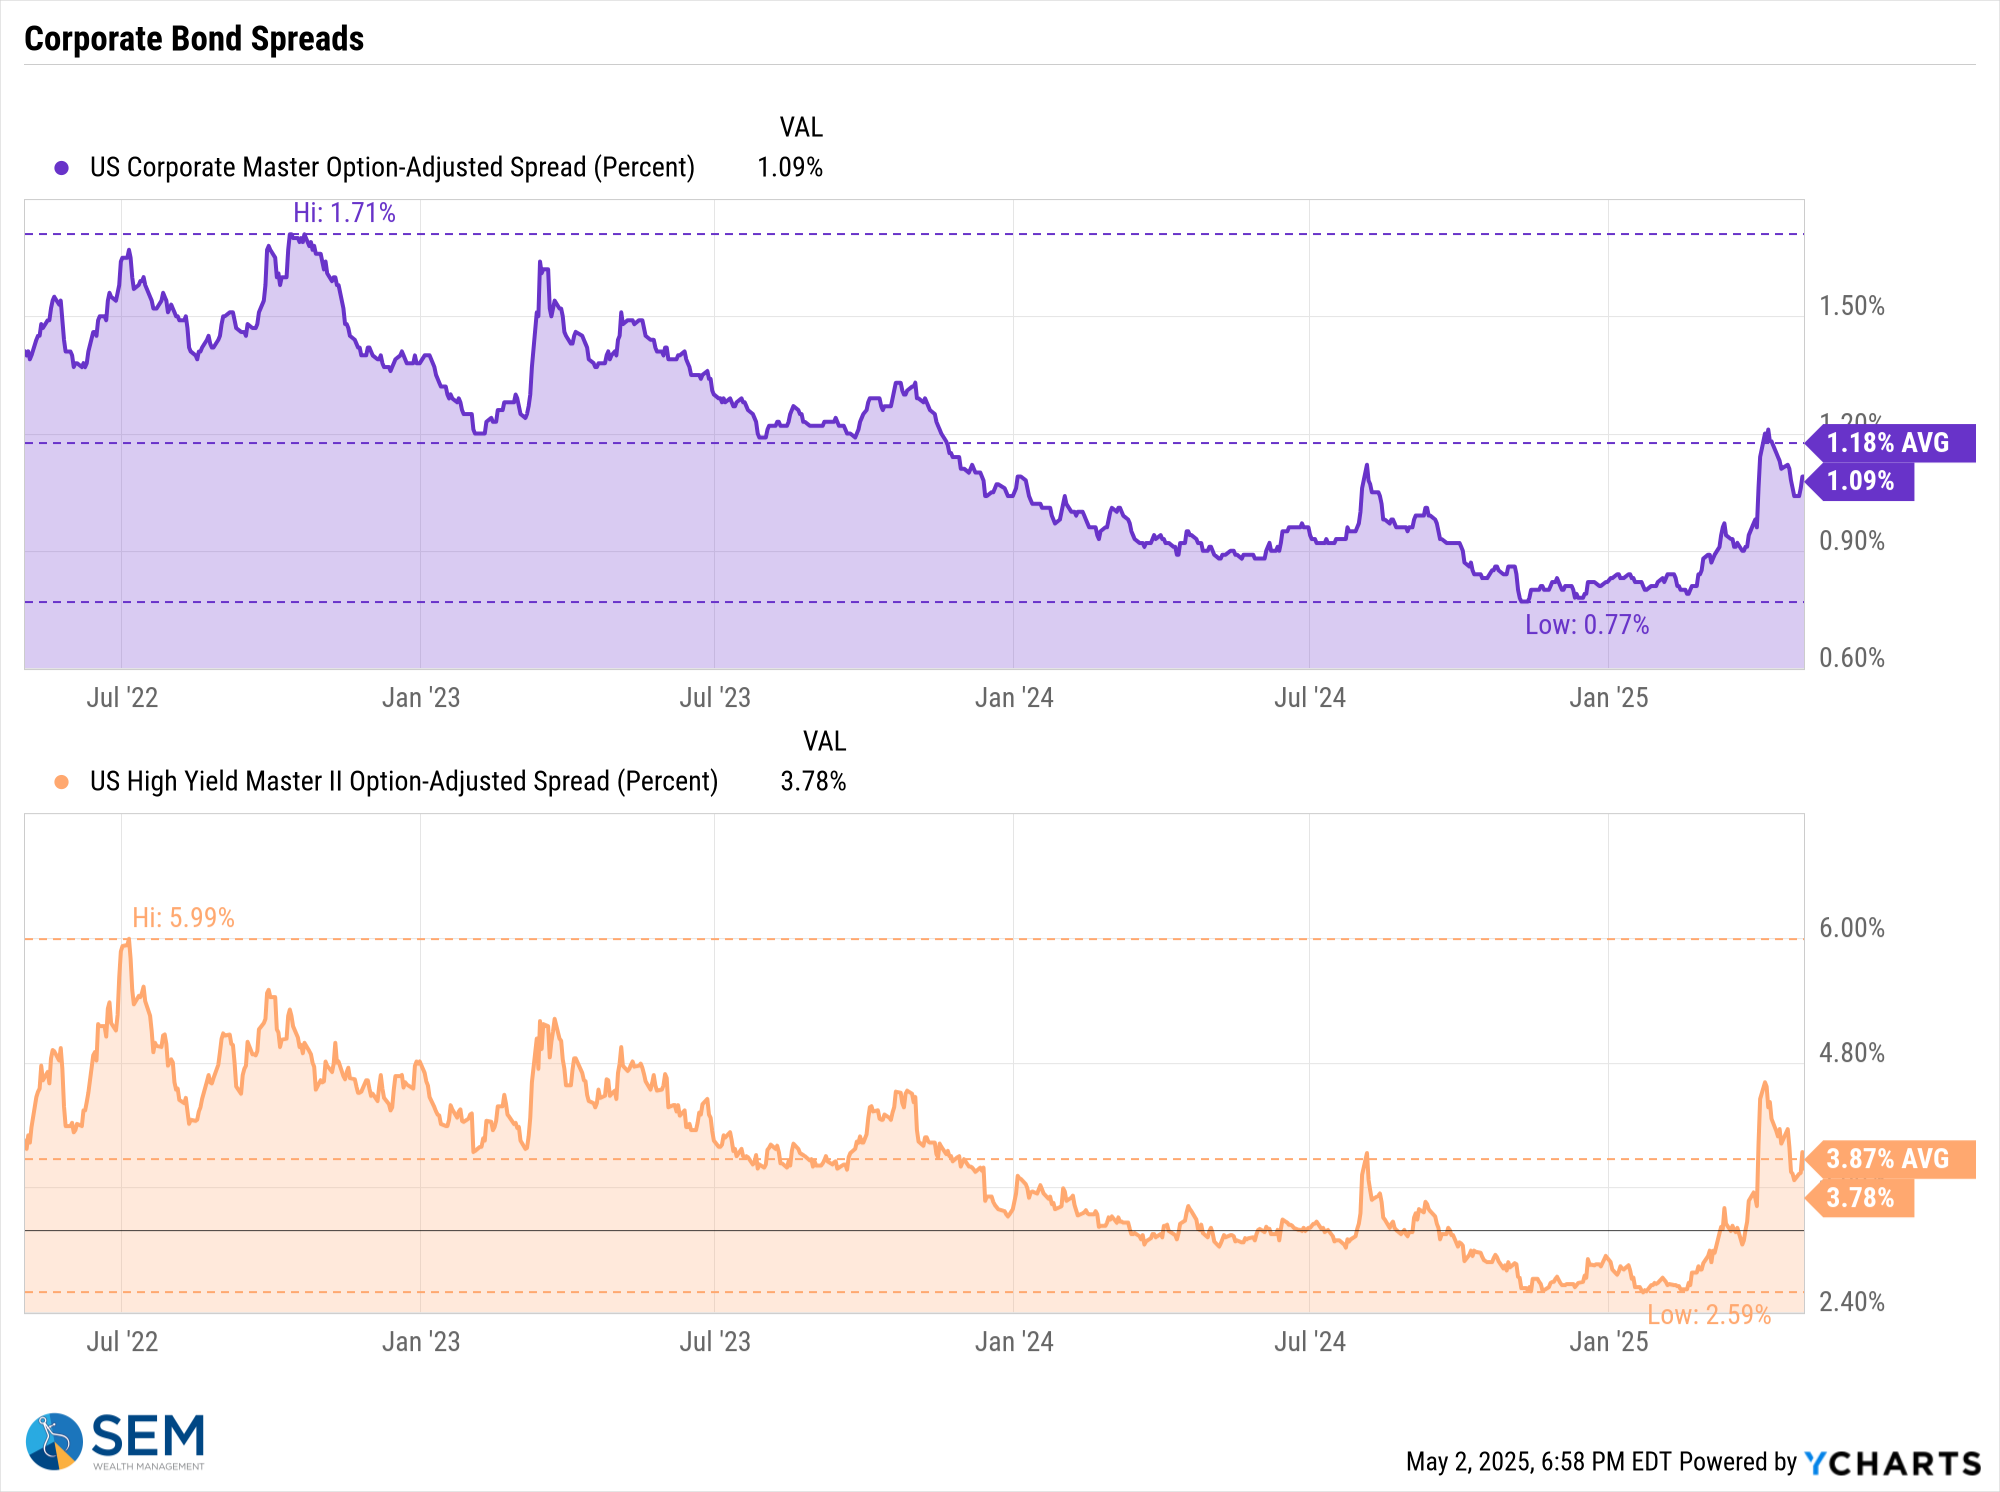
Corporate bonds have also enjoyed a bit of a rally. Spreads have again fallen as a sign there is not much concern over the Trade War causing problems in higher risk bonds.
SEM Model Positioning
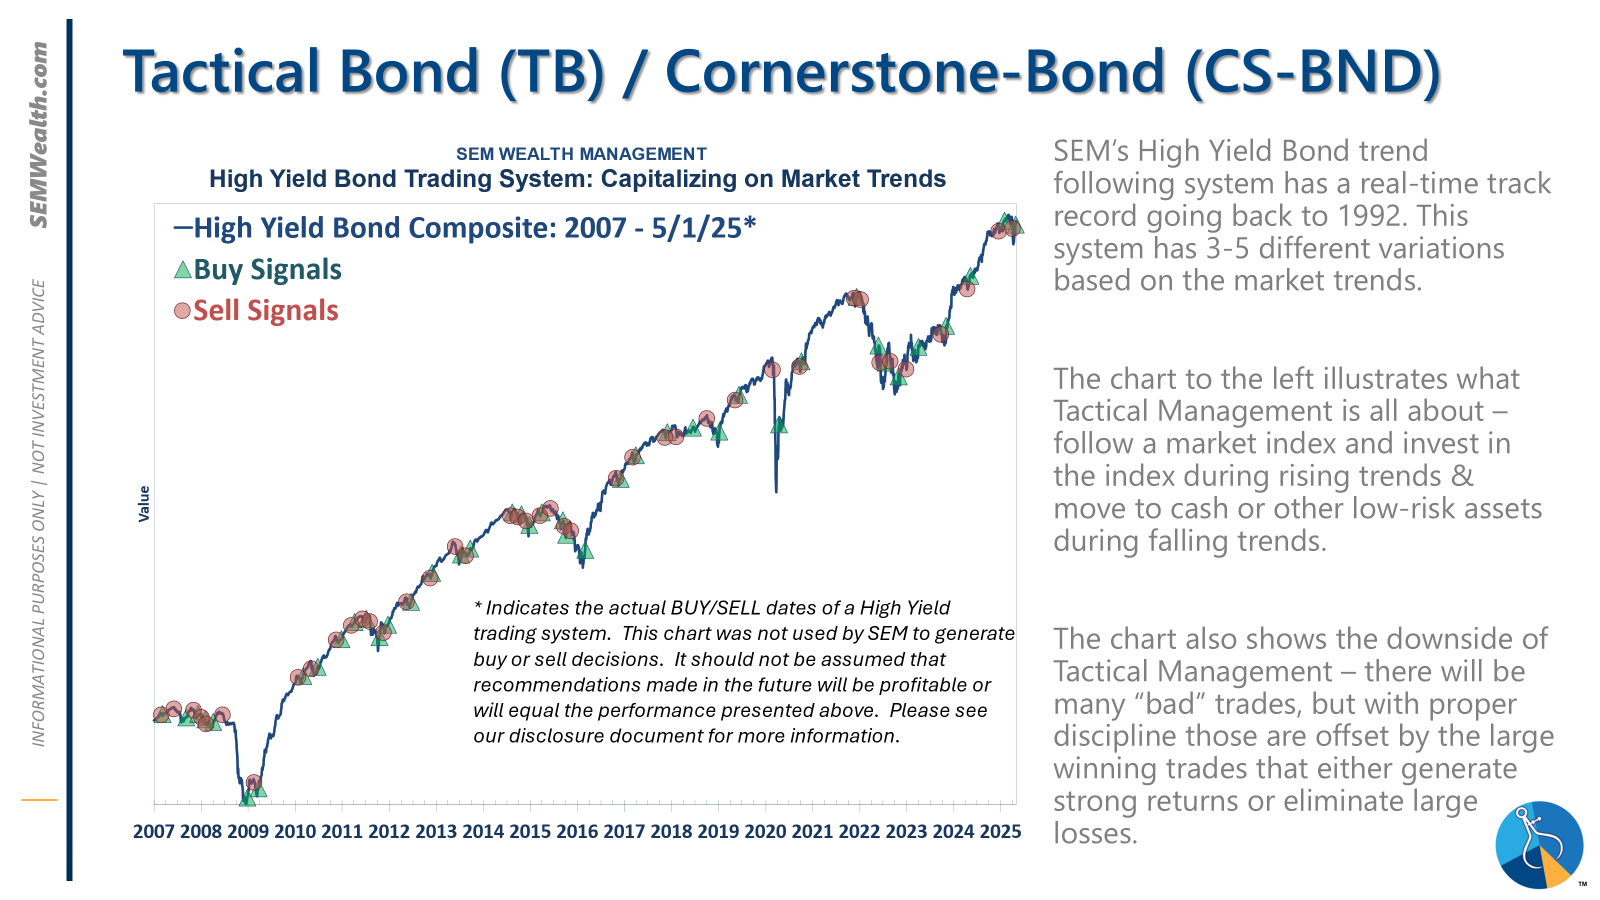
Tactical Bond, Cornerstone Bond, and Income Allocator jumped back to buy signals on 4/24. At least according to the data, we are in a "wait and see" mode.
-Tactical High Yield sold high yield bonds on 4/3/25 after 9 weeks in these funds. These models bought back in on 4/24. All proceeds were moved to money market or short-term bonds, with a yield around 4.1% in money markets.
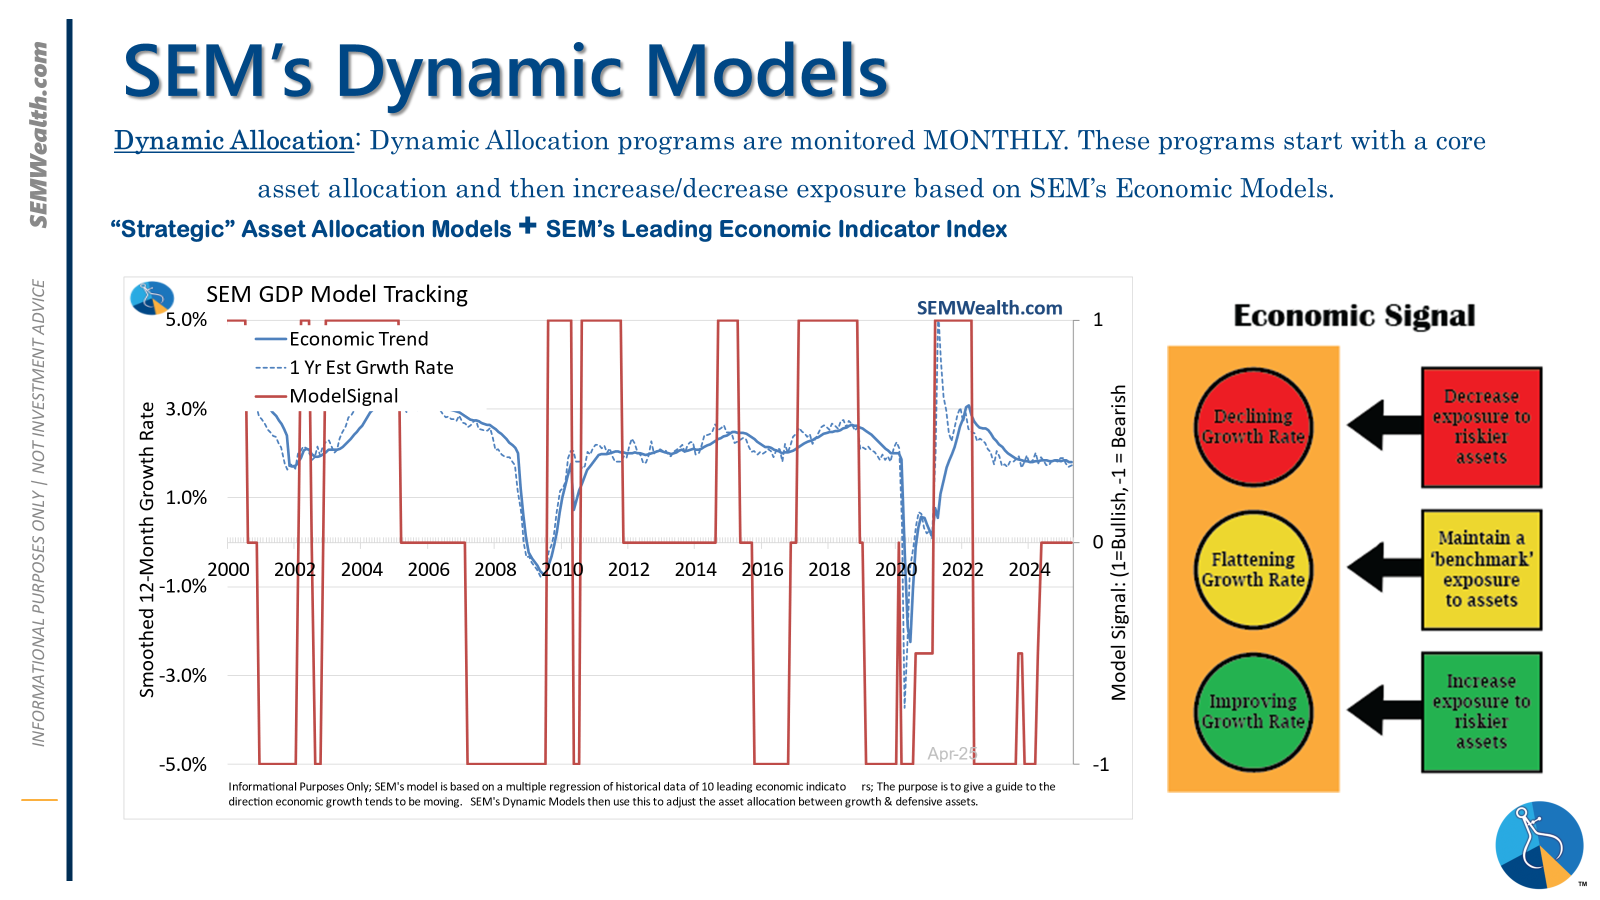
-Dynamic Models are 'neutral' as of 6/7/24, reversing the half 'bearish' signal from 5/3/2024. The interest rate model remains partially 'bullish' (long Treasuries).
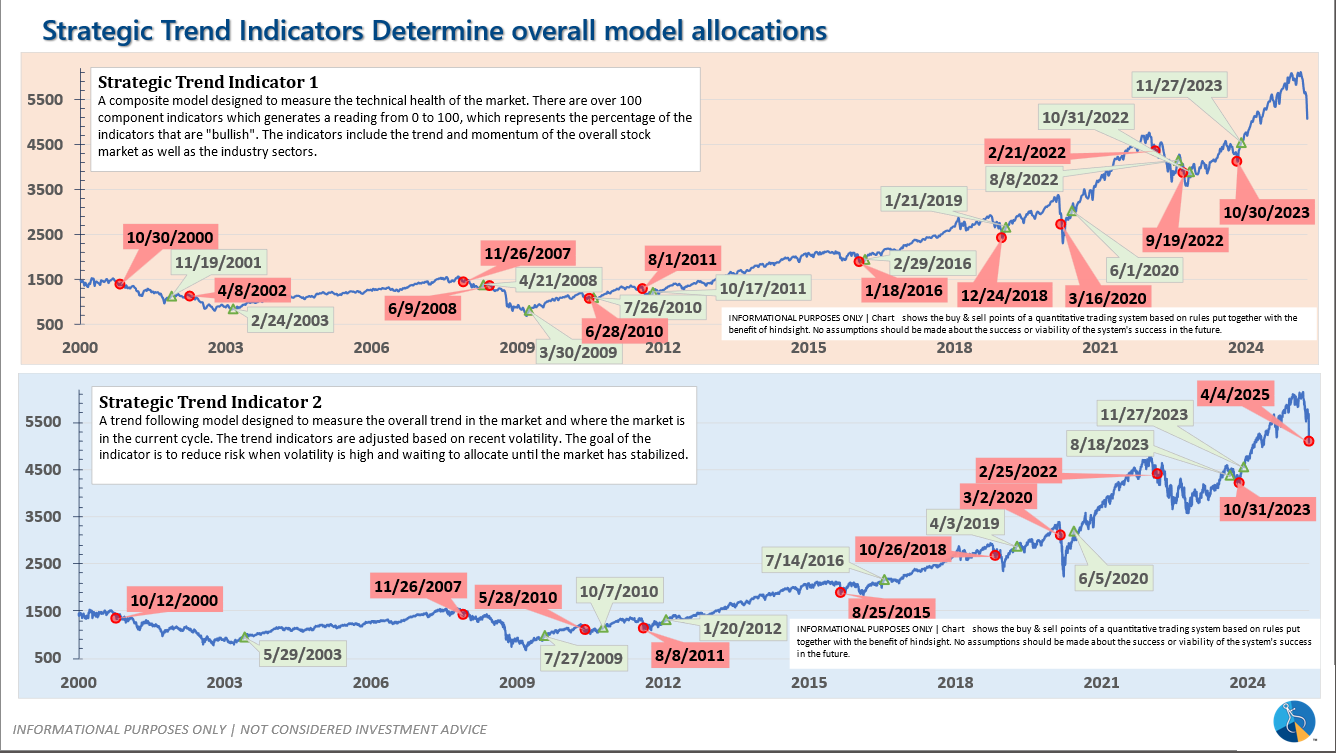
-Strategic Trend Models received 1/2 of the trend sell signal on 4/5/25
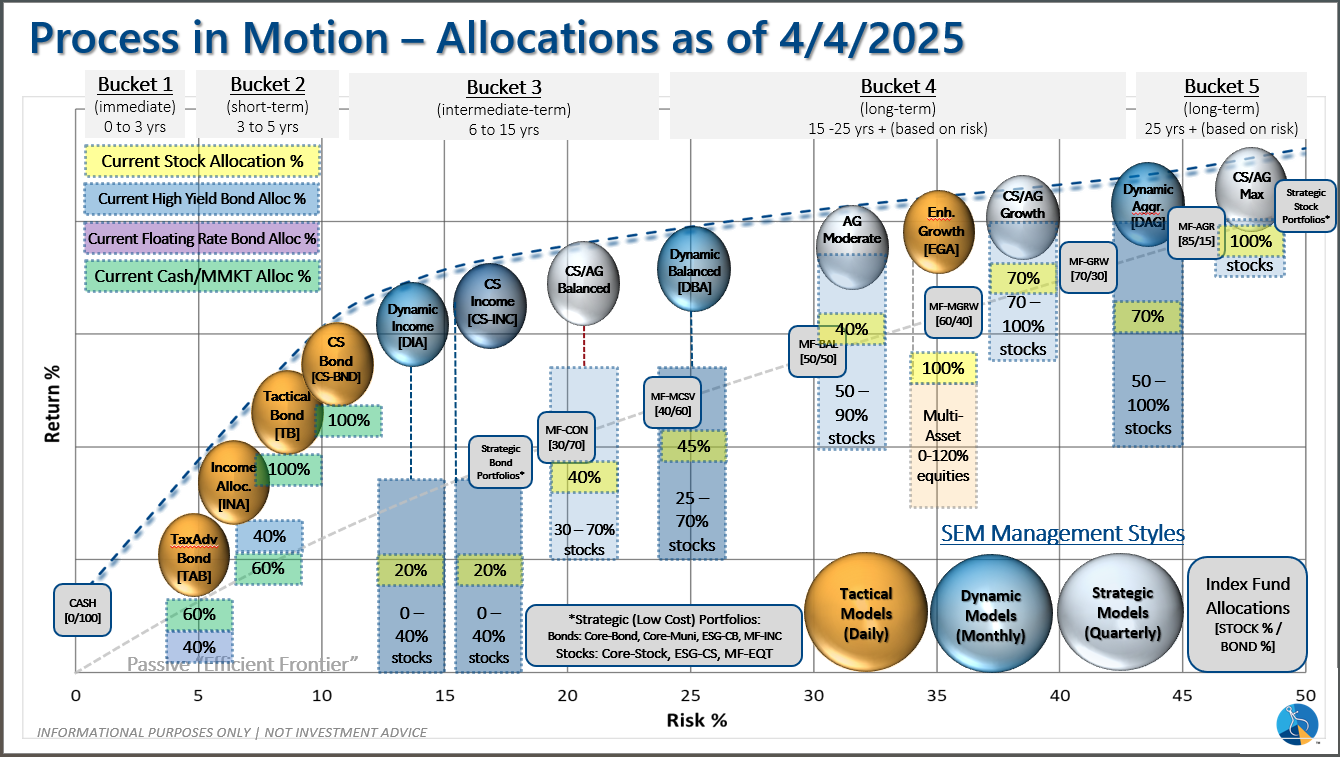
SEM deploys 3 distinct approaches – Tactical, Dynamic, and Strategic. These systems have been described as 'daily, monthly, quarterly' given how often they may make adjustments. Here is where they each stand.
Tactical (daily): On 4/3/2025 our tactical high yield model sold out of high yield bond into money market.
Dynamic (monthly): The economic model was 'neutral' since February. In early May 2023 the model moved slightly negative, but reversed back to 'neutral' in June. This means 'benchmark' positions – 20% dividend stocks in Dynamic Income and 20% small cap stocks in Dynamic Aggressive Growth. The interest rate model is slightly 'bullish'.
Strategic (quarterly)*: One Trend System sold on 4/4/2025
The core rotation is adjusted quarterly. On August 17 it rotated out of mid-cap growth and into small cap value. It also sold some large cap value to buy some large cap blend and growth. The large cap purchases were in actively managed funds with more diversification than the S&P 500 (banking on the market broadening out beyond the top 5-10 stocks.) On January 8 it rotated completely out of small cap value and mid-cap growth to purchase another broad (more diversified) large cap blend fund along with a Dividend Growth fund.
The * in quarterly is for the trend models. These models are watched daily but they trade infrequently based on readings of where each believe we are in the cycle. The trend systems can be susceptible to "whipsaws" as we saw with the recent sell and buy signals at the end of October and November. The goal of the systems is to miss major downturns in the market. Risks are high when the market has been stampeding higher as it has for most of 2023. This means sometimes selling too soon. As we saw with the recent trade, the systems can quickly reverse if they are wrong.
Overall, this is how our various models stack up based on the last allocation change:
Questions or comments - drop us a note?
Curious if your current investment allocation aligns with your overall objectives and risk tolerance? Take our risk questionnaire


