
The labor market continues to show signs of strain. While the headline payroll number didn’t move much, digging into the details reveals a troubling trend. Job growth has essentially stalled over the last three months......something that historically happens just before or during a recession. We’re not seeing a spike in layoffs, but if you’re looking for a job (or trying to reenter the workforce), it’s getting harder to find one. The market initially rallied on the weak report, but as we’ve been saying for months, lower interest rates won’t fix the structural issues in the labor market. There’s a growing mismatch between the jobs available and the skills of the people looking......and that’s not something the Fed can solve with a rate cut.
Payroll Report
With the number of jobs basically flat for the last 3 months, that is obviously a concern. Questions were being discussed on CNBC about the new "run rate" for the labor market. Essentially, what is the number of new jobs needed each month to keep the unemployment rate the same. Because the US population and thus the labor force has always been growing, it takes a number of new jobs to keep the unemployment rate from going up.
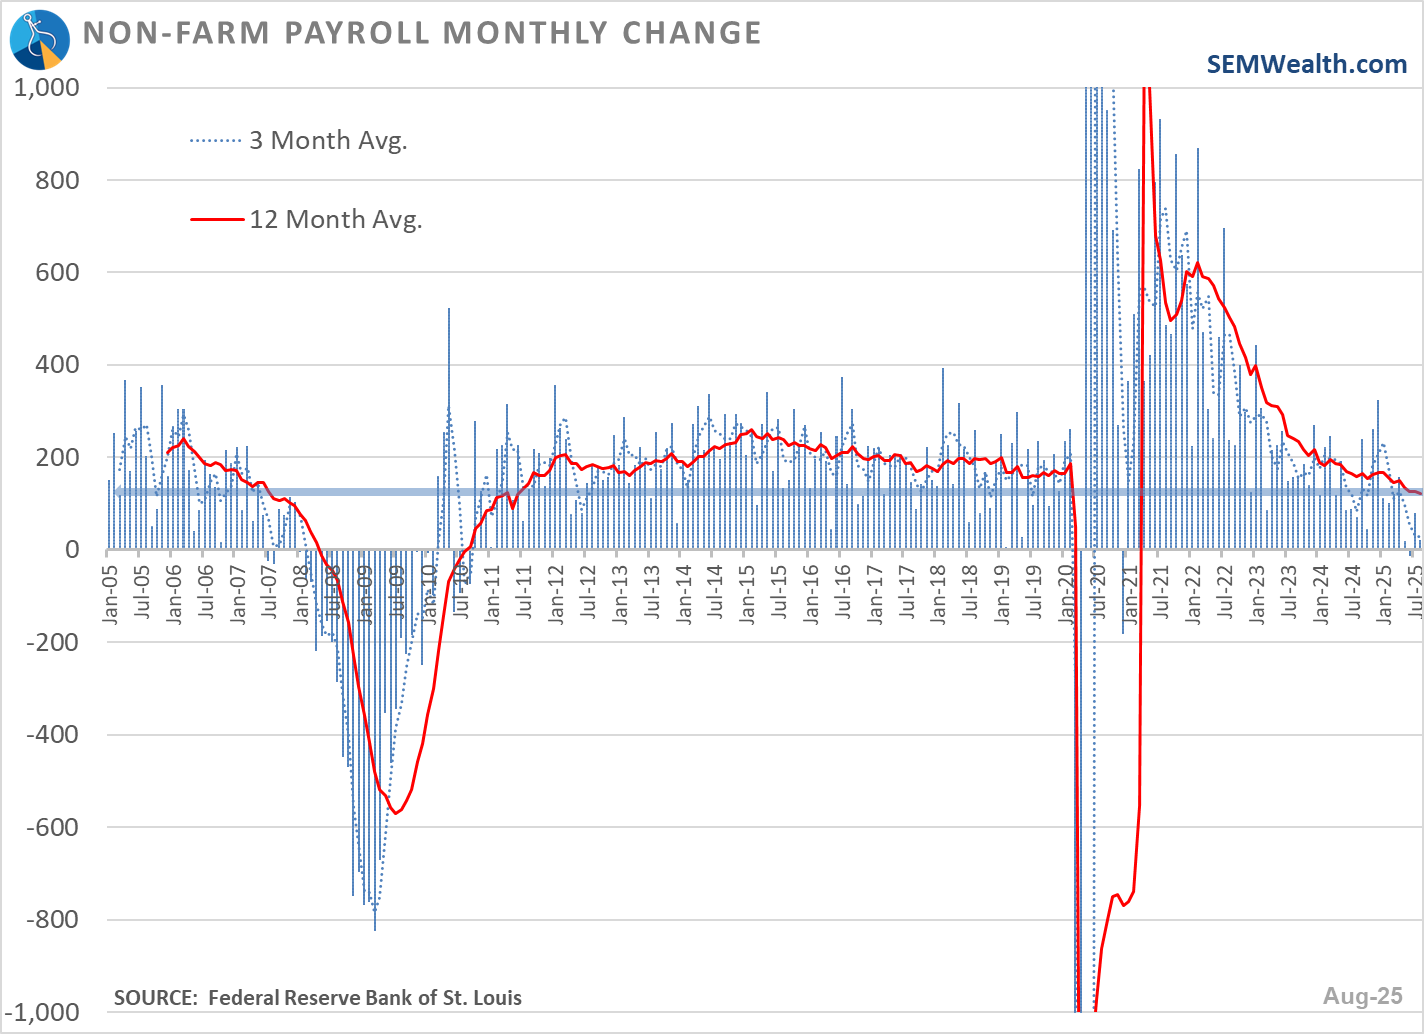
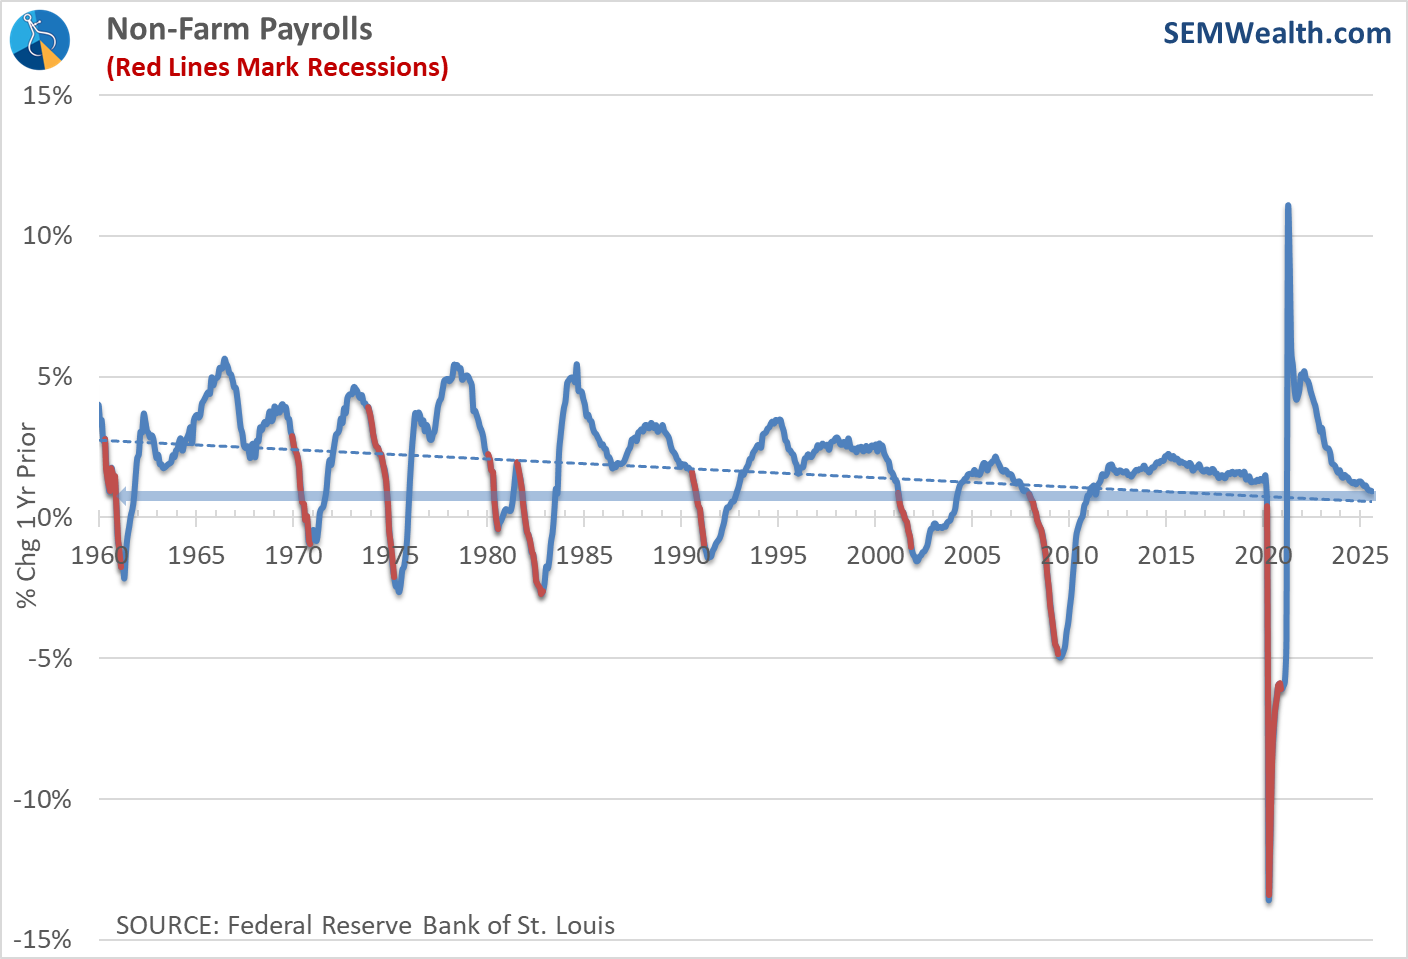
Looking at the 1 year percent change, we have dropped down to a level which historically has occurred just before or during a recession. Because a recession is not declared until 6-9 months after it already started, we should be aware that we are certainly heading that way.
Questions were being discussed on CNBC Friday morning about the new "run rate" for the labor market. Essentially, what is the number of new jobs needed each month to keep the unemployment rate the same. Because the US population and thus the labor force has always been growing, it takes a number of new jobs to keep the unemployment rate from going up. In the mid-2000s, that number was between 150-175K per month. It was thought it had declined to 75K-125K recently. The question on CNBC (that wasn't ever answered) was whether the crackdown on immigration and the mass deportations has lowered the "run rate". Several panelists thought the new run rate was around 25-50K. That would make sense as the unemployment rate did tick up 0.1% last month.
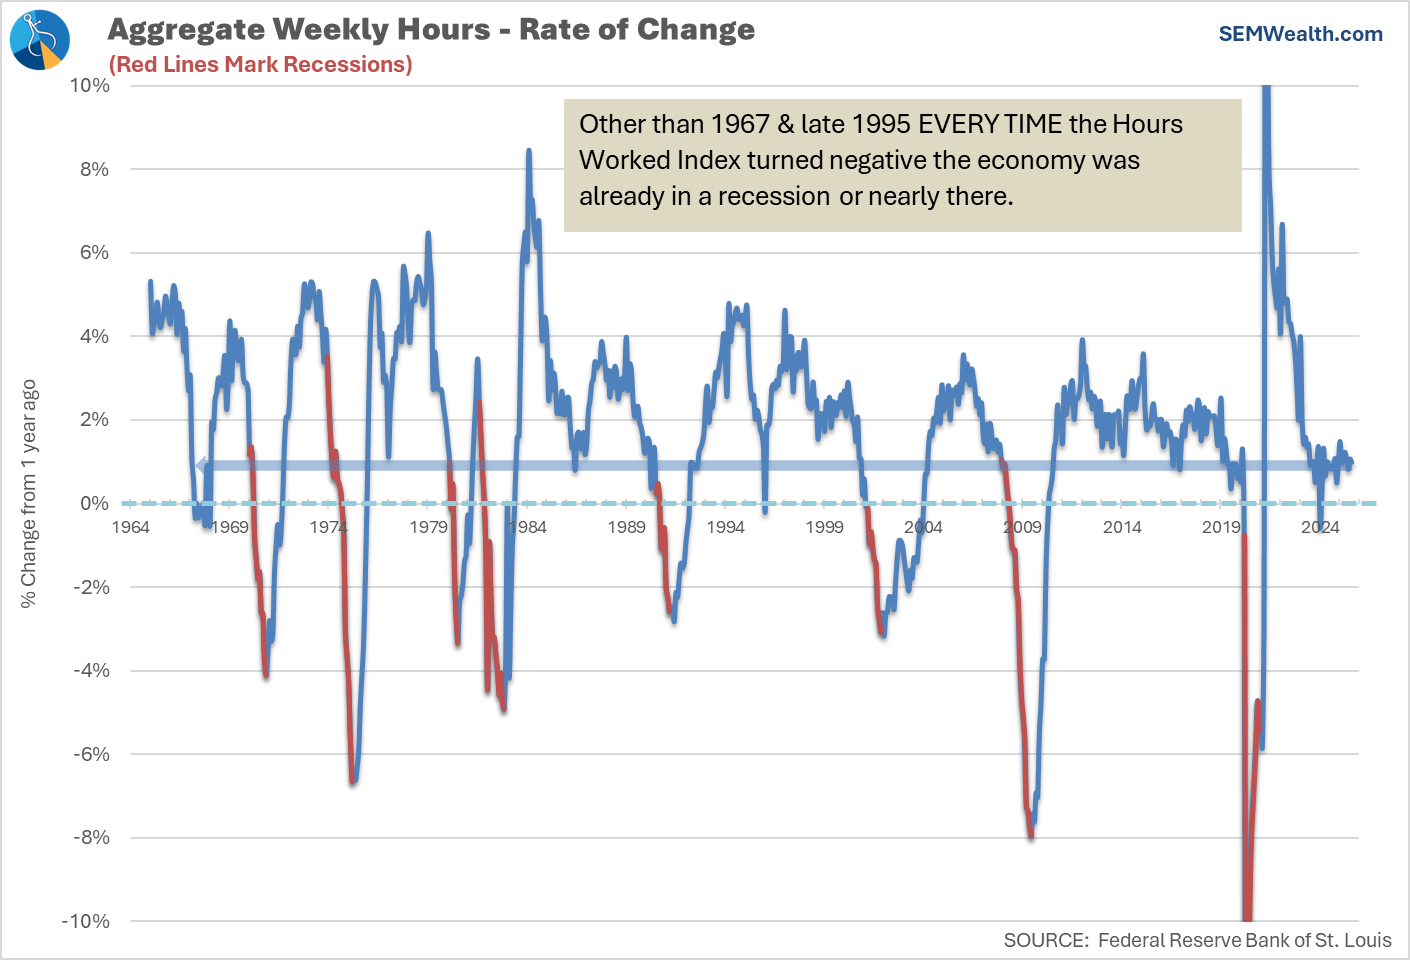
The Hours Worked component of the report, which has a much higher predictive value for economic growth remains somewhat flat – no change over the last 2 months and up 1% over the past year. This indicates we do not yet have cause for concern.
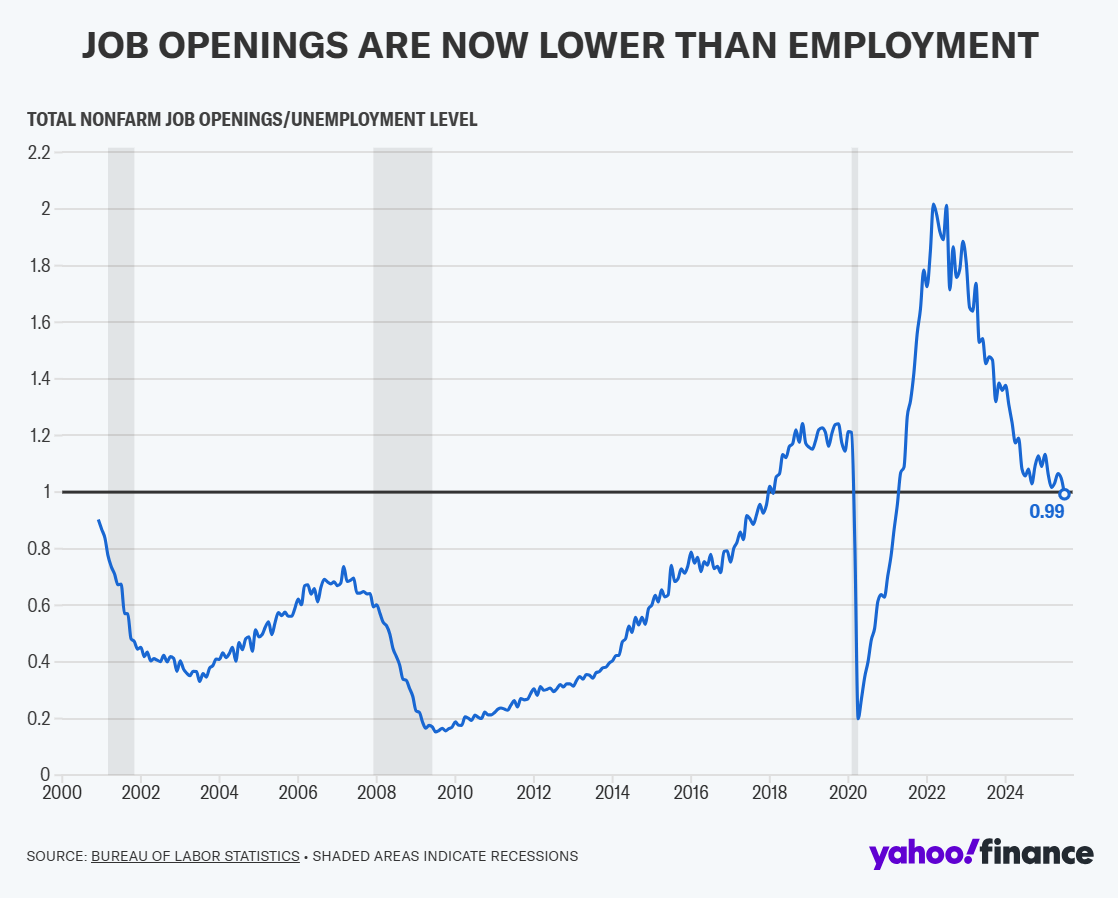
Earlier in the week, the JOLTS (Job Openings and Labor Turnover) report showed the number of job openings is less than the total number of unemployed.
We've been highlighting the story of the labor market for months — we aren't seeing a spike in layoffs, but if you lost your job (or want to reenter the work force), you're having a hard time finding one.
Interest rates dropped significantly across the board as the probability of a Fed rate cut in September jumped to 99% with probability of cuts in October and December jumping to 65% and 50% respectively. One thing people are missing – lowering short-term interest rates will not fix this.
A lot of the issue with the labor market is a mismatch of the supply of workers and the jobs businesses are attempting to fill. This isn't a recent phenomenon, but one that has been magnified by the pandemic shift to work-from-home jobs which are now frequently being brought back to in-person jobs along with the continued technological improvements and skills needed for today's labor force.
Keep in mind, over the last 6 months, shorter-term rates are down 35bp-40bp. During the same time all economic indicators have been moving to "stall speed". During the same time, 10-year rates are only down 10-15bp. The 20-30 year Treasury yields are actually higher than they were 6 months ago.
The stock market initially rallied on the weak payrolls report on Friday, but as everyone digested the numbers the rally faded. Overall, the market ended the week about where it started — fully recovering Tuesday's big drop.
SEM Economic Model Update
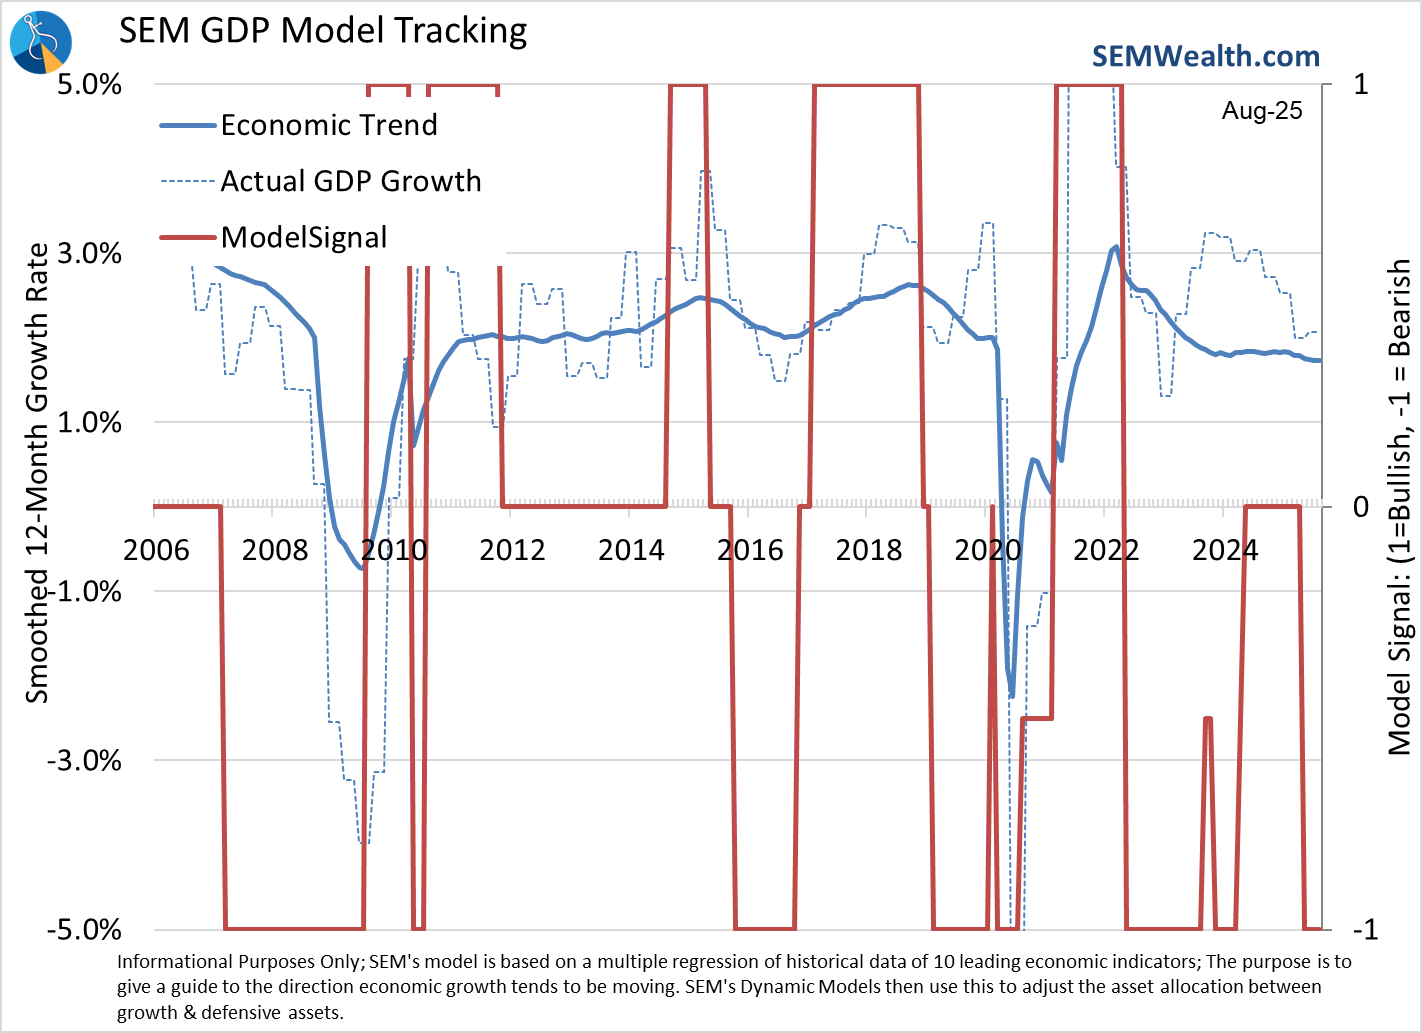
"Stall Speed" was a phrase we started hearing from the Fed a few months ago. It means the economy is no longer growing like it was in 2023 & 2024, but it is also not falling. I think it describes what our economic model is seeing as well.
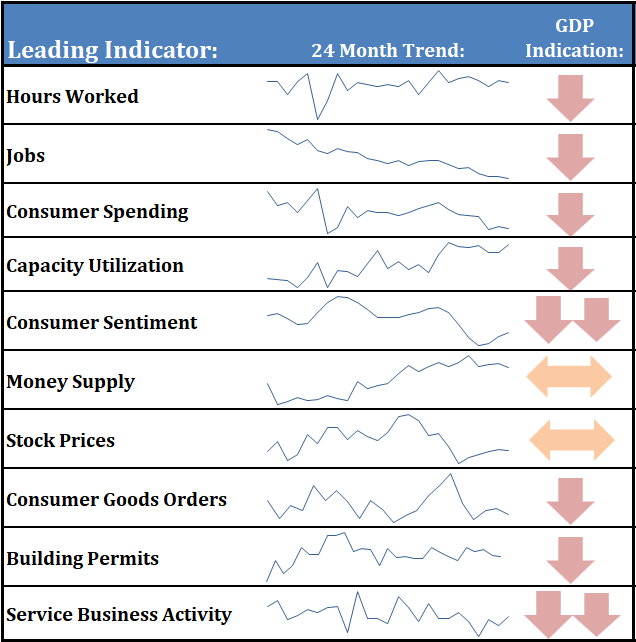
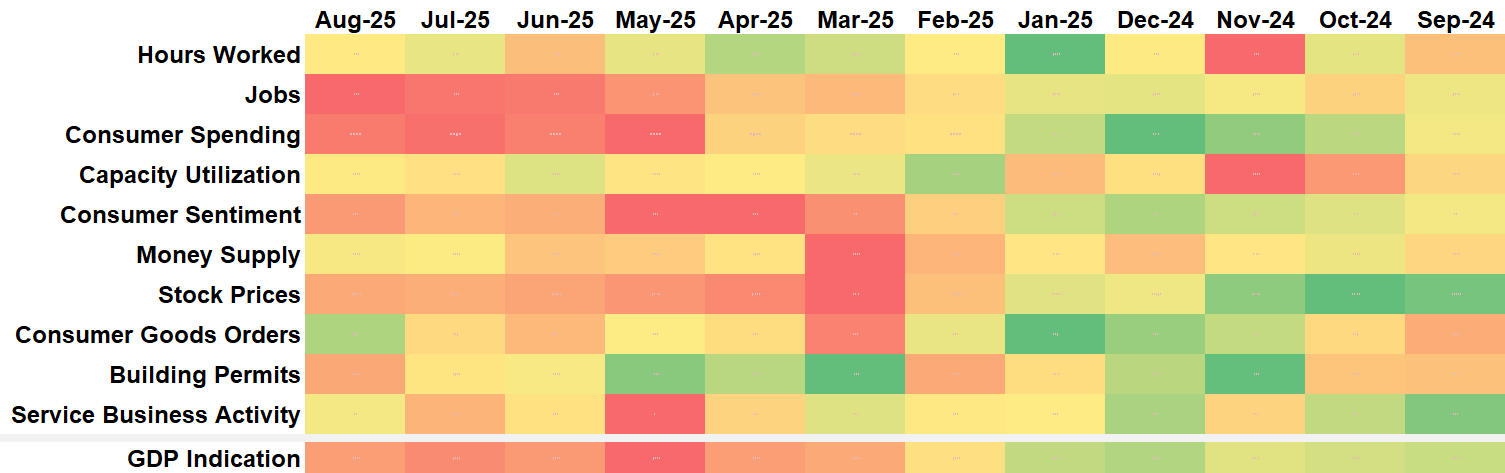
Our heatmap highlights the areas that are the biggest concerns – jobs and consumer spending are at the top of the "concerns" list.
Our economic model remains bearish. This is because the expected growth rate of the economy is tracking levels which do not support earnings growth — especially earnings growth that is expected to be above average.
The question of course is whether the AI-led tech companies can continue to have such spectacular earnings growth to offset the slowdown in earnings growth for the rest of the economy. That helped boost stocks in 2024 and so far in 2025, but as we've learned in past bubbles, when the leaders fail, it can be a rapid fall.
I was curious what the current earnings estimates were for the S&P 500 given the weakening economic data. Analysts have dropped their 2025 estimated growth from 16% at the beginning of the year down to 10%. That hasn't hurt stocks because they believe the earnings growth they thought would occur in 2025 is now simply going to occur in 2026.
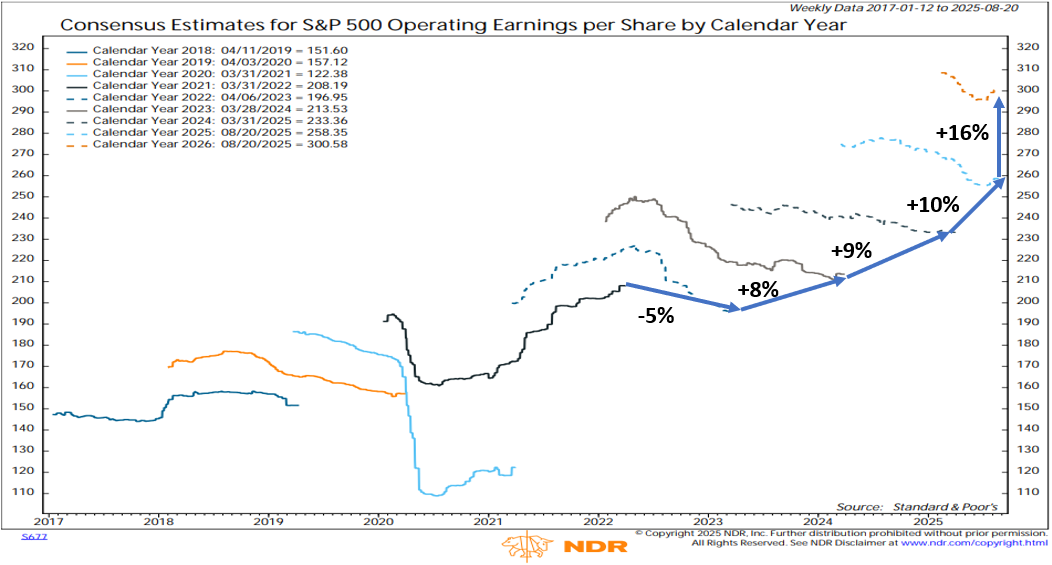
What happens if they are wrong? Remember a mere 5% drop in earnings led to a 20%+ decline in stocks in 2022.
Expensive
“A short quiz: If you plan to eat hamburgers throughout your life and are not a cattle producer, should you wish for higher or lower prices for beef? Likewise, if you are going to buy a car from time to time but are not an auto manufacturer, should you prefer higher or lower car prices? These questions, of course, answer themselves. But now for the final exam: If you expect to be a net saver during the next five years, should you hope for a higher or lower stock market during that period? Many investors get this one wrong. Even though they are going to be net buyers of stocks for many years to come, they are elated when stock prices rise and depressed when they fall. In effect, they rejoice because prices have risen for the ‘hamburgers’ they will soon be buying.”
— Warren Buffett, 1997 Berkshire Hathaway Shareholder Letter
Buy high, sell low — easier said than done
Markets can stay irrational longer than you can stay solvent
Your starting point matters
At SEM we focus on the data. Even though we do not use "fundamental" data points to make decisions, it does help us shape our advice to clients who are nearing a financial event (retirement, big purchase, inheritance, etc.) We know over the long-term the stock market has averaged around a 10% annual return over the long-term. We also know over shorter periods of time, the 10-year annualized return for stocks has been as high as 20% and as low as a negative 4%.
Since 1989, the 10-year average return has been negative 7% of the time. It has been less than 5% over rolling 5-year periods nearly 28% of the time. In other words around 1/4 of the time you should expect returns that are less than half the long-term average.
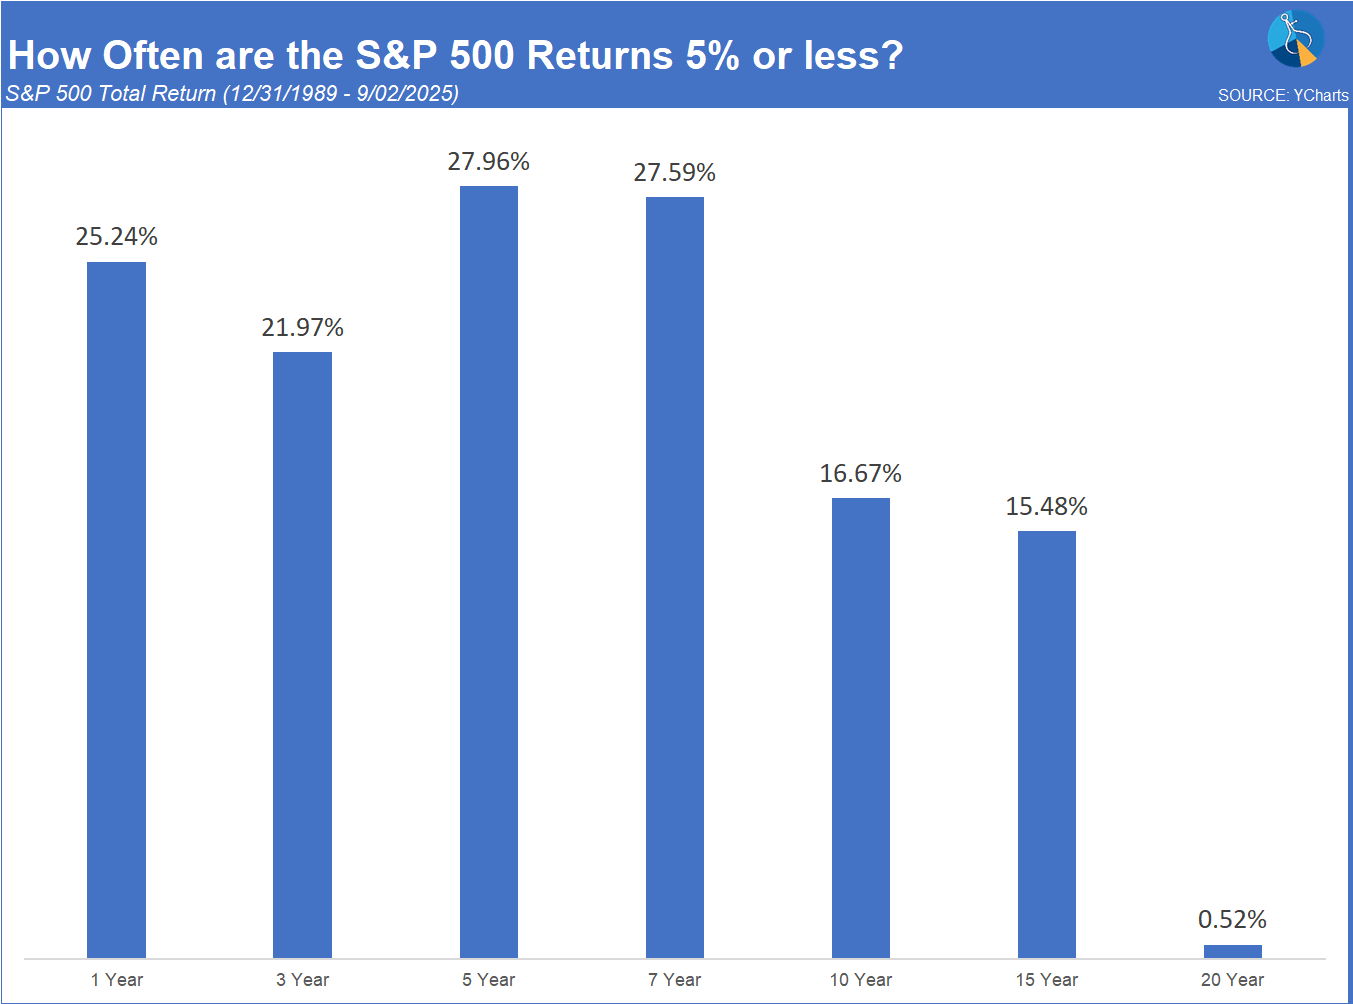
In ALL of the cases where we saw returns of 5% or less over 10 years, the starting point saw valuation levels which were in the upper quintile of historic levels.
By nearly all accounts, the stock market is at those levels, meaning if you buy & hold stocks, you should EXPECT returns of less than half the long-term average over the next 5-10 years. Here are some examples from NDR illustrating how expensive stocks are at the moment.
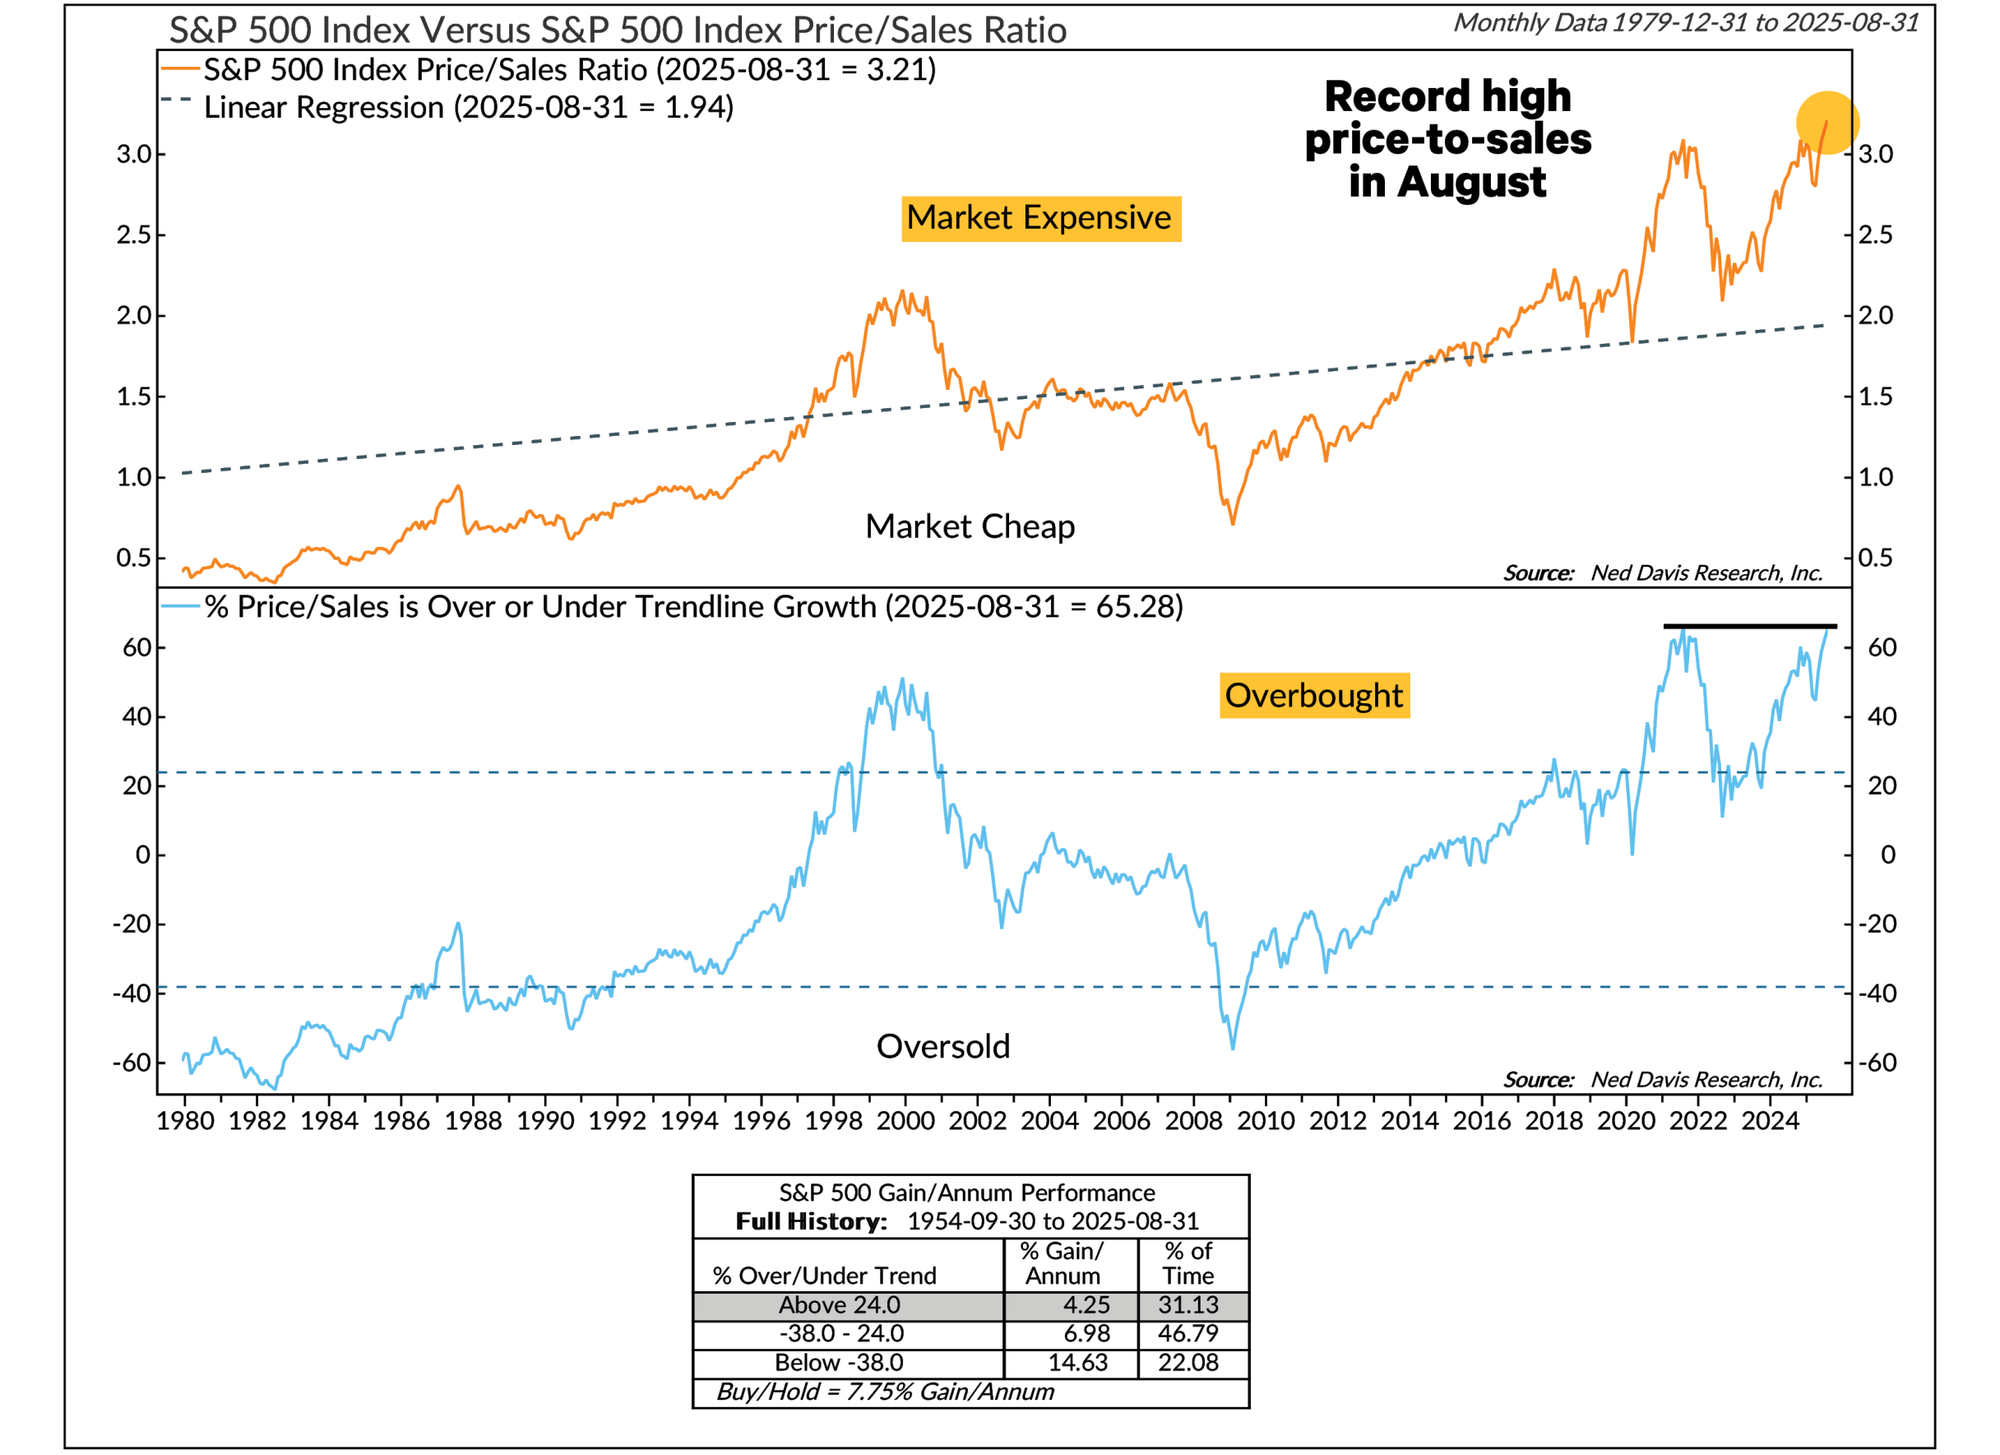
As an accountant, I like the Price/Sales ratio much more than the much more popular Price/Earnings ratio. This is because it is quite easy to make your earnings look better by using a wide range of accounting tricks. This allows companies to "beat" earnings estimates most of the time and post decent enough earnings growth to keep the market happy. It is much harder to manipulate revenue (although companies will try). The Price/Sales is at a level where NDR says we should expect gains around 4% for stocks.
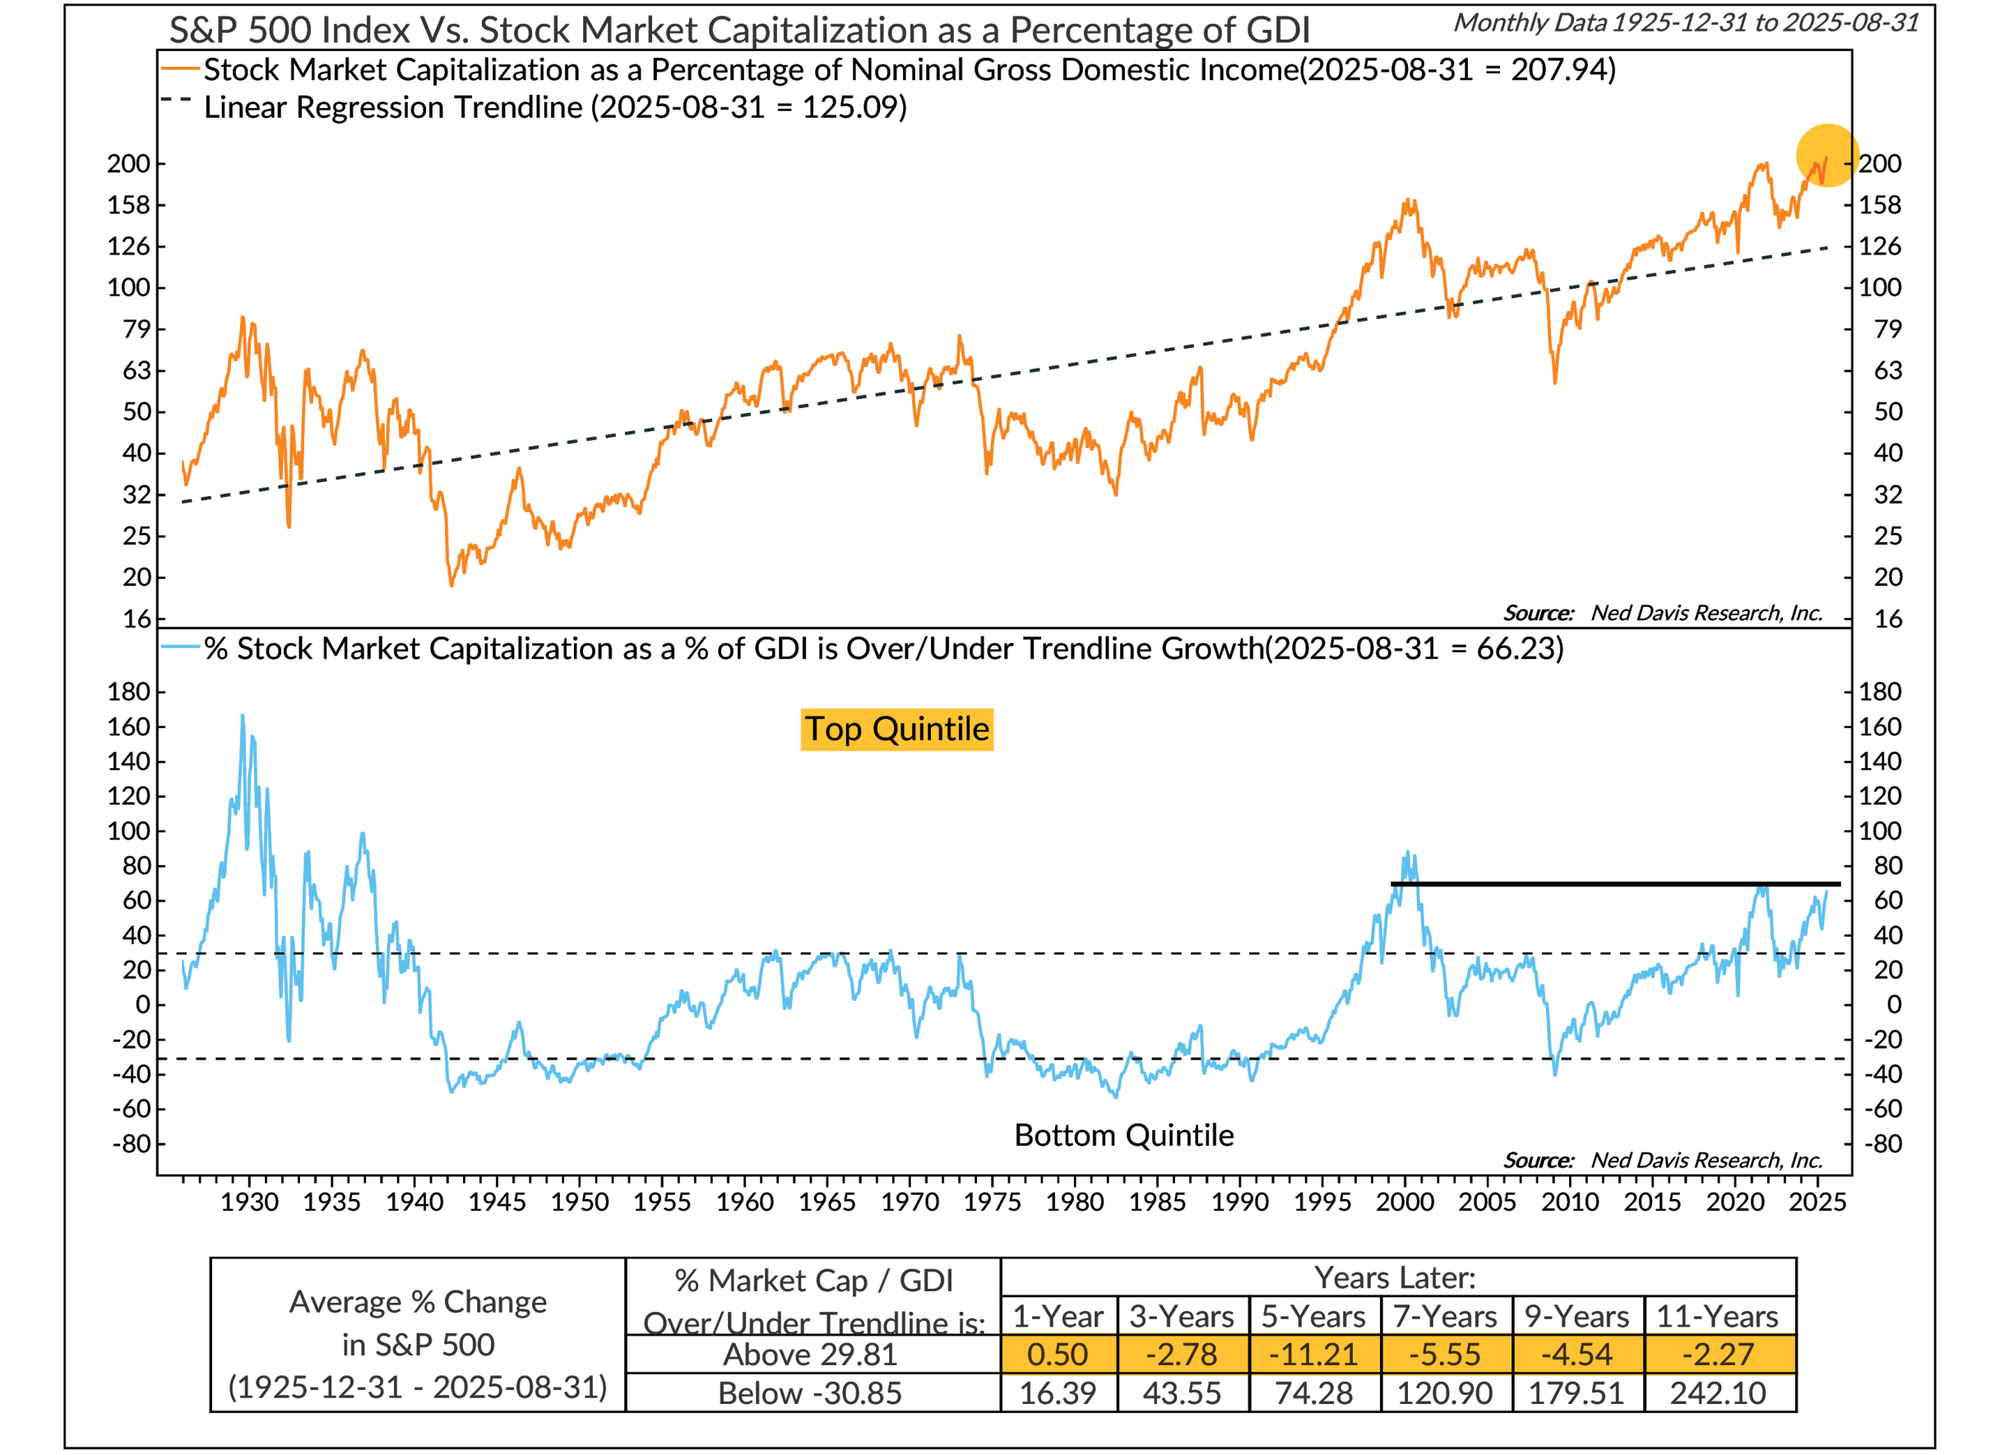
Another measure which cannot be manipulated is the market capitalization as a percentage of Gross Domestic Income (GDI). This is a similar concept to the famous "Buffett Indicator" which measures Market Capitalization to Gross Domestic Product (GDP). NDR uses GDI because it is more stable and subject to less revisions. It represents all income produced in the US. Regardless of which indicator is used, the concept is economically sound: The stock market is a measure of EXPECTED growth versus the current level of output/income. Since all economies go through recessions, a stock market cannot ALWAYS be worth more than the underlying economy, so the market will go through a correction.
Both the Buffett Indicator and NDRs Market Cap to GDI are at all-time high levels. During all other periods when it was this high, the annualized return for stocks has been NEGATIVE over 3, 5, 7, & 10 year rolling periods.
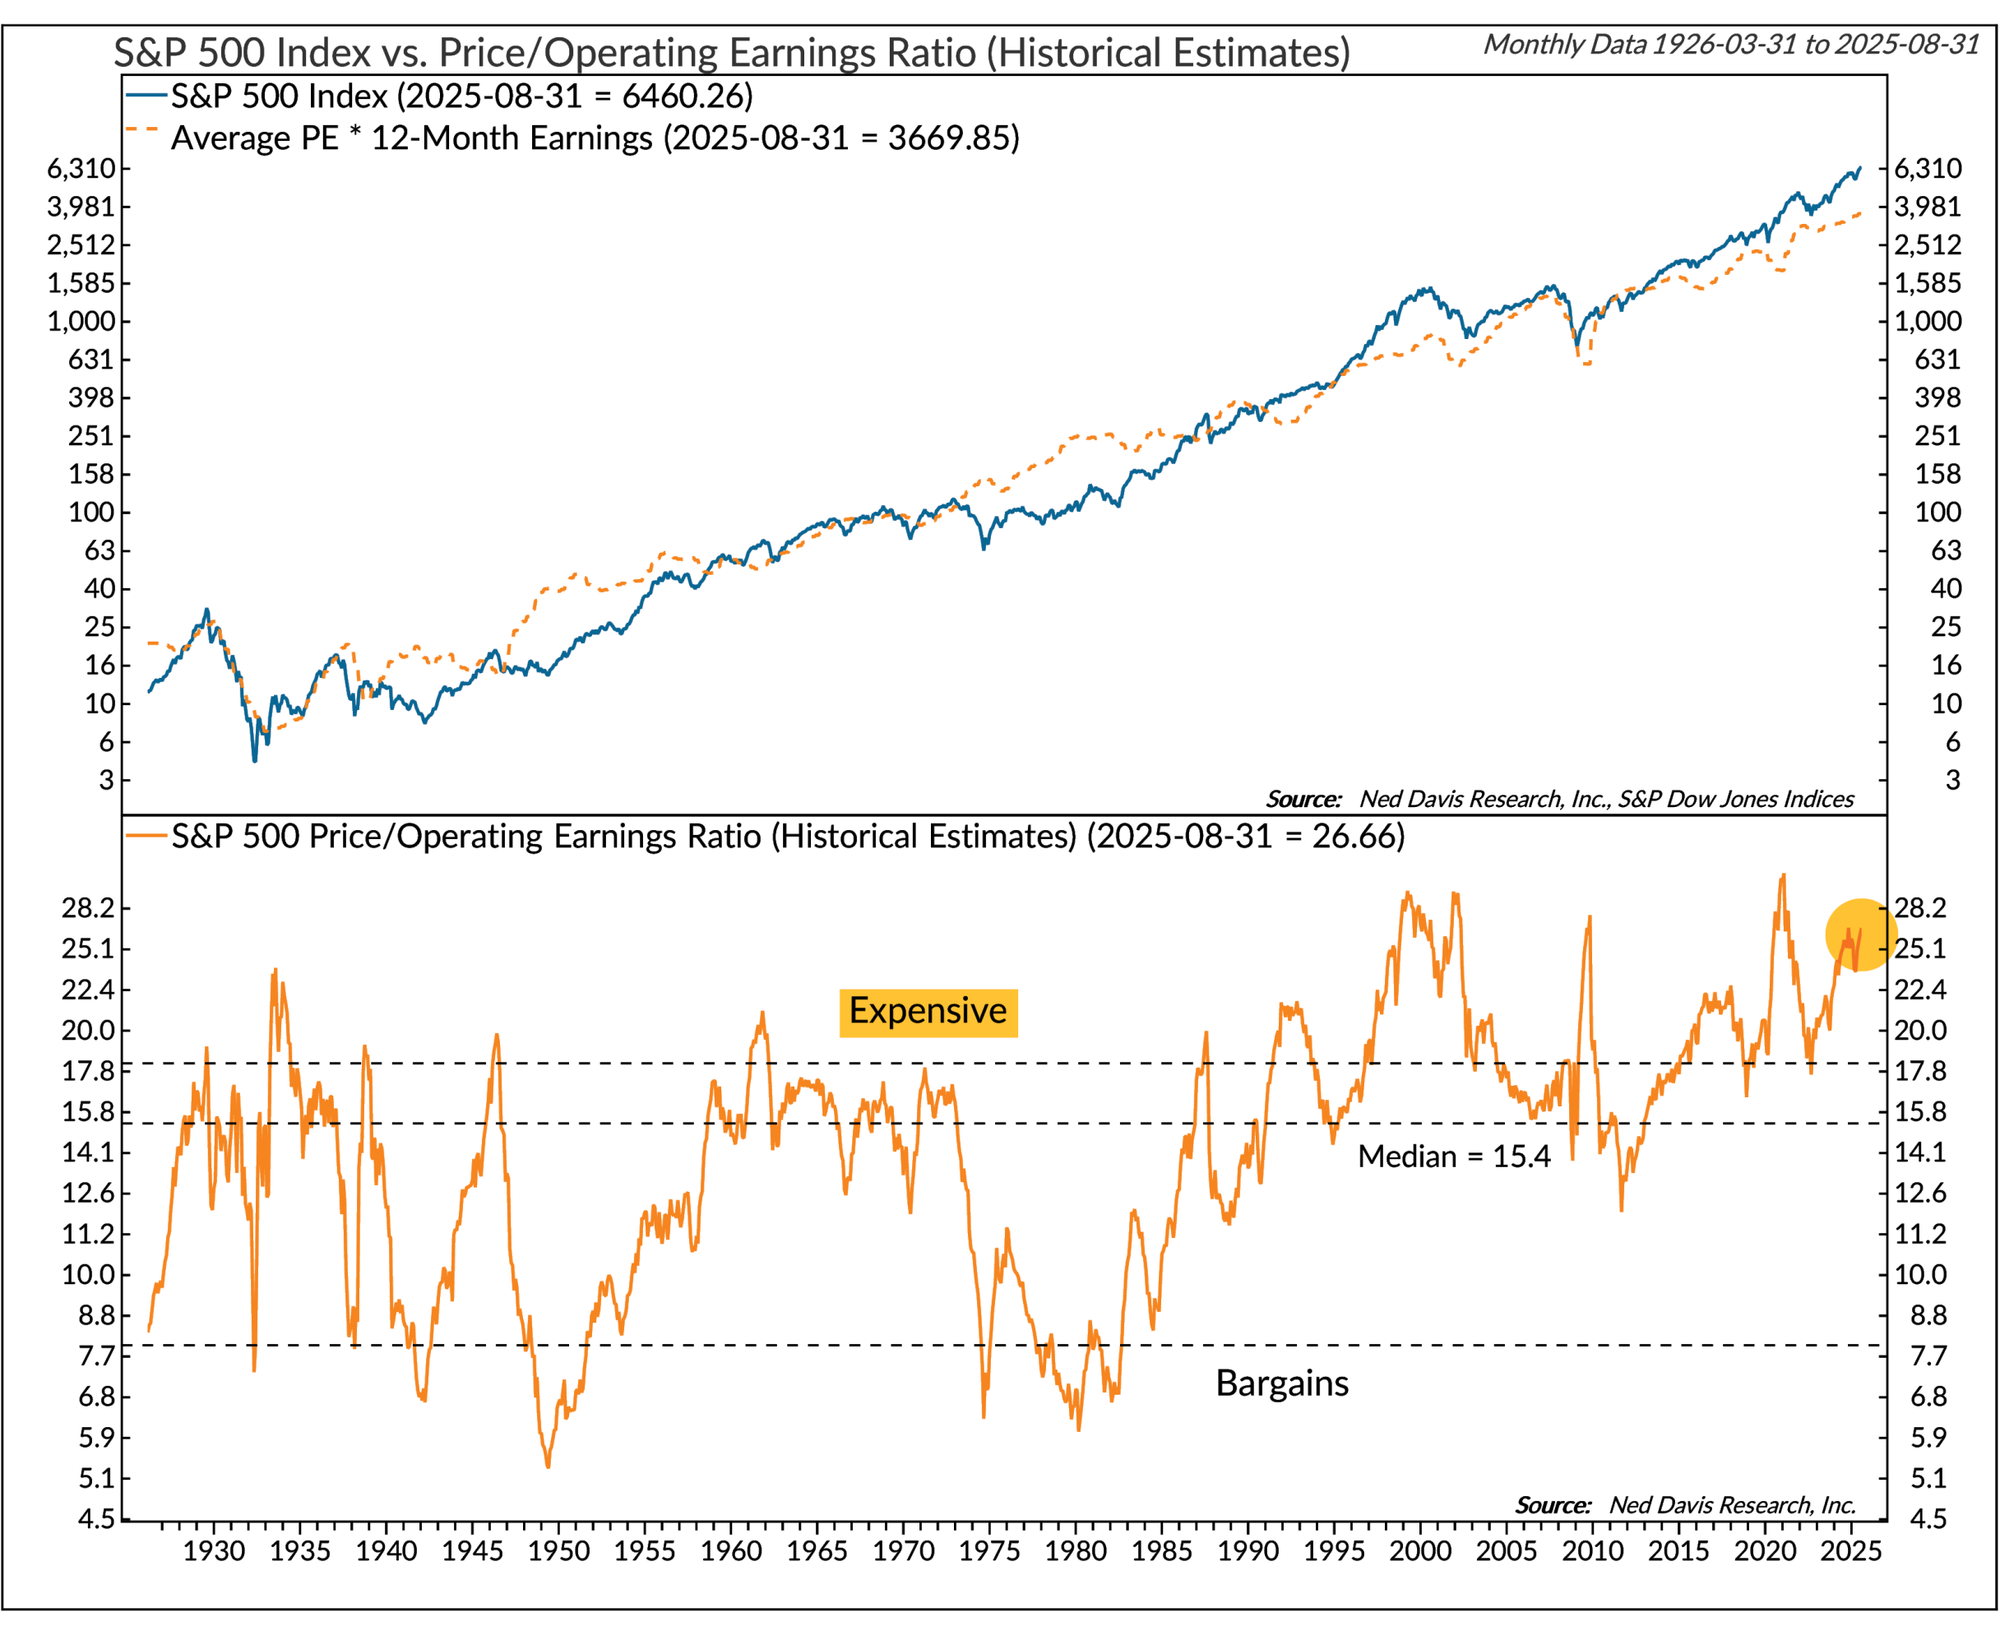
Finally, even though I don't like using P/E even that ratio is at a level we've rarely experienced (2021, 2011, 2000, 1934). All those periods saw a decline in valuations. Is it different this time or will the market again punish those who are chasing stocks simply because prices have been rising?
This only really matters if you have a time horizon of less than 10 years or are looking to allocate a significant amount of money out of lower risk investments into the stock market. If you're already fully invested and don't need the money in the next 10 years, the only thing you need to do is EXPECT returns that will likely be 5% or less (or even negative). If that is something you aren't comfortable with, you may want to talk to your advisor about ways SEM's risk managed models can help navigate what could be some rough roads ahead.
Closing Thoughts
We’re not trying to scare anyone, but we do want to be realistic. The data continues to point to an economy that is slowing......and a stock market that is priced for perfection. If you’re fully invested and have a long time horizon, this may not matter much. But if you’re nearing retirement, planning a major purchase, or just uncomfortable with the idea of below-average returns for the next 5–10 years, now is a good time to review your plan. At SEM, we’re not trying to guess what happens next......we’re focused on the DATA, managing risk and helping our clients stay on track no matter what the market throws at us.
📅 Economic Events – Week of September 8–12, 2025
| Date | Time (ET) | Event |
|---|---|---|
| Mon, Sep 8 | 10:00 AM | Employment Trends (Aug) |
| 3:00 PM | Consumer Credit (Jul) | |
| Tue, Sep 9 | 6:00 AM | NFIB Small Business Optimism (Aug) |
| 7:45 AM | ICSC Weekly Retail Sales | |
| 8:55 AM | Johnson/Redbook Weekly Sales | |
| 1:00 PM | 3-Year Treasury Note Auction ($58B) | |
| 4:30 PM | API Weekly Inventory Data | |
| Wed, Sep 10 | 7:00 AM | MBA Mortgage Applications |
| 8:30 AM | Producer Price Index (PPI) – Aug | |
| 10:00 AM | Wholesale Inventories (Jul) | |
| 10:30 AM | DOE Weekly Inventory Data | |
| 1:00 PM | 10-Year Treasury Note Auction ($42B) | |
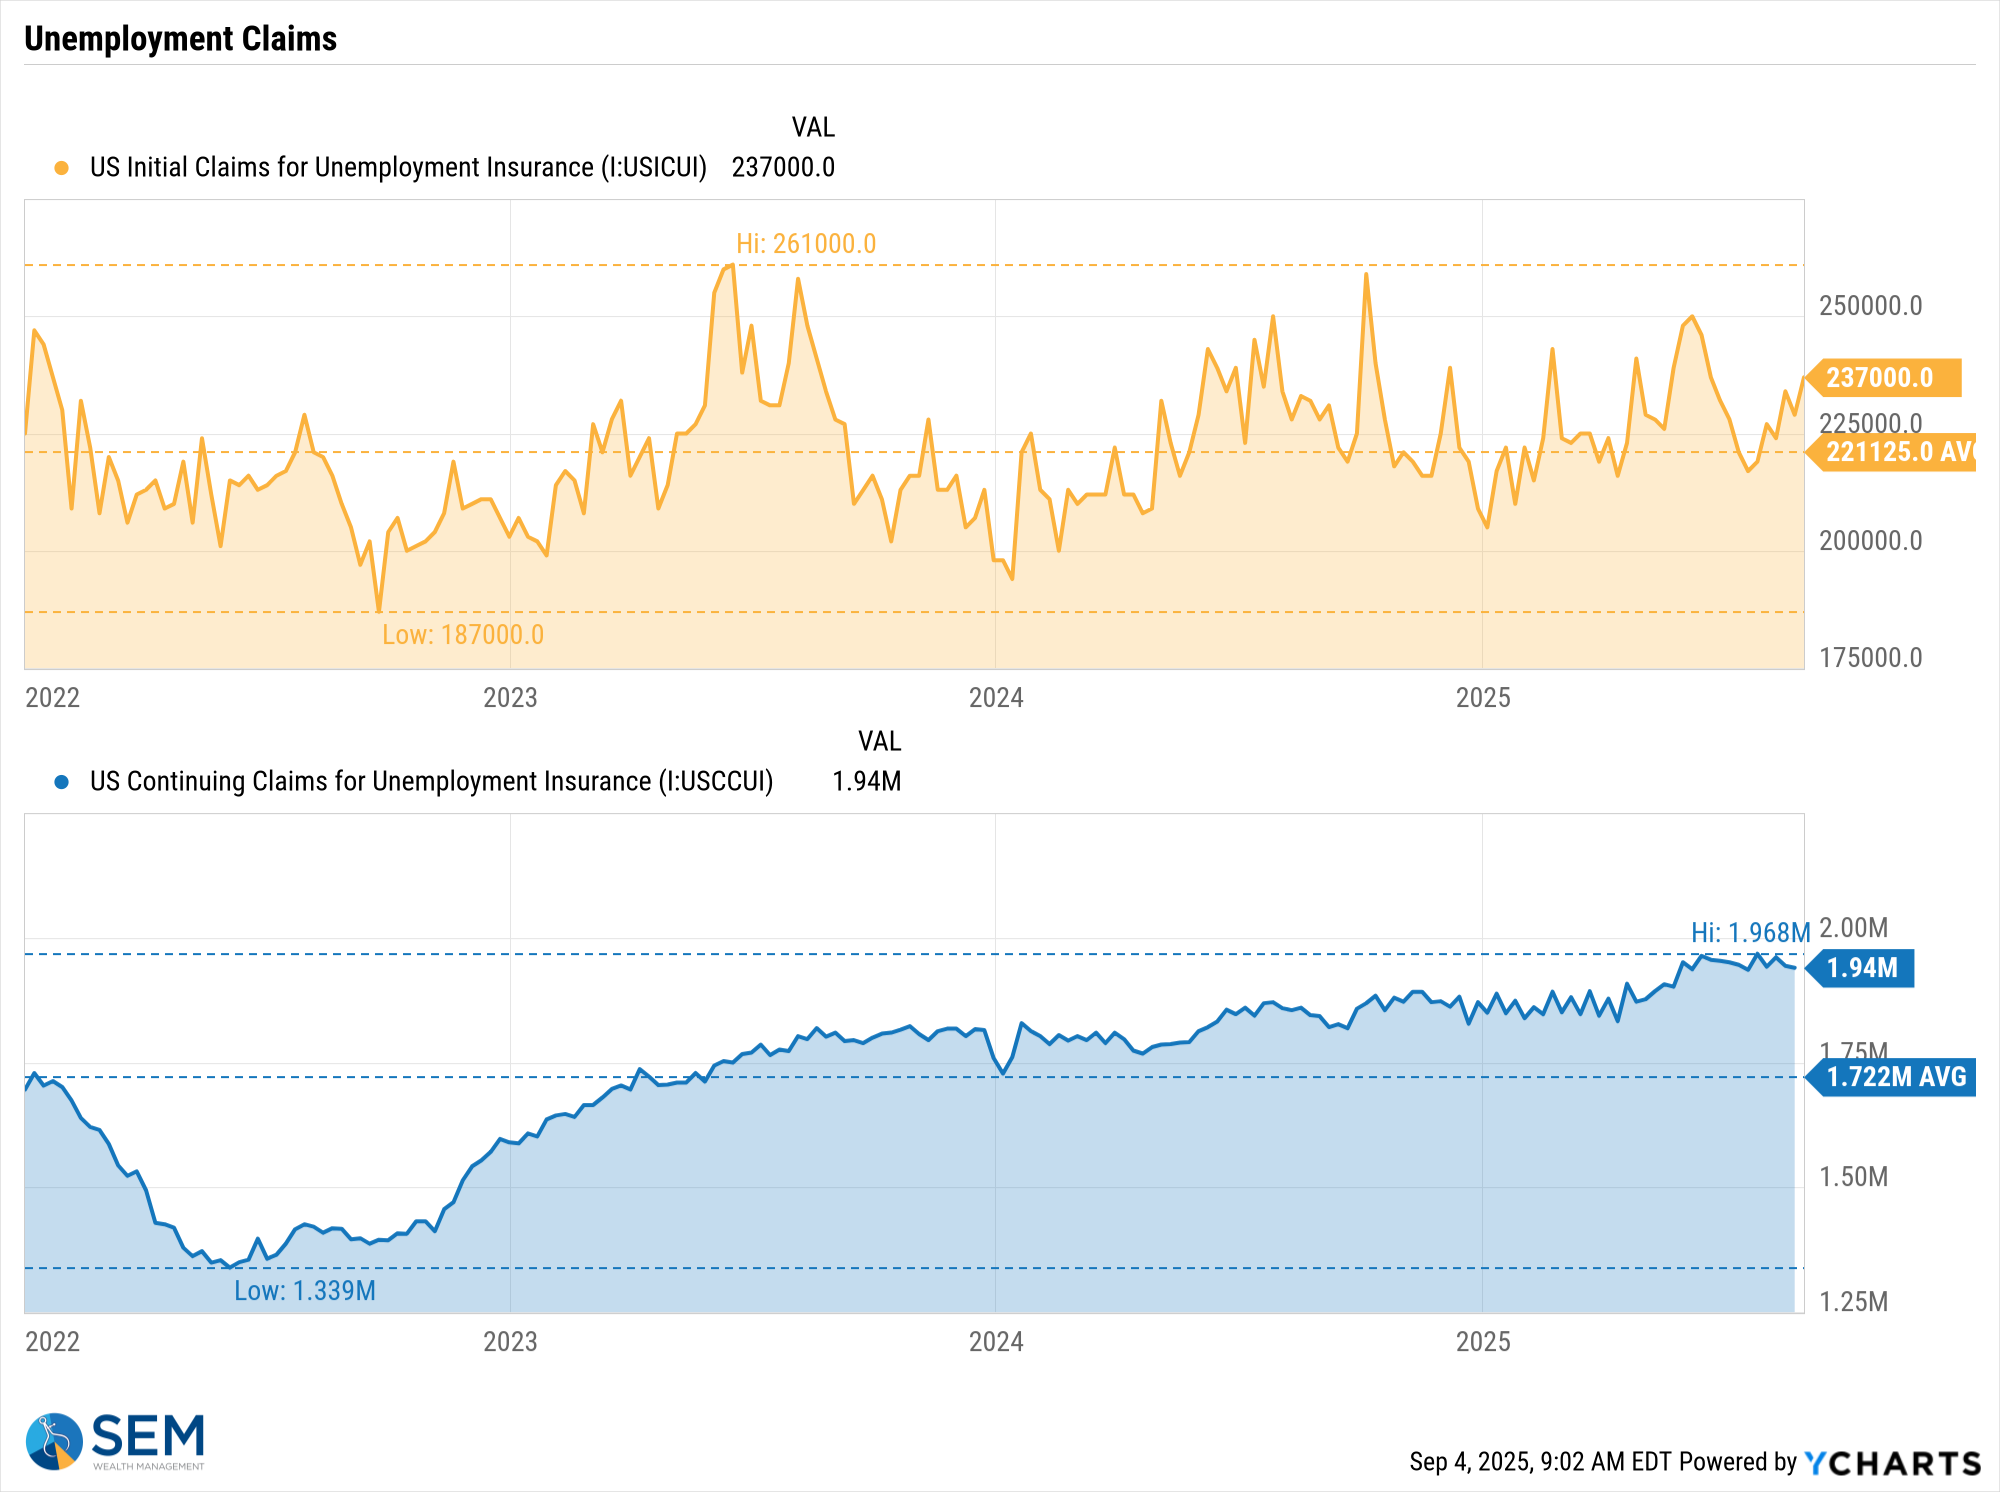
| Thu, Sep 11 | 8:30 AM | Weekly Jobless Claims |
| 8:30 AM | Consumer Price Index (CPI) – Aug | |
| 10:30 AM | EIA Natural Gas Inventory | |
| 11:00 AM | Cleveland Fed CPI (Aug) | |
| 1:00 PM | 30-Year Treasury Bond Auction ($25B) | |
| 2:00 PM | Federal Budget (Aug) | |
| Fri, Sep 12 | 10:00 AM | Univ. of Michigan Sentiment (Prelim – Sep) |
| 12:00 PM | WASDE Crop Report | |
| 1:00 PM | Baker Hughes Rig Count |
💼 Key Earnings Reports – Week of September 8–12, 2025
| Date | Company | Time |
|---|---|---|
| Mon, Sep 8 | DLNG, PL, TOYO | Before Open |
| ABVX, AVO, CASY, MAMA | After Close | |
| Tue, Sep 9 | GME, FCEL, KFY, CNM | Mixed Times |
| Wed, Sep 10 | ADBE, CHWY, TEN | Mixed Times |
| Thu, Sep 11 | KR, LOVE, VRA | Before Open |
| FARM, RENT, ZENV | After Close | |
| Fri, Sep 12 | QSG, VALU | Mixed Times |
Toby's Take
(a weekly summary of WSJ articles our intern Toby found interesting)
9/02/25
Support for MAHA and Kennedy is wavering because of his political decisions like hiring, firing, and rehiring of Dr. Vinay Prasad and the recent takes on Covid Vaccines. If we have any models that invest in the United States or any healthcare stocks like Pfizer, they could struggle because they are directly linked with the Covid vaccine.
The Turmoil Inside MAHA Is About More Than Just Vaccines - WSJ
9/3/25
Companies are reaching more and more into the automation world causing income and their stocks to rise. Some companies like C.H. Robinson Worldwide had a reported drop in revenue, yet still came out with higher profit margins because they are getting increased productivity and less head count. SEM needs to be watching stocks and sectors that have to do with manufacturing of any good because this is going to start looking like the new norm causing stocks to possibly spike.
Behind This Season’s Bumper Earnings: Job Cuts, Price Hikes, Glum Workers - WSJ
9/4/25
A company called TurbineOne has put AI into the battlefield for soldiers to be able to easily access information. They can find out where enemy drones, sites, or forces are and quickly get an answer on how to handle the situation without waiting for their analysts to get back to them. This could be huge for both the Patriot model and our Digital Asset Portfolio model because we are reaching into a whole new usage of AI.
Market Charts
After starting the week on a negative note, stocks had a strong week going before the jobs report on Friday.
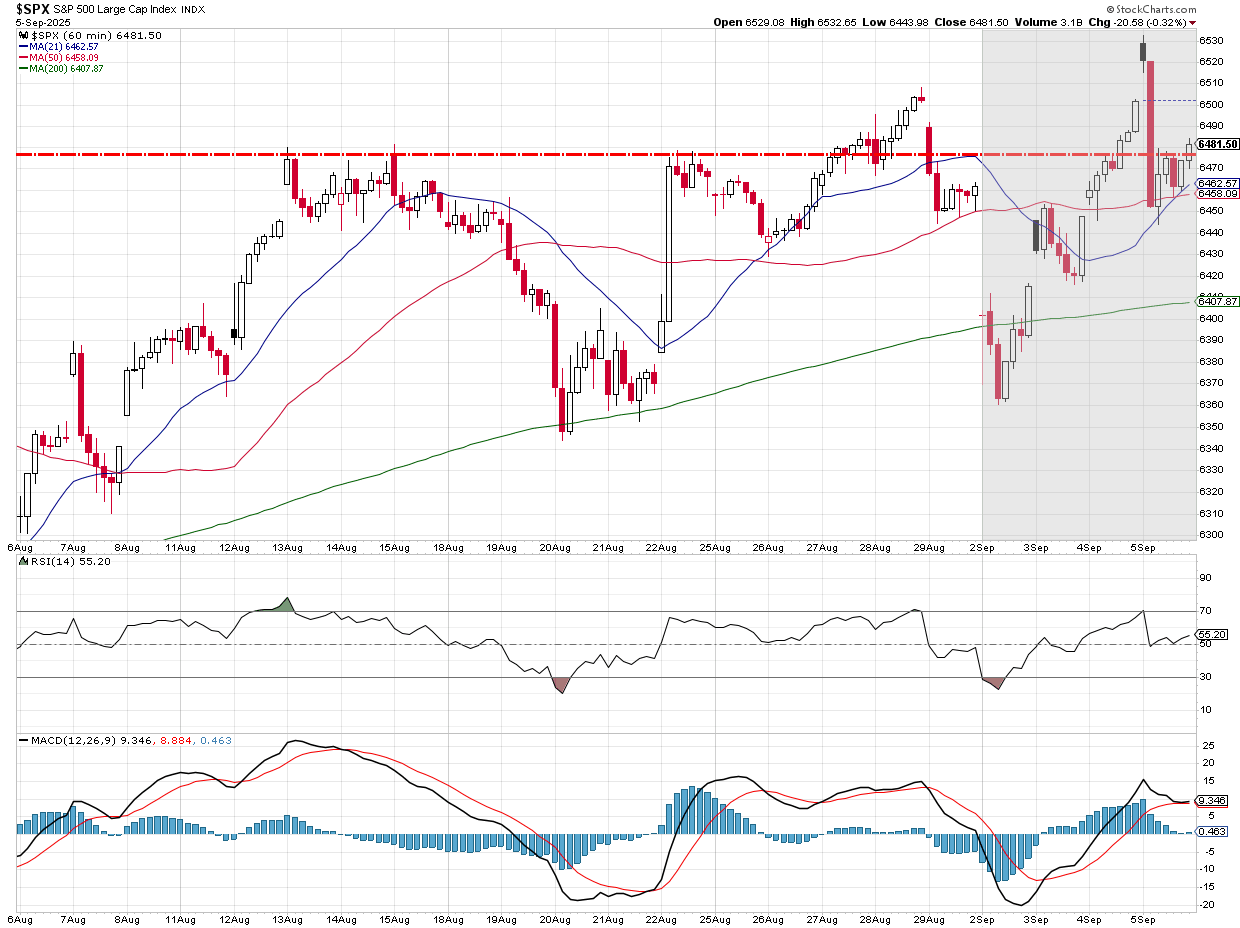
With basically another flat week, the S&P 500 is still in an uptrend, but the momentum is clearly slowing. A consolidation period wouldn't necessarily be a bad thing given the run we've seen since late April.
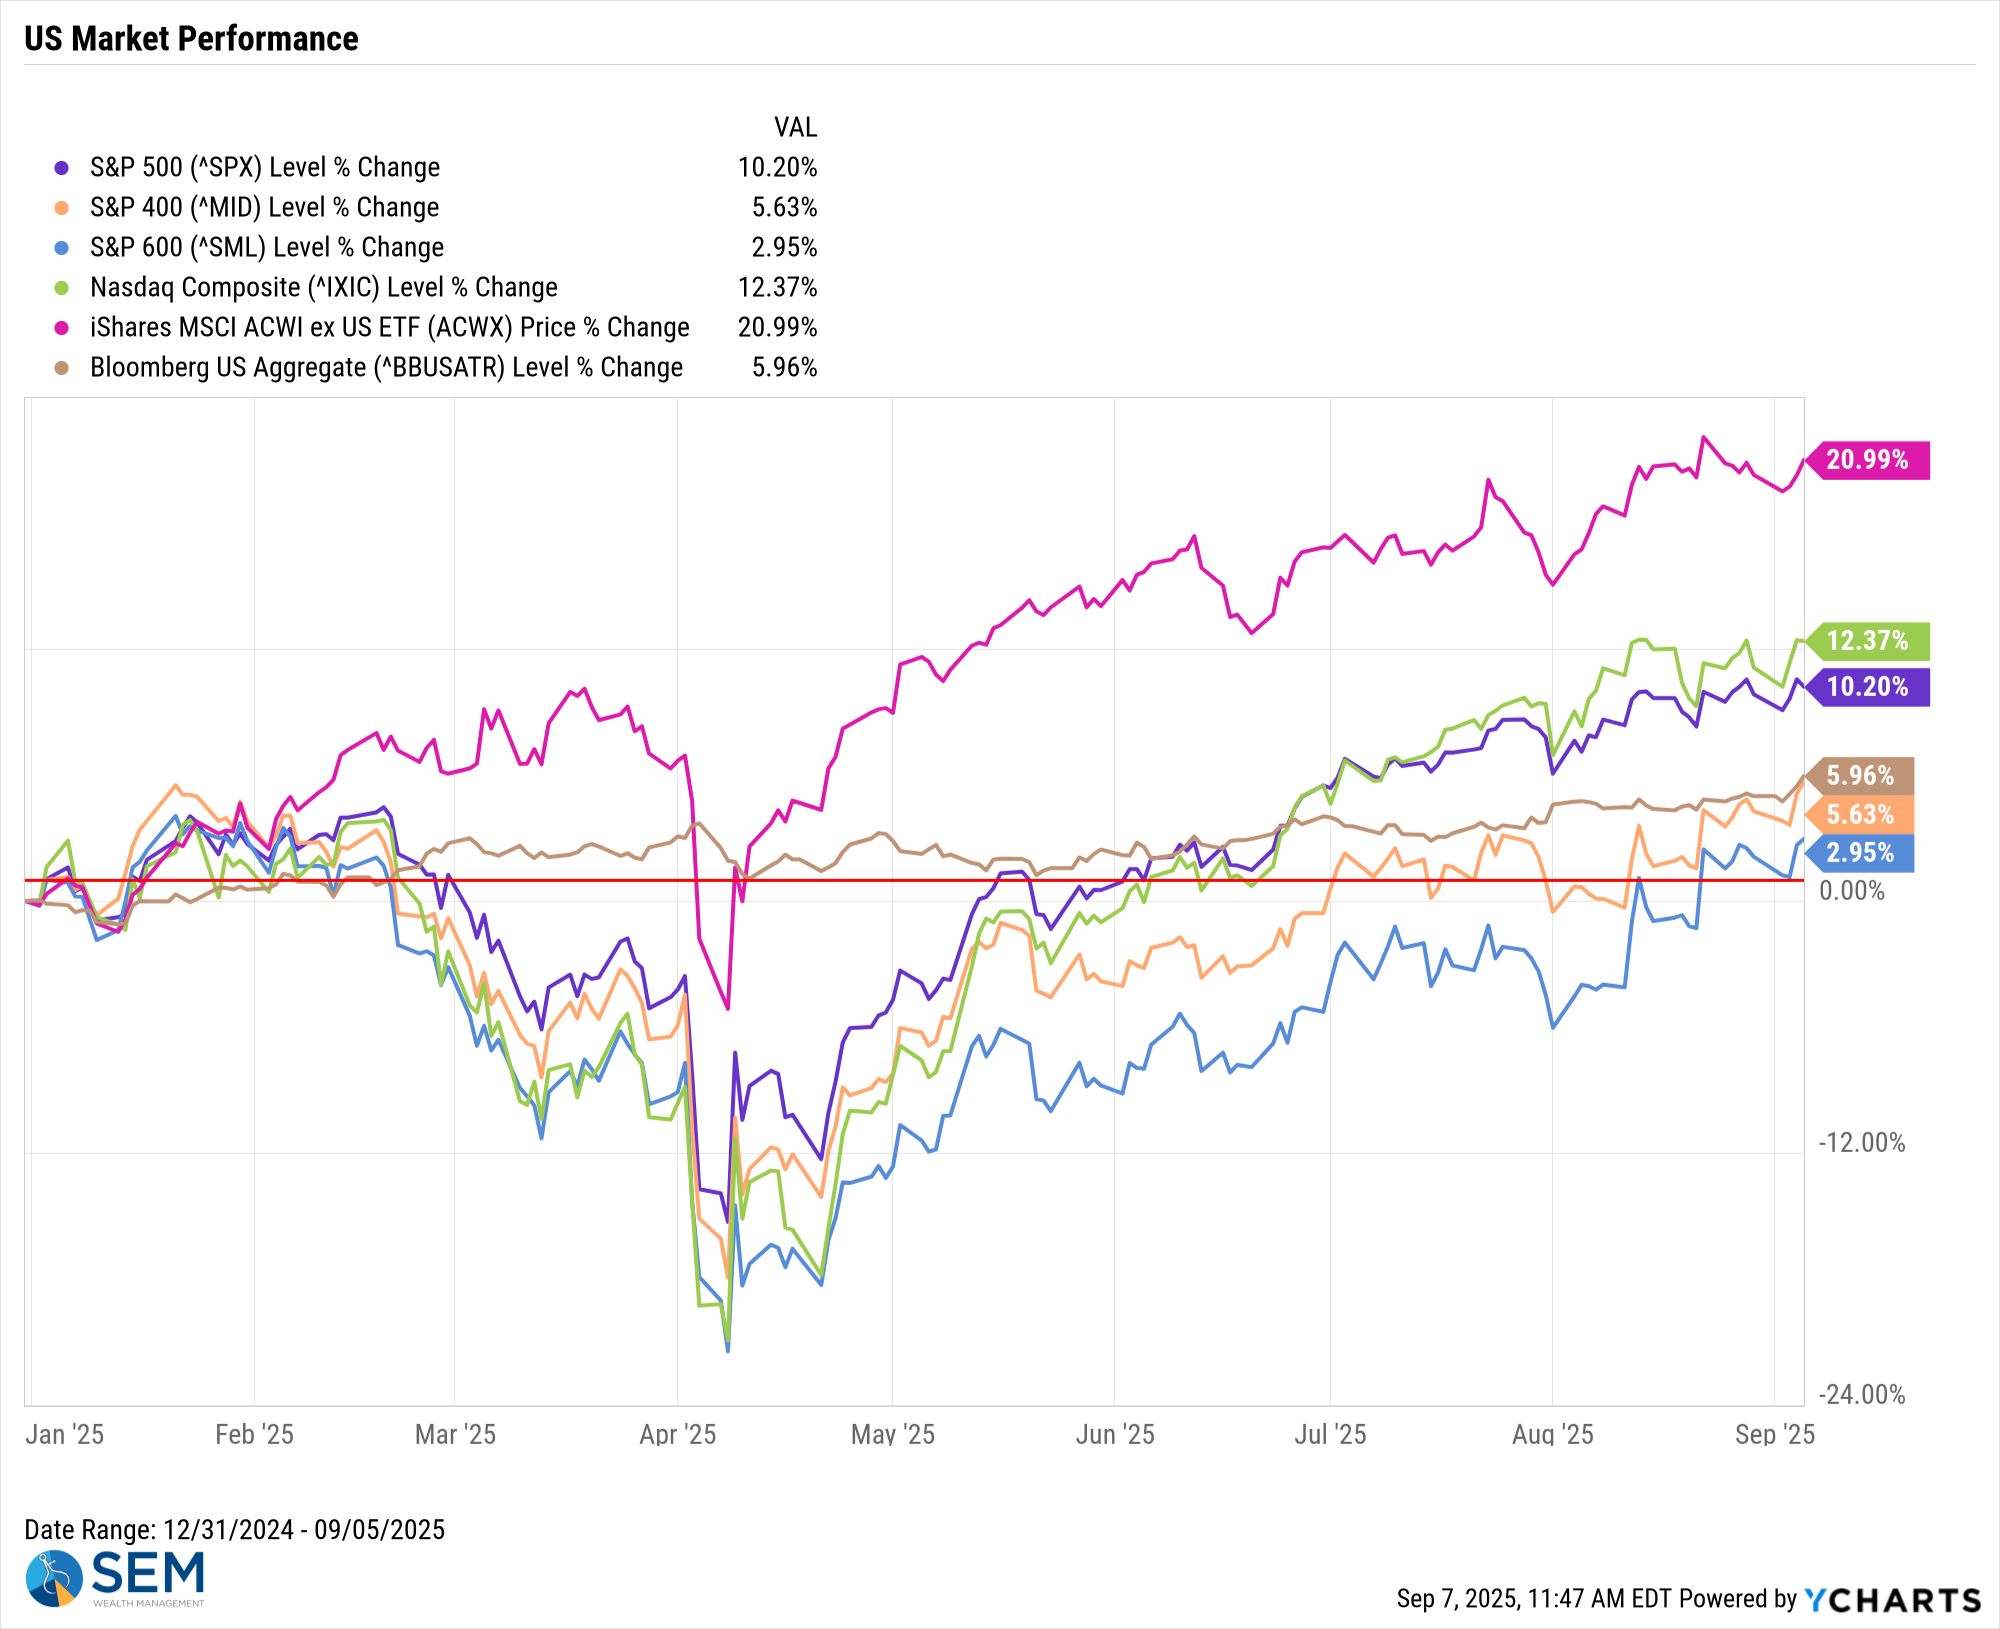
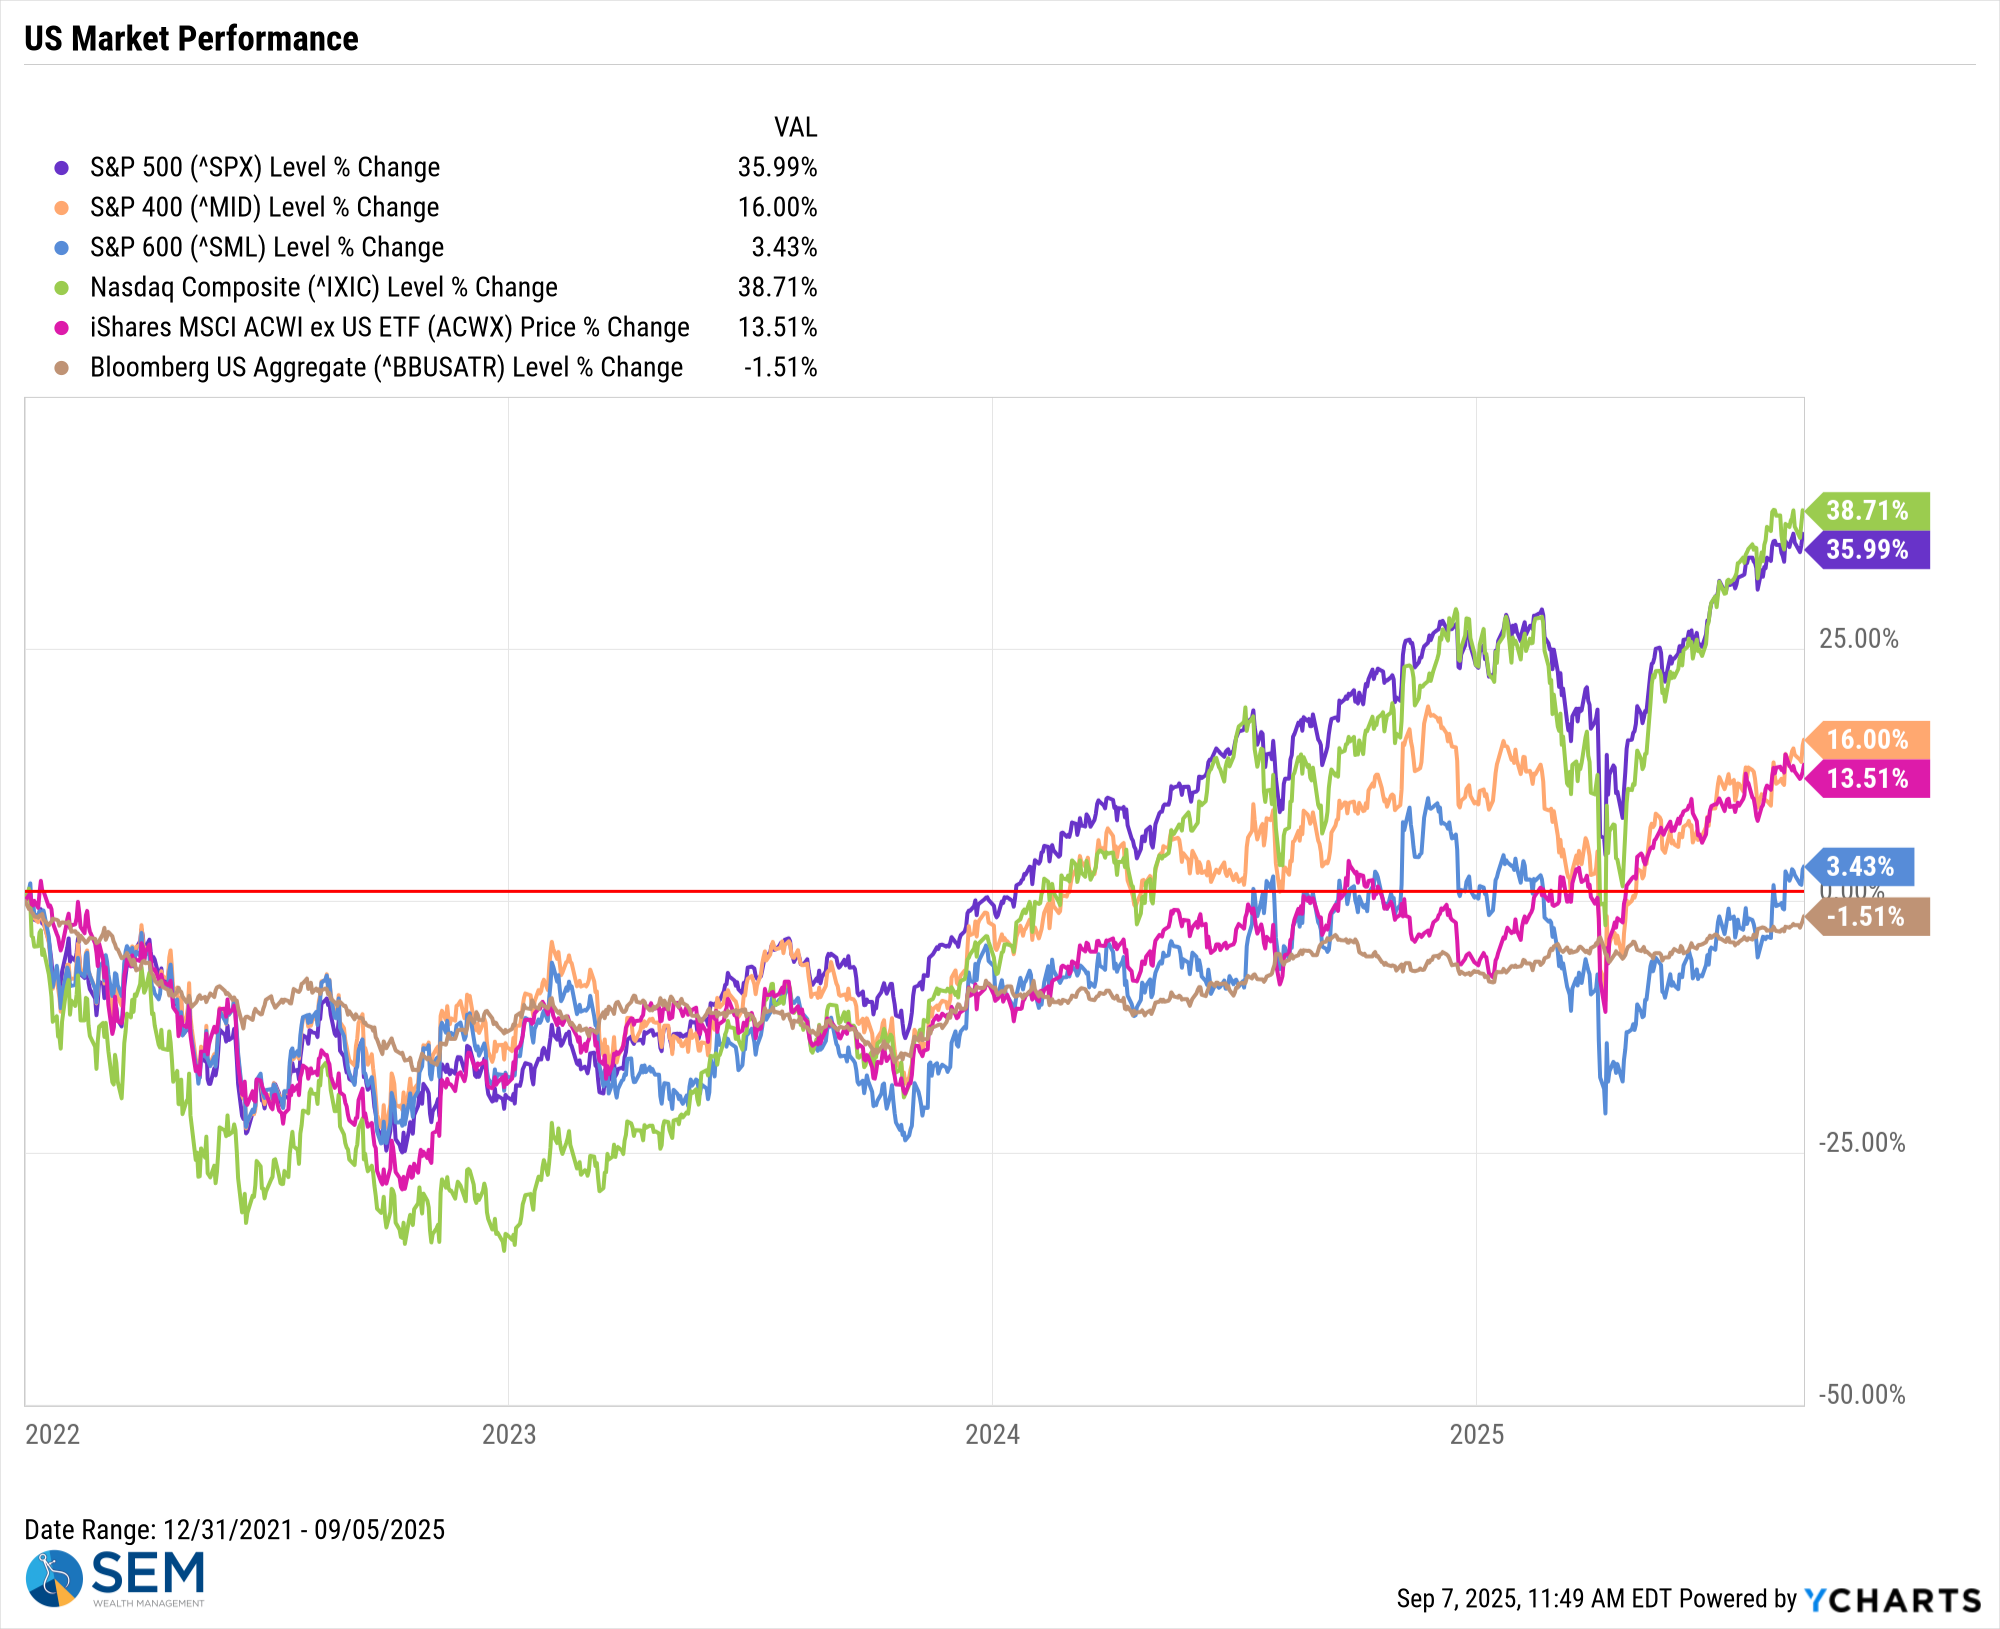
Looking at broader indices, we can see a wide range of returns, with small and mid-caps continuing to lag the mega cap stocks.
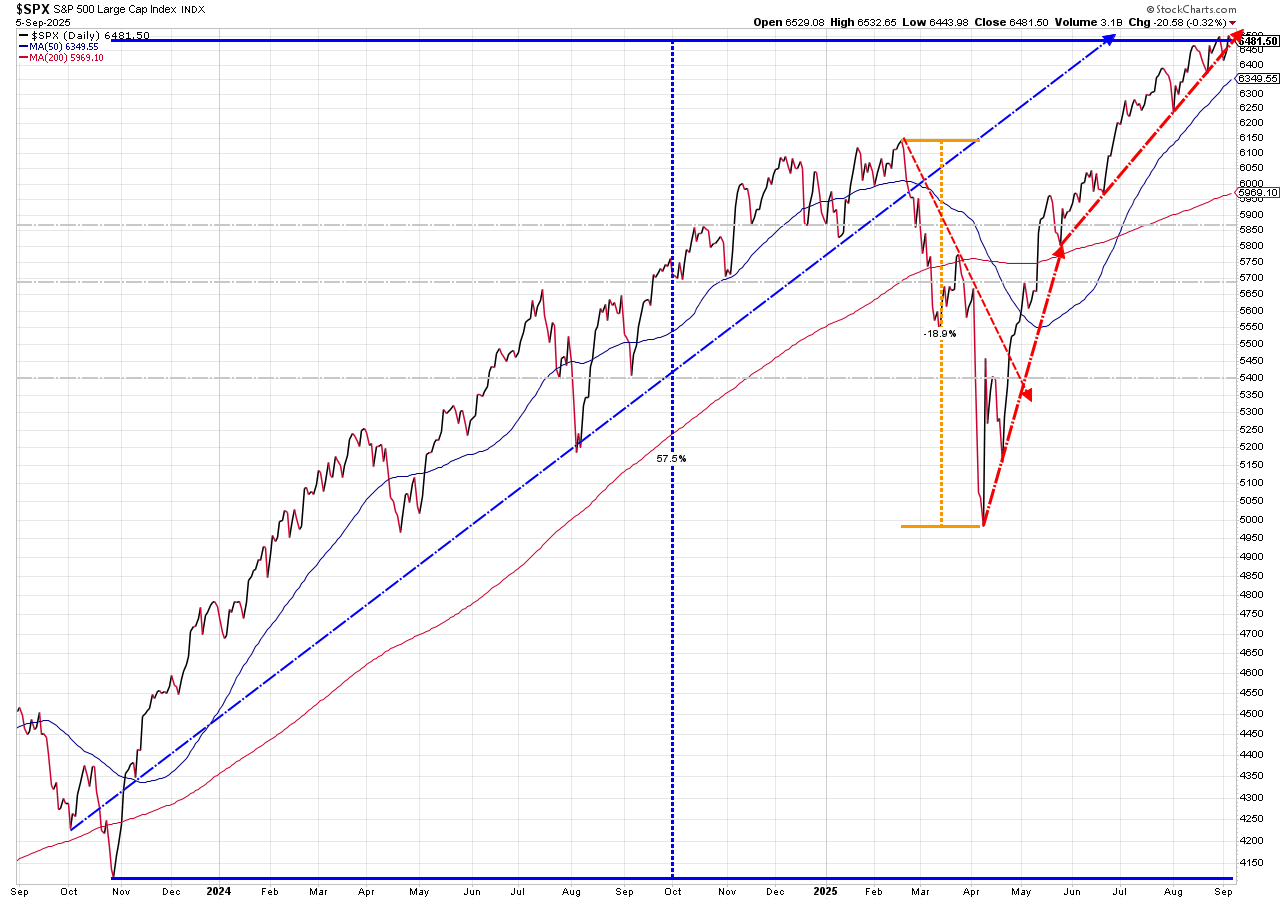
Considering we are back above the 2021 peak valuation levels, I thought it'd be interesting to look at investment performance going back to the end of 2021.
The S&P 500 has annualized a 8.5% gain since then — below average, but respectable. Note, however, bonds are NEGATIVE over the 3 3/4 year holding time frame and small caps are only up 3% total over that time. The question remains, are we in a "new" AI driven market and economy where we can push valuations to unprecedented levels without any sort of market correction, or are we about to endure another 3 year period of below average returns?
Subjectively answering that question could play a significant role in your overall financial plan. We instead chose to let the data drive our decisions.
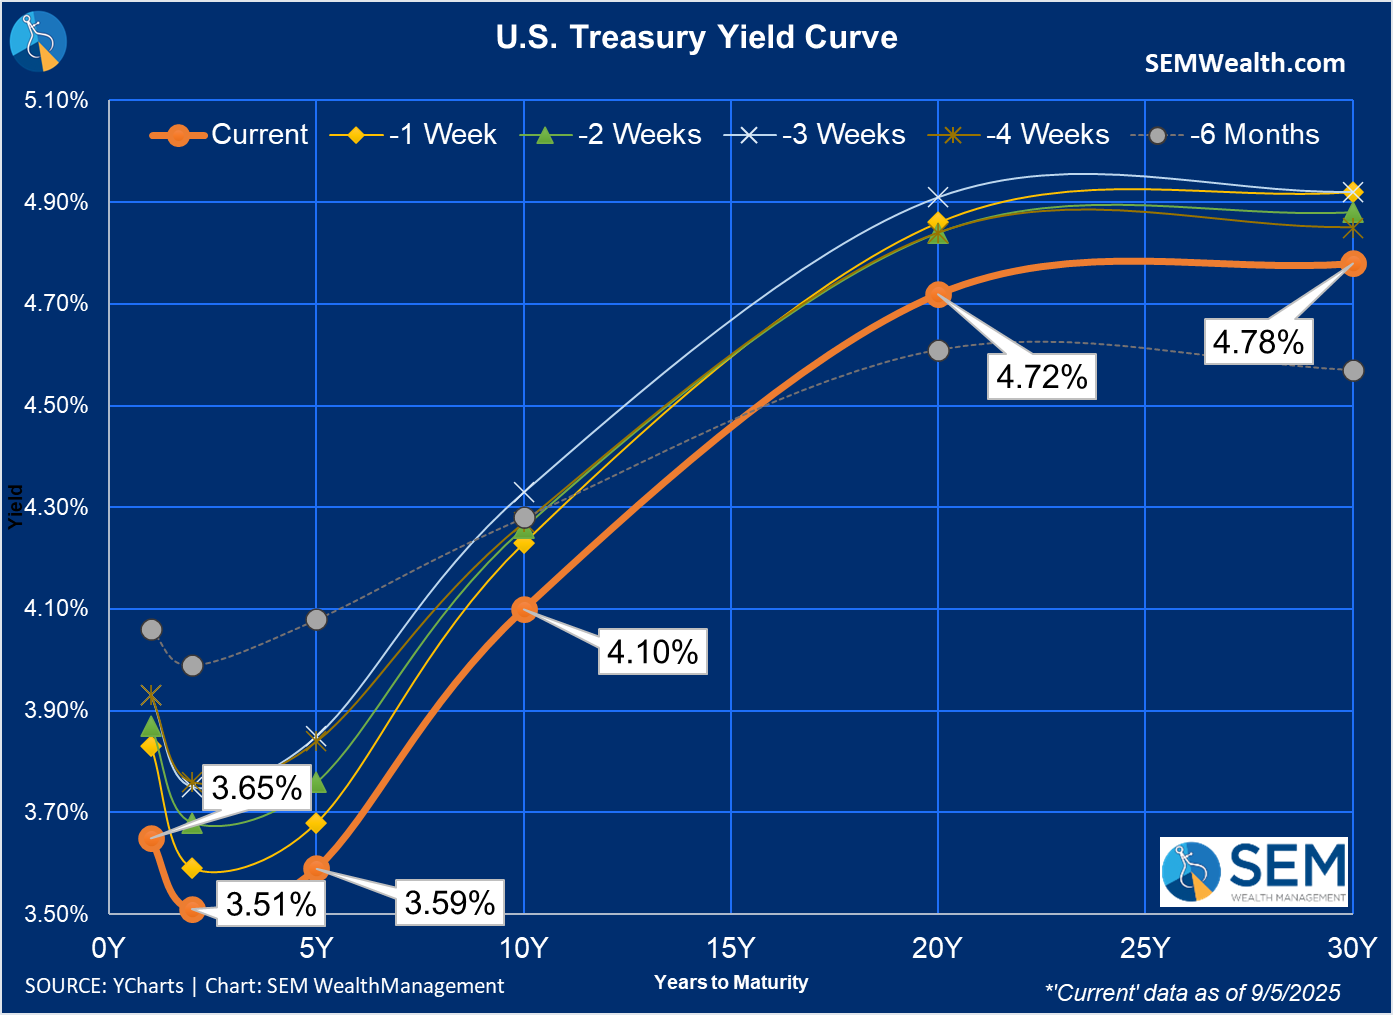
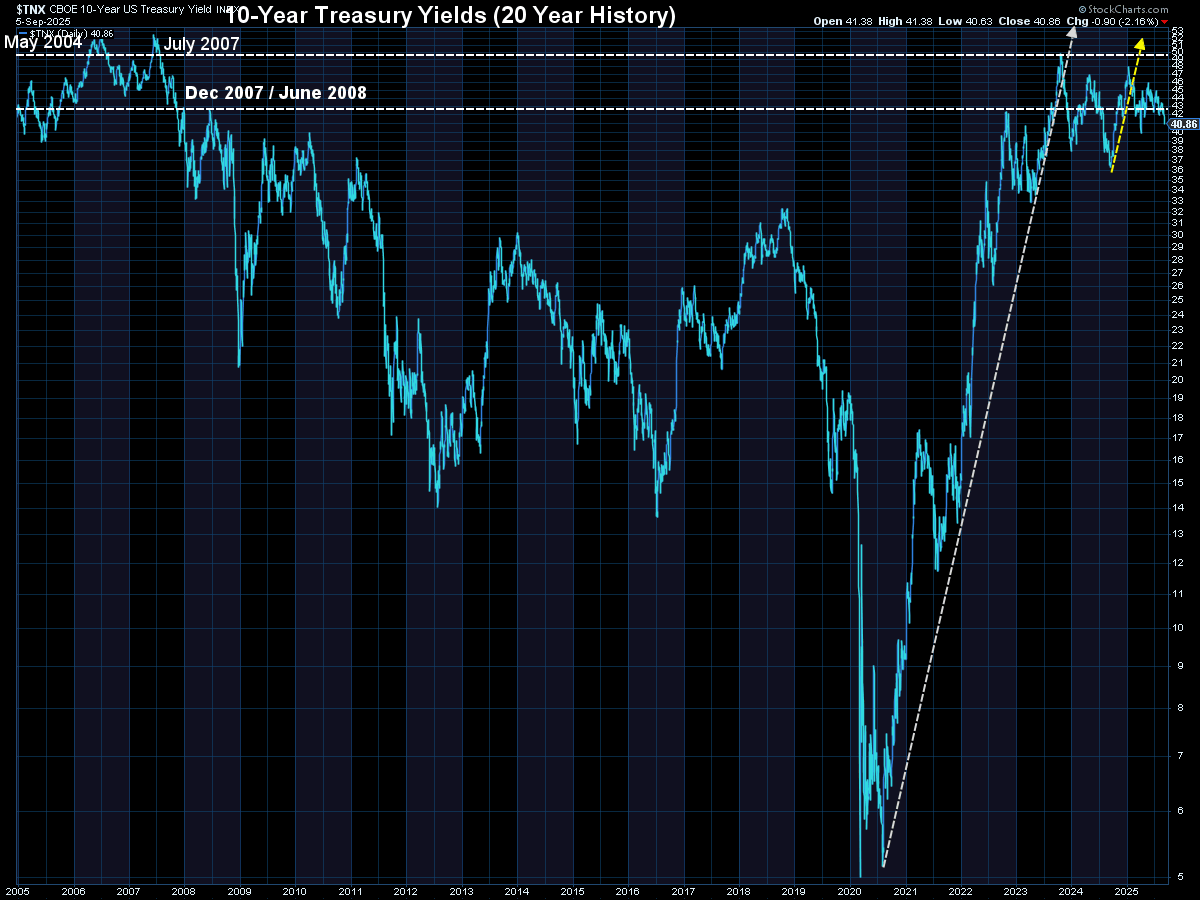
The drop in yields on Friday was encouraging in terms of dropping yields back near 4% on the 10-year.
SEM Market Positioning
| Model Style | Current Stance | Notes |
|---|---|---|
| Tactical | 100% high yield | High-yield spreads holding, but trend is slowing-watching closely |
| Dynamic | Bearish | Economic model turned red – leaning defensive |
| Strategic | Slight under-weight | Trend overlay shaved 10 % equity in April -- added 5% back early July |
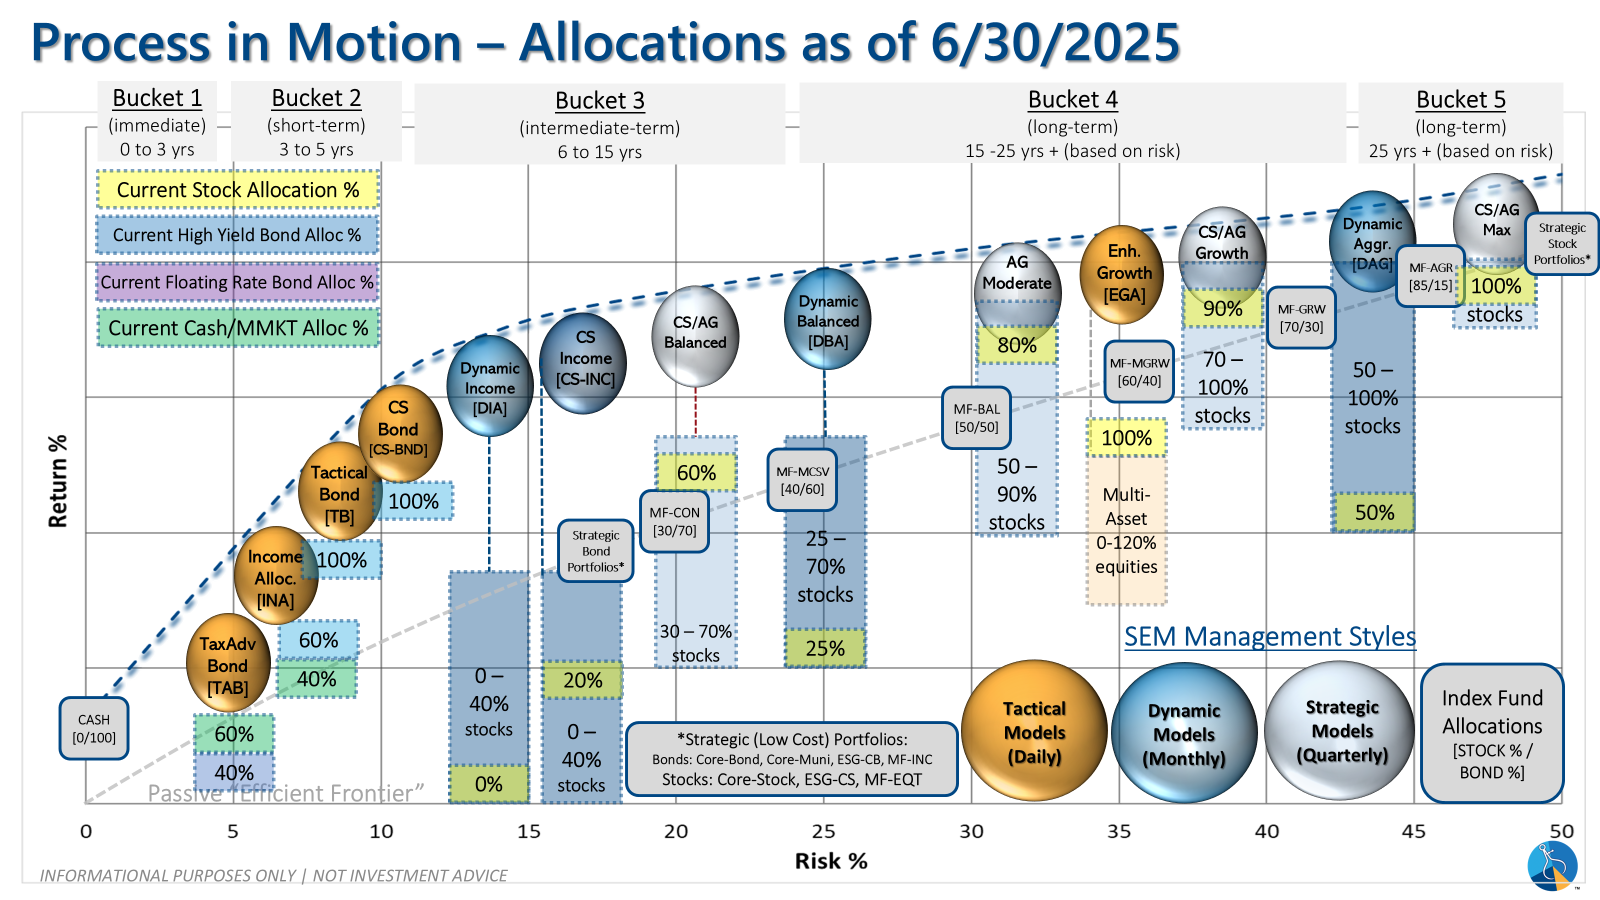
SEM deploys 3 distinct approaches – Tactical, Dynamic, and Strategic. These systems have been described as 'daily, monthly, quarterly' given how often they may make adjustments. Here is where they each stand.
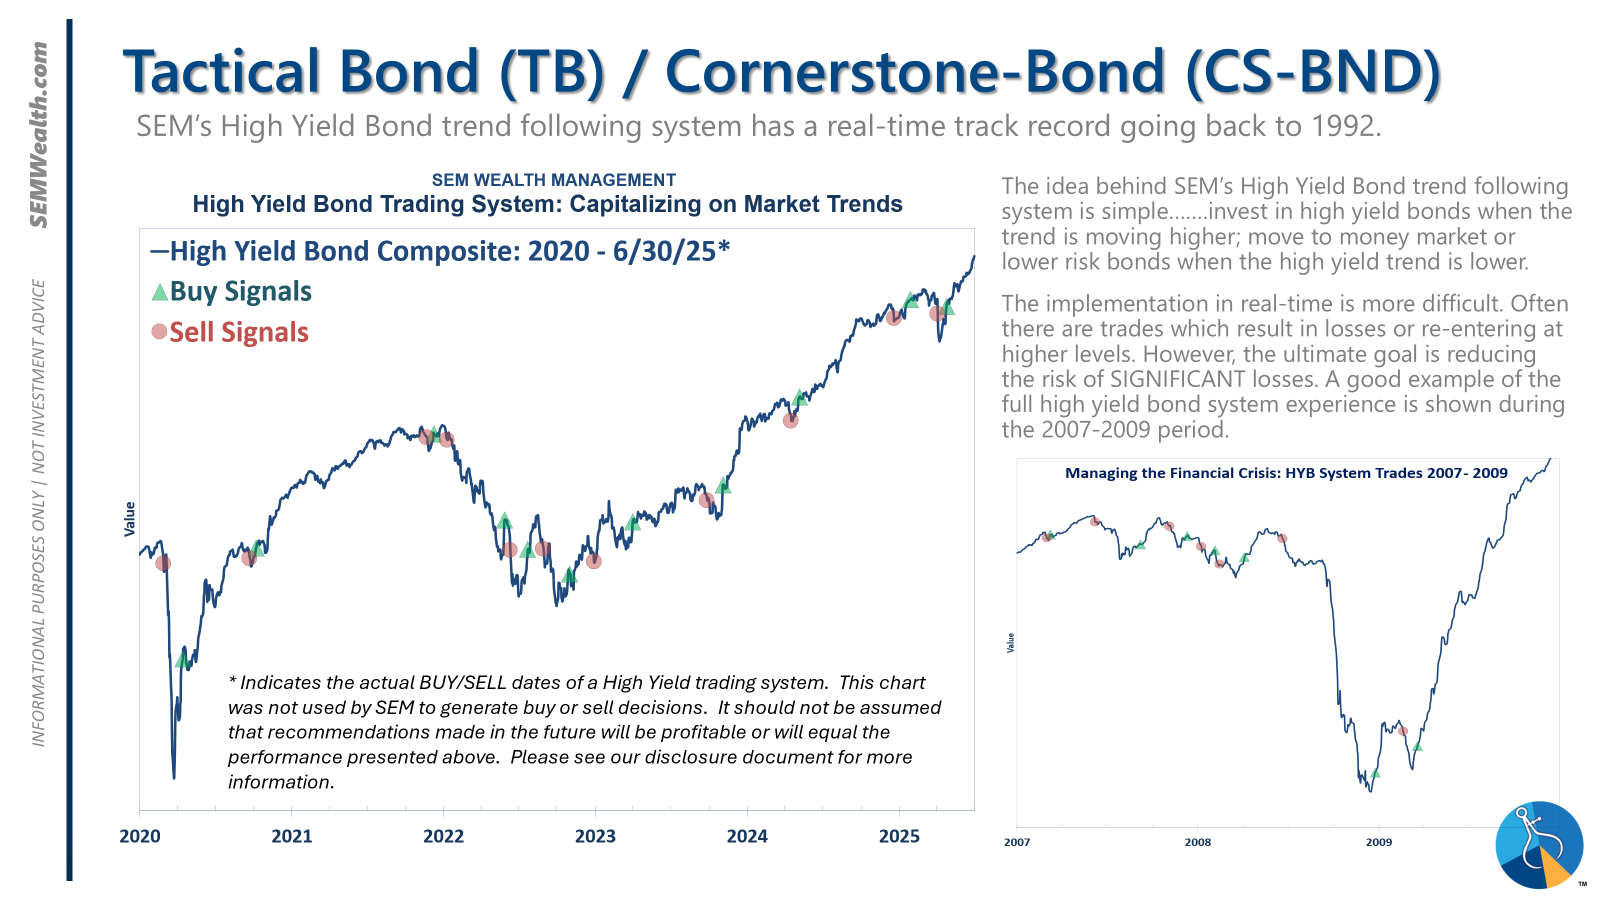
Tactical (daily): The high yield system has been invested since 4/23/25 after a short time out of the market following the sell signal on 4/3/25.
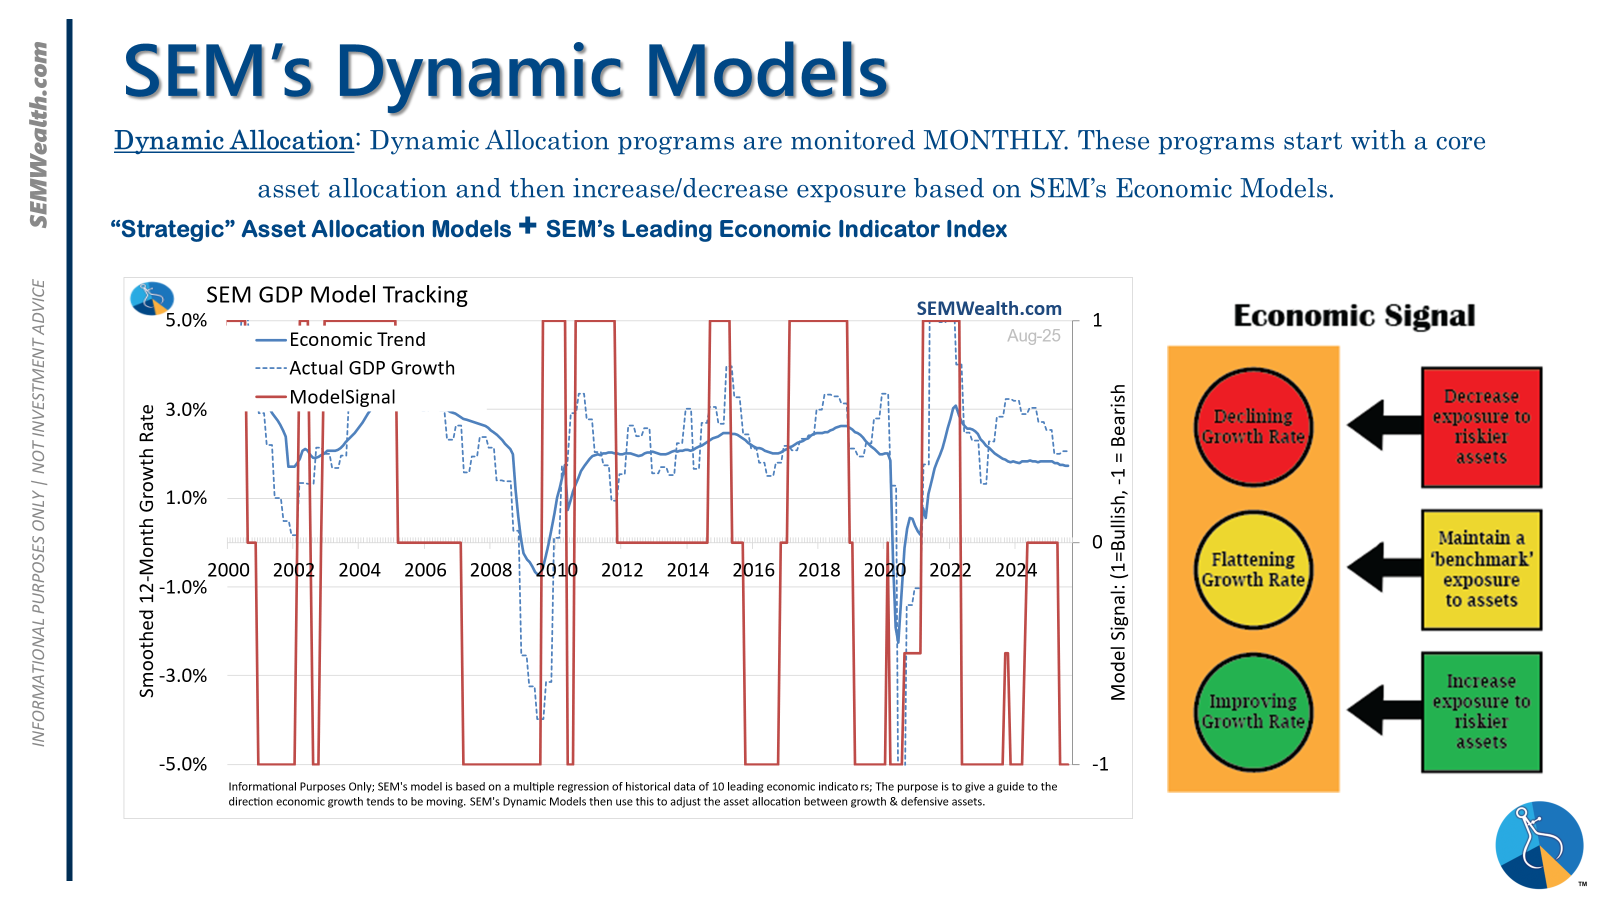
Dynamic (monthly): The economic model went 'bearish' in June 2025 after being 'neutral' for 11 months. This means eliminating risky assets – sell the 20% dividend stocks in Dynamic Income and the 20% small cap stocks in Dynamic Aggressive Growth. The interest rate model is 'bullish' meaning higher duration (Treasury Bond) investments for the bulk of the bonds.
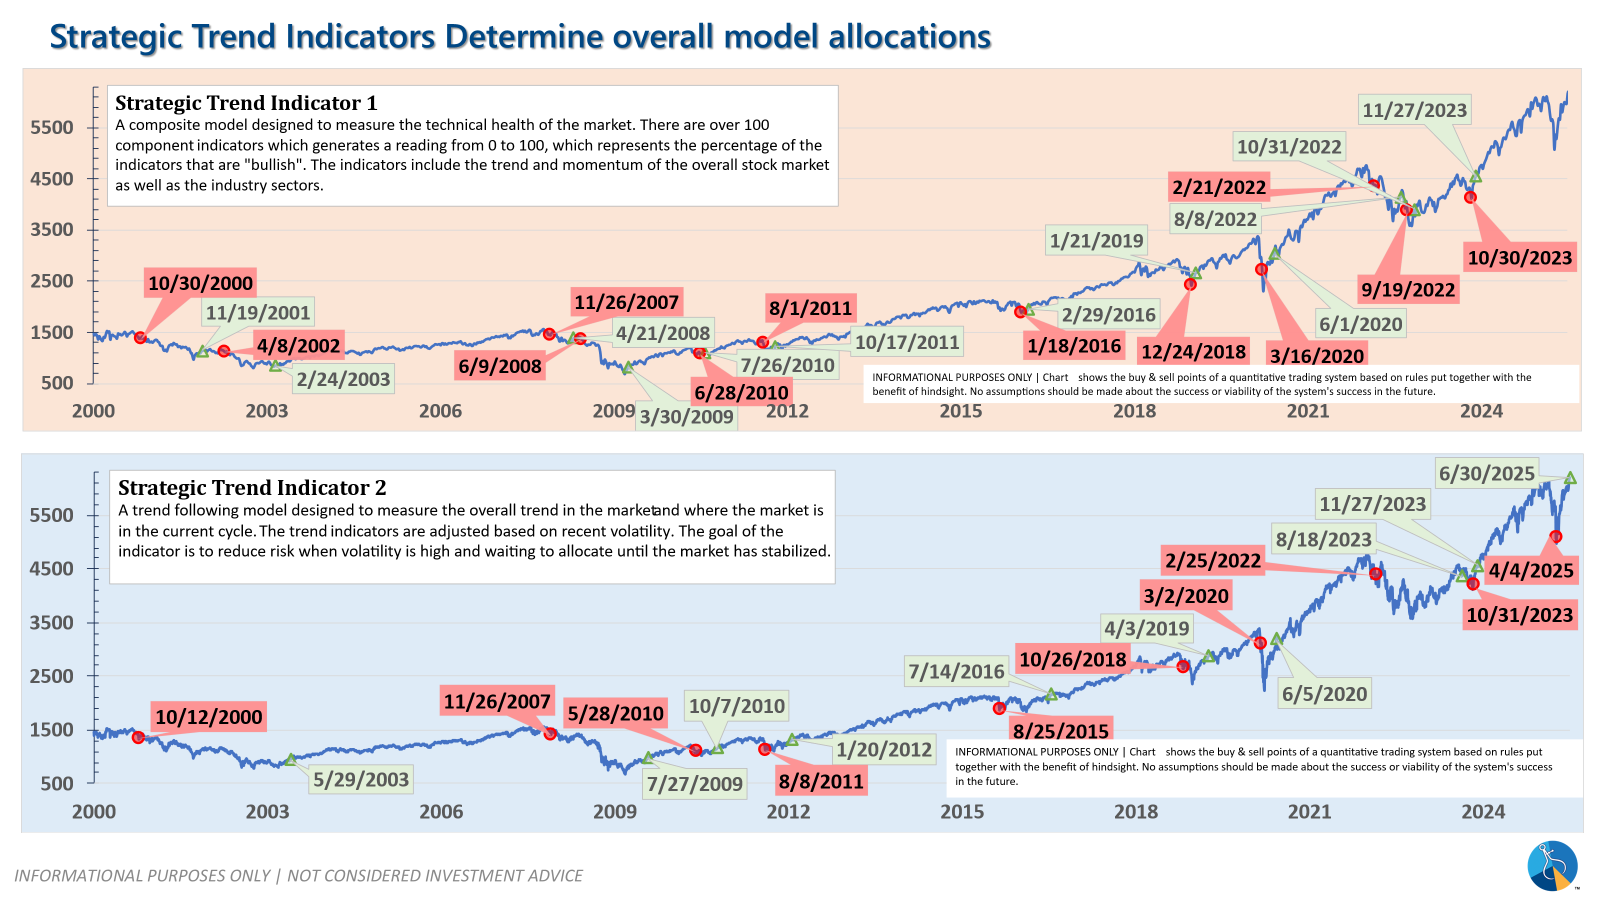
Strategic (quarterly)*: One Trend System sold on 4/4/2025; Re-entered on 6/30/2025
The core rotation is adjusted quarterly. On August 17 it rotated out of mid-cap growth and into small cap value. It also sold some large cap value to buy some large cap blend and growth. The large cap purchases were in actively managed funds with more diversification than the S&P 500 (banking on the market broadening out beyond the top 5-10 stocks.) On January 8 it rotated completely out of small cap value and mid-cap growth to purchase another broad (more diversified) large cap blend fund along with a Dividend Growth fund.
The * in quarterly is for the trend models. These models are watched daily but they trade infrequently based on readings of where each believe we are in the cycle. The trend systems can be susceptible to "whipsaws" as we saw with the recent sell and buy signals at the end of October and November. The goal of the systems is to miss major downturns in the market. Risks are high when the market has been stampeding higher as it has for most of 2023. This means sometimes selling too soon. As we saw with the recent trade, the systems can quickly reverse if they are wrong.
Overall, this is how our various models stack up based on the last allocation change:
Curious if your current investment allocation aligns with your overall objectives and risk tolerance? Take our risk questionnaire


