
When market news is noisy, as it is today, I find it better to say less. This allows us to focus on the bigger picture and highlight the most important things. This week we are looking at some developing risks that threaten the bull market, starting with our most trusted risk management system issuing a sell signal on Friday as the private credit concerns start to move into publicly traded credit. This could be due to the spike in oil due to the war in Iran, or a bigger picture issue. We won't know until we are down the road, which is why we focus on the data, not our opinions or predictions.
Speaking of data, we also received a flurry of data we'd been waiting for that has been delayed due to the government shutdown last fall. At this point I'm not sure if the government has decided it's not going to revert to its previous schedule of data releases or it truly is still running that far behind. As it is, it was a mixed bag, which confirmed our economic model's shift to "neutral" last month.
Developing Risks
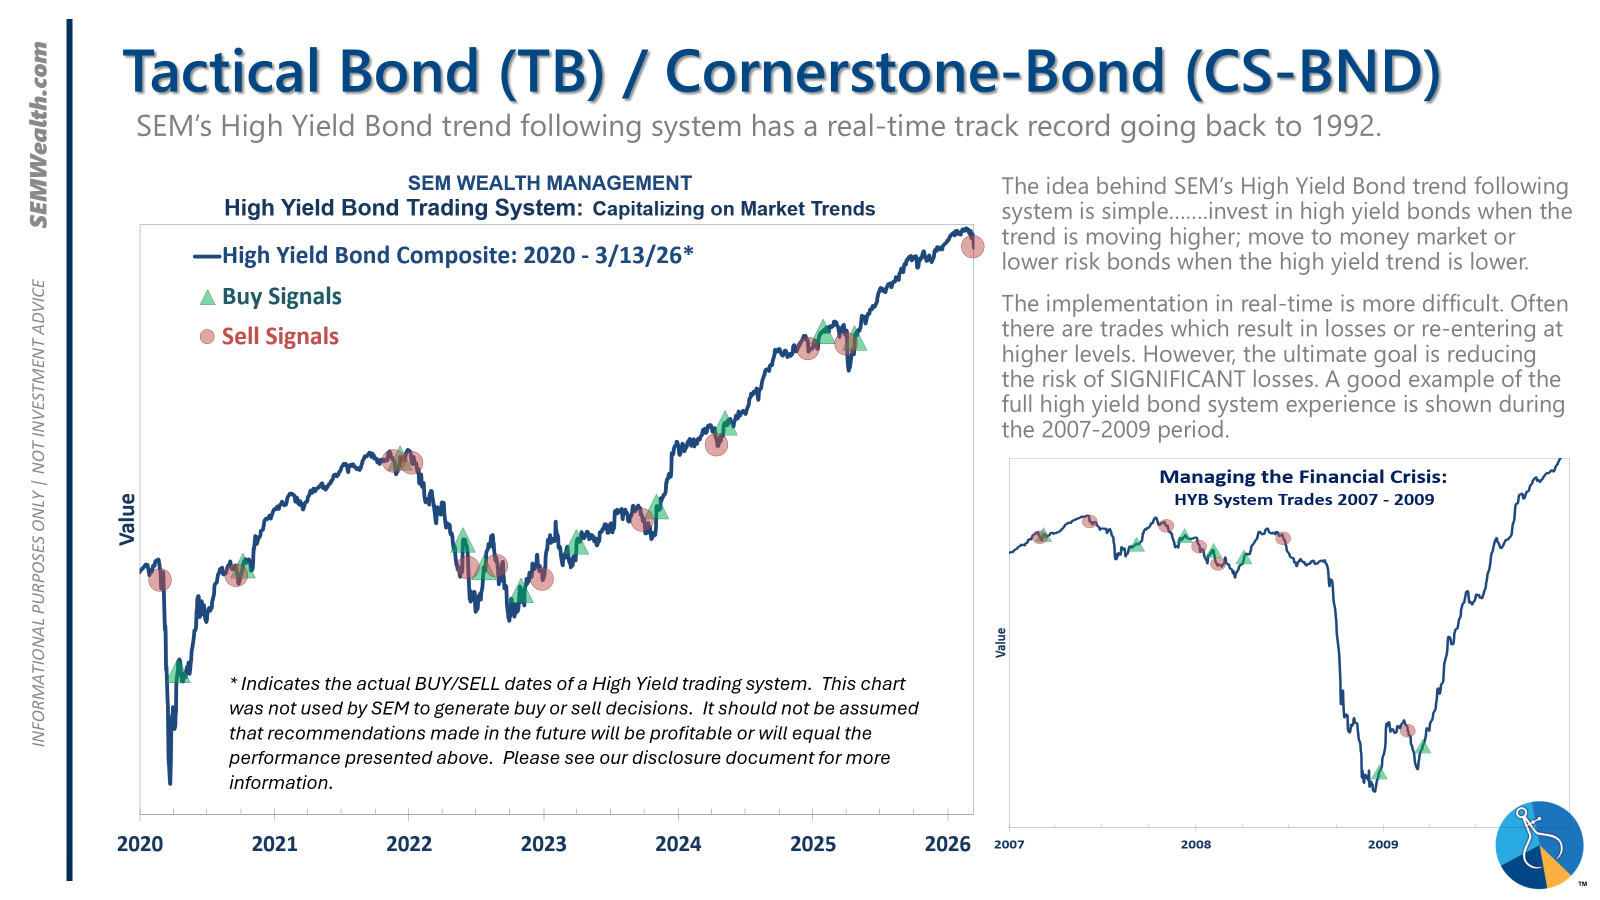
The S&P has been in a flattening trading range since the Fed meeting at the end of October. It did manage to hit all-time highs the day of the Fed's January meeting, but since then it has fallen a little over 5%. The "broadening" we have been excited about since late last year has weakened, with small caps starting to get hit. More importantly, our best measure of risk, the high yield bond market generated a sell signal on Friday. This has been one of our longest running buy signals on record (we bought April 25, 2025).
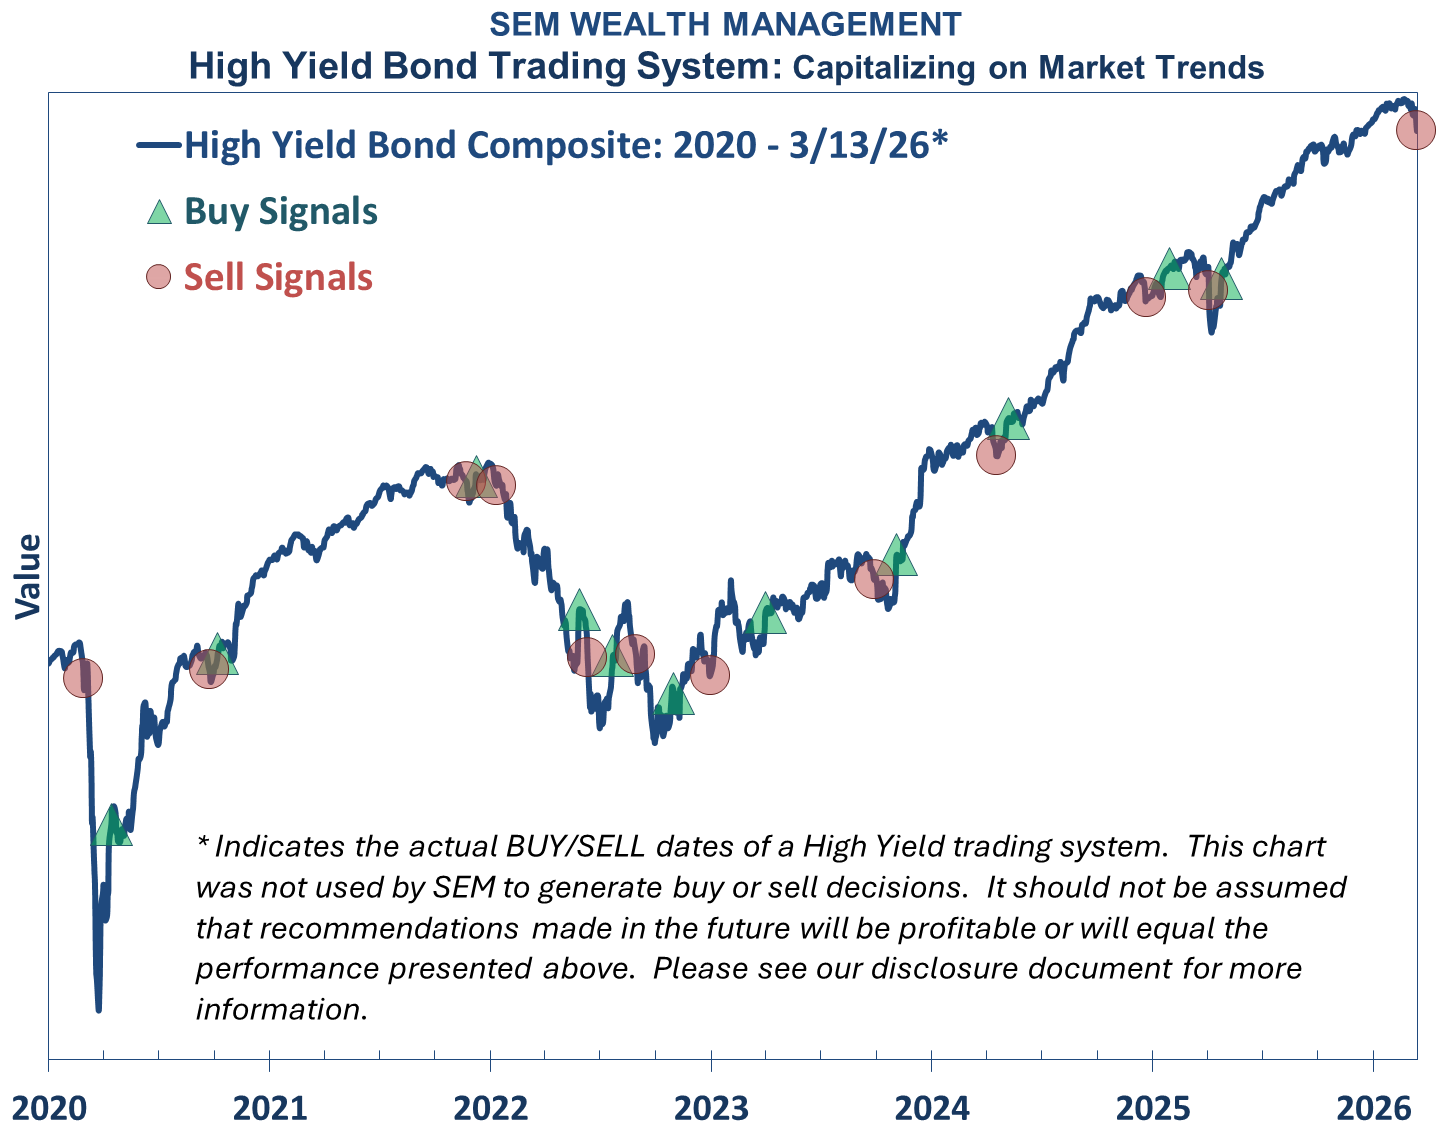
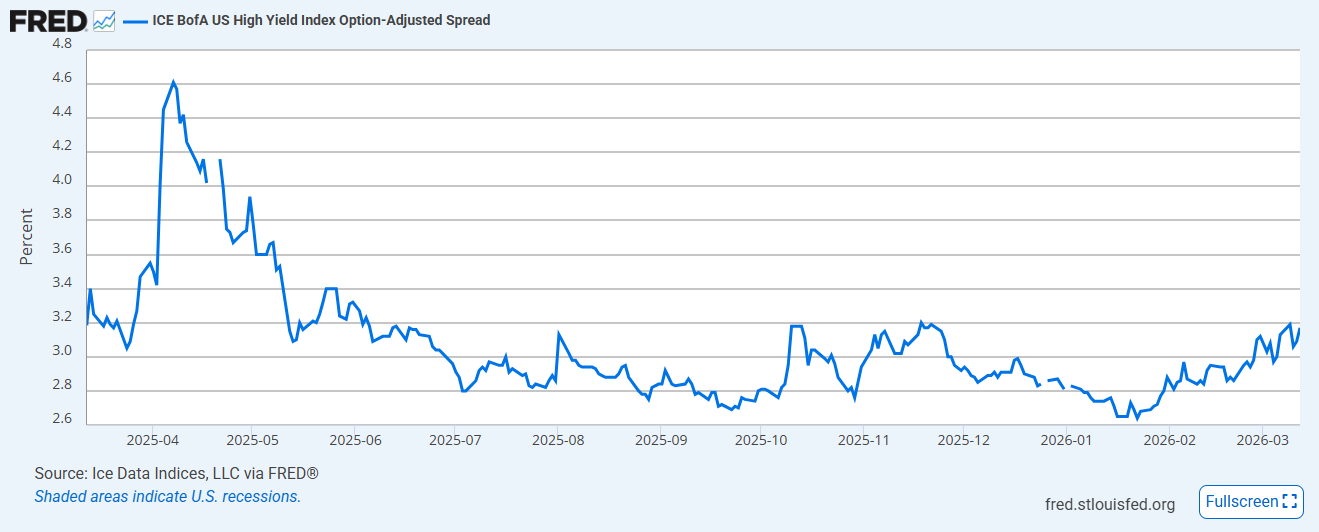
Whether or not this is a short-term sell signal or it turns into something else will depend on what else develops. One of the best measures of risk is the spread between high yield bond yields and the 10-year Treasury Bond yield. This has risen steadily since the Fed's meeting in late January.
Zooming out, we can see the spread nearly hit an all-time low, coming within a rounding error of the all-time lows hit in 2006 and matching the lows of 1998.
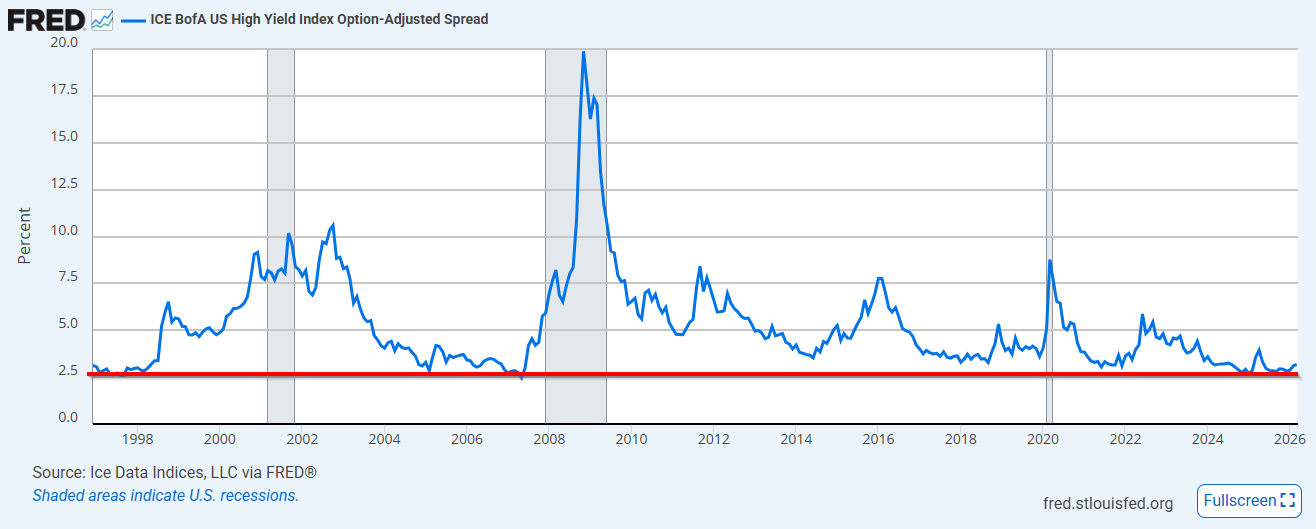
What this means is similarly to the late 90s and the 2003-2006 period, money was so "easy" investors perceived little risk and willingly extended loans to "junk" rated companies at rates that didn't make sense. It's too early to tell whether this is the beginning of a widening credit event or simply a short-term correction, but our high yield bond system, which has been used in real-time since 1992 always errs on the side of caution. When the system is on a "sell" it simply means the data says the reward/risk ratio is not attractive at this time. While we are giving up the 6.5% yield in high yield bonds, we will gladly trade it to the 3.5% yield of a stable money market account.
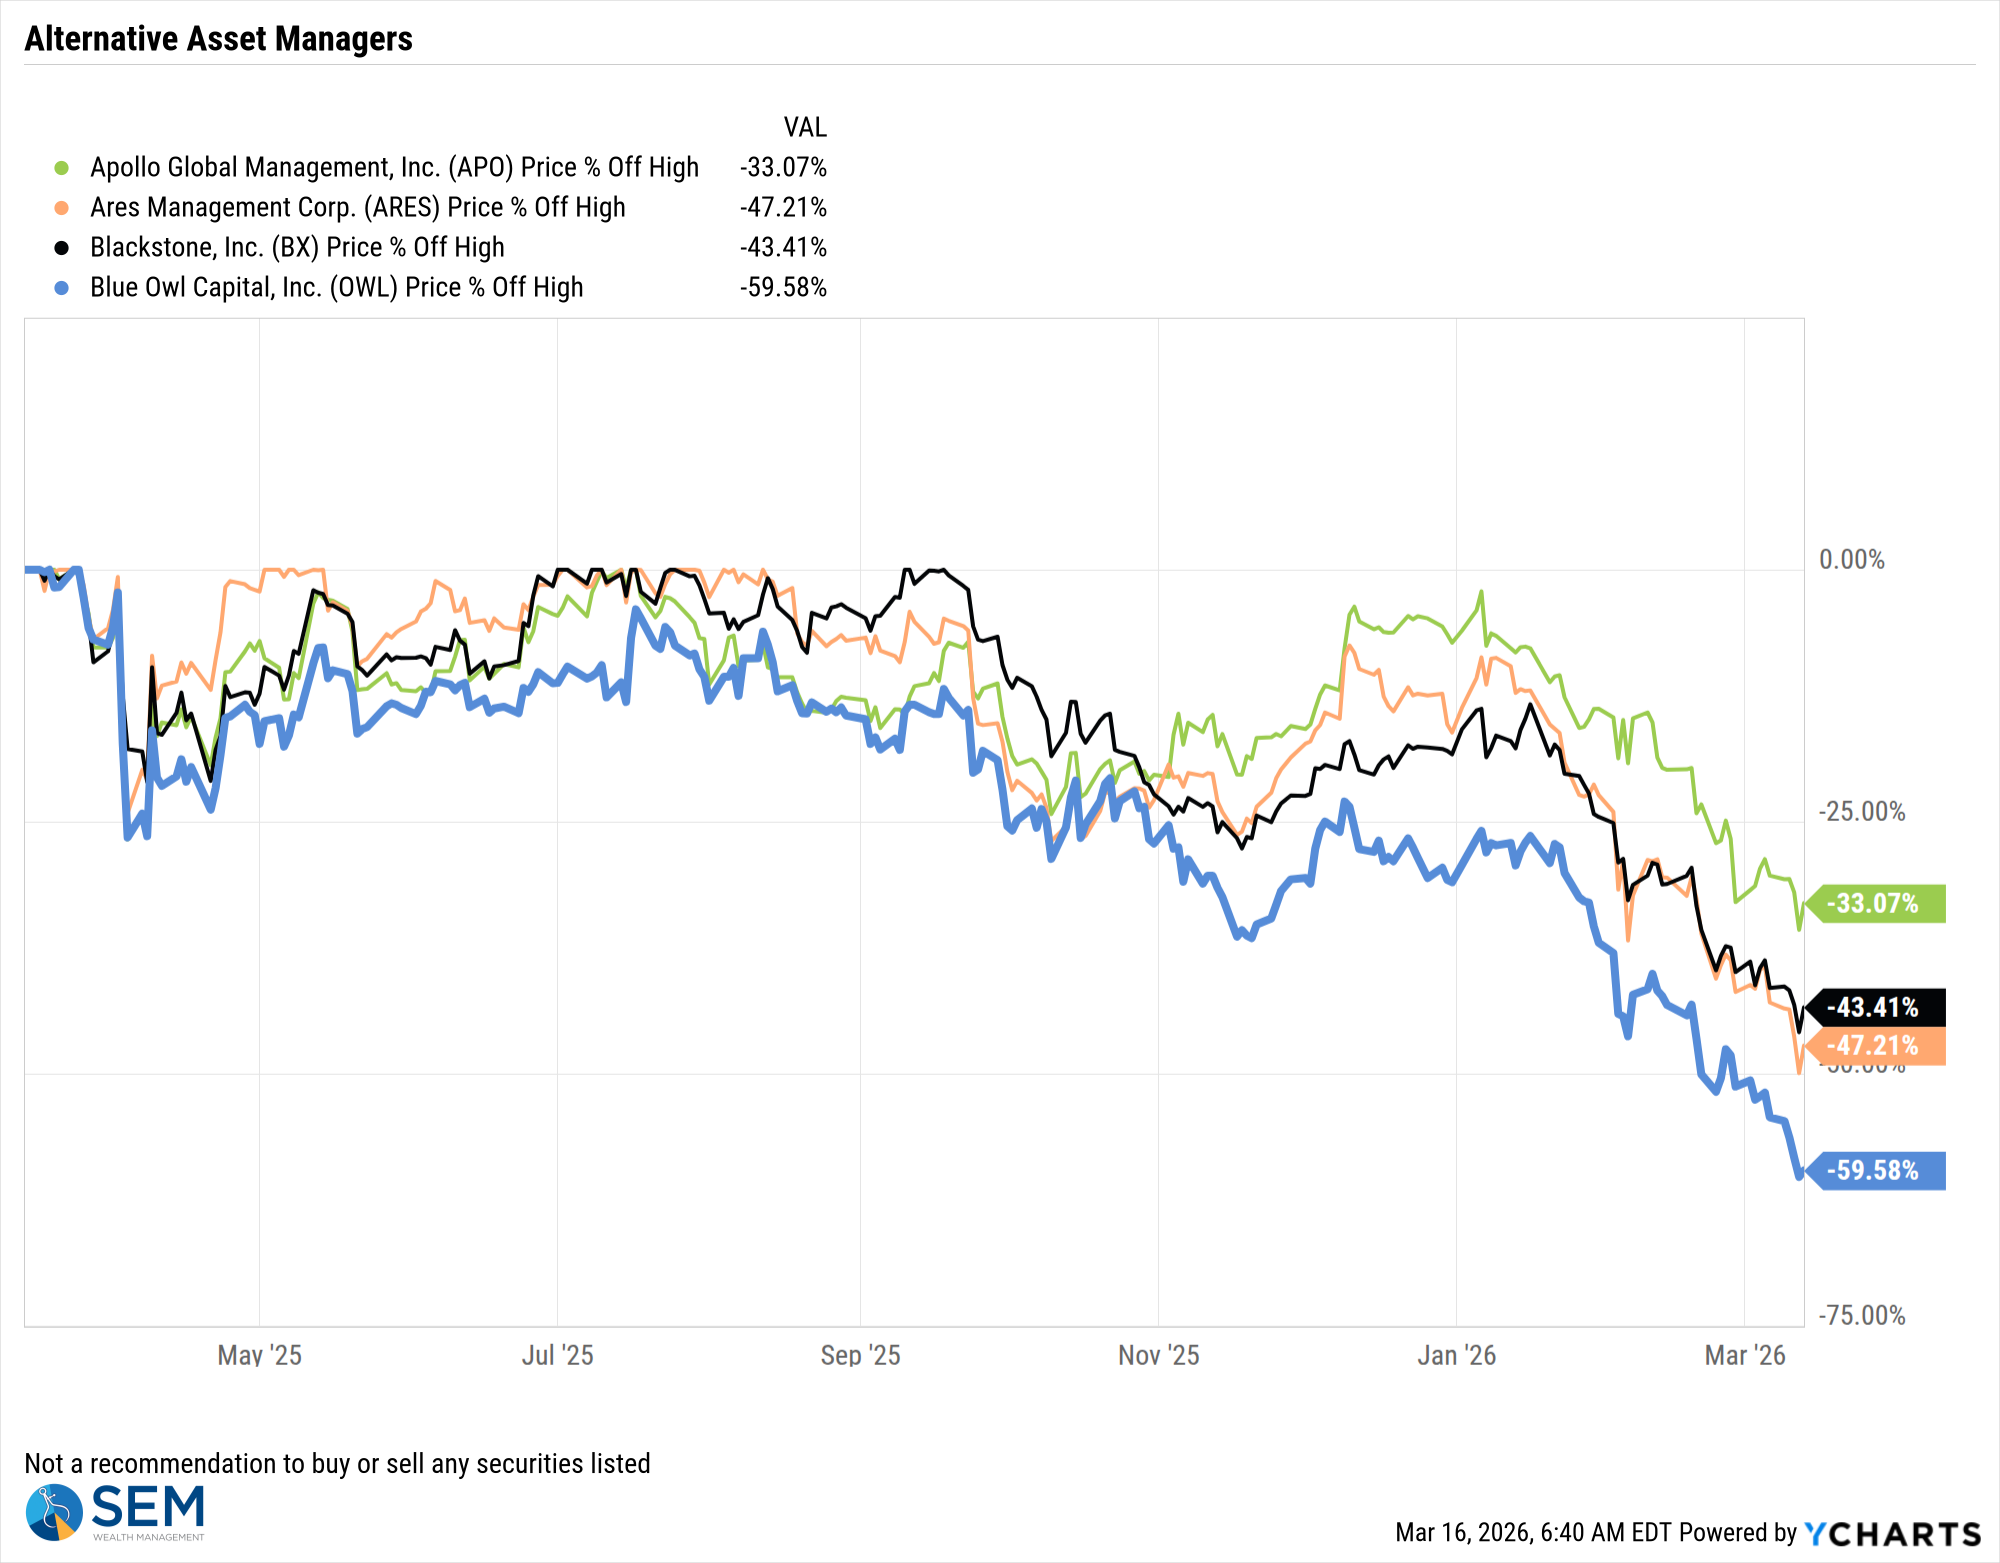
One of the things I've been waiting for was to see if the liquidity events we are seeing in the private credit world. I'm losing track on how many private credit funds could not meet the liquidation requests or how many loans are being written down. Since SEM does not invest in any of these illiquid vehicles I haven't dug into the details. I'll leave it to Wall Street to do that. Our best proxy of what they think is from the stock prices of the publicly traded asset managers.
Blue Owl seems to be the poster child of this as they have the least diversification outside of Private Credit. They were also very proud of their participation in data center loans last year. We thankfully talked a couple of clients out of these investments. I didn't think much of it at the time, but one of the clients was being pitched this by one of the biggest firms on Wall Street. This is where the bigger risk and bigger unknown lies – how involved are the big Wall Street firms in these private credit products and will they see losses due to this exposure?
Regulations and capital requirements have been diminished significantly over the past 8 years. The thought was the financial crisis regulations were holding back growth and since we hadn't had another crisis we should back off on those growth dampeners. Again, I'm not saying we are heading to another financial crisis, but I am frustrated that once again the "creativity" of Wall Street is threatening to hit the rest of us.
We will continue to watch these "alternative" asset manager's stock prices just as a gauge of sentiment on this space. As it was, it was a bad week once again, especially for Blue Owl.
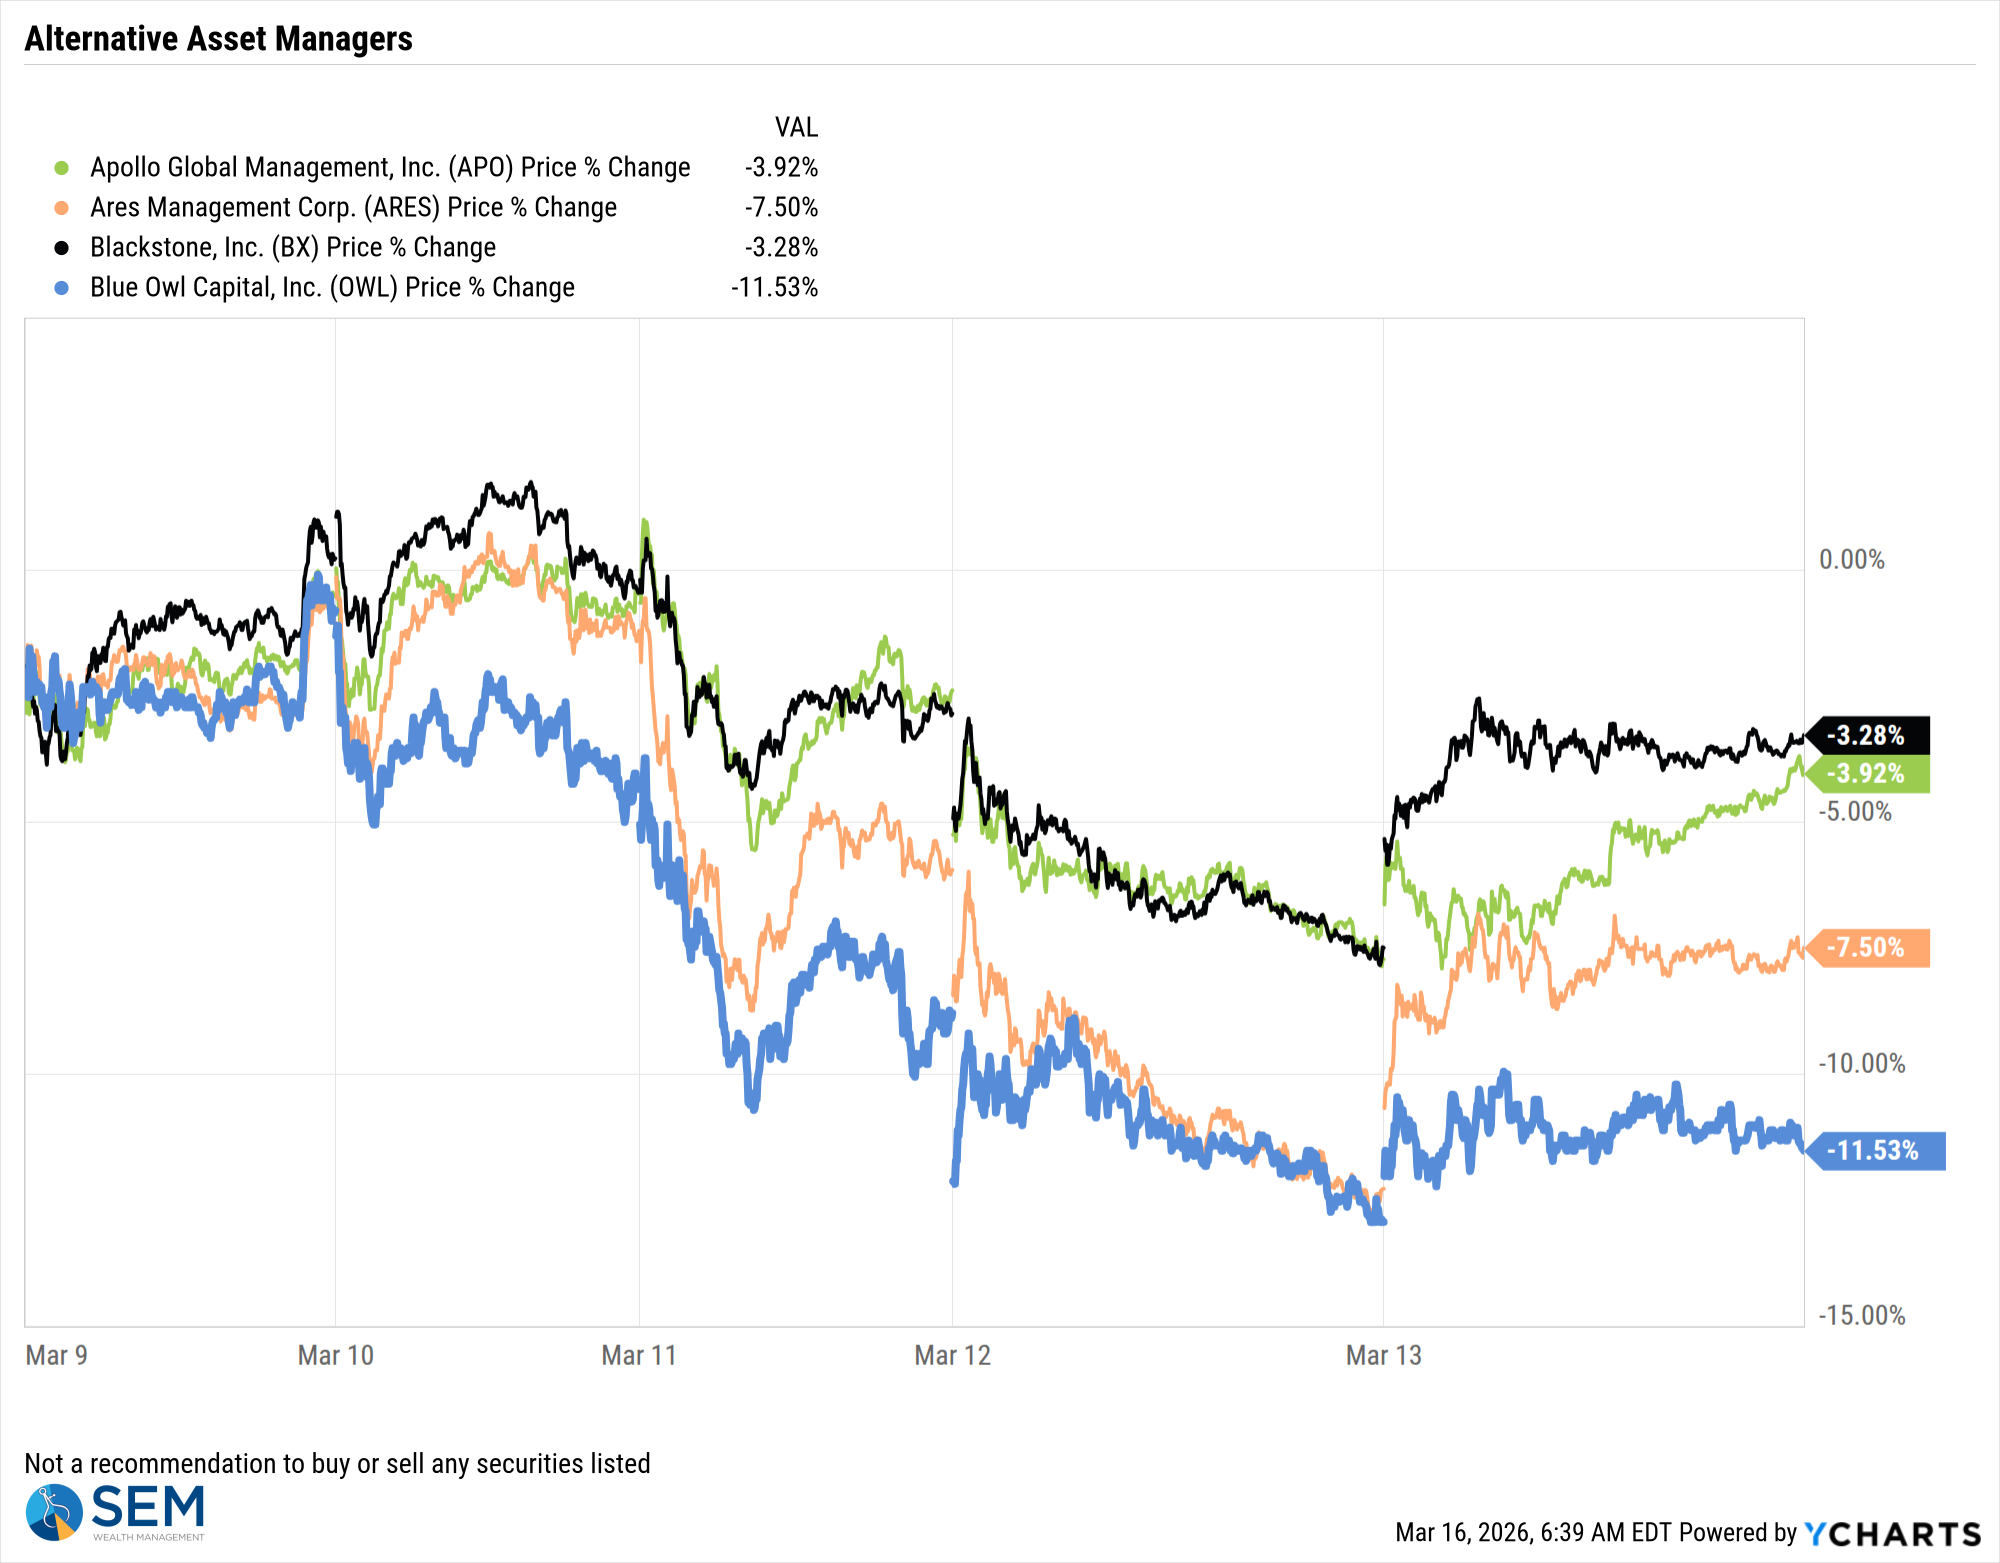
It's been a spectacular collapse for these managers.
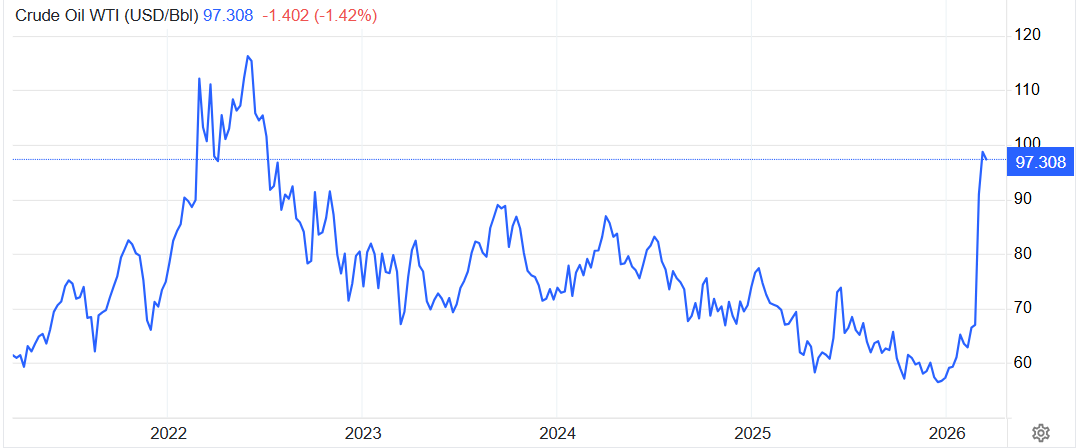
The final risk, of course is the war in Iran. The primary economic risk is oil prices which continue to fluctuate greatly. I'm not a military or middle east expert, but the longer oil prices stay high, the bigger a problem this will be.
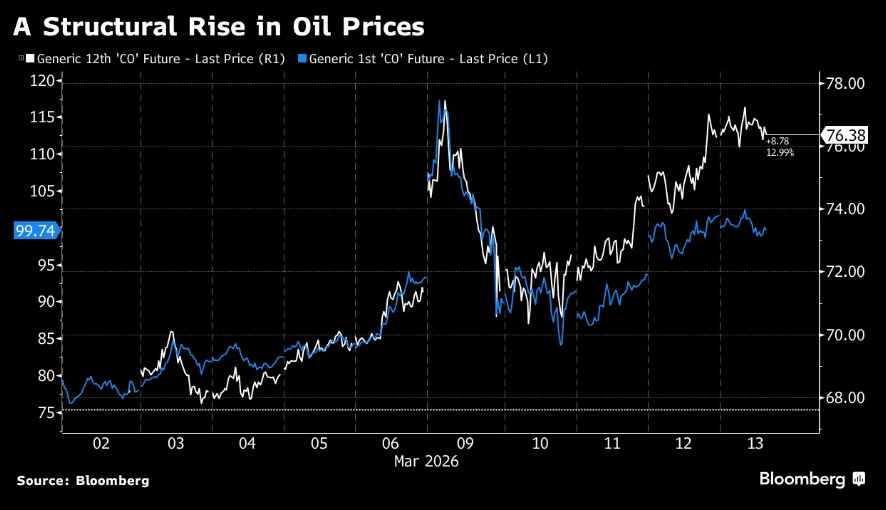
Last week Bloomberg Odd Lots had an interesting chart showing the difference between the "near month" price of oil (the price quoted when we talk about oil prices) and the price if you want delivery 12 months out. Before the war in Iran started, these contracts were tracking about the same. Interestingly enough, the recent decline in the near-month price is thought to be temporary with upward pressure on oil prices remaining a year from now.
Economic Data Update
The government is still running behind in releasing economic data. They blamed the shutdown, but we're long past that. Whatever the reason, we finally received updates we should have gotten 4-6 weeks ago for some key data points.
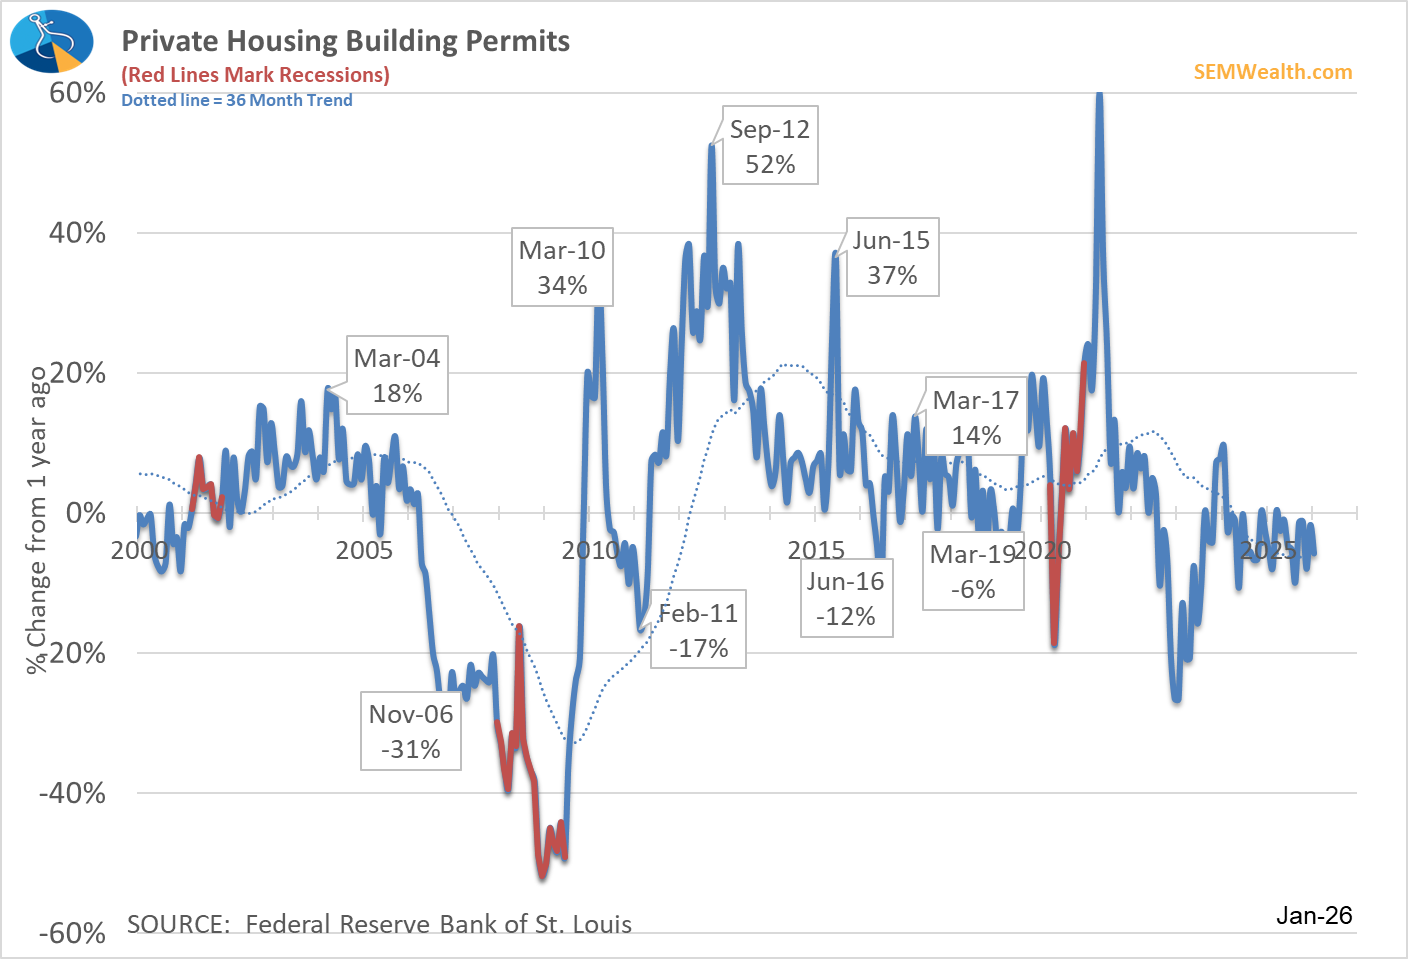
The first is Building Permits, which were down 6% in January compared to the prior year. As the chart below shows, there's been very little growth in building permits since mid-2024.
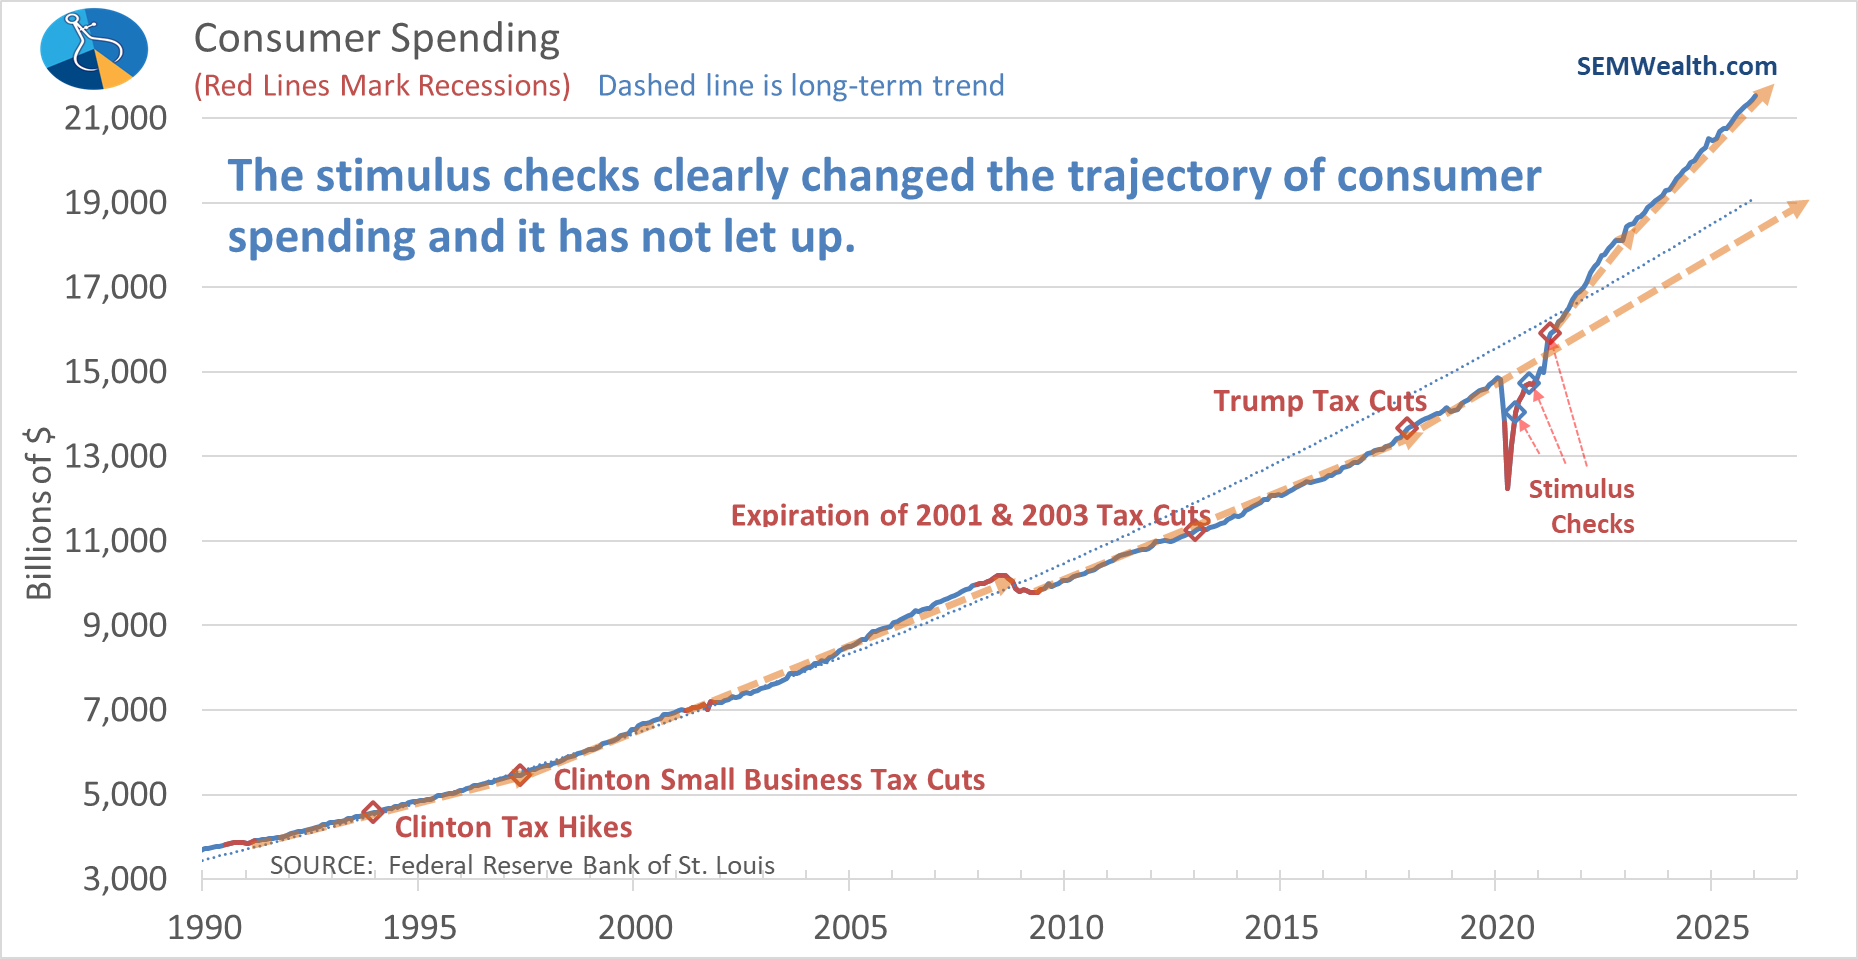
We also received updated consumer spending and personal income data for January. Consumer spending improved by 5% versus a year ago. As I've said for years now, the response to COVID broke our economy. The stimulus checks went to too many people who hadn't lost their income (retirees on social security and pensions and people who could work from their laptops). This excess money created a new uptrend in spending that we've yet to see broken.
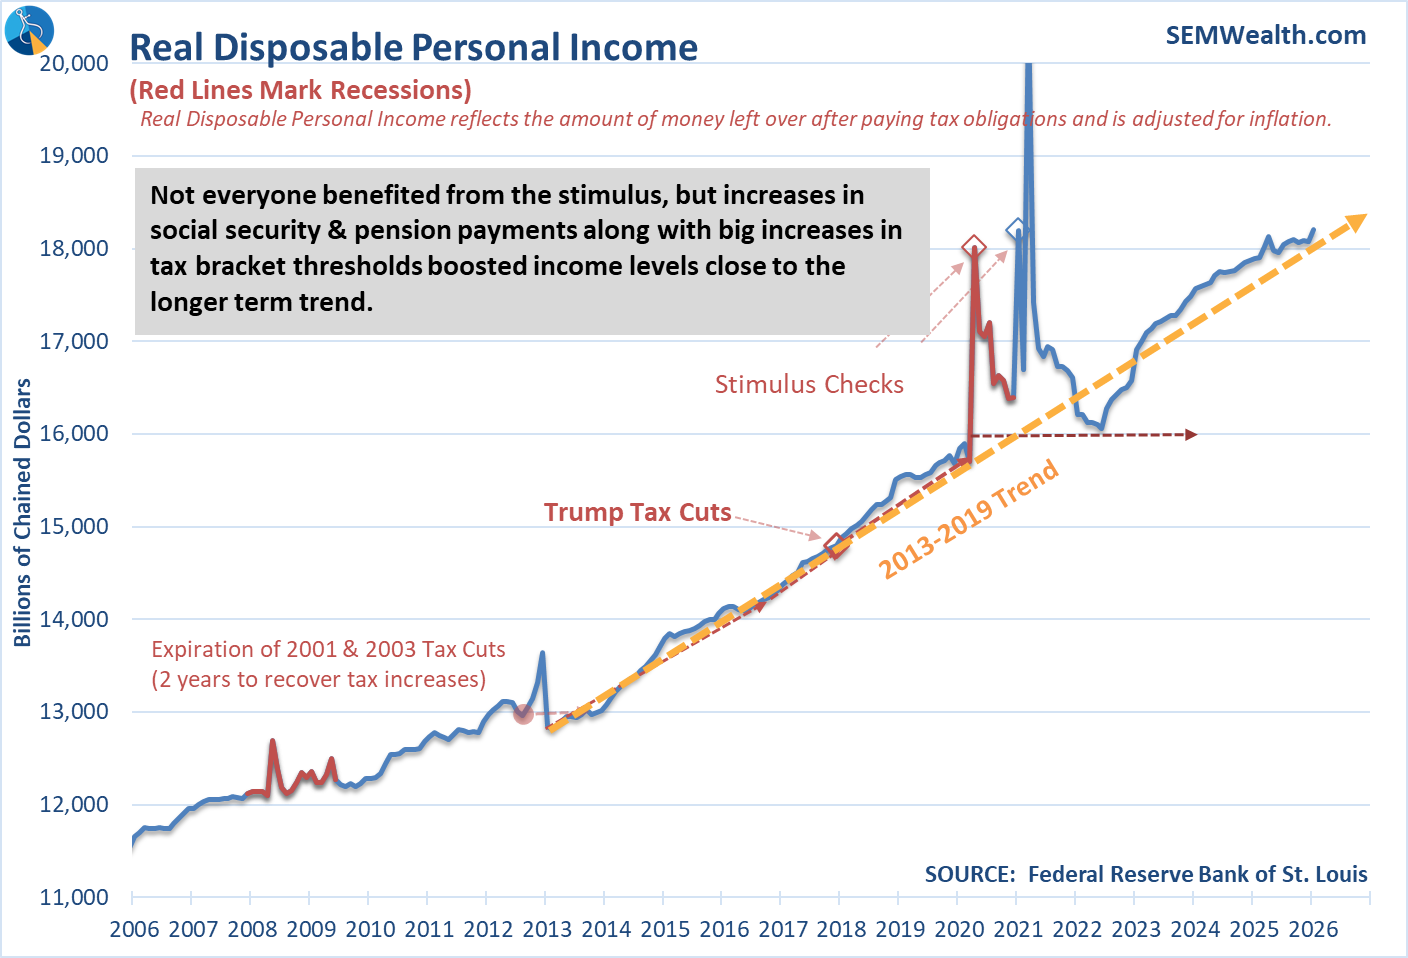
Personal Income did not enjoy the same shift. It is currently running just above the 2013-2019 trend.
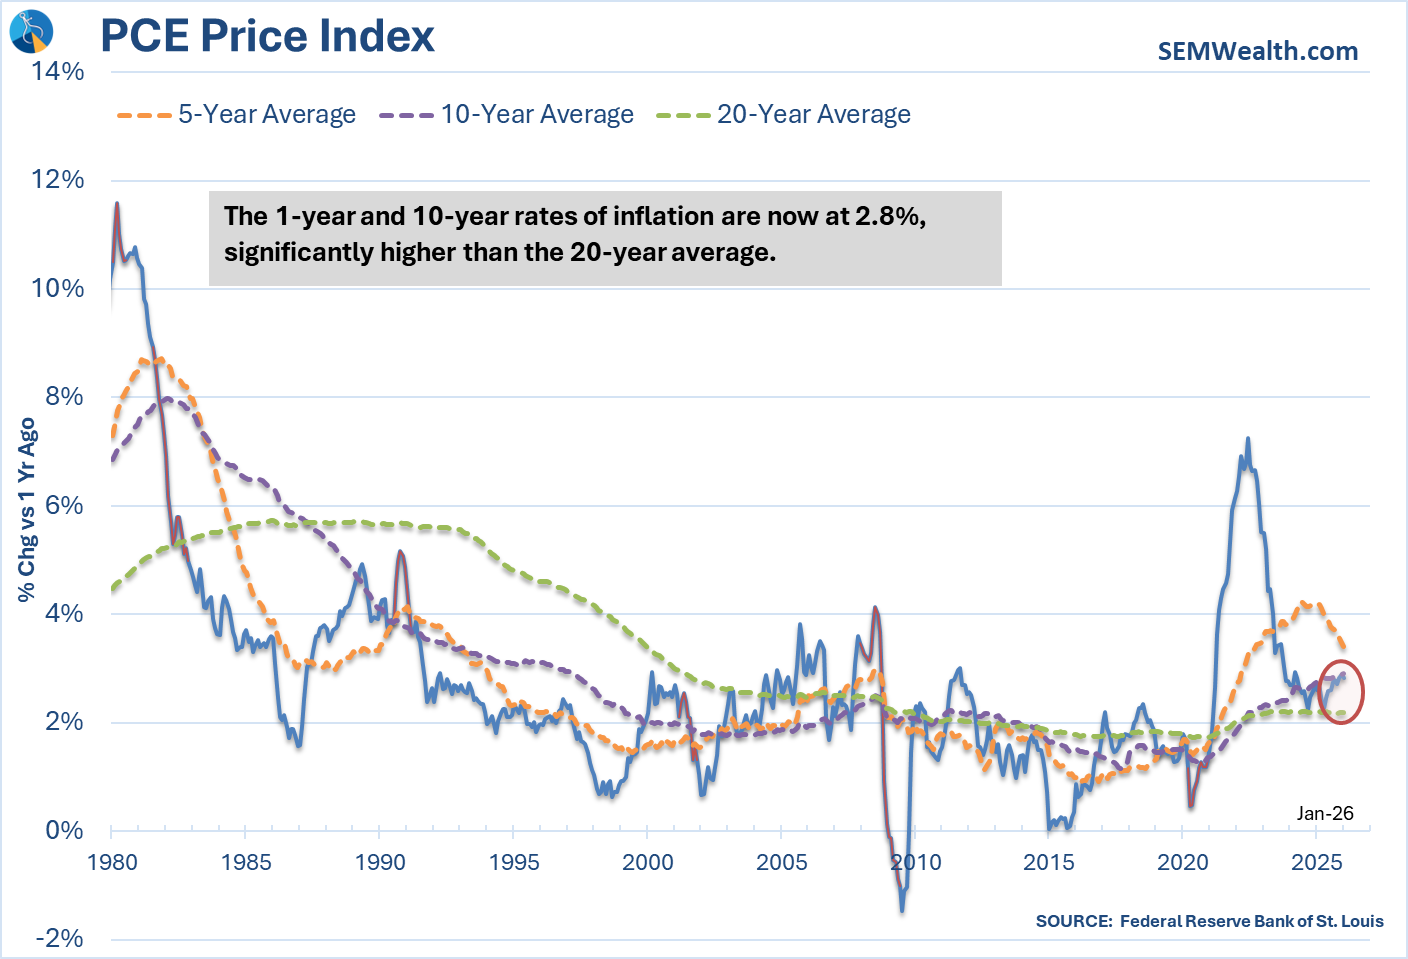
We also saw the Fed's preferred inflation measure, the PCE Price Index again rising above a 3% annualized rate. Keep in mind, this was from January – before the war in Iran caused oil prices to spike.
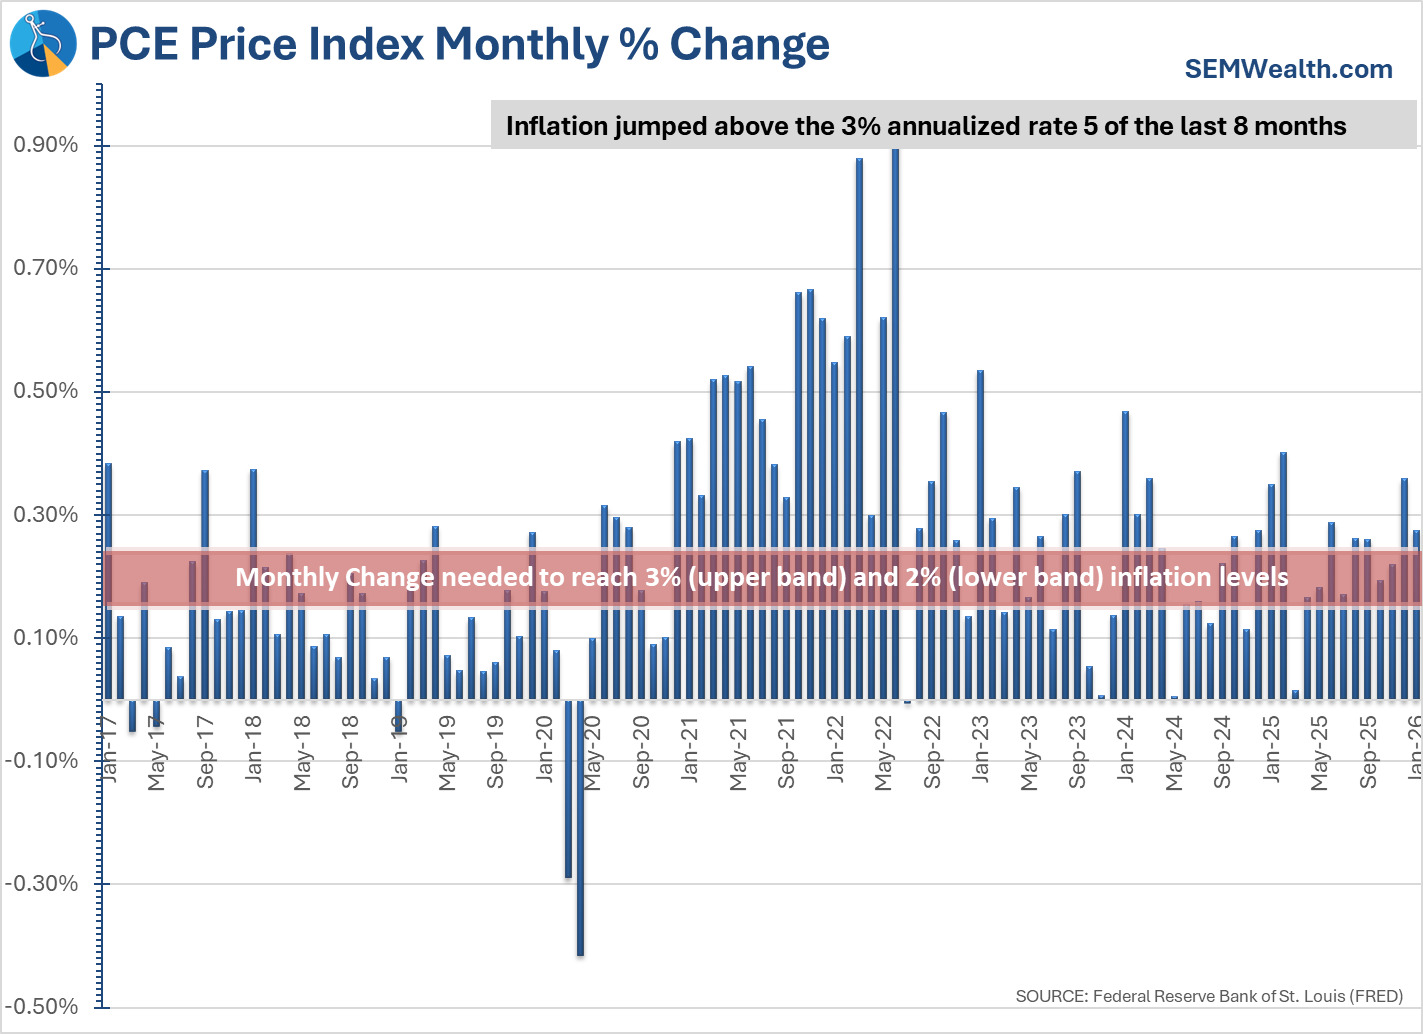
I'm not sure how anyone believes the Fed can push inflation down to their 2% "target" rate.
Speaking of the Fed, for all the bashing about rates being "too low" the Fed has ramped up the money supply based on the just released data for January. There is now 14% more money in circulation than we had a year ago, a significant spike.
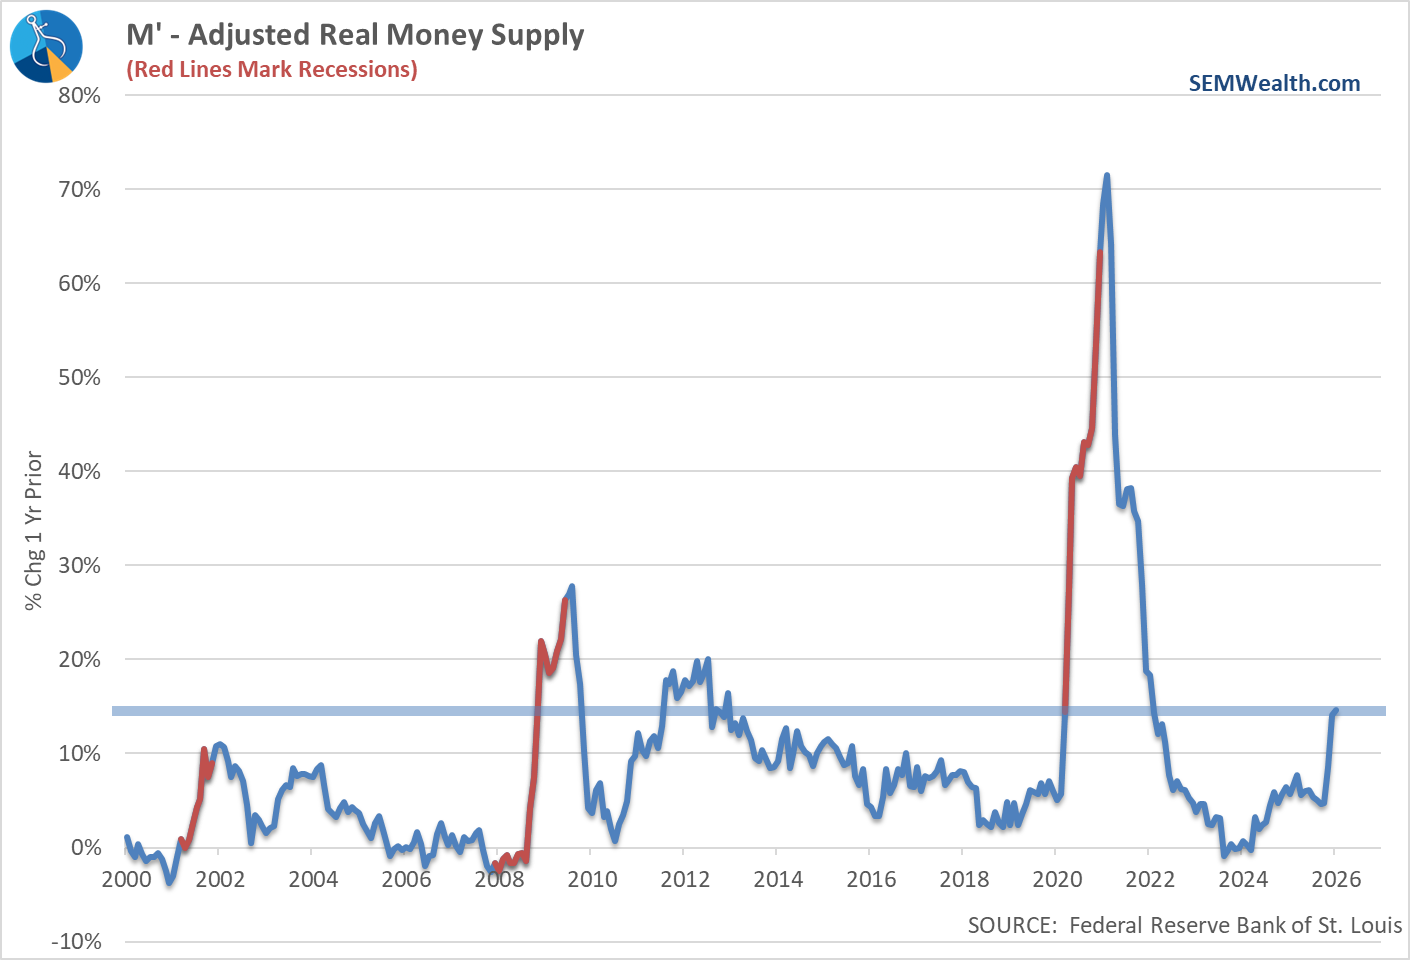
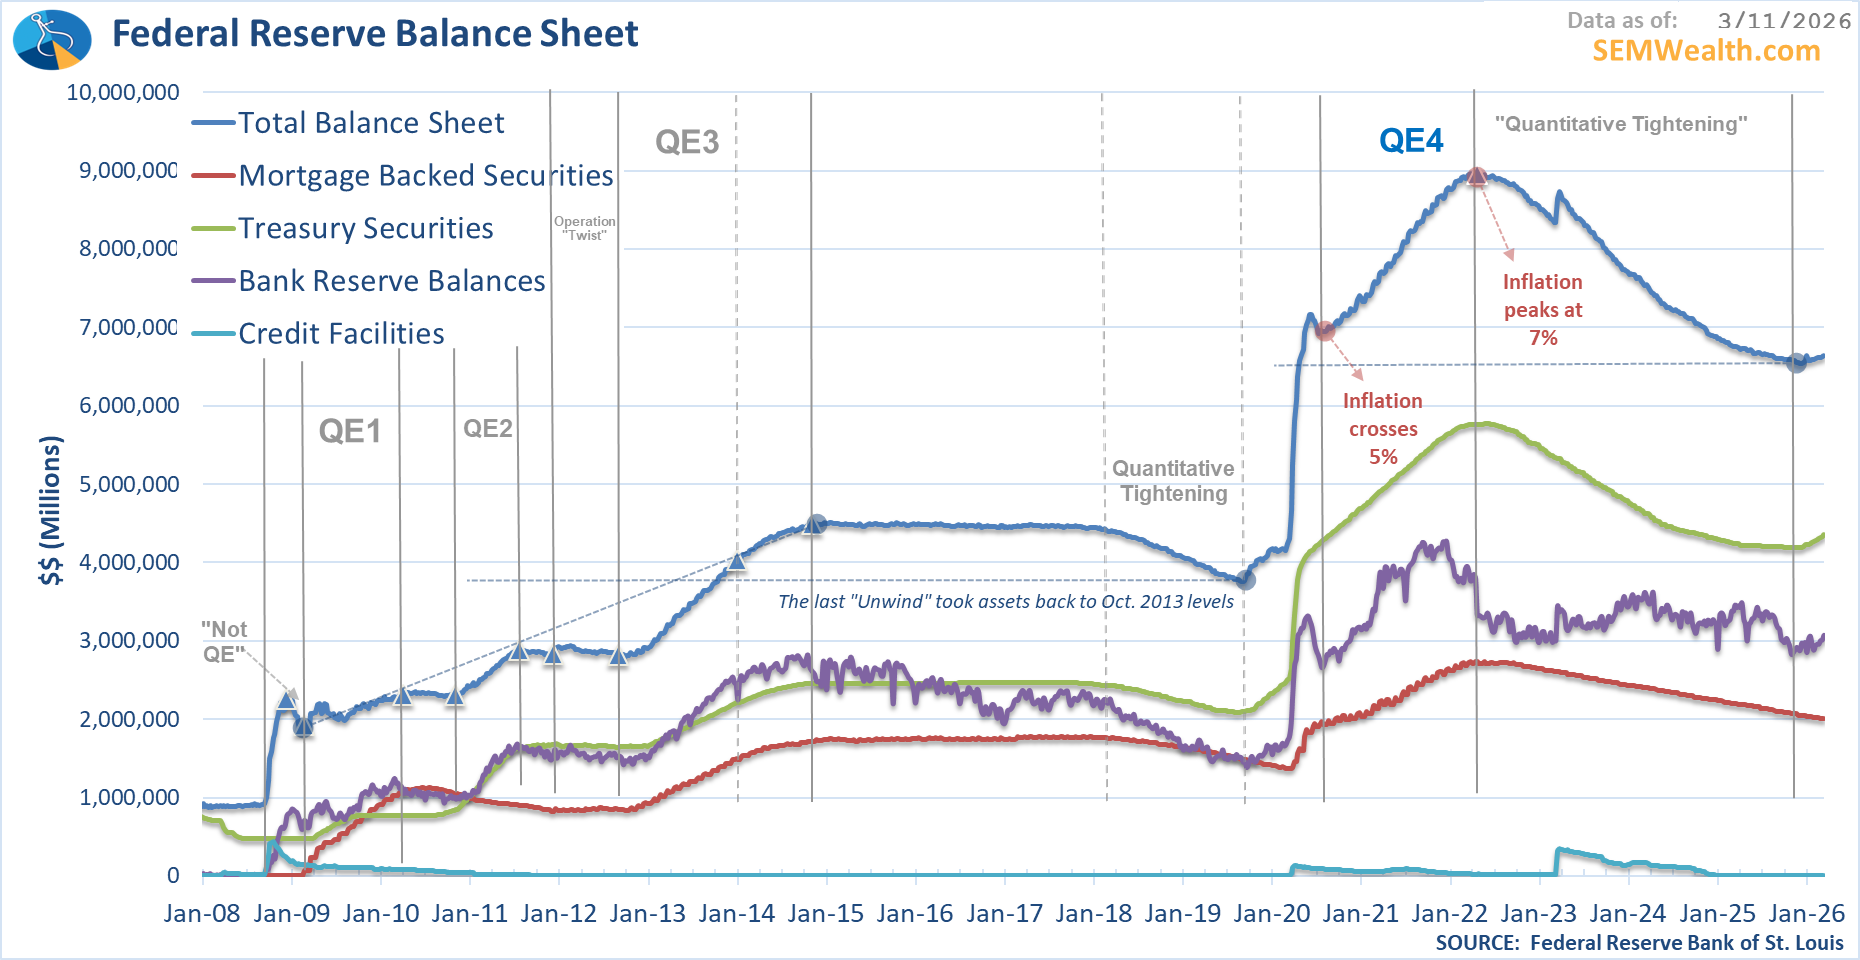
The Fed has also stopped with their "quantitative tightening" program where they were selling off portions of their balance sheet and letting maturing bonds "roll off" when they mature. Instead now when bonds mature they are reinvesting in those bonds (creating more money in circulation).
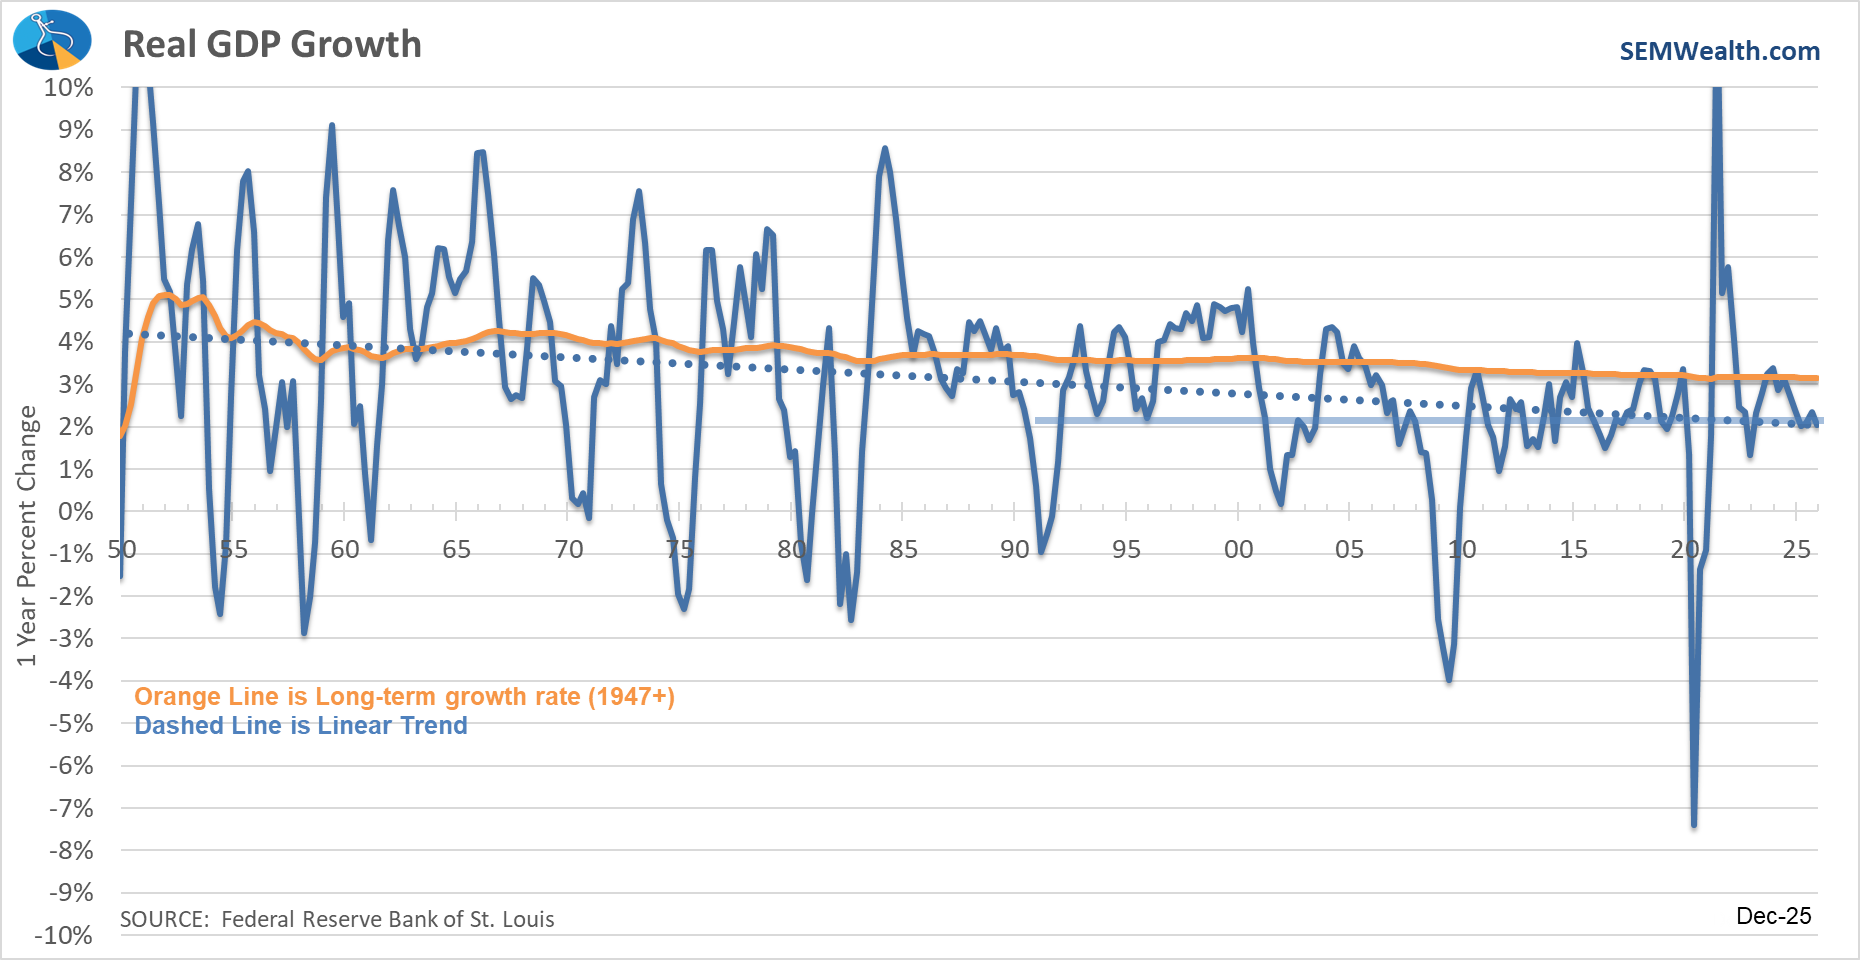
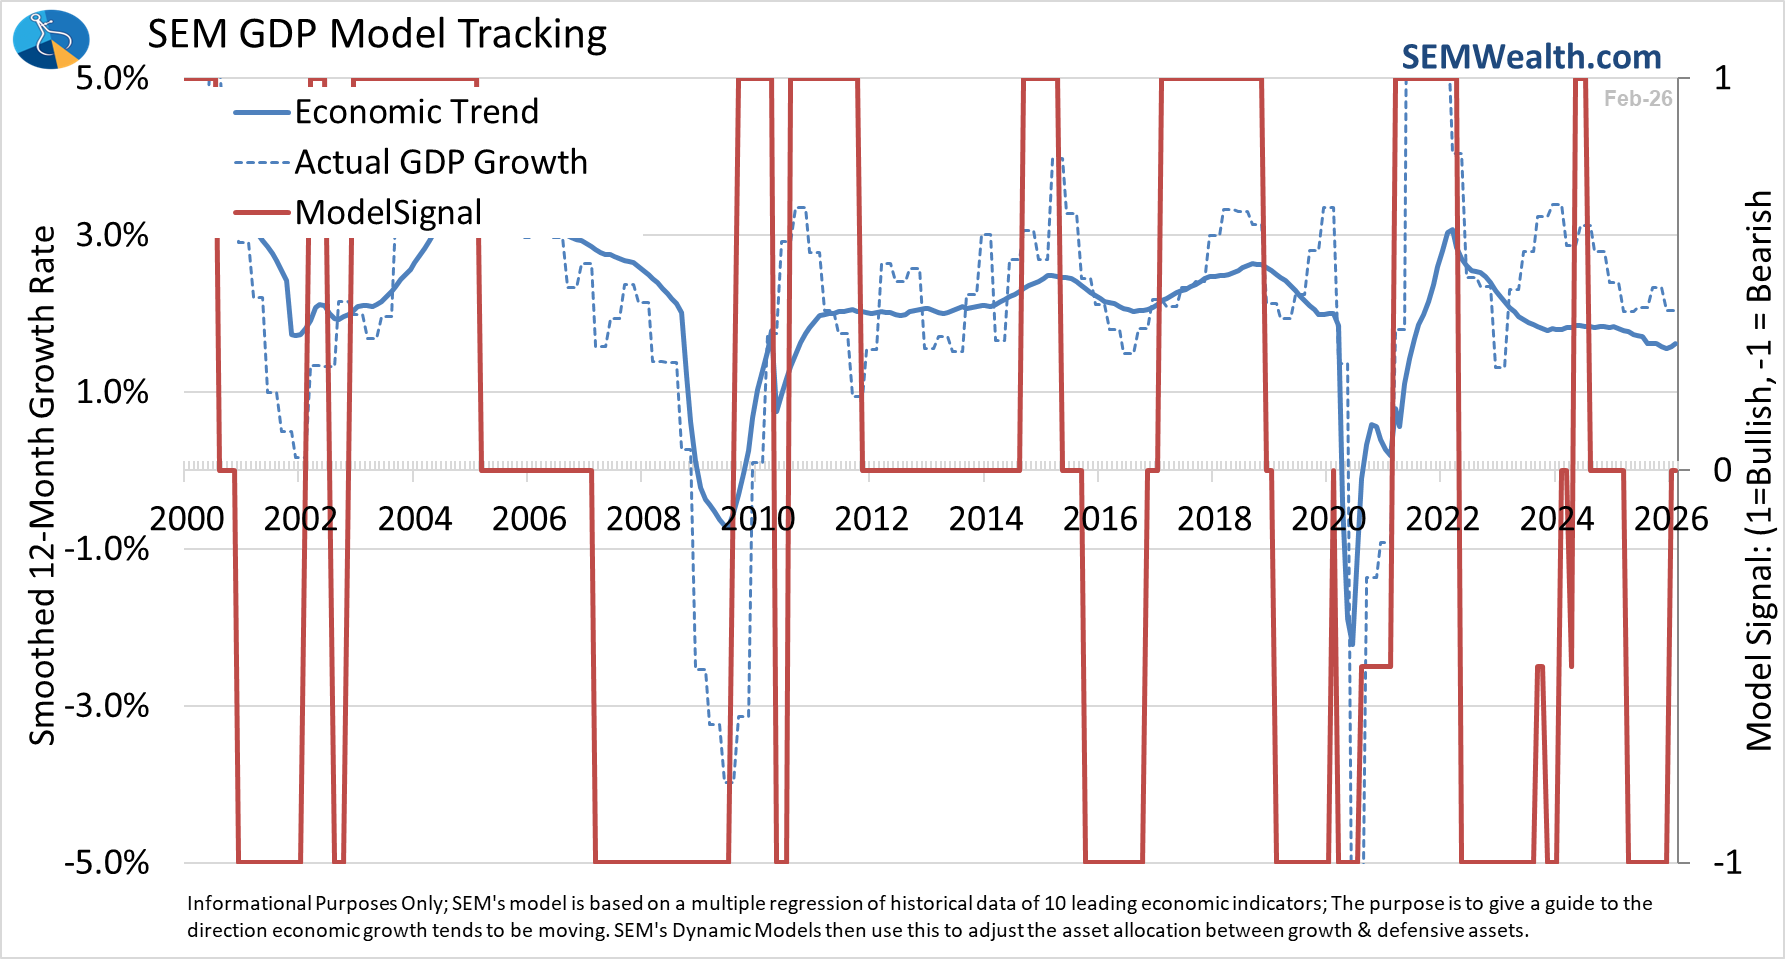
The final data update was a revision of the 4th Quarter GDP report, which showed a much weaker than expected end of the year. As I remind everyone – ignore the orange "official" bars which is what the headlines show and instead focus on the year-over-year change as that removes all seasonal adjustments from the equation. That number is showing what our economic model was signaling the last half of the year – an economy that is running well below "normal" (3%) at a decelerating rate.
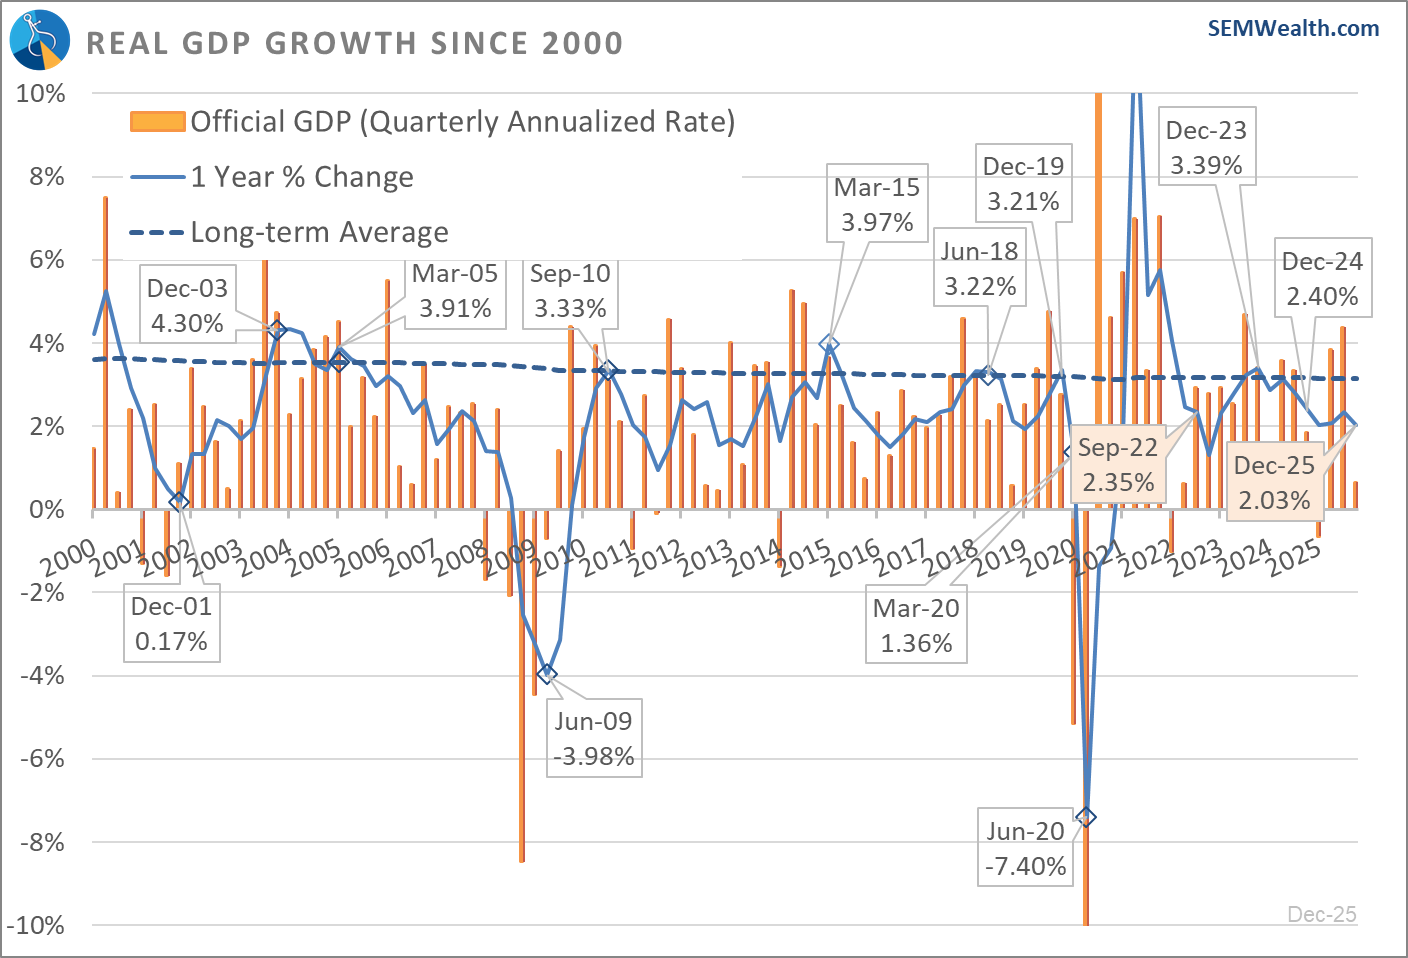
For all the talk of a "great" economy, the current 1-year rate of change of 2% would have been the WORST performance of the 1990s.
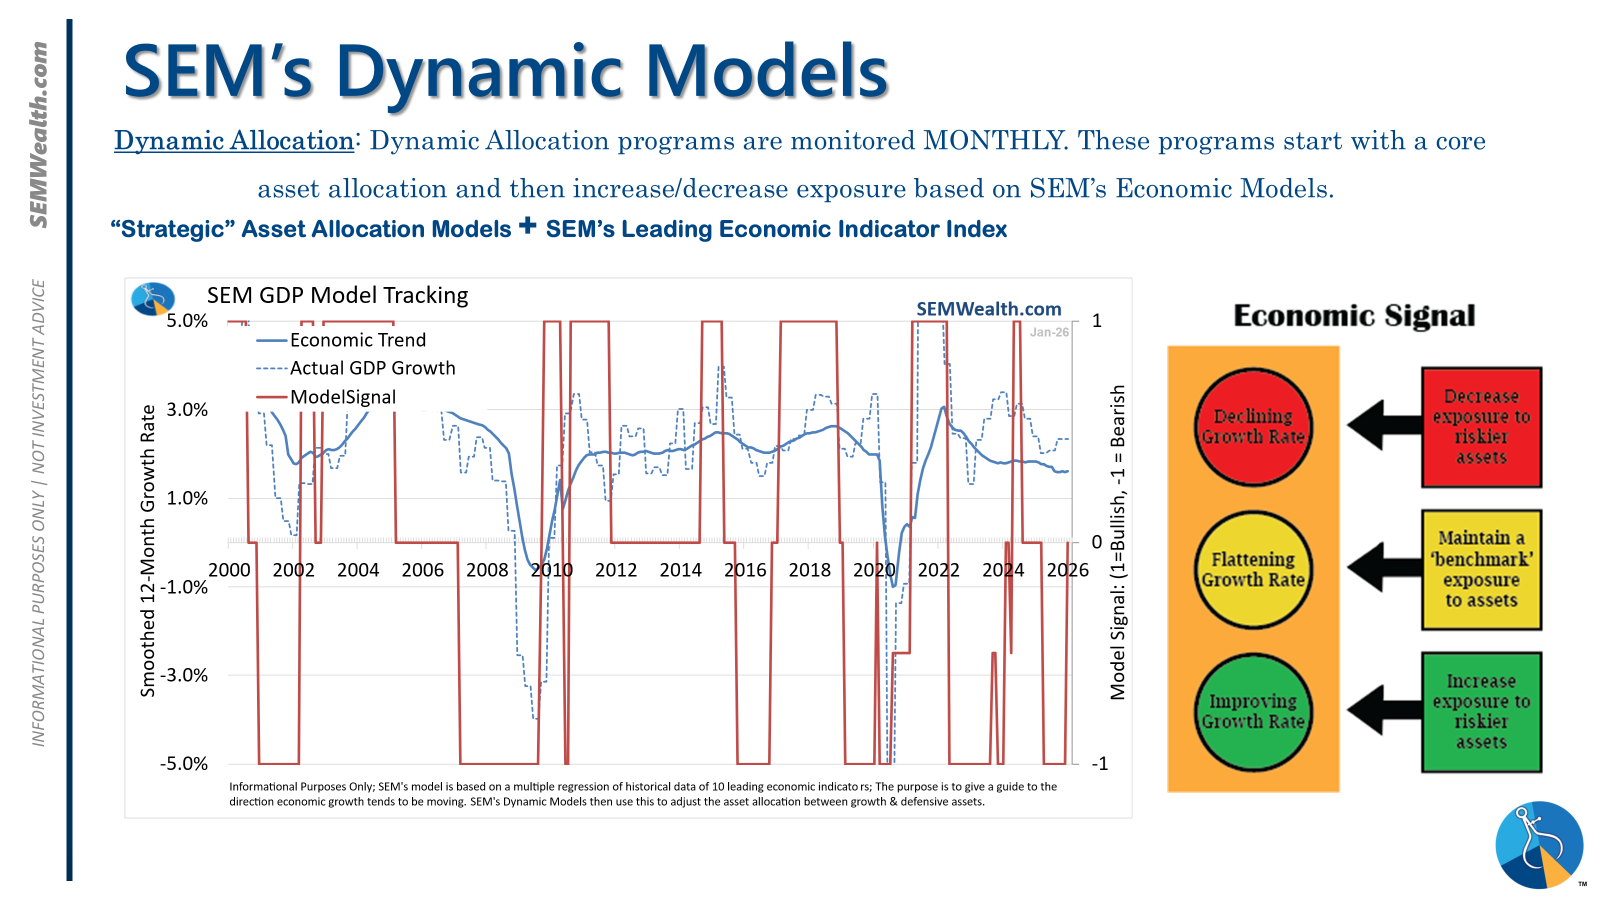
Despite what was overall negative economic data the past few week, our model was predicting that and has hinted maybe the worst is over. It moved from "bearish" to "neutral" in February. Keep in mind, due to the data delays, we are dealing with data from 2-3 months ago hitting the headlines, not what's actually happening now.
The Fed meets this week and given everything going on, I'd be shocked if they moved on interest rates.
Toby's Take
A look at our intern's top WSJ articles from last week
3/9/2026 - Iran Signals a Fight to the End With Appointment of Khamenei’s Son - WSJ
The United States goal in the conflict in Iran was to remove the people in power to allow the citizens to take over and form their own government instead of being under a dictator. However, Ayatollah Ali Khamenei's son Mojtaba Khamenei has now been appointed as Iran's new supreme leader. This goes against the U.S. plan and shows a greater threat to this war lasting longer than we had hoped.
3/10/2026 - Trump Advisers Urge Him to Find Iran Exit Ramp, Fearing Political Backlash - WSJ
The war going on in Iran is causing some problems at home that we citizens are already experiencing. In the last week the war shot oil prices up to over $100 per barrel. It has now fallen back down, but support back home is depleting. President Trump's advisers have told him that he may want to consider ending the United States involvement do to concern about political support. When things like this happen we can expect to see people want to get out of stocks for concerns of sudden drops.
3/11/2026 - Iran’s Control of Hormuz Means It’s Exporting More Oil Today Than Before the War - WSJ
Iran has control over the Strait of Hormuz. Their control is causing problems for oil shipments only allowing traffic linked with Iran and China. We had a drop in oil on Tuesday after President Trump said that the war would end "very soon," but could this be a sign of it lasting longer than anticipated? Either way oil is a shaky market right now. Let's hope this conflict ends soon.
3/12/2026 - Exclusive | President Trump’s Head-Spinning Pivot on an Emergency Oil Release - WSJ
President Trump has changed his mind on the release of emergency oil reserves to help calm the market. Due to the block happening in the Strait of Hormuz, an energy crisis is forming worldwide. After speaking with allies in the International Energy Agency, it was decided the international agency should be the one to release the oil reserves. This may help ease the market, but not our minds hinting at a longer lasting conflict.
3/13/2026 - Iran’s Leaders Play Diplomatic Hardball, Emboldened by Oil Shock - WSJ
After Iran made its move on the Strait of Hormuz and saw the shock that caused the World economy, they have become much more confident with their position. Now, their position is one of a harder stance on what they require instead of what we require for peace talks. They are demanding an end to airstrikes, reparations for the attack, and guarantees that they won't be attacked again. These are obviously very hard terms to meet especially as a political stand point for President Trump. It is uncertain how the United States will handle these new terms, but it creates more instability.
Market Charts
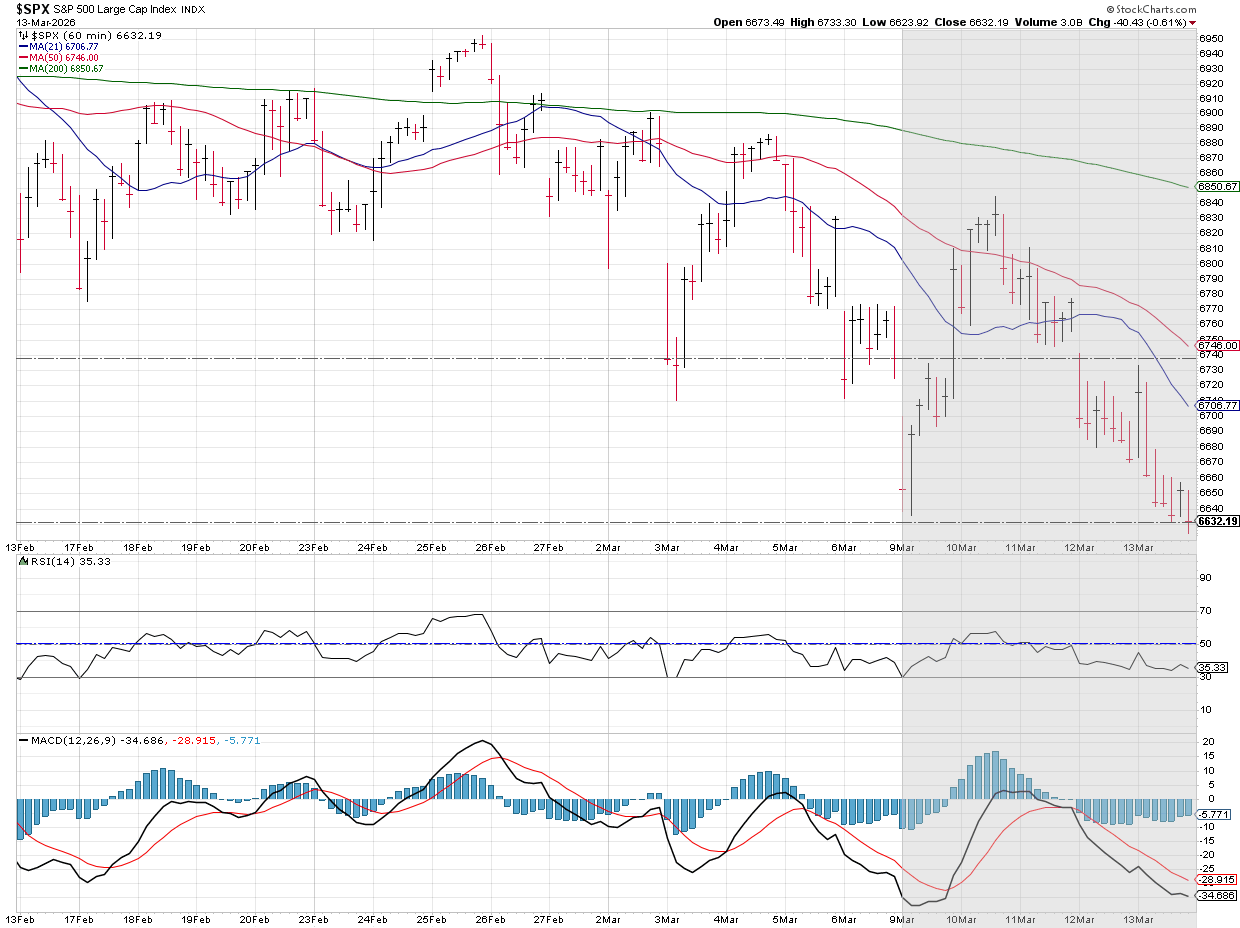
It was obviously a volatile week. Tuesday's attempted rally was quickly meet with more selling, closing the week at the opening lows from Monday.
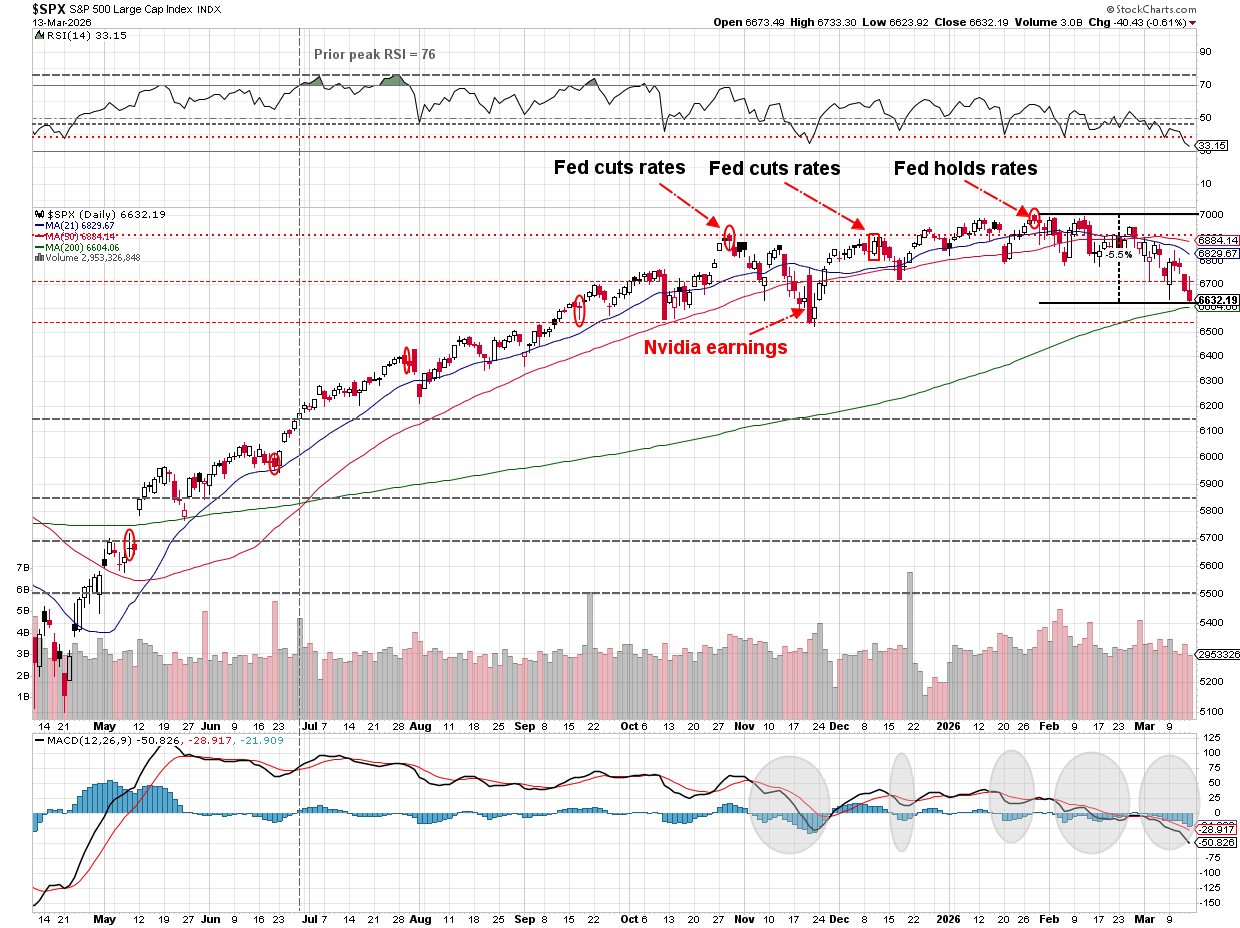
Zooming out, the support around 6700 was broken. The S&P is moving towards the 200-day moving average around 6600. A likely bigger problem is if the lows from last October and November are broken at 6525, more selling could emerge.
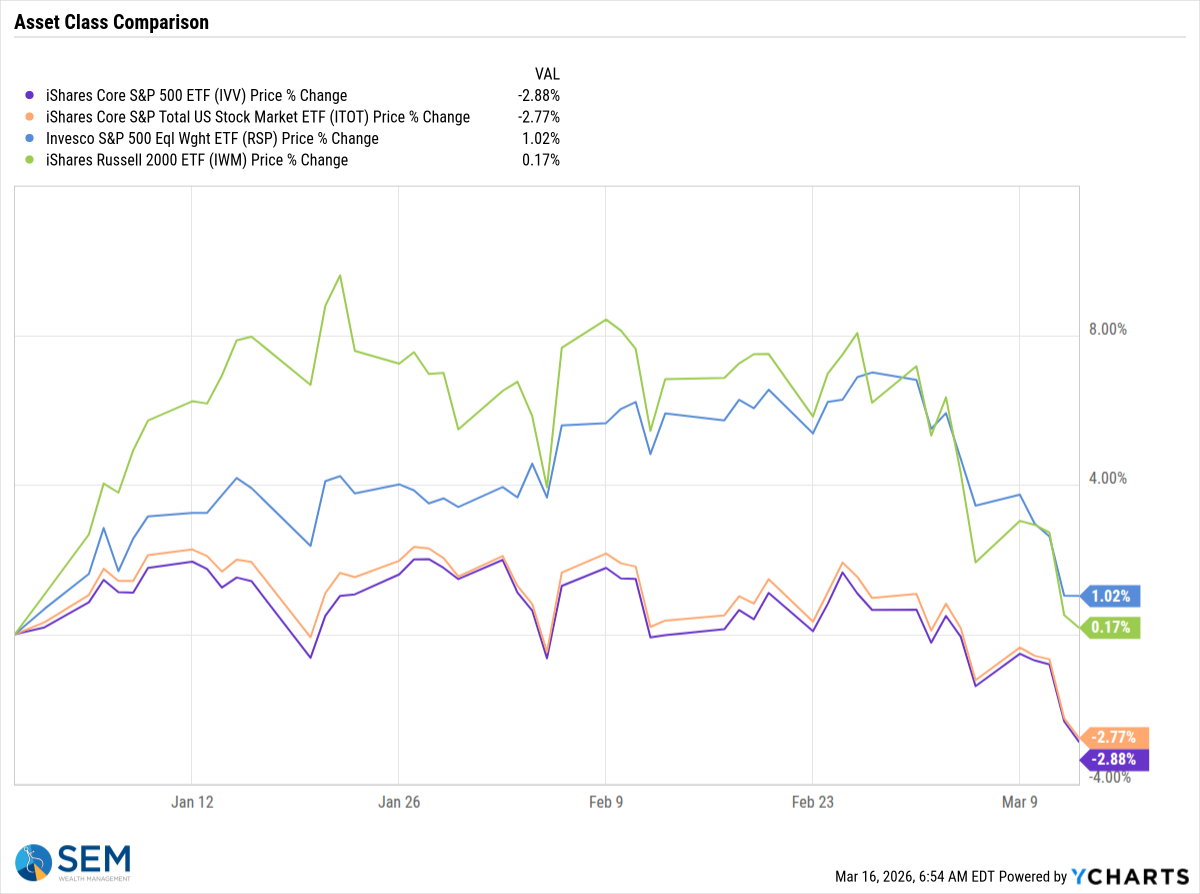
Small caps are still outperforming mega caps for the year, but they have taken a hit as the economic concerns start to build.
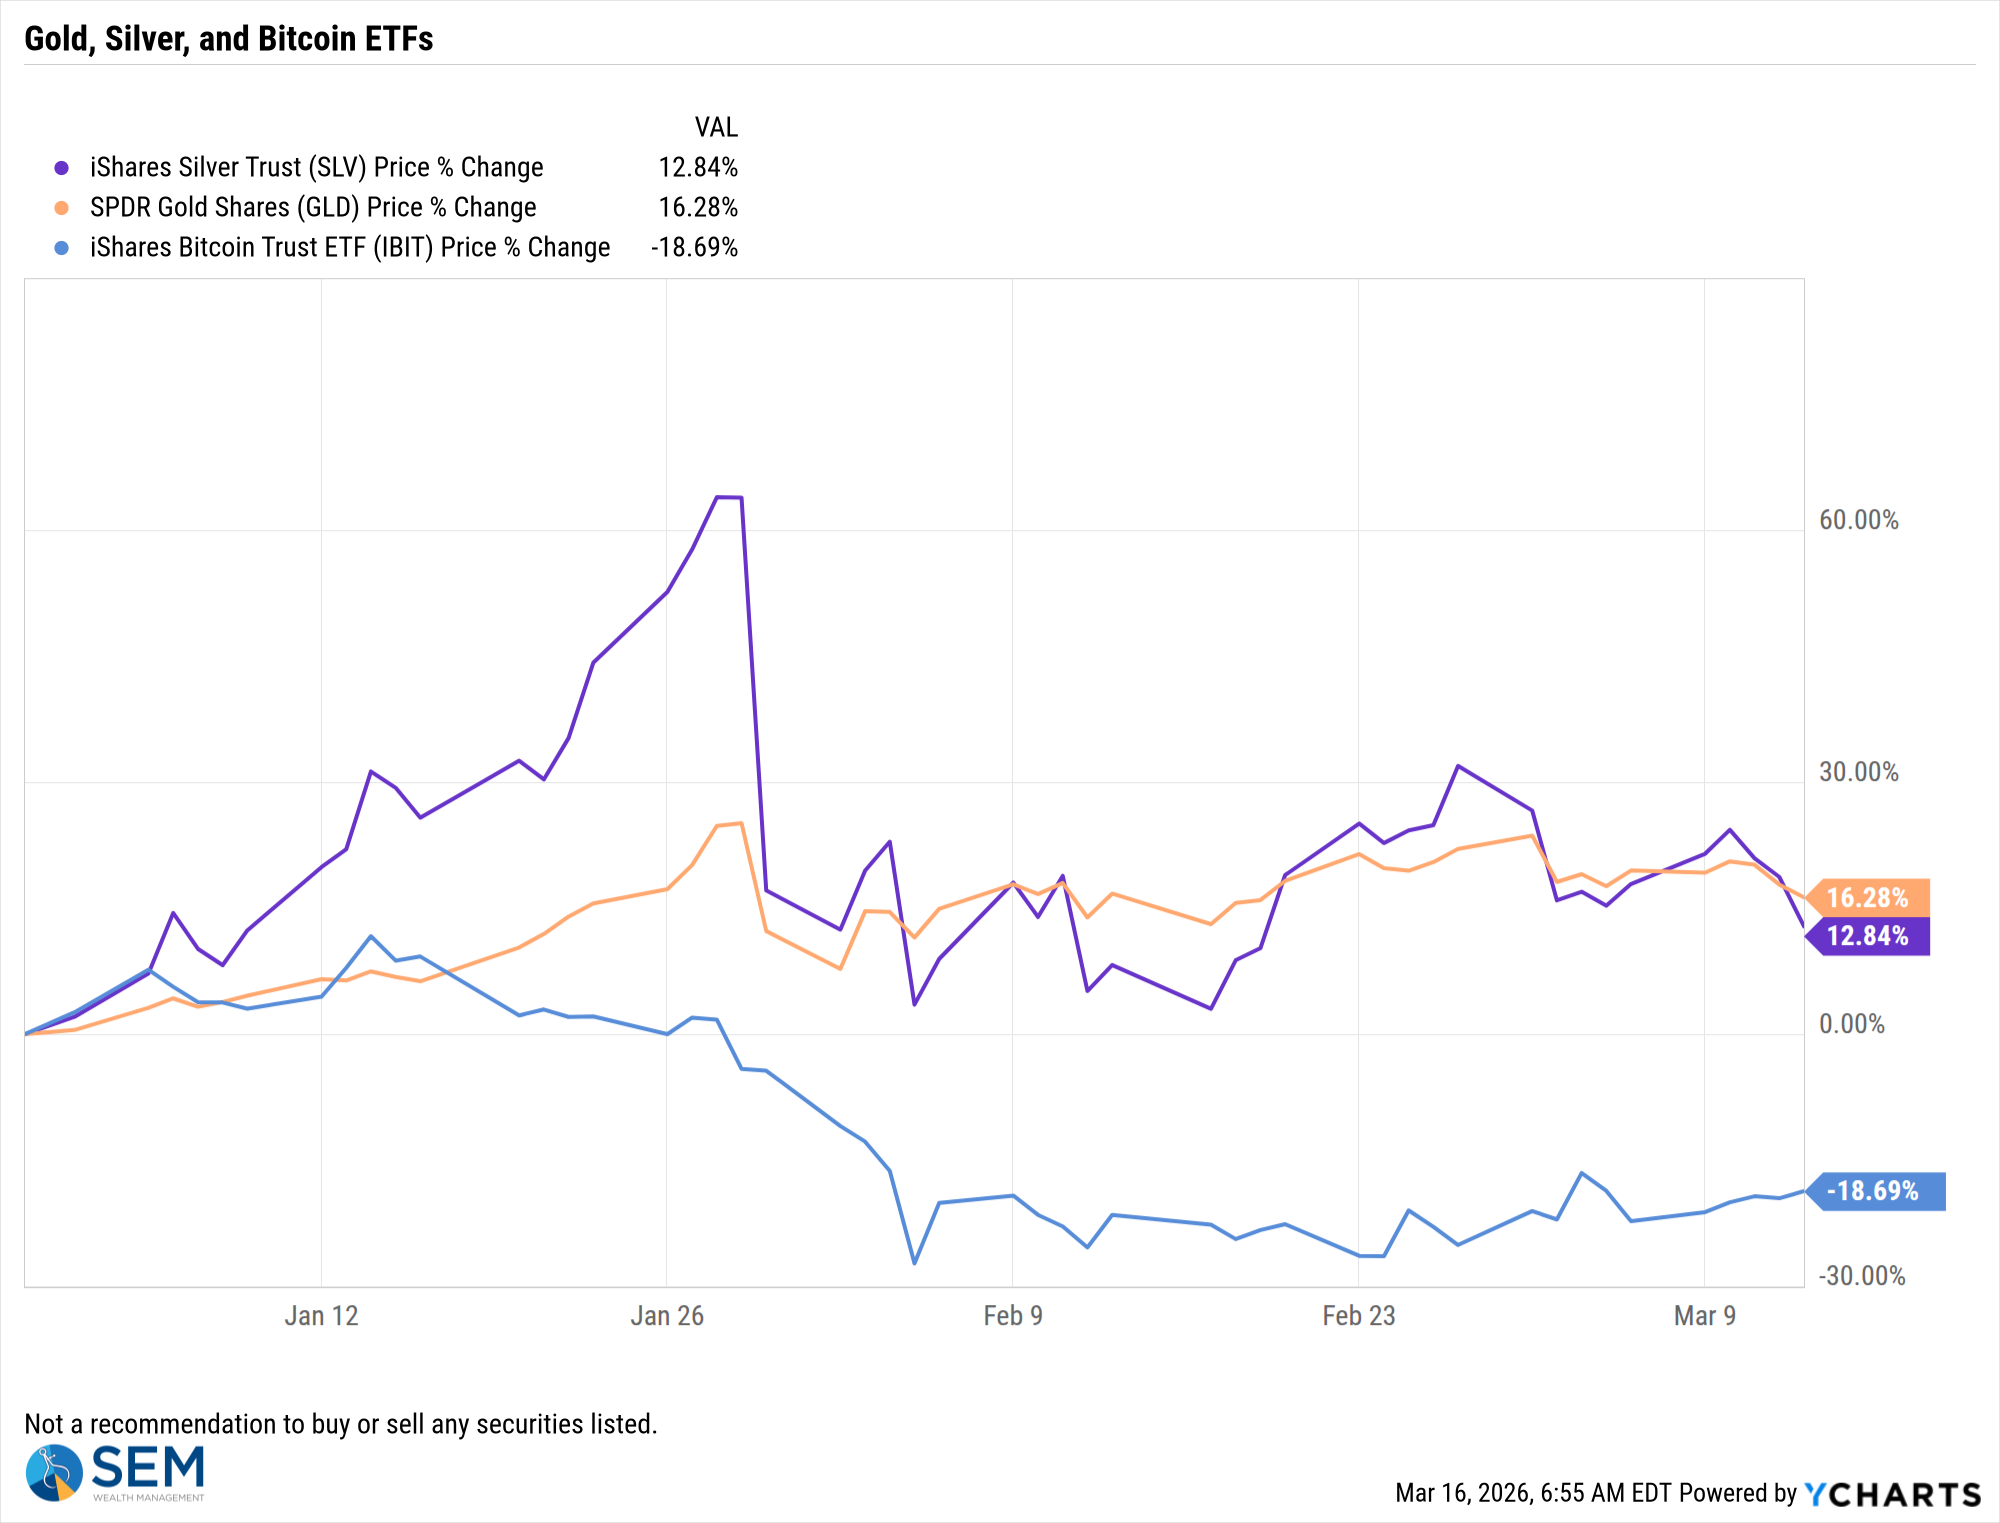
Bitcoin staged a rally last week while Gold and Silver fell. I honestly have no idea what to make of this. Normally you'd expect gold to be rallying on the news we are seeing, but we also know the rally the last half of last years wasn't anywhere near "normal".
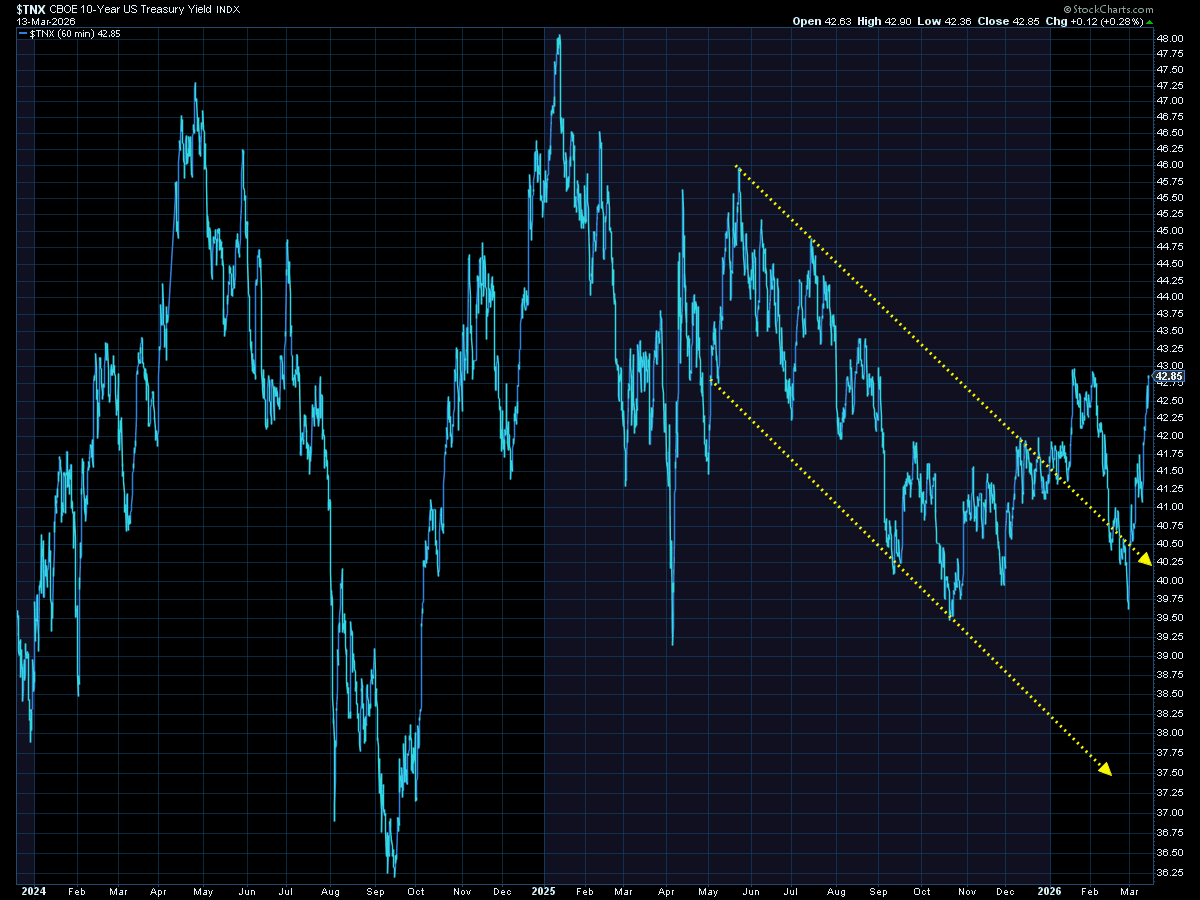
Interest rates have reacted negatively to the risks being added to the economy.
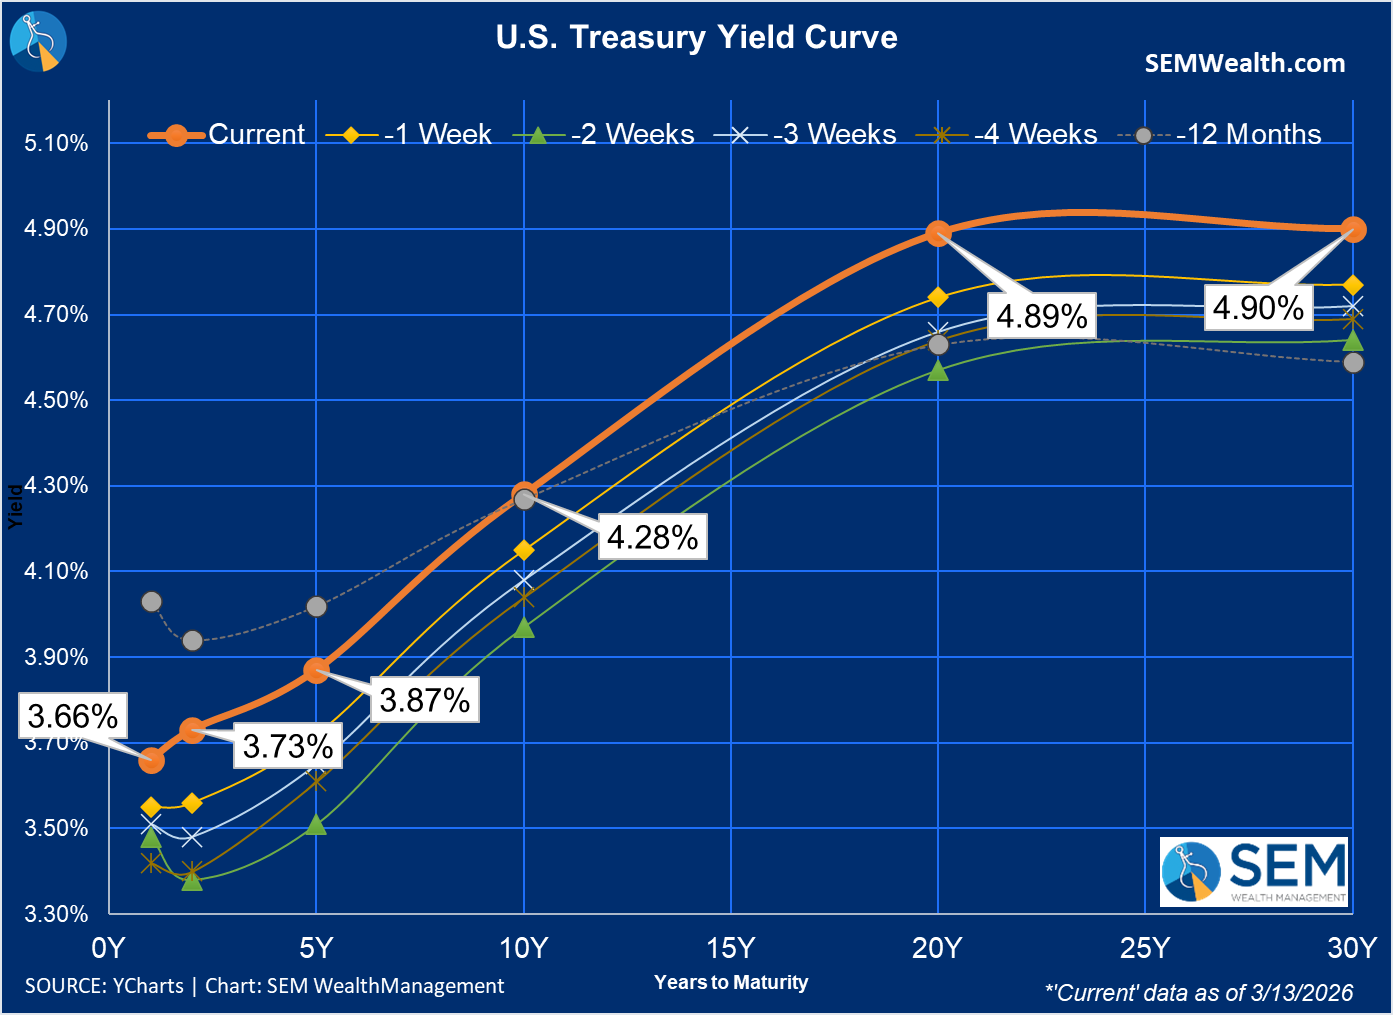
10-year rates are up nearly 40 basis points in just 2 weeks. Short-term rates have also moved higher as the prospects for a Fed rate cut in June has diminished. The 10-year is now approaching the highs of the year.
As always we will continue monitoring and will be ready to reduce risk as the models dictate.
SEM Market Positioning
| Model Style | Current Stance | Notes |
|---|---|---|
| Tactical | 100% MMKT | High-yield spreads narrow and trend has reversed lower |
| Dynamic | Neutral | Economic model turned neutral Feb 15 '26' – benchmark weightings |
| Strategic | Fully invested | Trend overlay shaved 10 % equity in April -- added back early July |
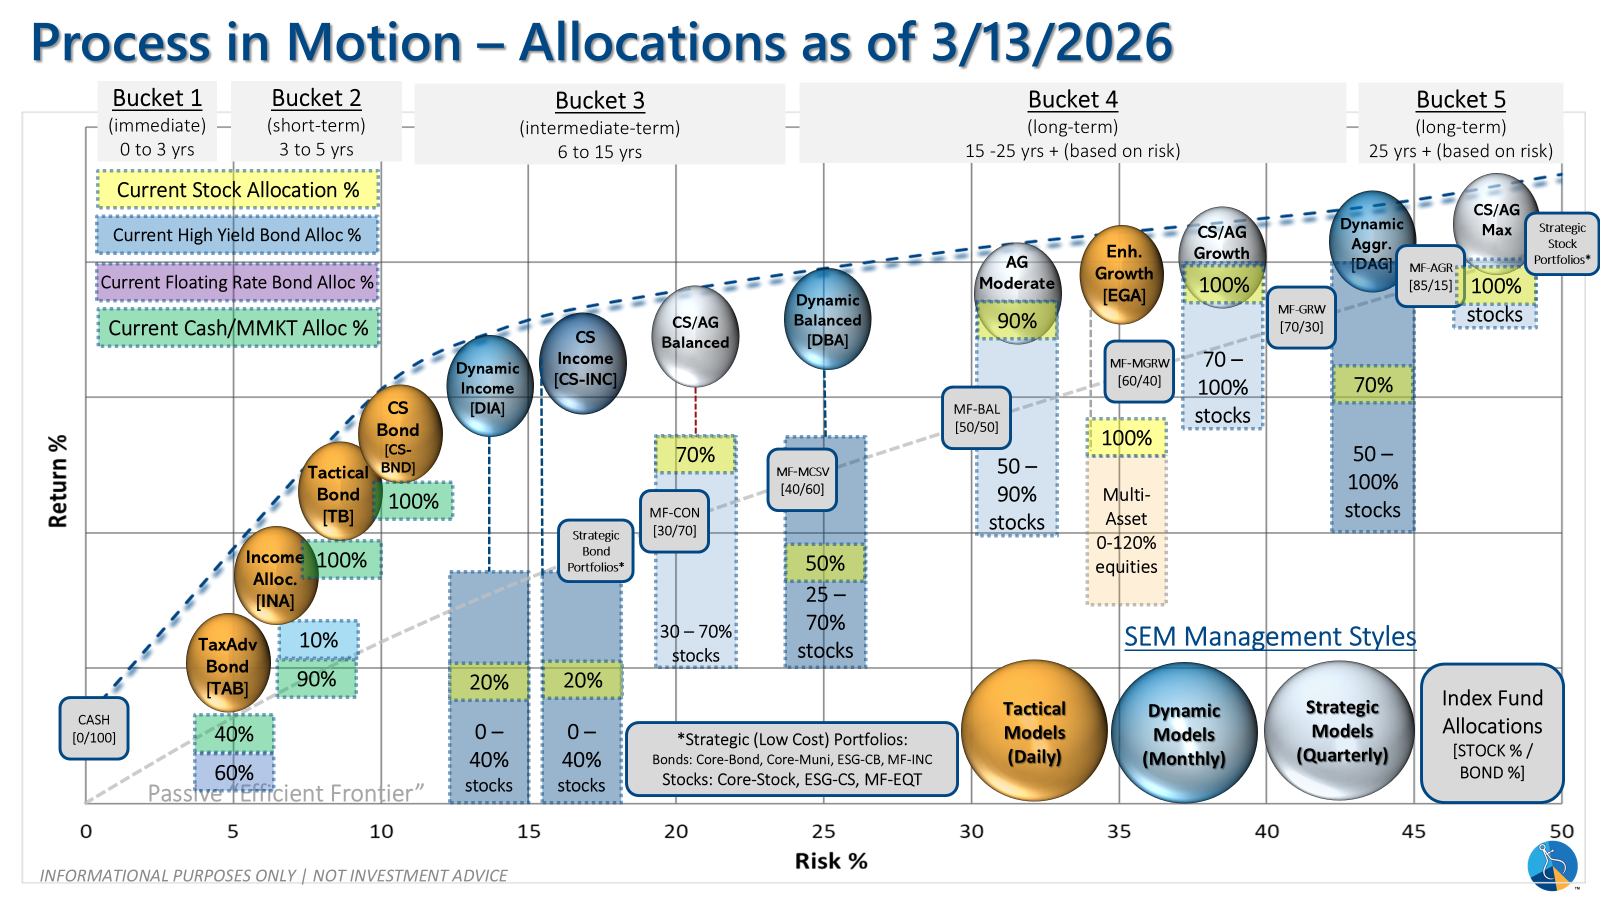
SEM deploys 3 distinct approaches – Tactical, Dynamic, and Strategic. These systems have been described as 'daily, monthly, quarterly' given how often they may make adjustments. Here is where they each stand.
Tactical (daily): The high yield system sold on 3/13/2026 after the buy signal from 4/25/2025.
Dynamic (monthly): The economic model went 'bearish' in June 2025 after being 'neutral' for 11 months. This means eliminating risky assets – sell the 20% dividend stocks in Dynamic Income and the 20% small cap stocks in Dynamic Aggressive Growth. The interest rate model is 'bullish' meaning higher duration (Treasury Bond) investments for the bulk of the bonds.
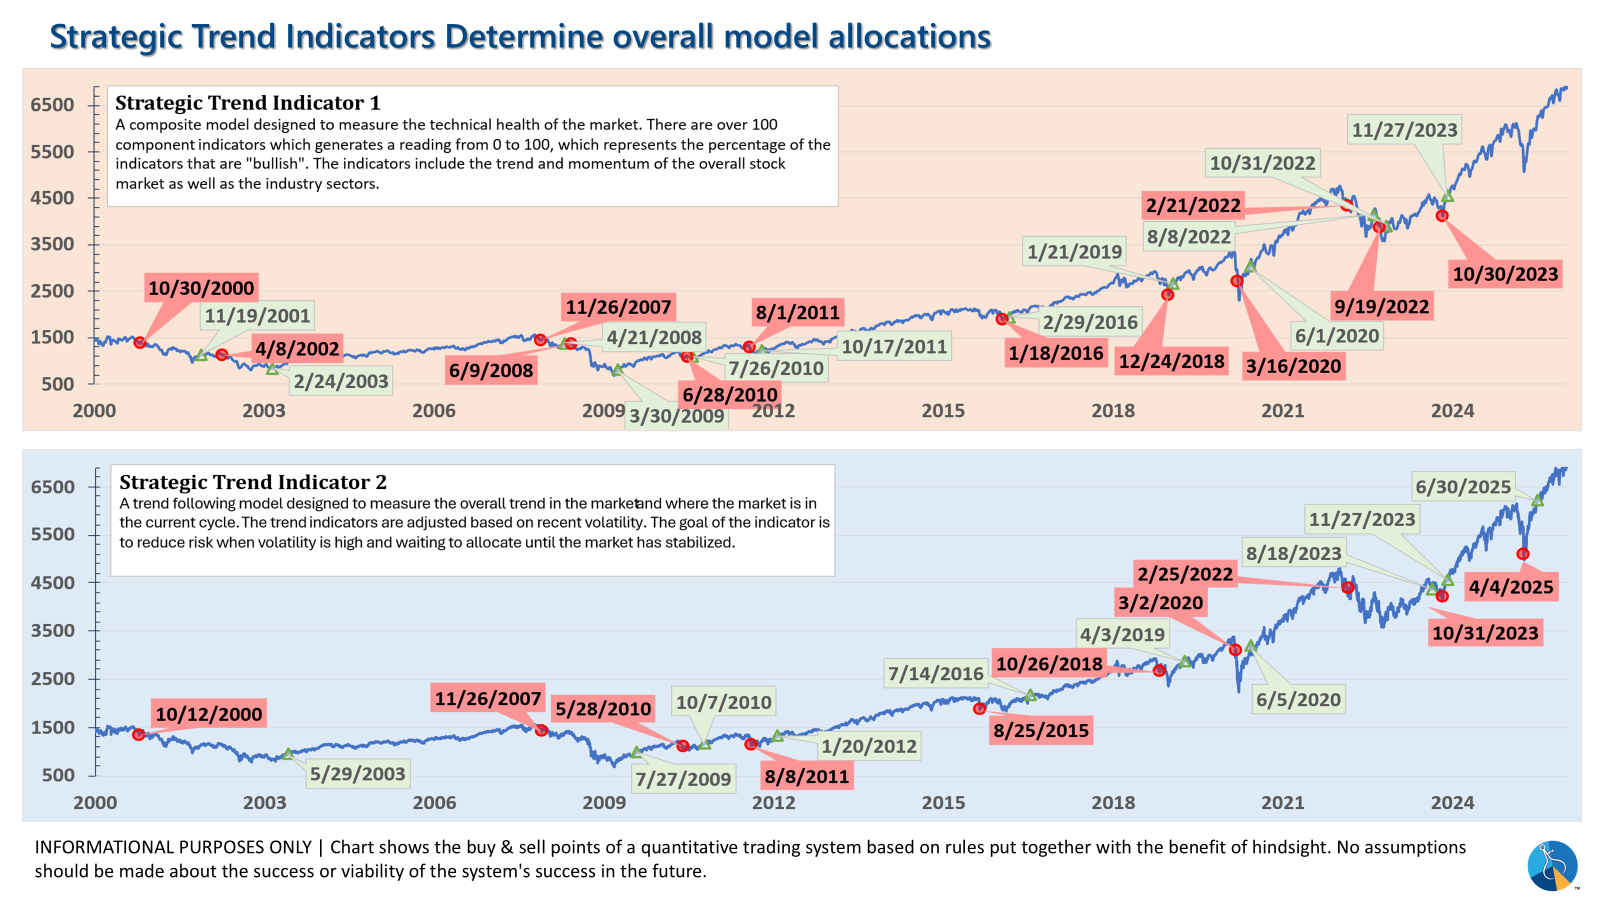
Strategic (quarterly)*: One Trend System sold on 4/4/2025; Re-entered on 6/30/2025
The core rotation is adjusted quarterly. This quarter we saw half of our international positions reduced (we sold developed markets and kept our emerging markets exposure). We also saw the remaining share of mid-cap reduced in favor of more small cap exposure. We remain with a "barbell" core portfolio – about half in large cap and half in small cap as the models expect the market to "broaden".
The * in quarterly is for the trend models. These models are watched daily but they trade infrequently based on readings of where each believe we are in the cycle. The trend systems can be susceptible to "whipsaws" as we saw with the recent sell and buy signals at the end of October and November. The goal of the systems is to miss major downturns in the market. Risks are high when the market has been stampeding higher as it has for most of 2023. This means sometimes selling too soon. As we saw with the recent trade, the systems can quickly reverse if they are wrong.
Overall, this is how our various models stack up based on the last allocation change:
Curious if your current investment allocation aligns with your overall objectives and risk tolerance?


