
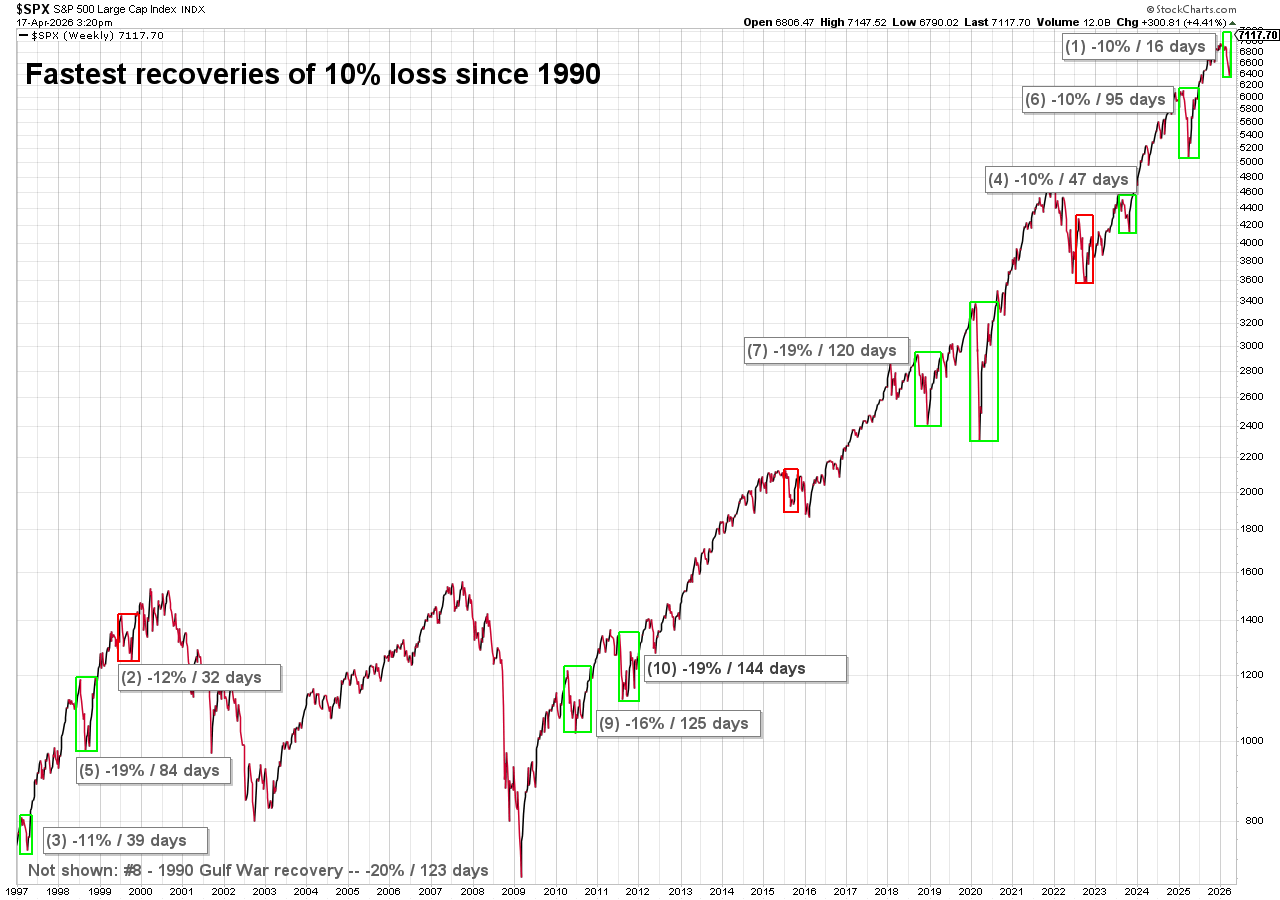
The stock market continues to break records.....literally. The stock market closed the week at all-time highs after posting the fastest recovery of a 10% or higher loss on record. The recovery was twice as fast as the next closest V-bottom. For comparison purposes, the snapback from the 2025 Liberation Day sell-off took 95 days.
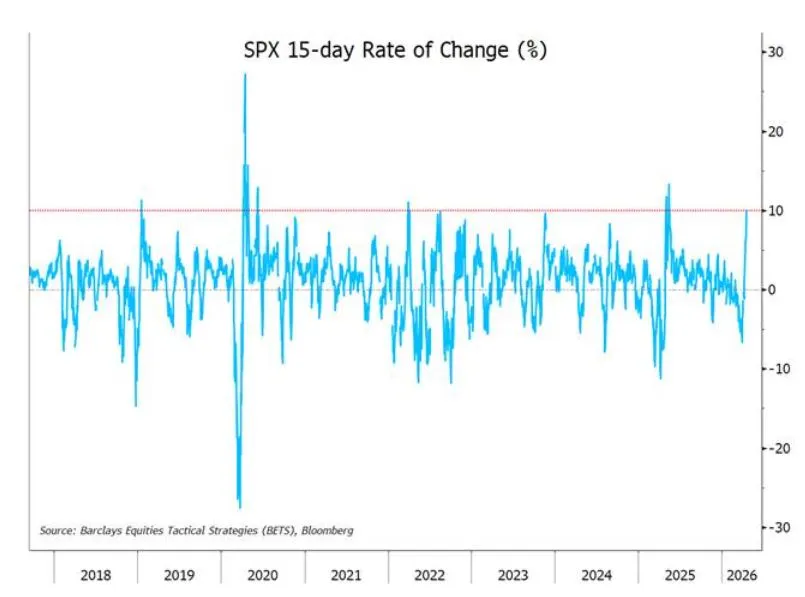
Here's another chart from Bloomberg showing the 15-day rate of change for the S&P 500. A rally of 3% per week for 3 consecutive weeks only occurred 7 times since 1928.
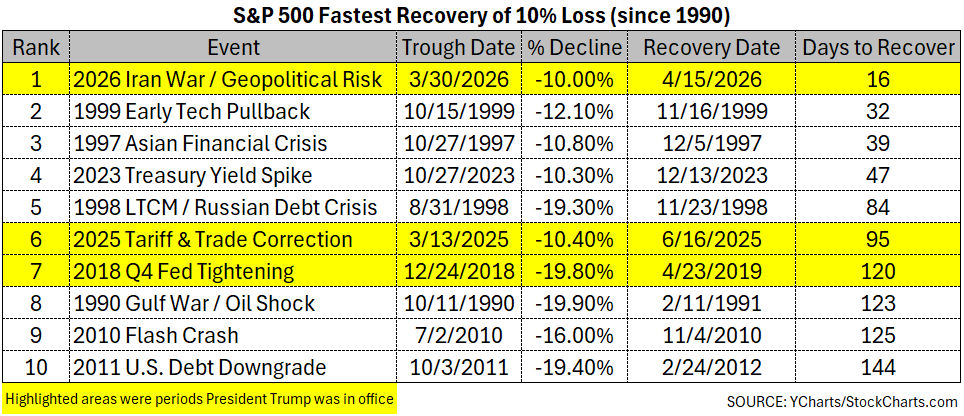
It is no coincidence 3 of the top 10 and 4 of the top 11 recoveries occurred when President Trump was in office. The COVID recovery in 2020 ranked 11th. His leadership style of escalating threats followed by a "deal" keeps everyone on edge.
3 of the top 10 also came during the tech bubble of the late 1990s. Last week we saw what looked a lot like the 2024-2025 market where anything related to AI outperformed everything else. This included Allbirds, the shoe manufacturer announcing the sale of its shoe line and a "pivot" to being an AI company. This led to a 600% rally in the stock before it fell 35%.
Last week I highlighted 3 concerns the market had prior to the War with Iran:
- AI / Data Center Spending
- Private Credit
- Recession (economy)
Based on the moves in the market, there is no concern about any of those things (for now.)
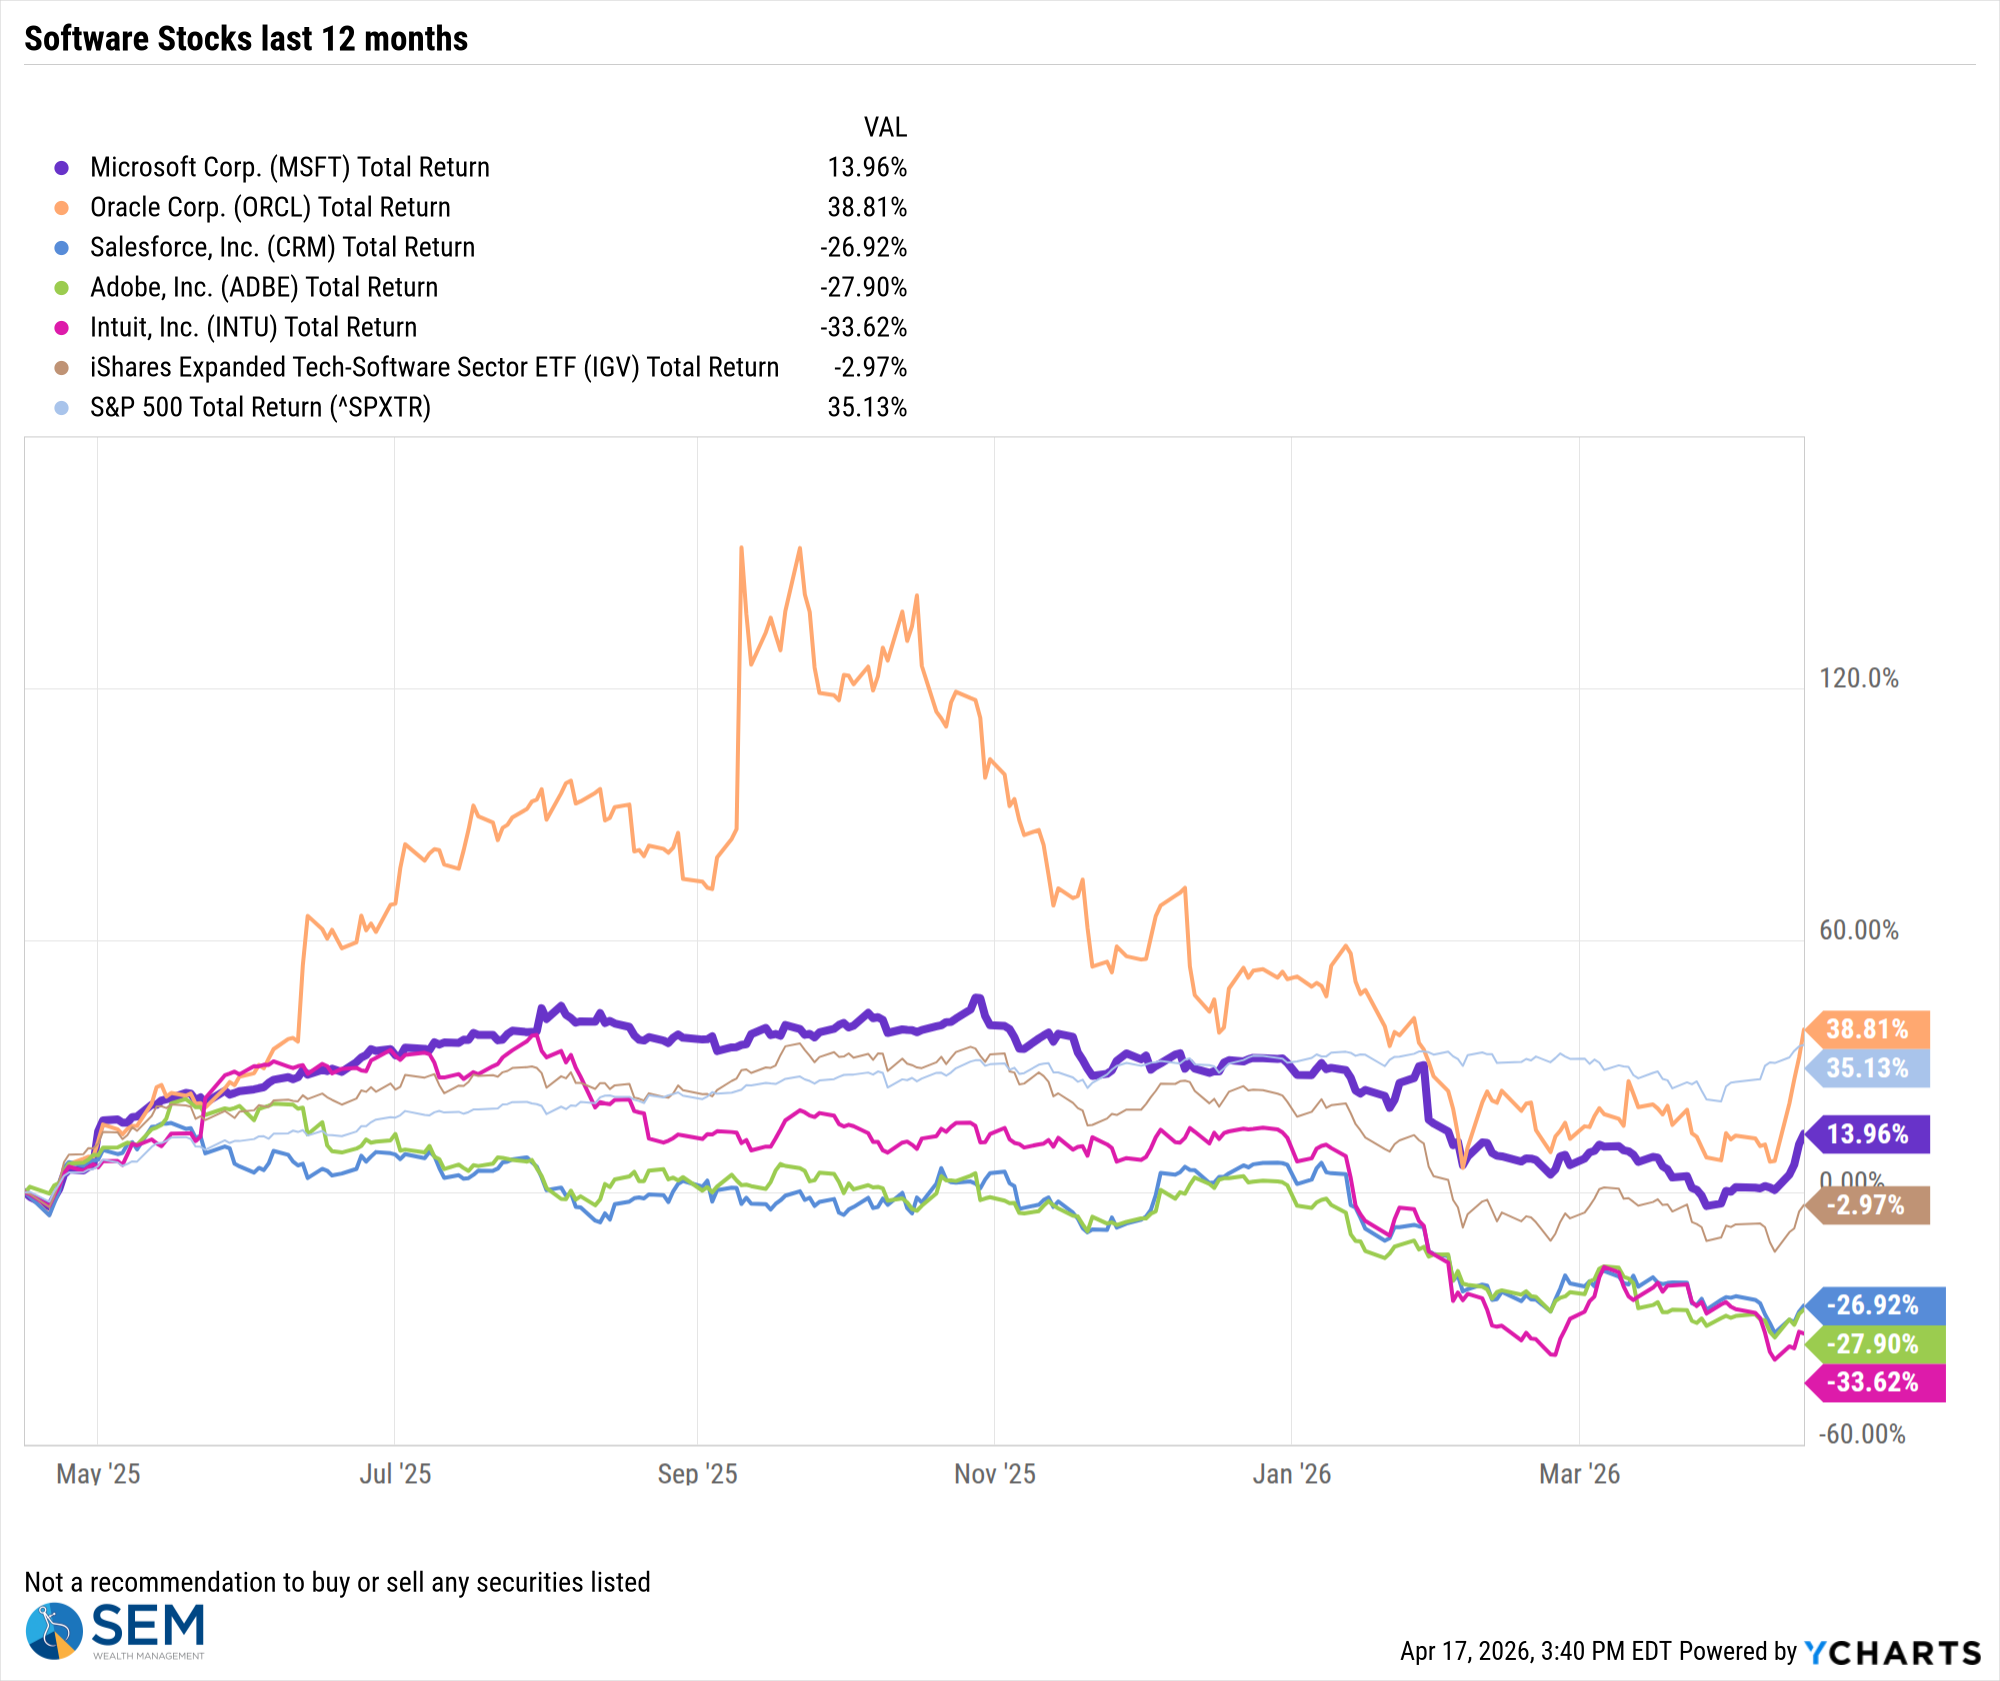
Software stocks, which had been hit earlier this year over fears of AI damaging their long-term revenue prospects, have had a huge recovery over the past 2 weeks. You can see the jump in companies like Oracle and Microsoft on the far right side of the chart.
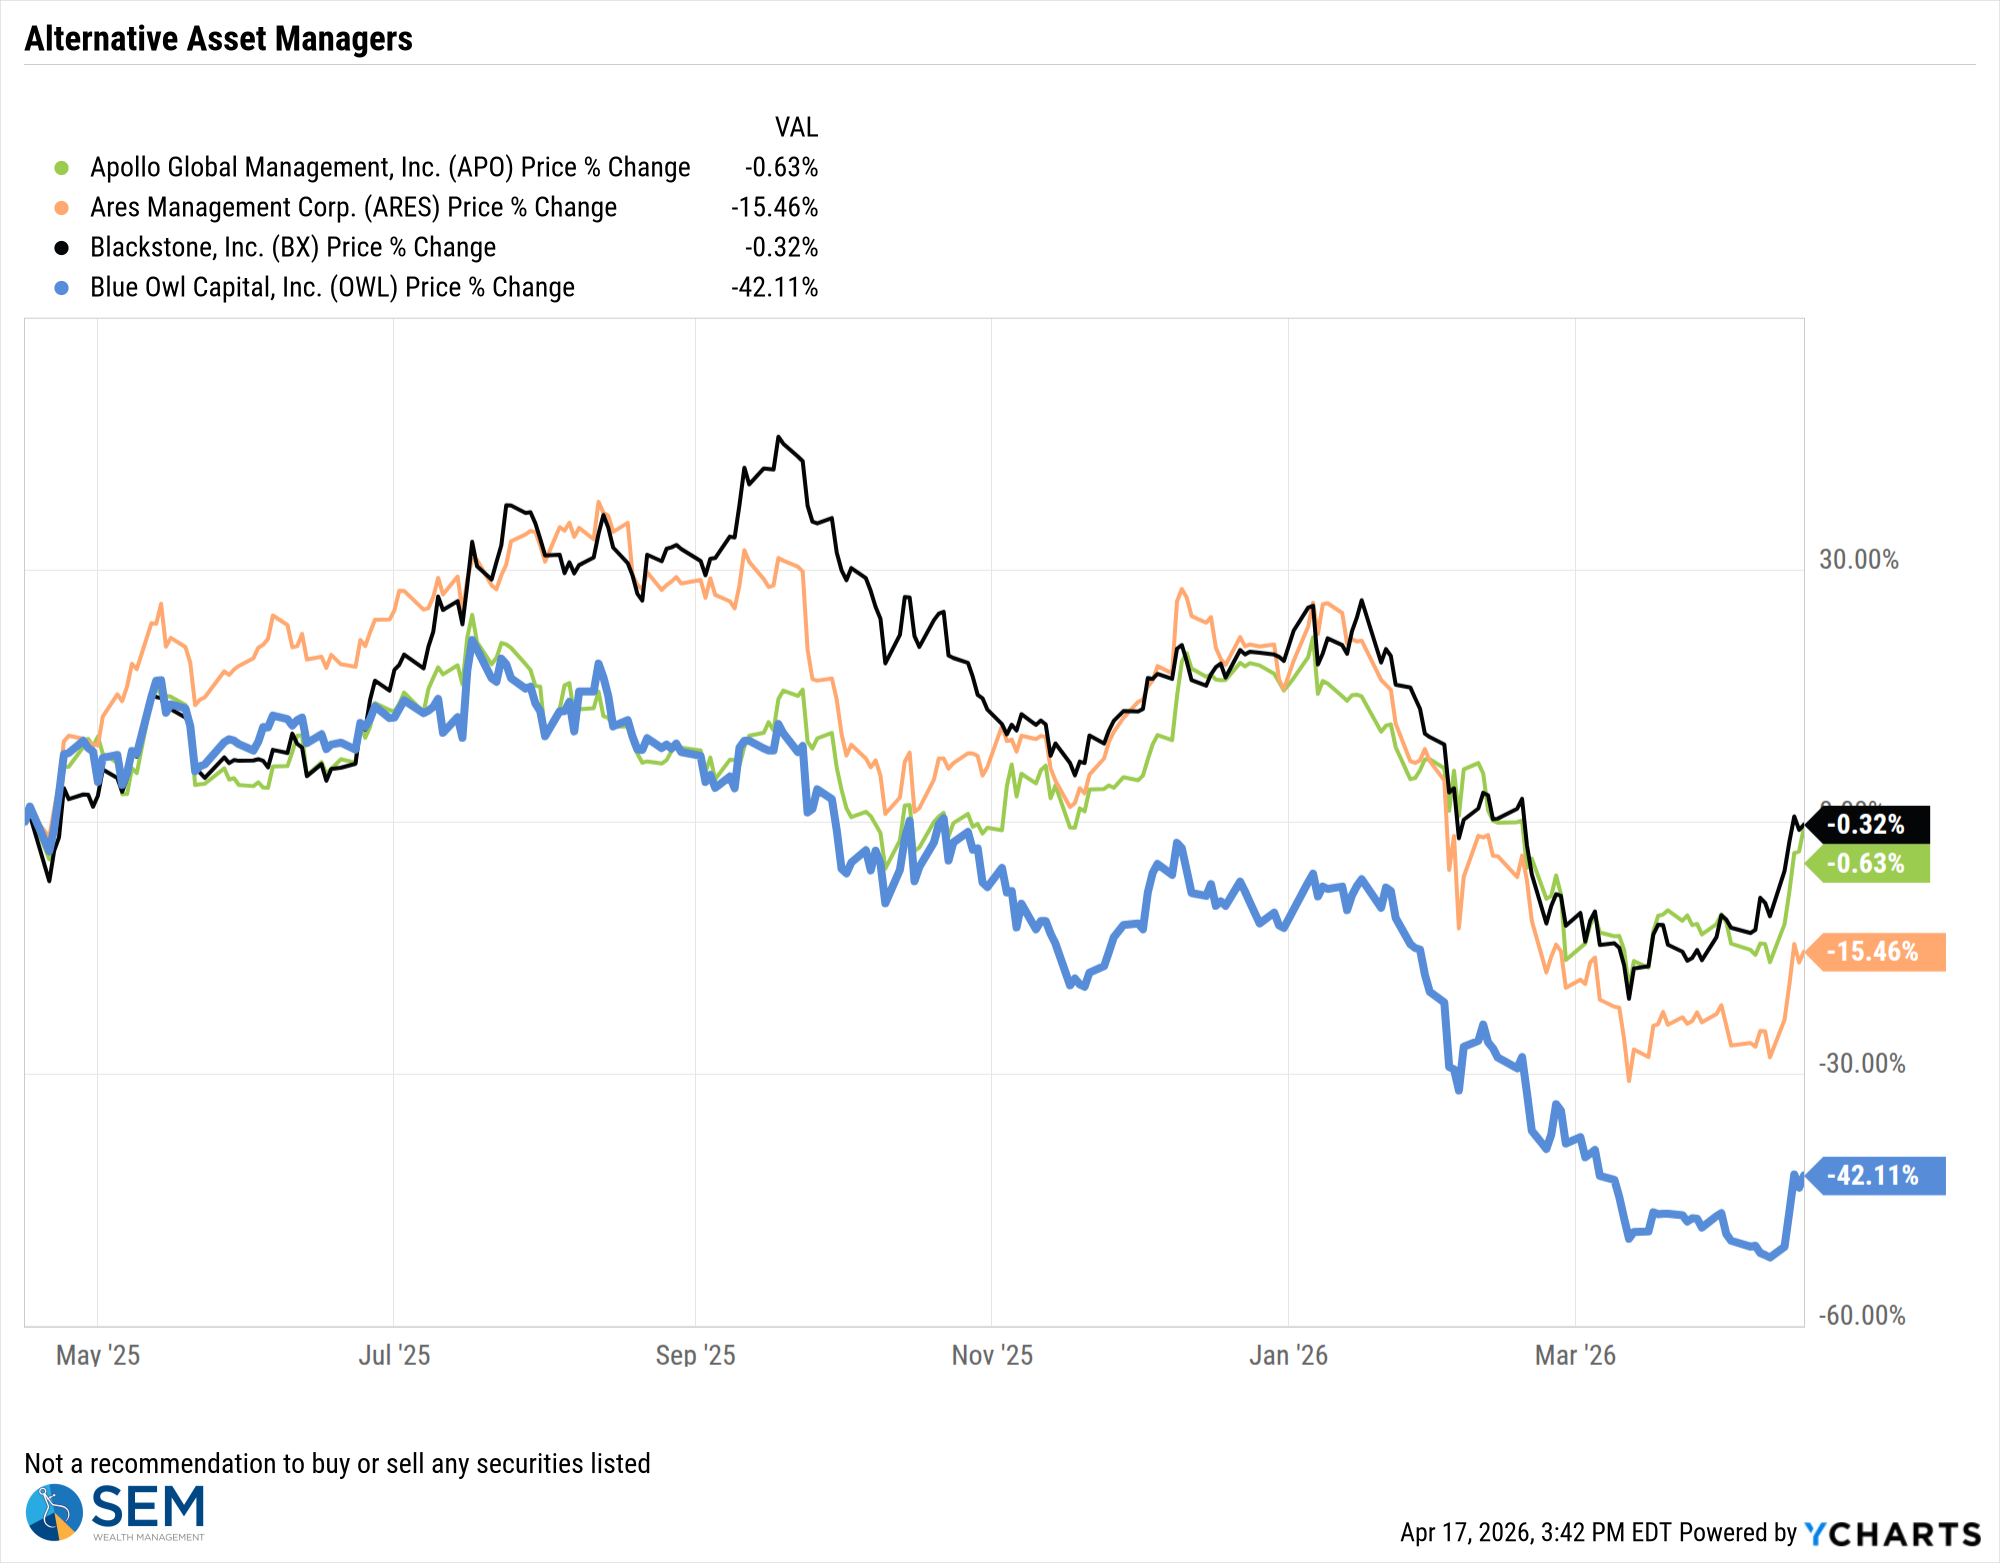
The Business Development Companies who also have been hammered over fears of Private Credit products becoming illiquid amid fears of losses also enjoyed a strong rally the past two weeks.
As for the economy, Building Permits, one of our key leading indicators was again pushed back, this time until April 29. We are working off of January data currently. There were no other key economic indicators released last week. Other than the 2nd release of the University of Michigan Consumer Sentiment index, there aren't any key releases this week either. I would expect the Consumer Sentiment index, which hit an ALL-TIME low in the initial release to bounce back. The first survey occurred shortly after the the "end the Iranian civilization" threats from the President.
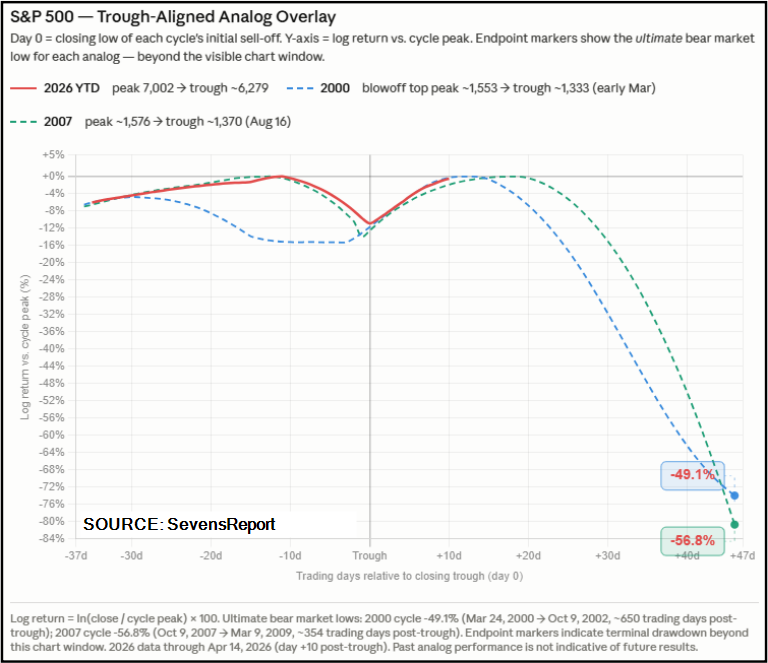
One final thought – not all "V-bottoms" are a positive. I mentioned that 3 of the top 10 recoveries occurred in the later years of the tech bubble. We also saw a similar move in 2007 after a couple of Wall Street hedge funds had closed due to sub-prime mortgage exposure. These "blow-off tops" ended up being the final move before the market collapsed. I'm not saying this is the same thing, but we all need to be cautious about getting overly excited because there are still some serious fundamental issues which could erode earnings and economic growth in the months ahead.
I thought this chart from the Sevens Report was interesting as it compared the blow-off tops of 2000 and 2007 to what we are seeing currently. The market can continue to rally for a while, but history tells us there is a chance we see it revert back to the long-term trend, which would take it 30-50% lower from here.
For now, the trend is up and we are invested accordingly. We will make adjustments based on the DATA, not our feelings and we urge our readers to do the same.
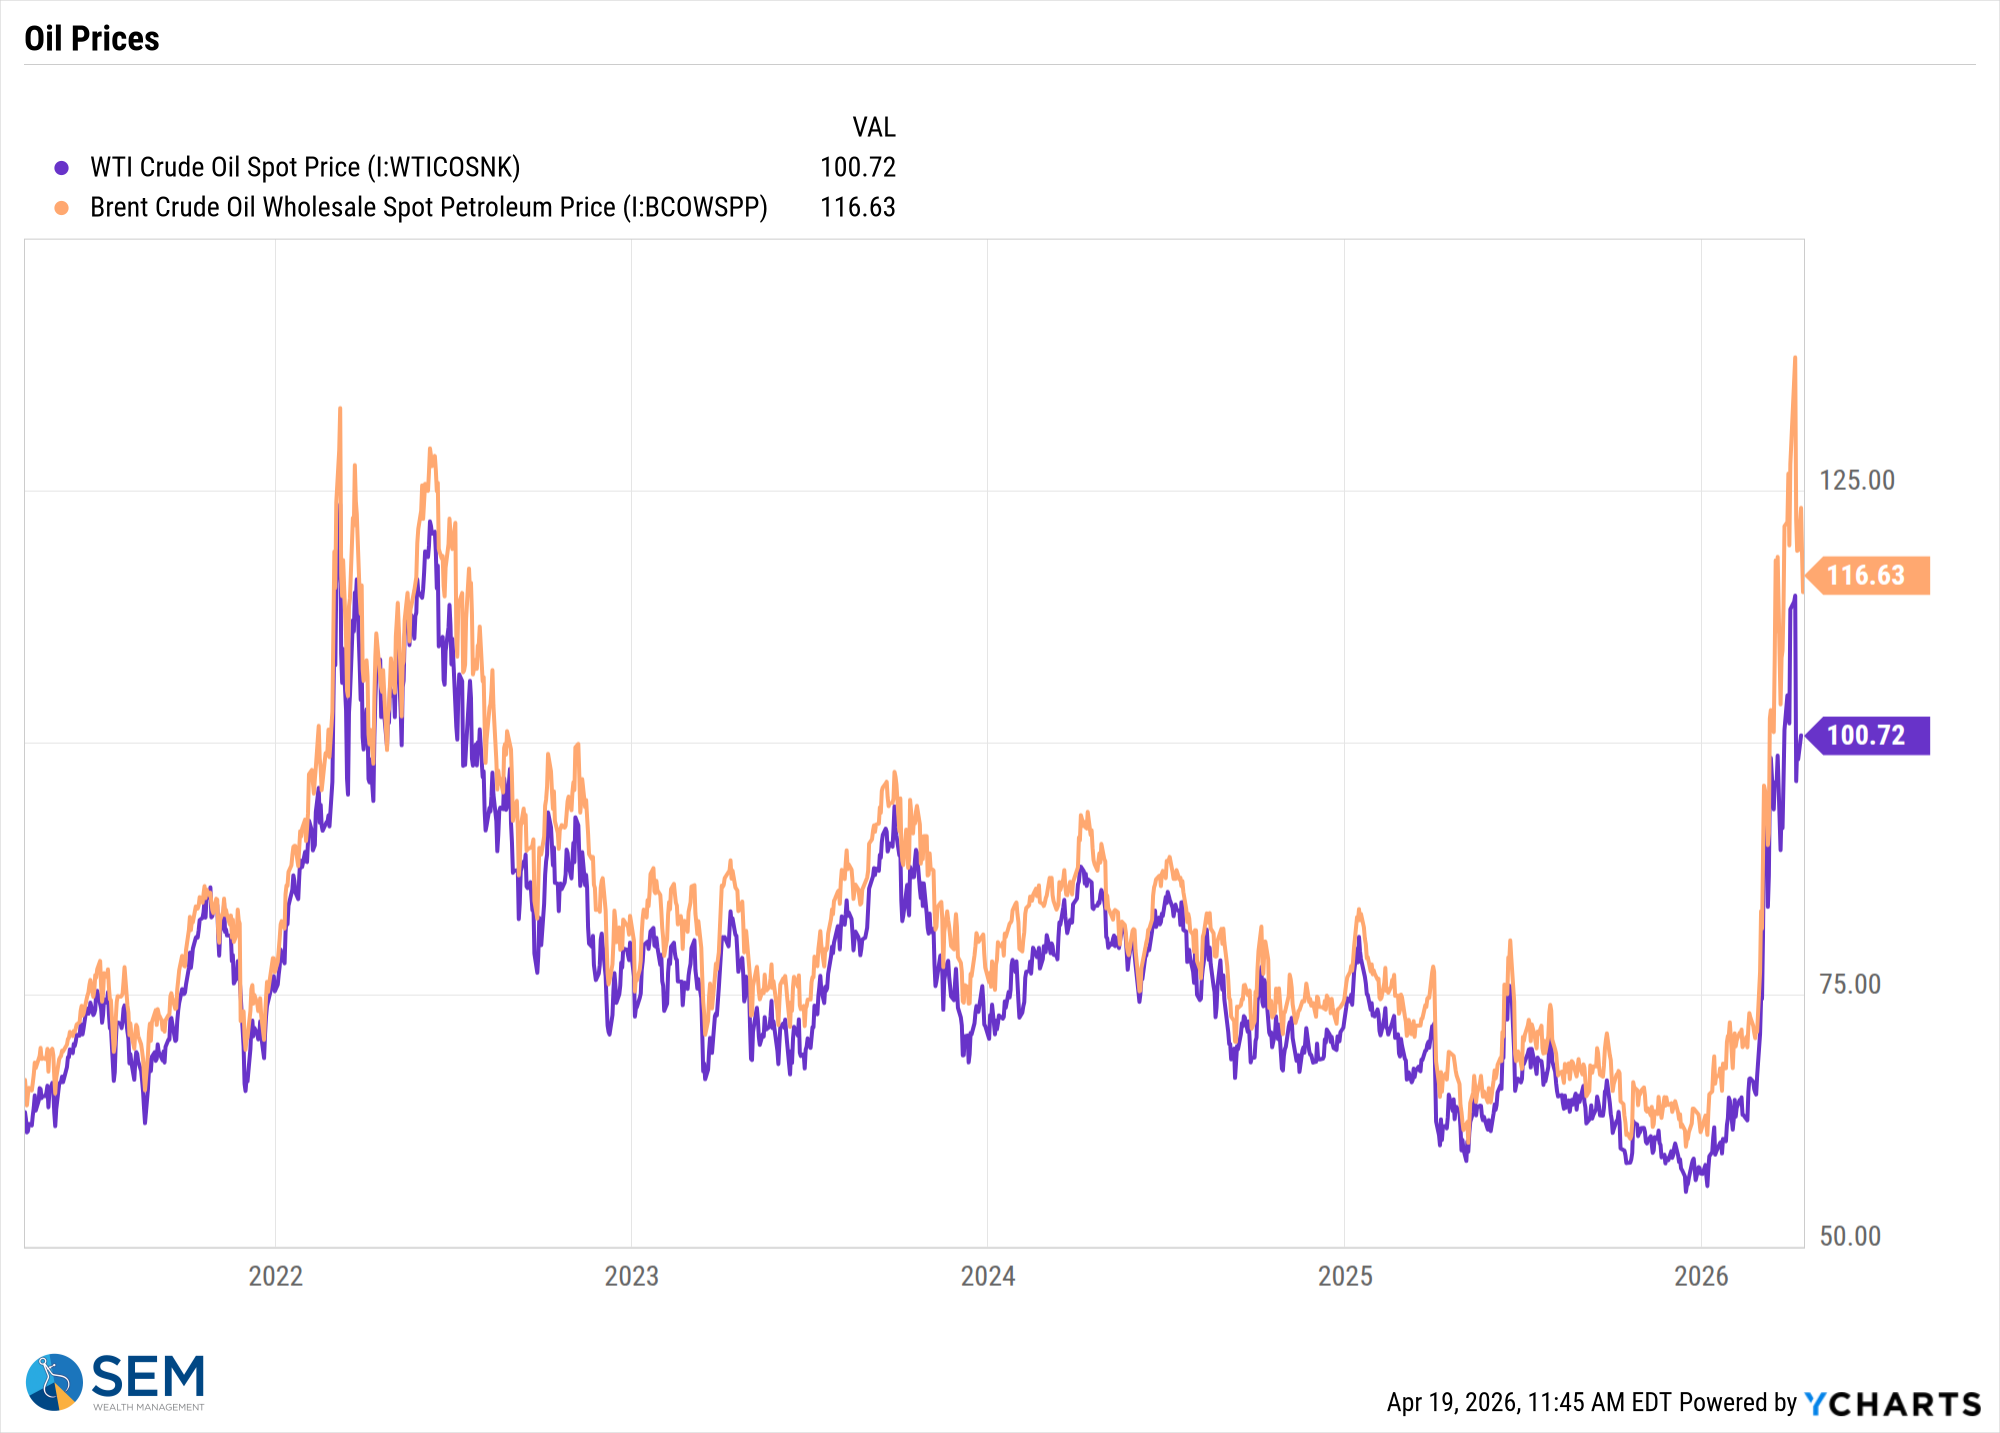
We also still have the risk that the war is not over. Even if it is, oil prices may take a long time to come down and may not hit the low levels we enjoyed the last two years. That is because a new "risk premium" has emerged with the "new" regimen in Iran.
Market Charts
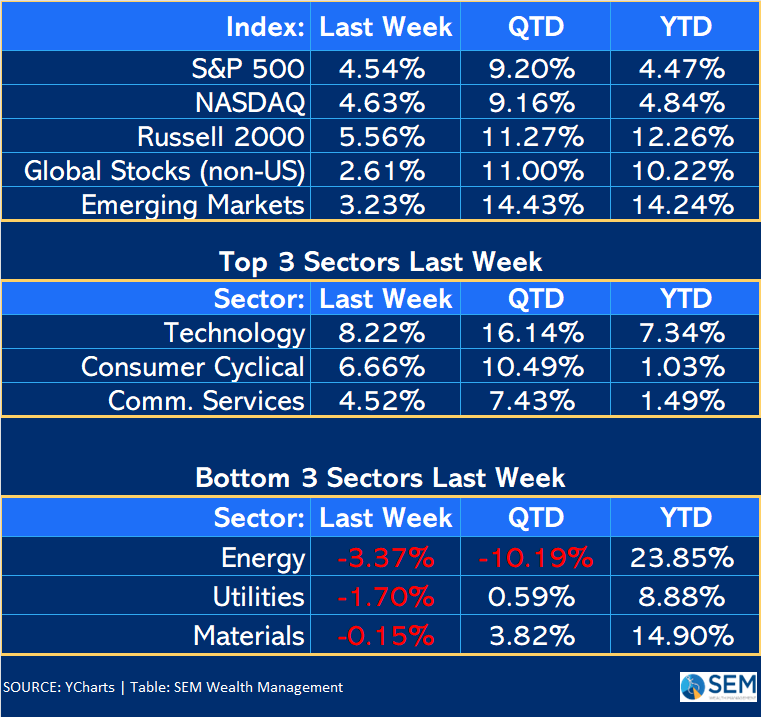
Even after the big tech driven rally last week, small caps continue to lead the way both for the year and for the month of April. A return to a "narrow" market would be a negative sign.
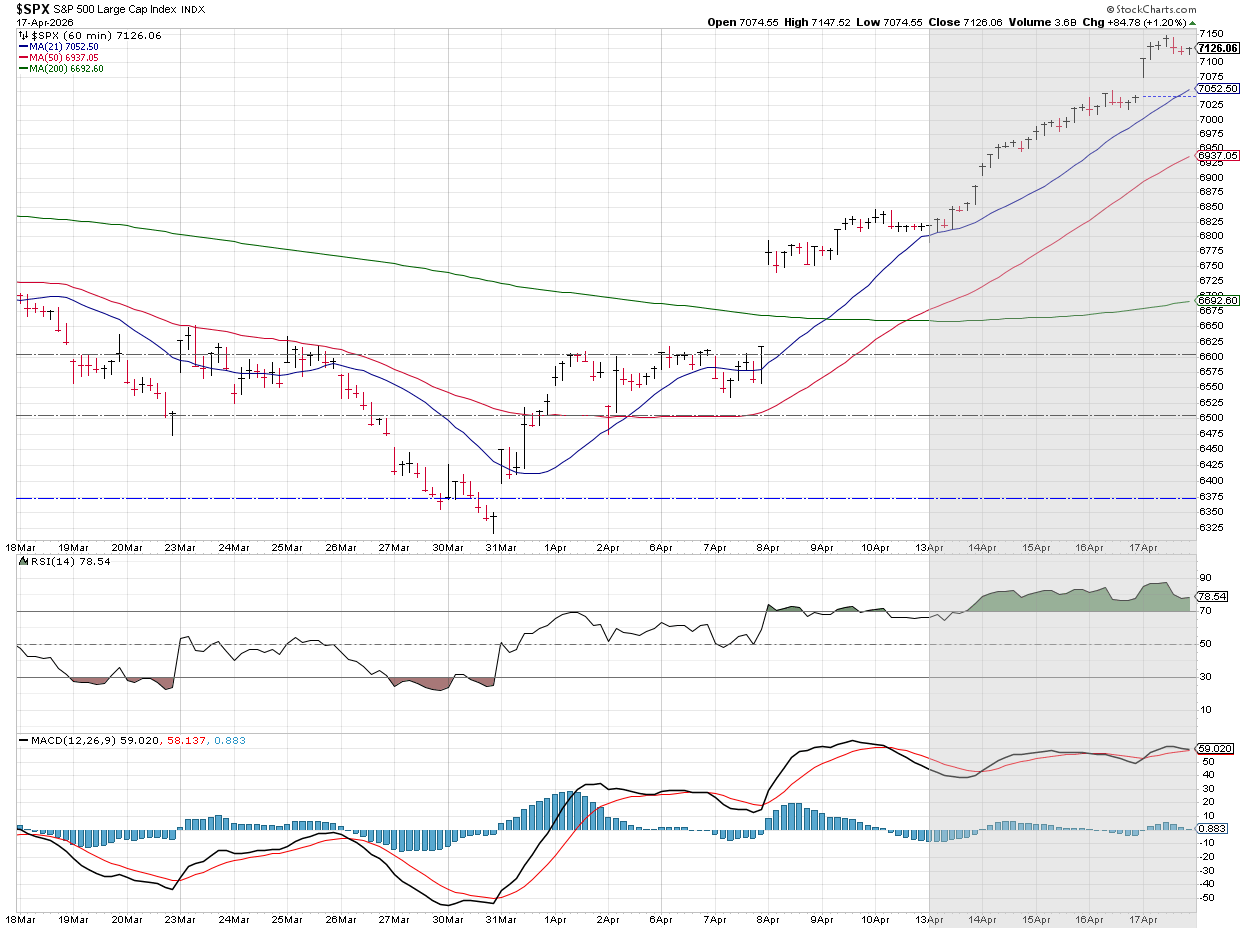
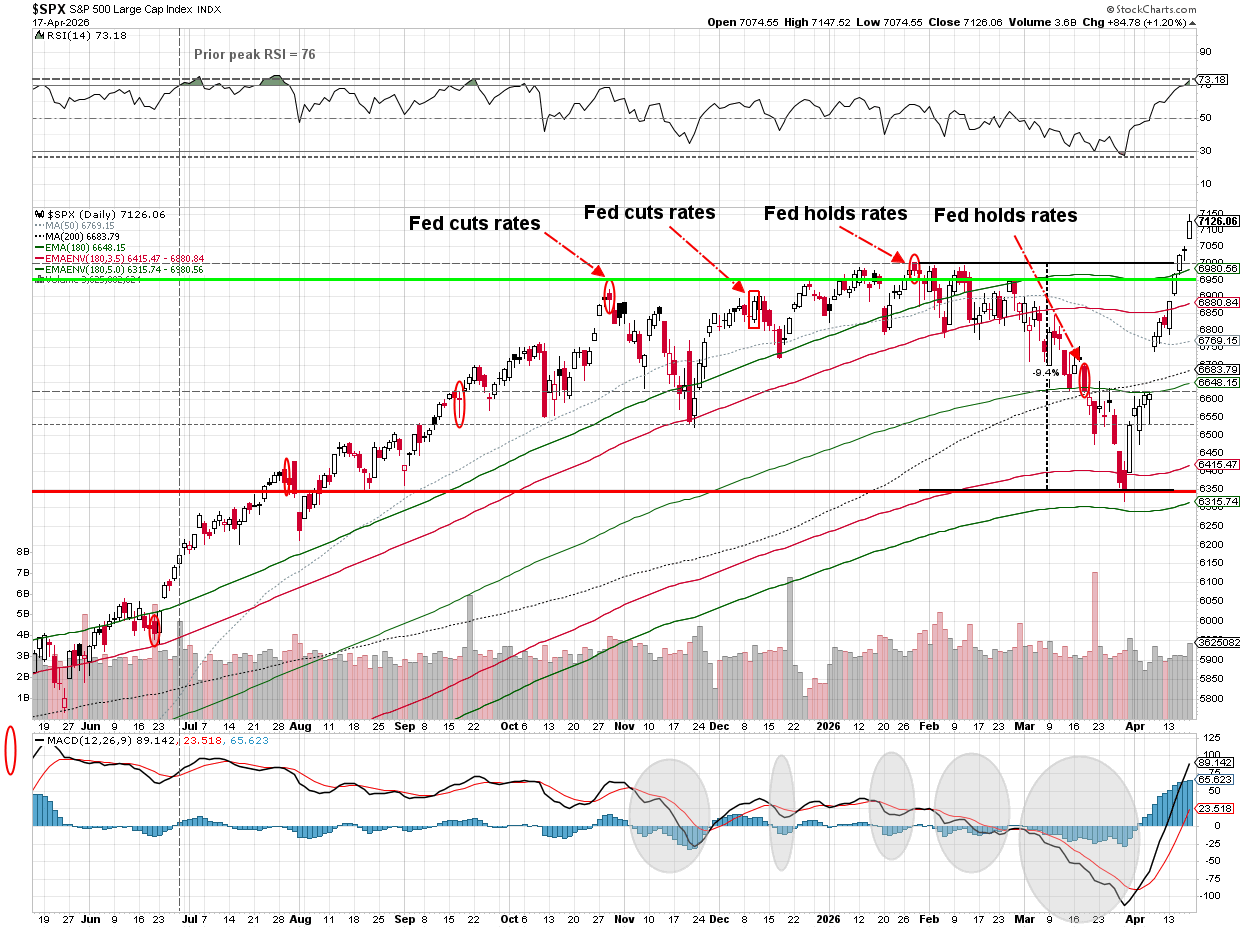
It's been a solid rally so far for the S&P.
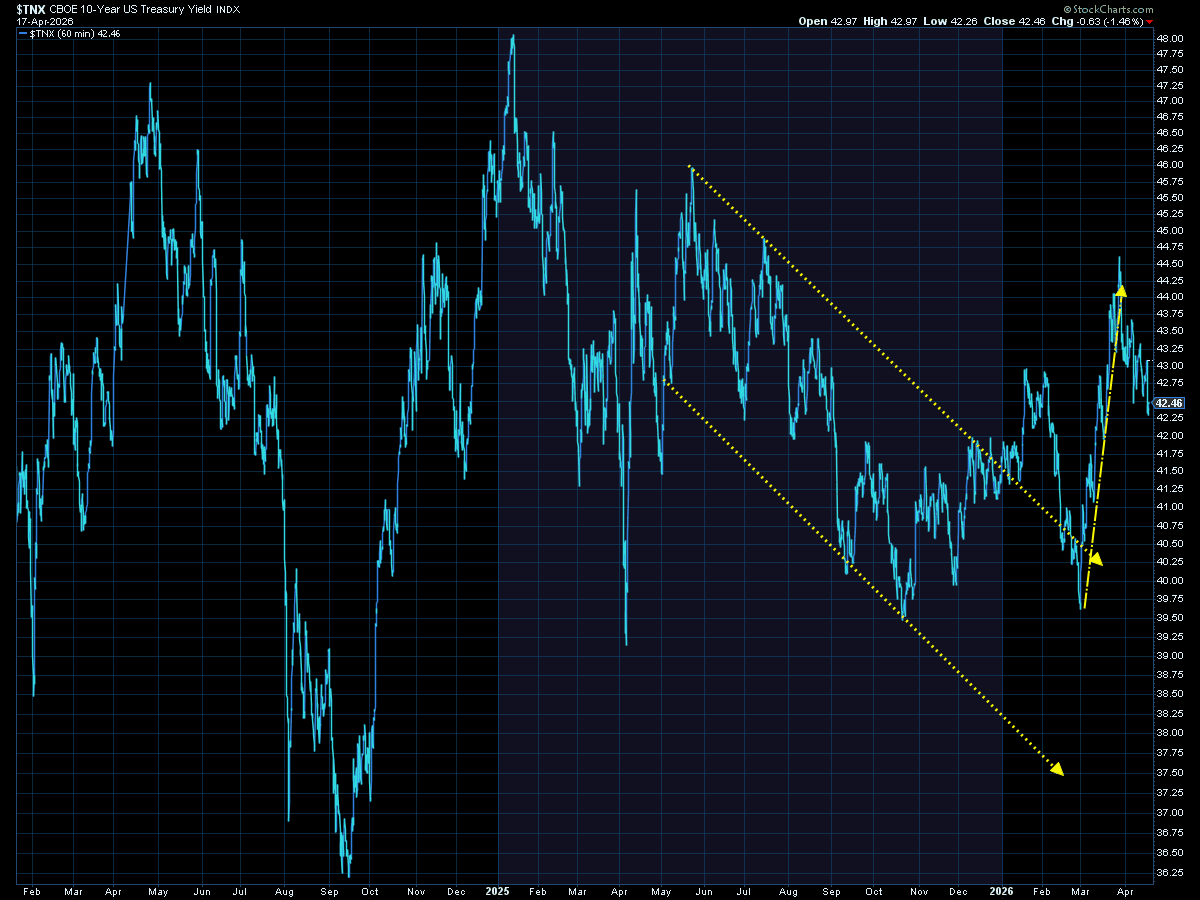
Turning to interest rates, it was again a volatile week, but rates did decline, especially shorter-term rates. I'm not sure what the market sees, but they are once again starting to price in rate cuts over the summer and into the fall.
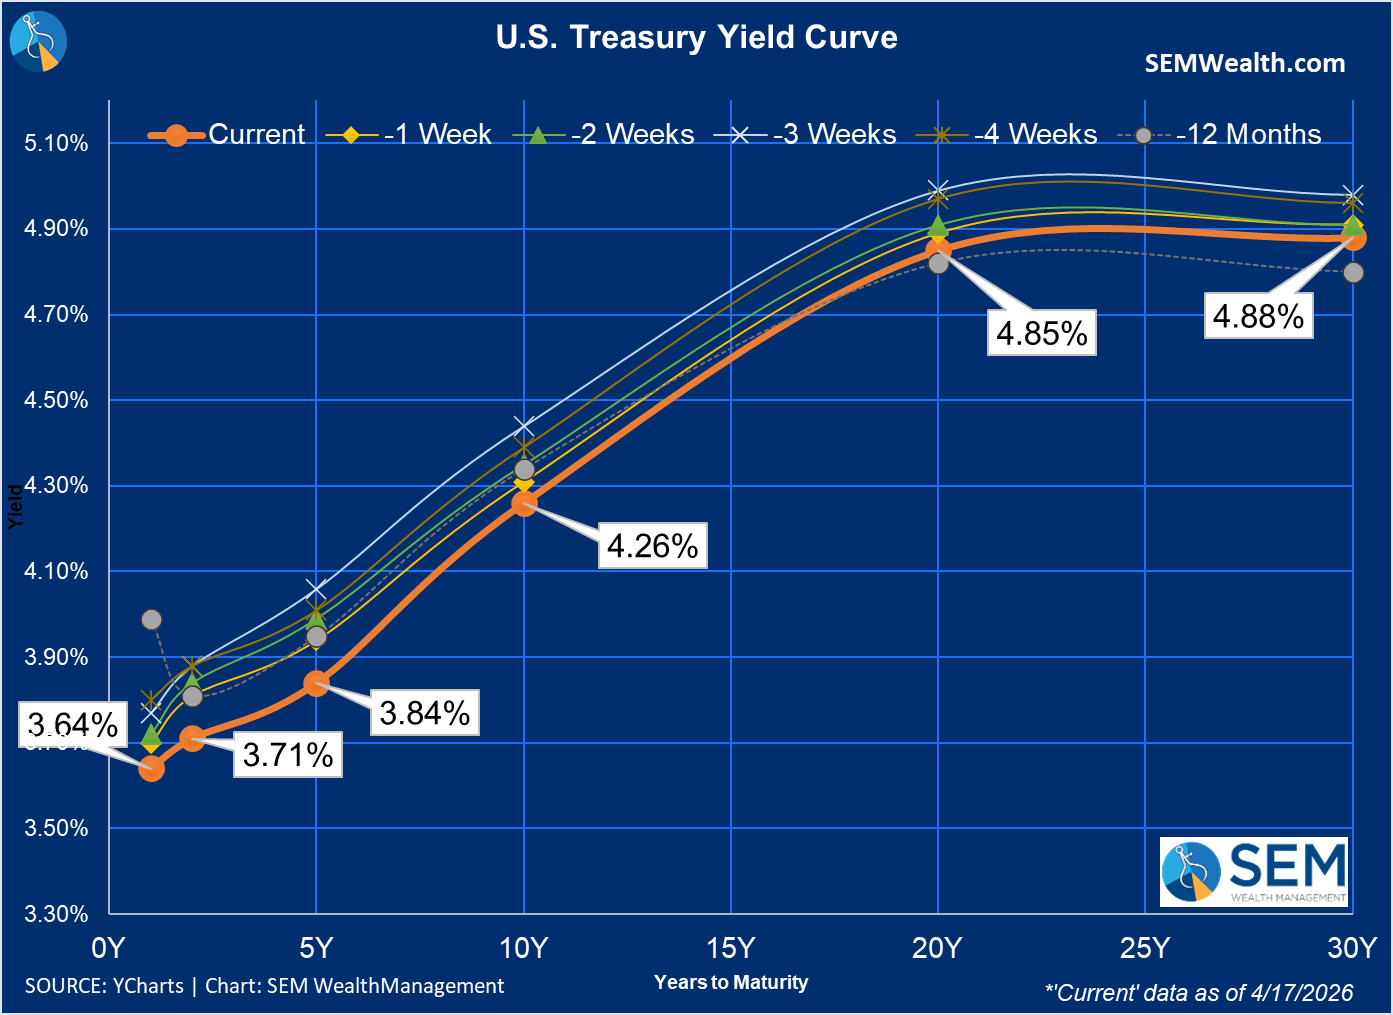
Rates still remain elevated on the 10-year, and like oil may be settling at a higher "equilibrium" due to what could be on-going risks in the middle east.
SEM Market Positioning
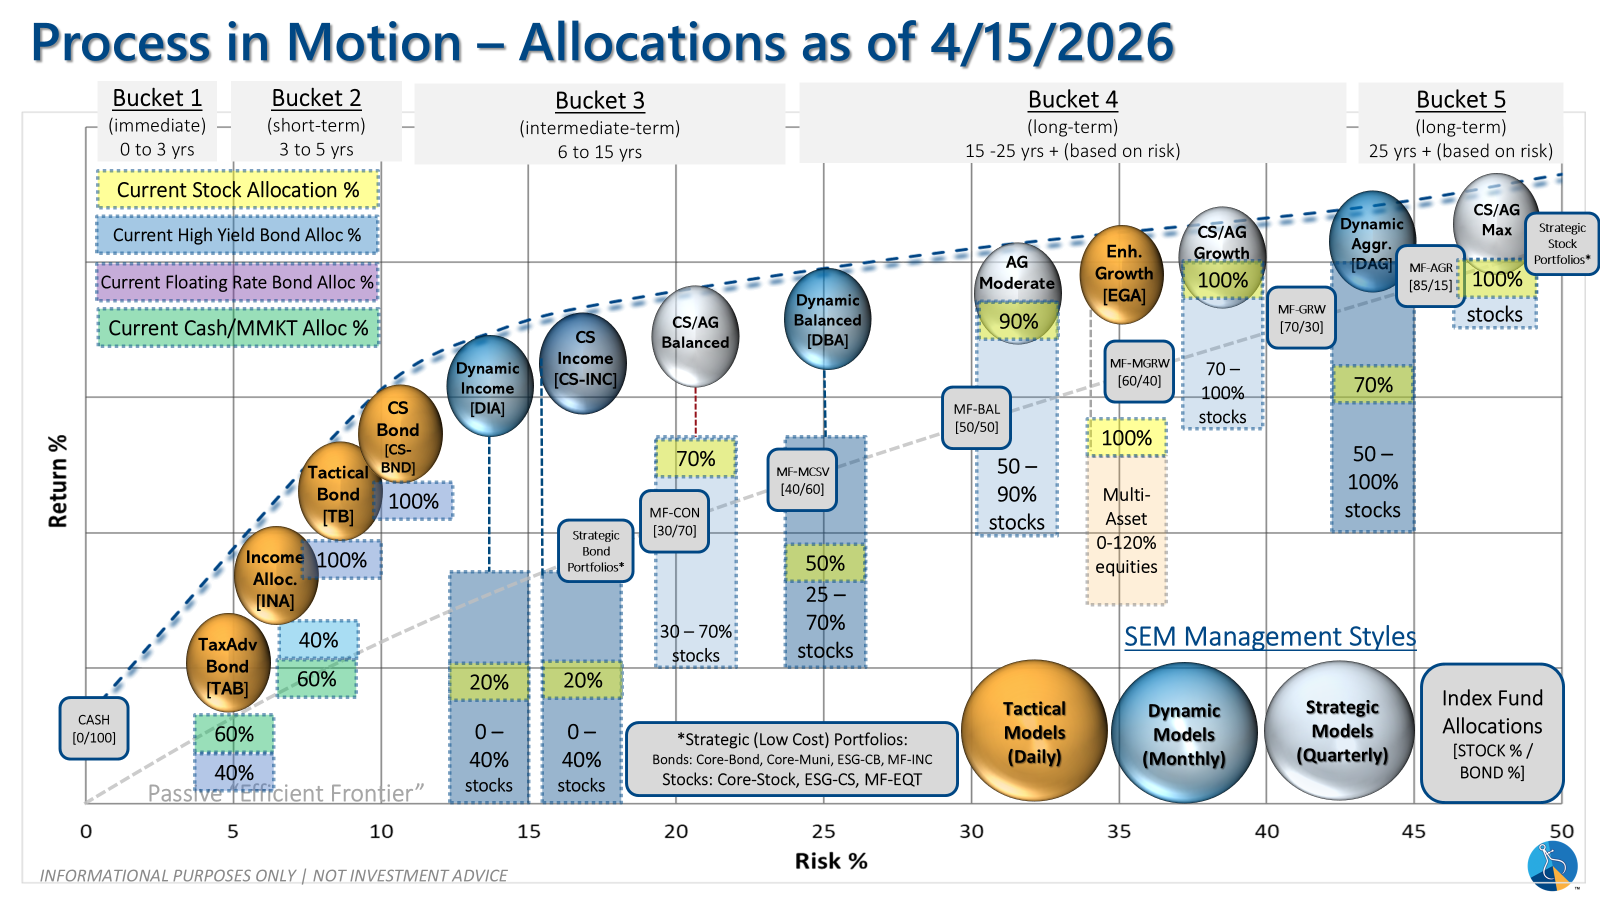
SEM deploys 3 distinct approaches – Tactical, Dynamic, and Strategic. These systems have been described as 'daily, monthly, quarterly' given how often they may make adjustments. Here is where they each stand.
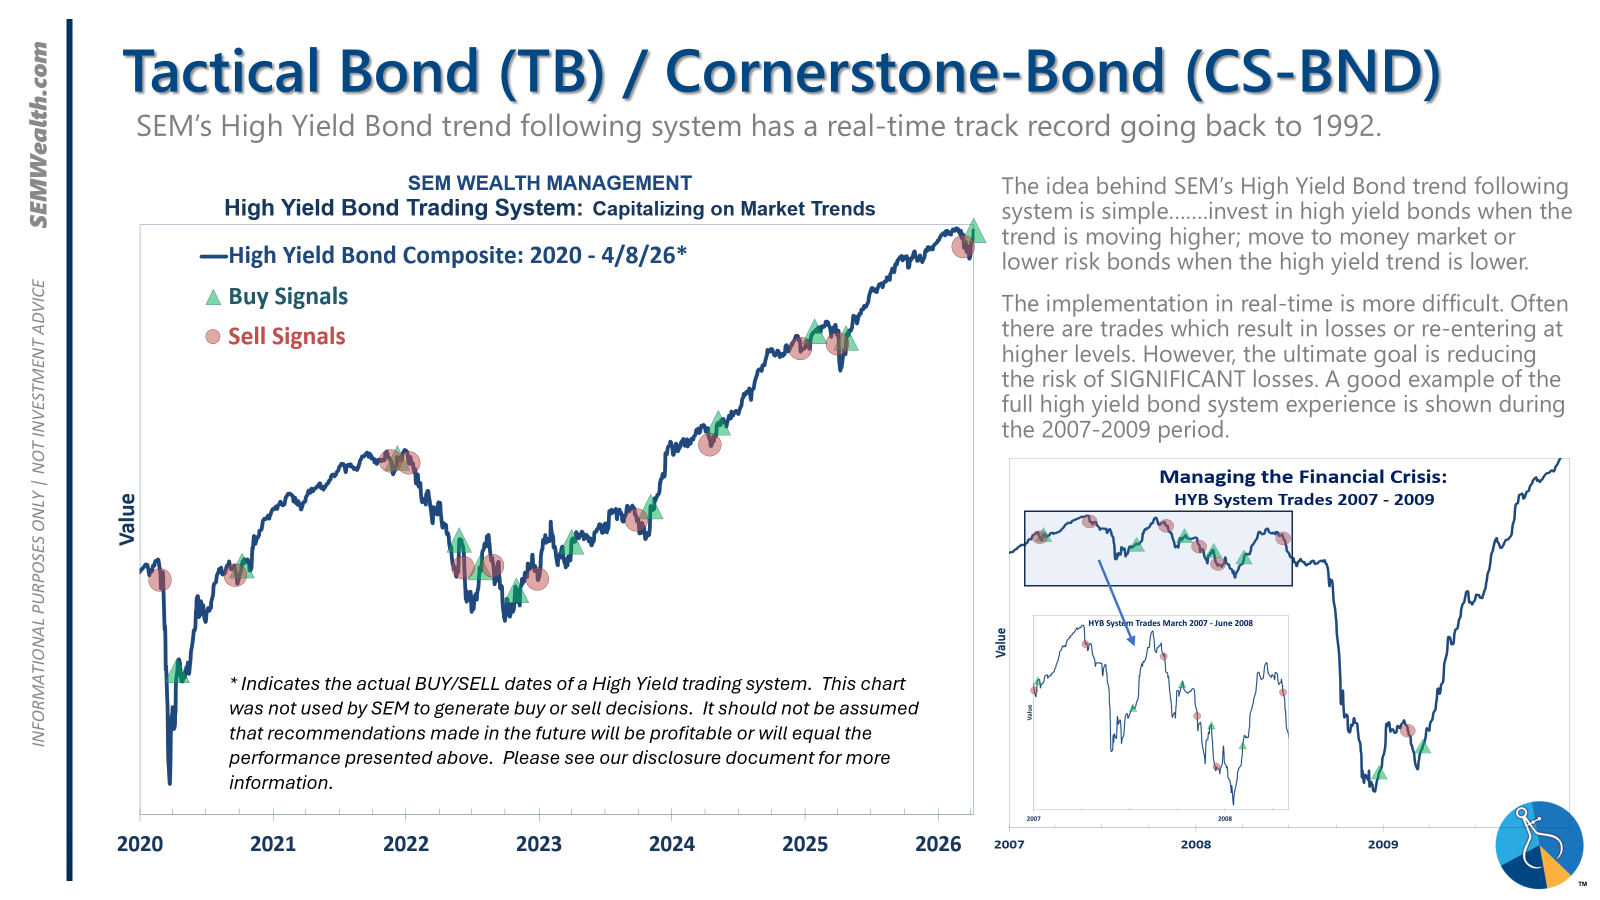
- Tactical = BULLISH | 100% High Yield Bond (4/8/2026) | High-yield spreads remain narrow but trend is slightly higher
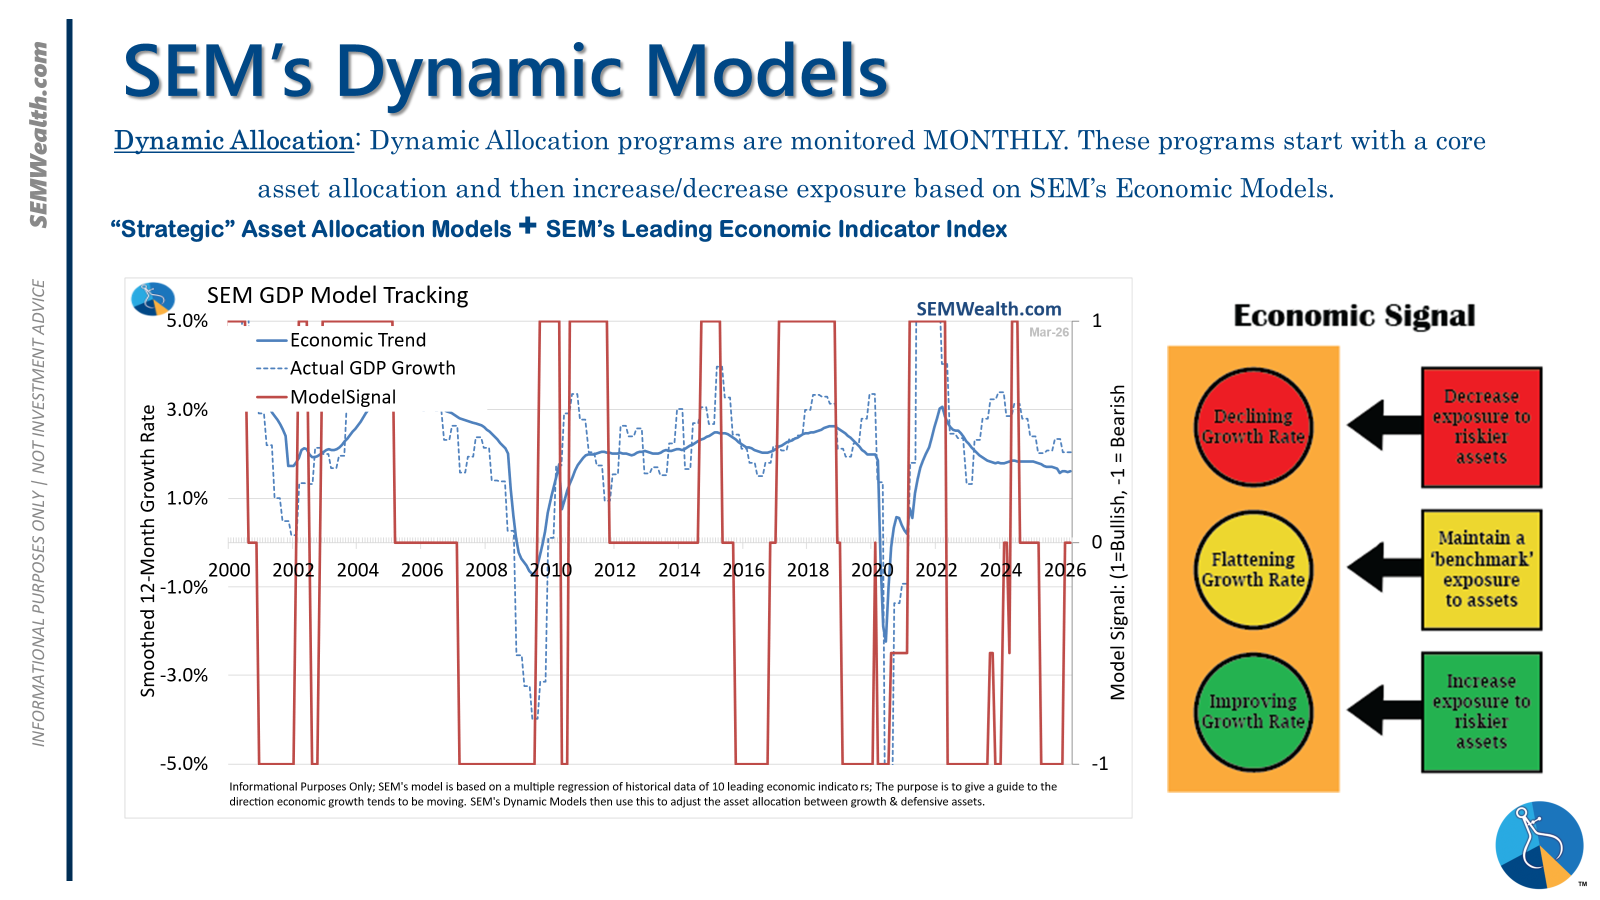
- Dynamic = NEUTRAL (2/15/2026) | "Benchmark" Allocation | Economic model inconclusive
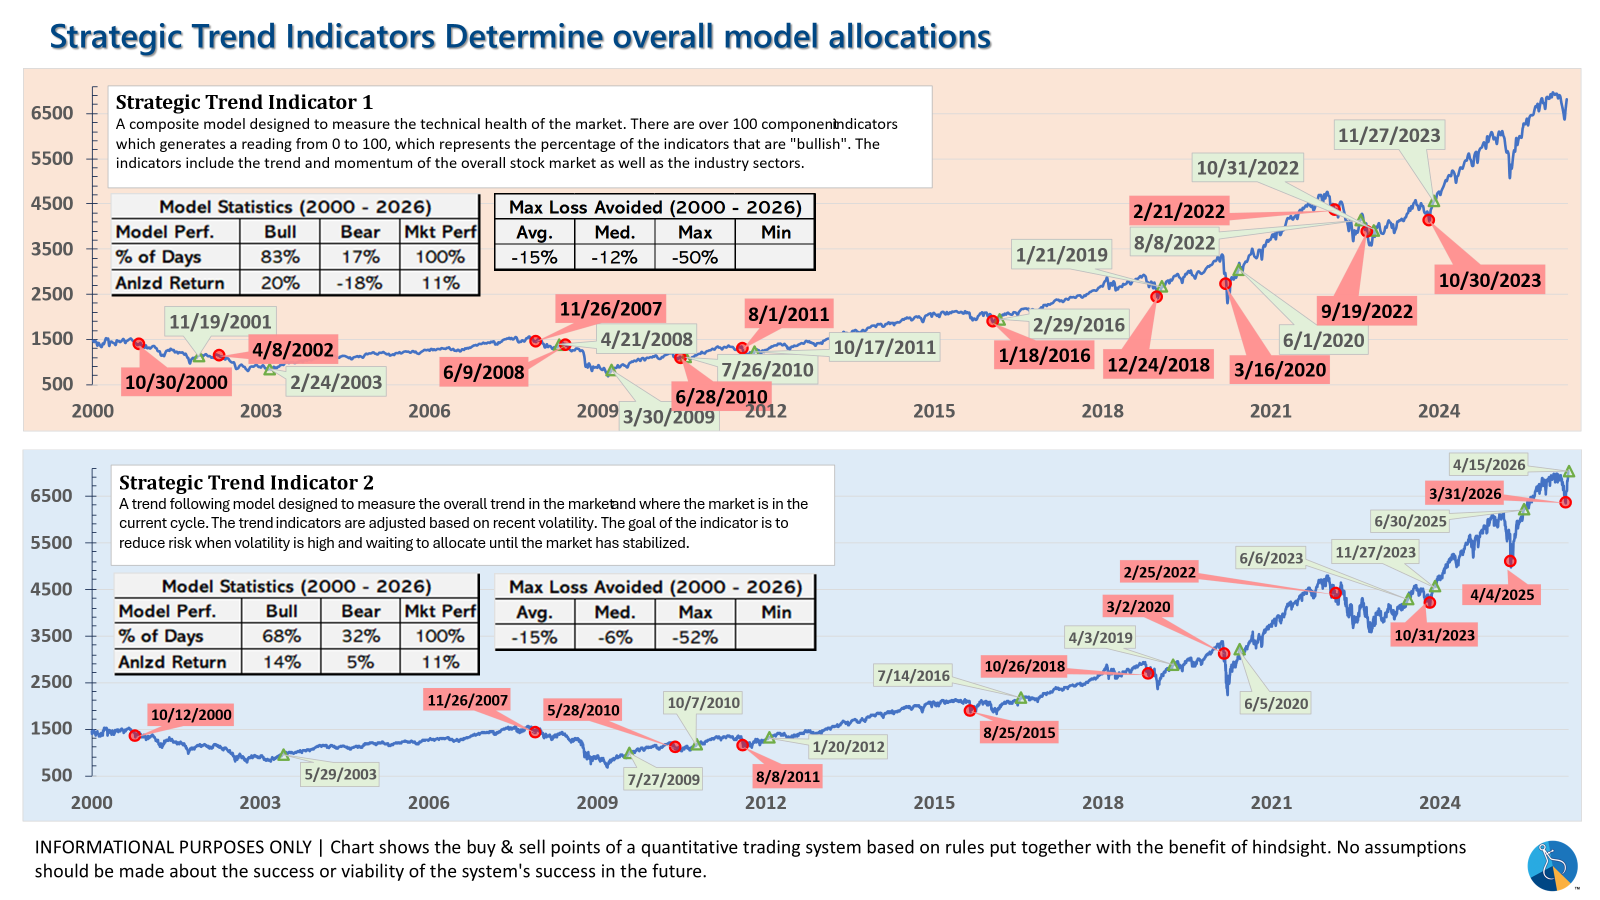
- Strategic = BULLISH (4/15/2026) | V-Bottom projecting "end" of Iran War
Tactical (daily):
- Monitored DAILY
- Models: Tactical Bond, Cornerstone Bond, Income Allocator, Tax Advantaged Bond
- Designed to follow the trends for use in our lower risk models
- BUY Signal issued April 8, 2026 (exiting the sell from March 13)
Dynamic (monthly):
- Monitored MONTHLY
- Models: All "Dynamic" Models (Income, Balanced, Growth, and Asset Allocator)
- Uses SEM's Quantitative Economic Model
- Designed to overweight riskier assets if economic trend is higher & underweight those assets if economic trend is lower.
- NEUTRAL signal issued February 15, 2026 (following BEARISH signal from July 2025)
Strategic (quarterly)*:
- Monitored QUARTERLY
- Models: AmeriGuard (Balanced, Moderate, & Growth) and Cornerstone (Balanced & Growth)
- Core Component: Quantitative Filter using 4 different time horizons across universe of asset classes
- Trend Indicator: Two different Quantitative Systems monitoring the intermediate-term trend, health of the market, and volatility
- CORE has been overweight small cap and international since October 2025 – overweight increased slightly in January
- Both TREND INDICATORS are BULLISH following 10% drop and "V-Bottom" reversal in early April
- AmeriGuard & Cornerstone Max DO NOT use the Trend indicator and are always 100% invested in stocks using our CORE rotation model.
The core rotation is adjusted quarterly. This quarter we saw half of our international positions reduced (we sold developed markets and kept our emerging markets exposure). We also saw the remaining share of mid-cap reduced in favor of more small cap exposure. We remain with a "barbell" core portfolio – about half in large cap and half in small cap as the models expect the market to "broaden".
The * in quarterly is for the trend models. These models are watched daily but they trade infrequently based on readings of where each believe we are in the cycle. The trend systems can be susceptible to "whipsaws" as we saw with the recent sell and buy signals at the end of October and November. The goal of the systems is to miss major downturns in the market. Risks are high when the market has been stampeding higher as it has for most of 2023. This means sometimes selling too soon. As we saw with the recent trade, the systems can quickly reverse if they are wrong.
Overall, this is how our various models stack up based on the last allocation change:
Curious if your current investment allocation aligns with your overall objectives and risk tolerance?


