After a month of worry about the length and objectives of the US and Israel's War with Iran, the idea of a truce/cease fire, even if only for 2 weeks was a welcome relief for the stock market, especially after threats to "end" the Iranian civilization came and went last Tuesday. It was then off to the races for stocks and other risky assets. It seems all is again right with the world (for now.)
What could go wrong? Here is my list:
- Resumption of apocalyptic threats against Iran/the Straight of Hormuz not opening/cease fire crumbling
- Focus on fundamentals which weakened and were ignored over the 5-weeks of the Iran war
- AI Spending questions (we are approaching negative free cash flow for the ‘hyperscalers’)
- Structural inflation pushing us back above 3%
- Recession Risks
- Private Credit
Investing is never easy, but when you have outside or uncommon events (or people) creating uncertainty it is even more difficult. This isn't the primary reason we follow a quantitative approach with our investments, but it is certainly helpful.
With the war (at least temporarily) behind us even with the "failed" peace talks and the blockade of the Straight of Hormuz by the US, it's a good chance for investors to look at what's been happening while everyone was focused on the Middle East, including the health of our economy.
Economic Data Update
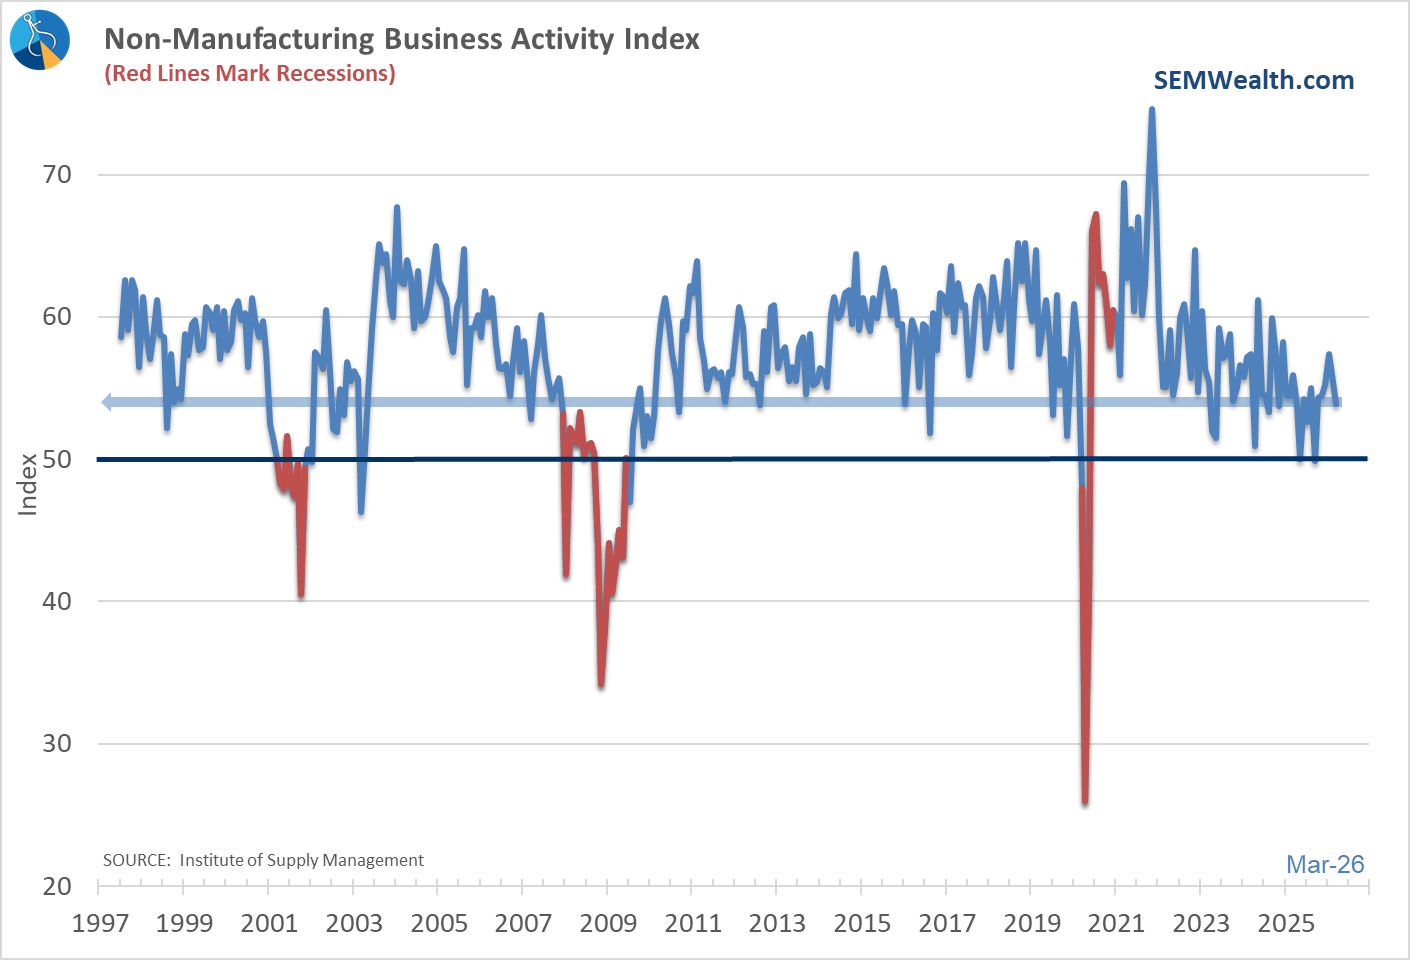
One of the primary risks which was ignored throughout March was recession risks and inflation pushing back towards 3%. While the market didn't pay much attention, it was a busy week on the economic front with several key data points coming in. First off was Service Business Activity, which declined in March. It is still above the "expansion" level. As you can see it is a volatile number, but the trend is generally down since the middle of 2023.
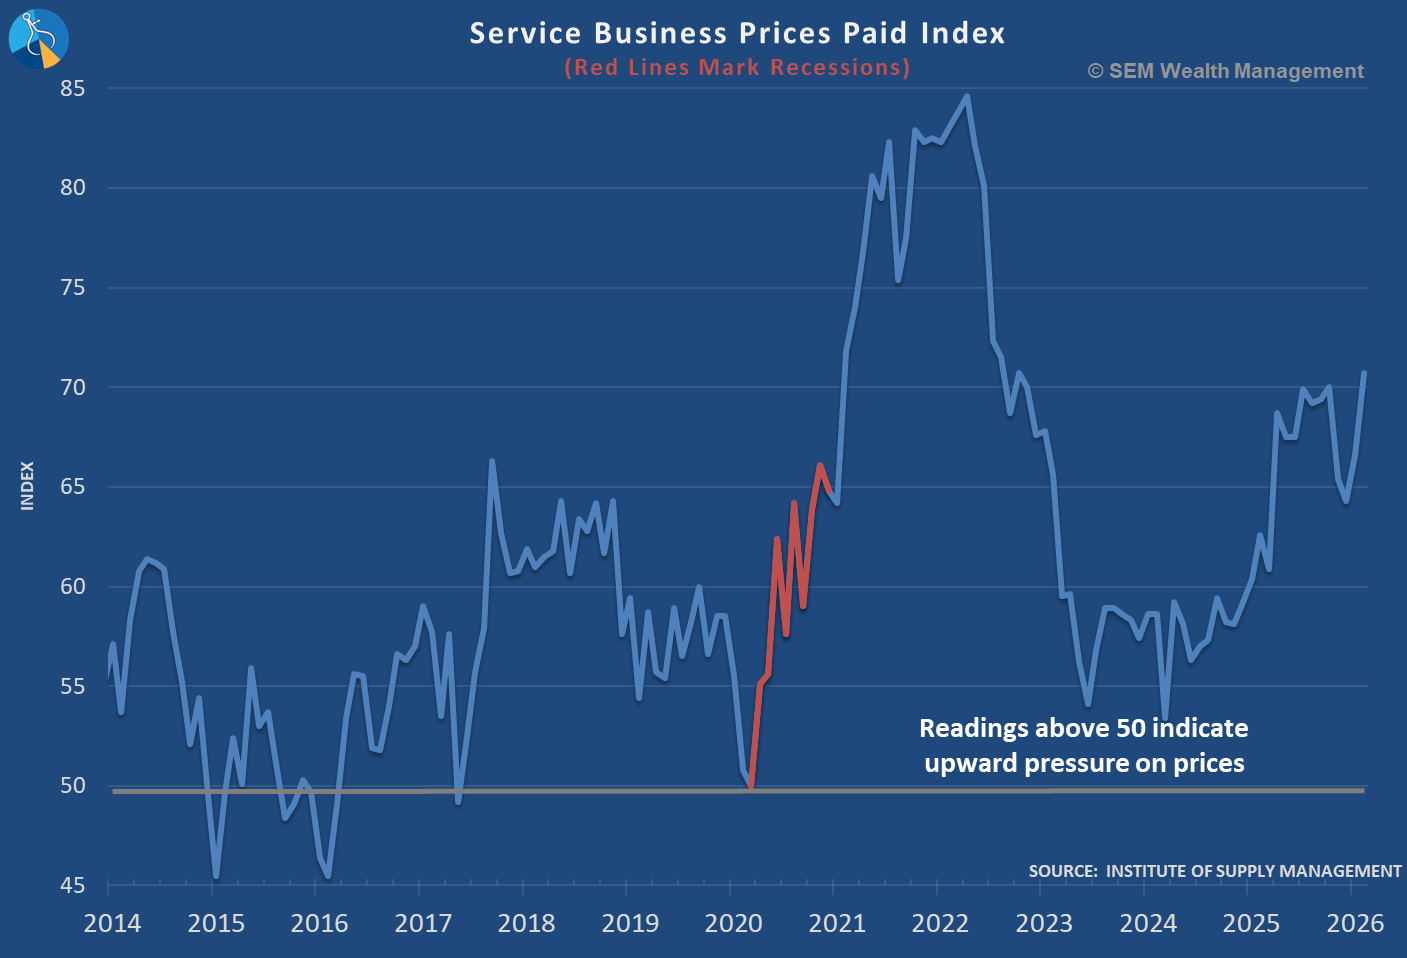
The bigger issue was the Prices Paid index, which showed a jump to the highest levels since 2022.
This matches the jump in prices we saw on the Manufacturing side.
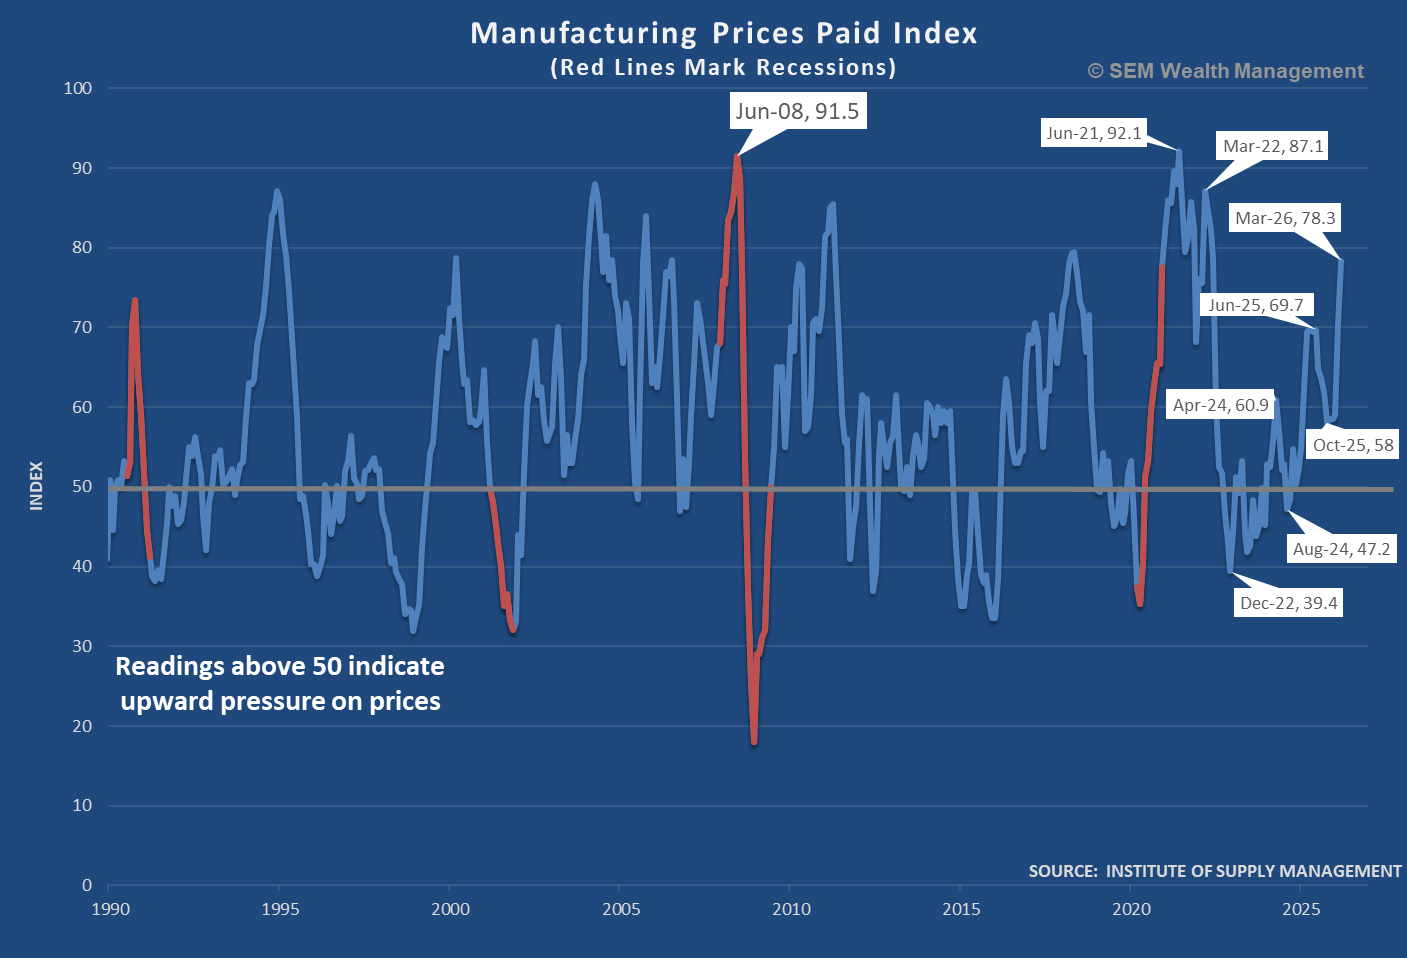
Even with oil prices coming down a bit, the inflationary pressures could remain in the system for the next 3-6 months (even if they continue to come down).
Consumer Spending (for February) was up an impressive 5% over the past year. After "slowing" to the 3-4% range late last year, this is the 2nd month in a row to show +5% growth. It is clear consumers are still spending money at a feverish pace.
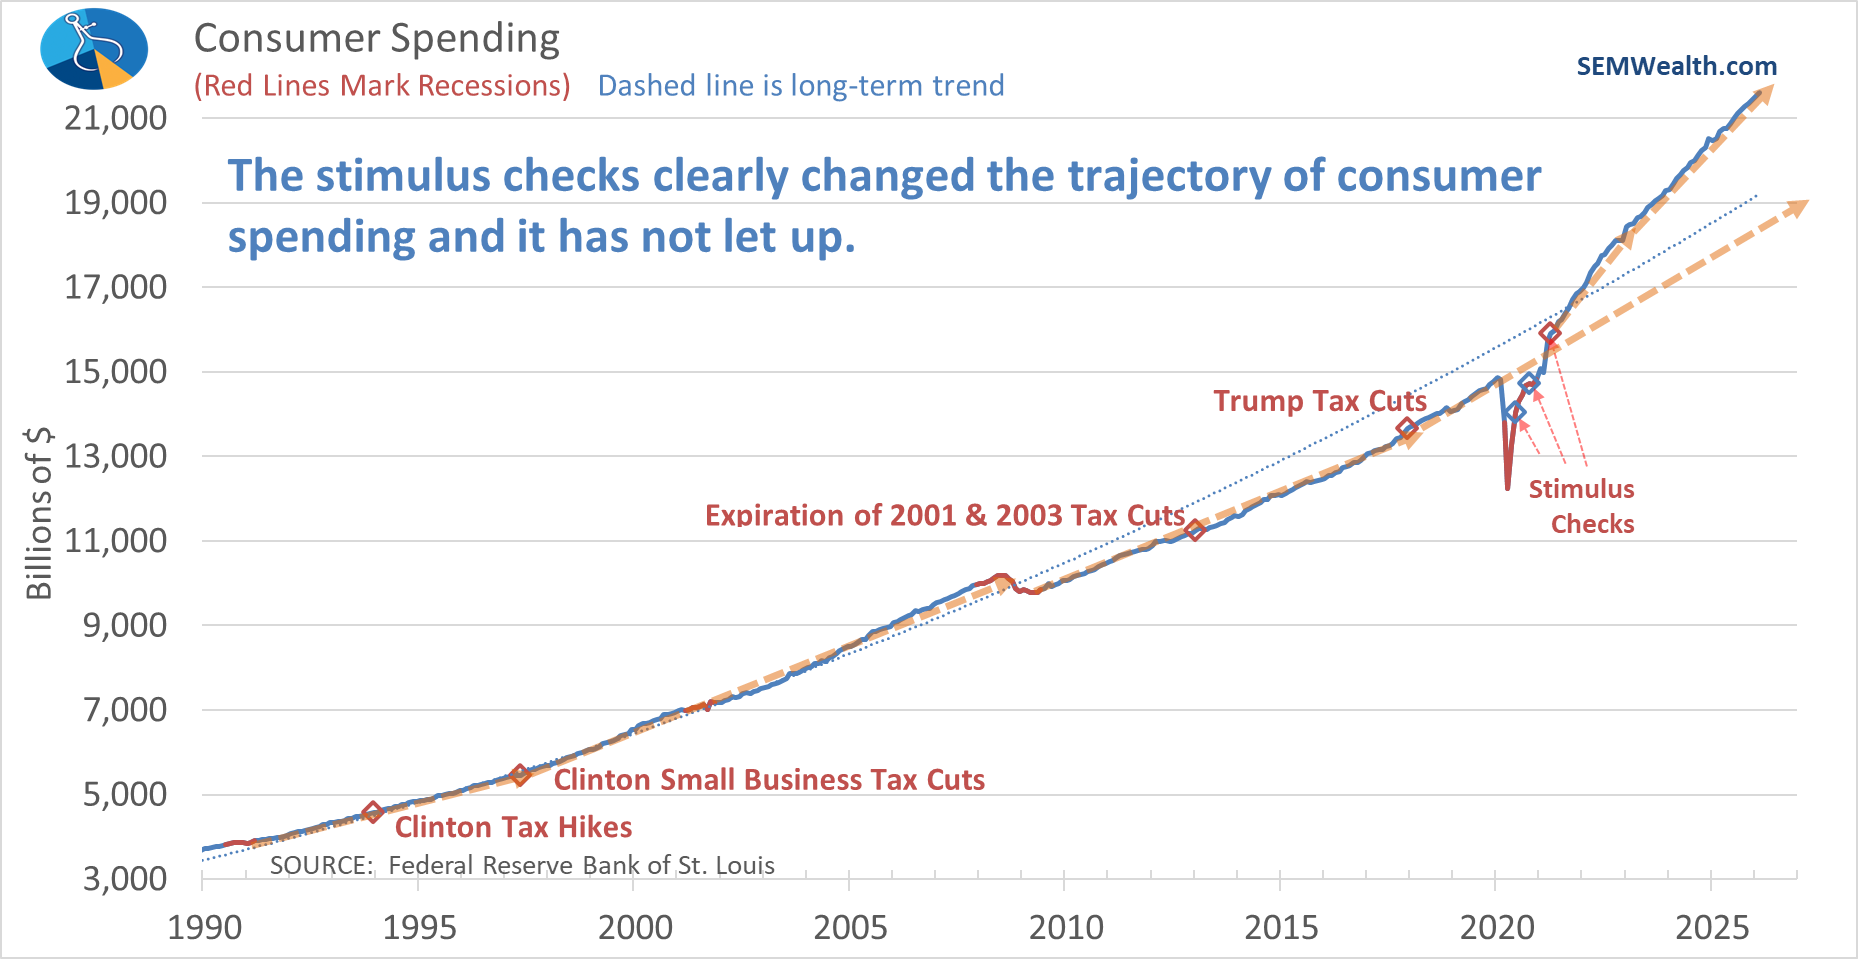
Keep in mind, however, this is the TOTAL dollars spent, which means those with the means to spend can offset a slowdown in the middle class. The "average" consumer is downbeat (more on that below).
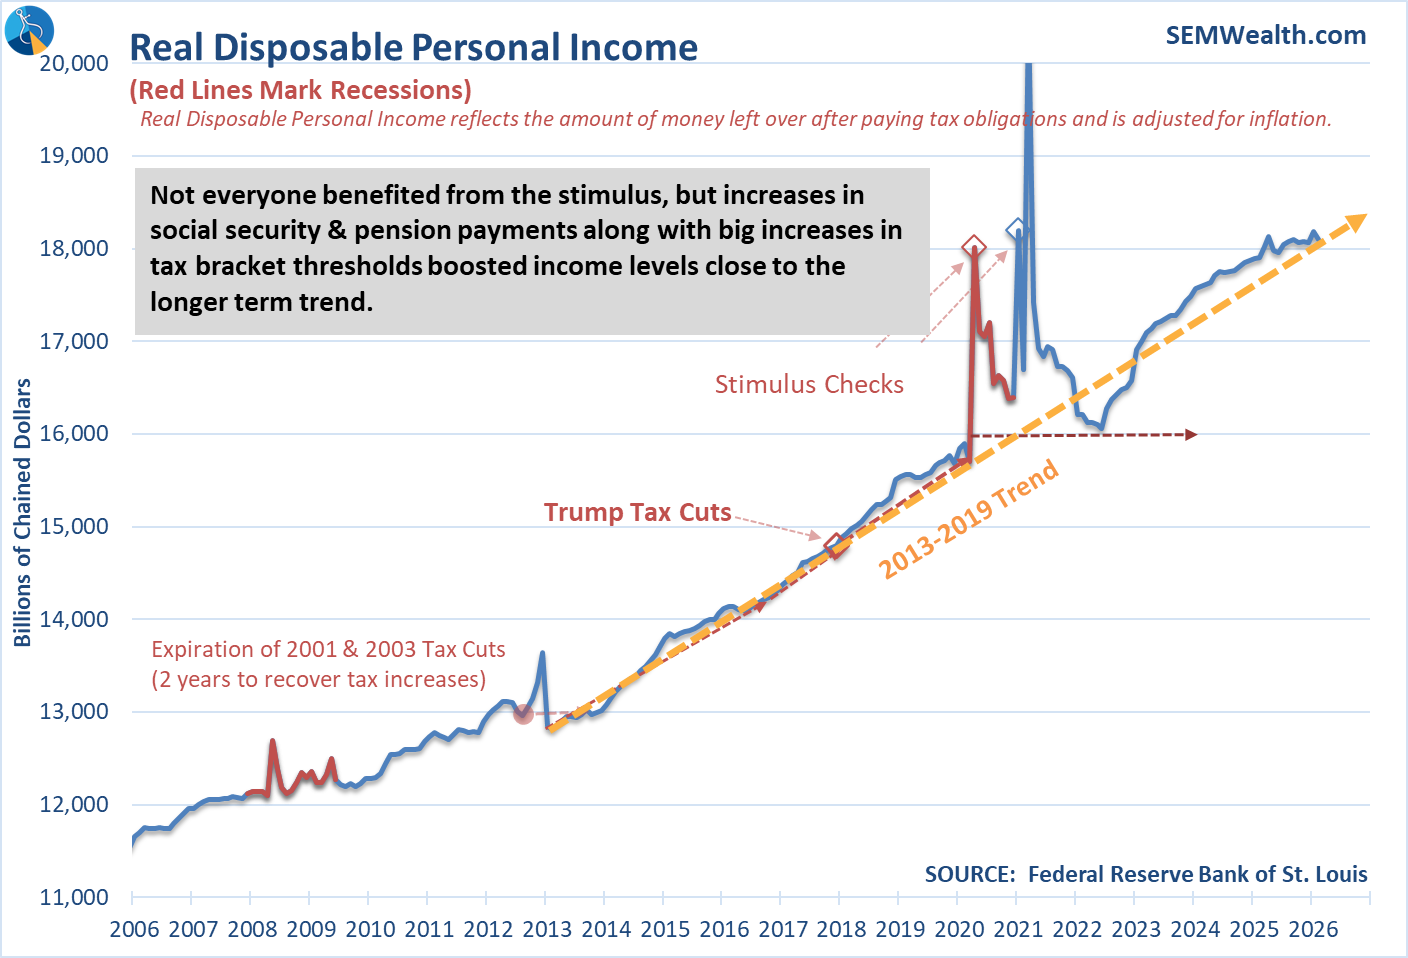
We also saw Personal Income growth of only 1% for the past 12 months (ending in January). Combining that with the Consumer Spending growth we can infer more people are using debt to finance their spending. Personal Income has been flatlining since last April.
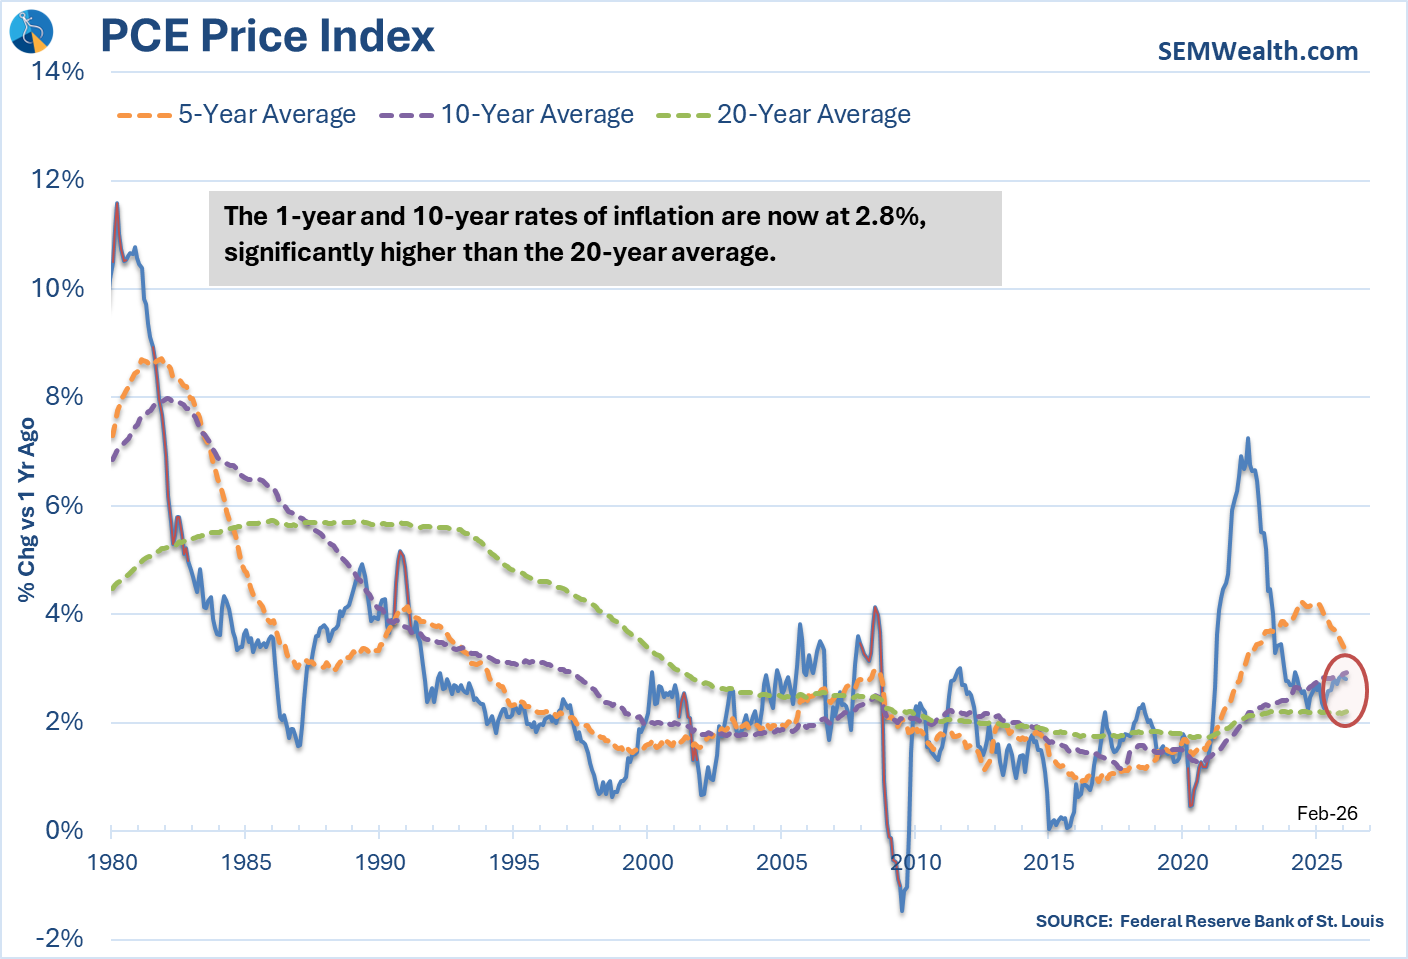
On the inflation front, the Fed's preferred measure of inflation (the PCE Price Index) again climbed at a rate above the Fed's 2-3% target level (in February).
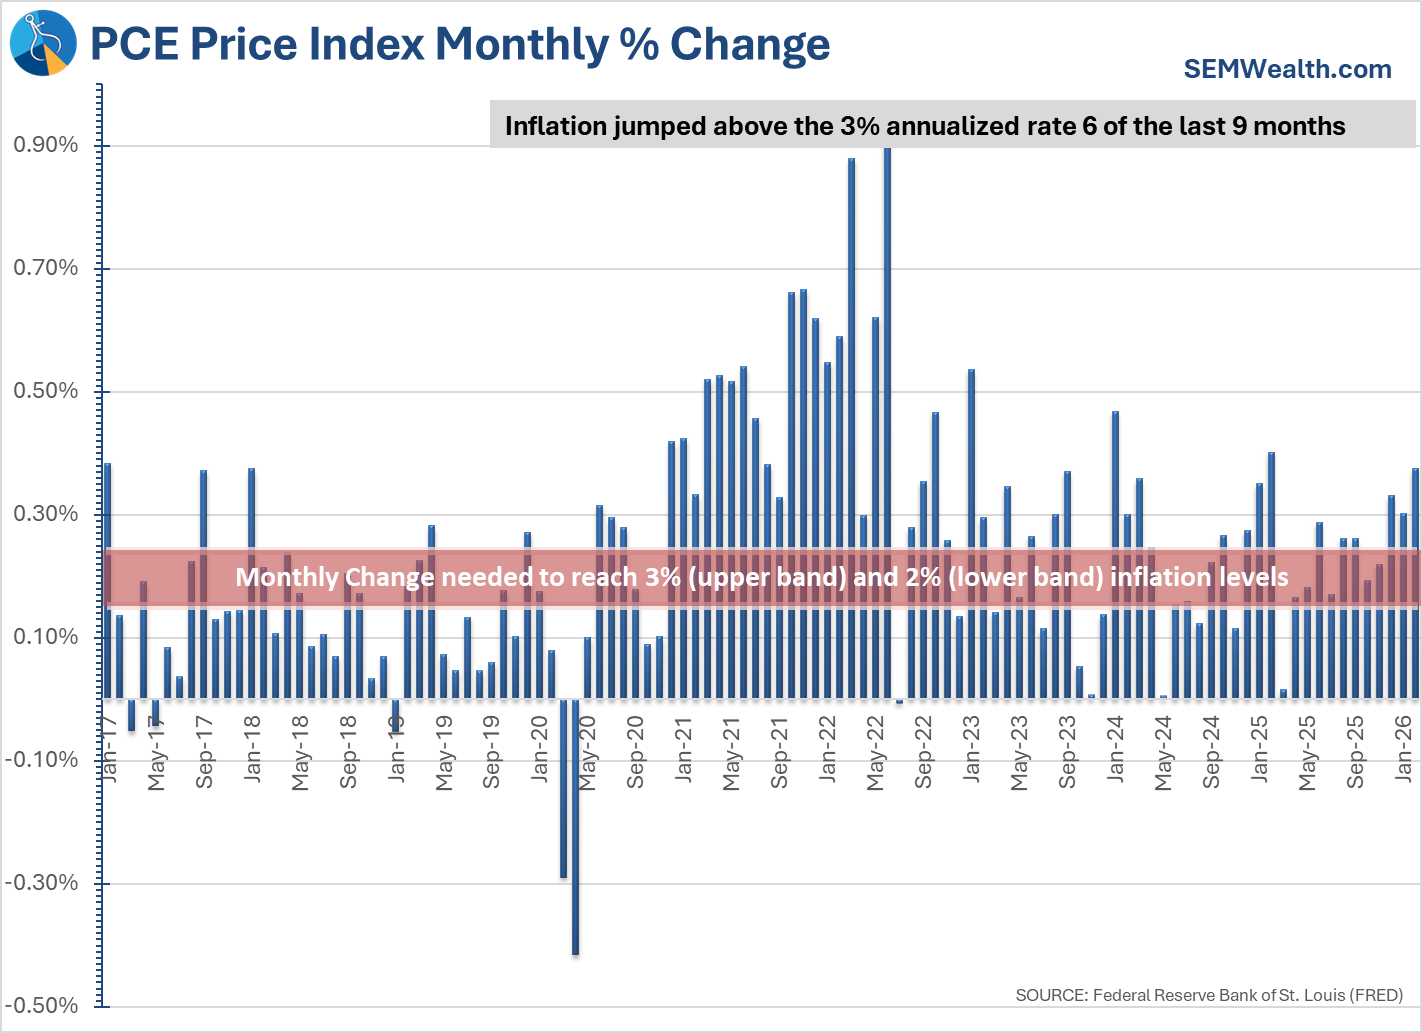
The 10-year average rate of inflation now sits at 2.9%, which is the same level we experienced the last 12 months. The biggest question for financial planners (and the Fed) is whether or not we will ever get back to the 20-year average of 2%.
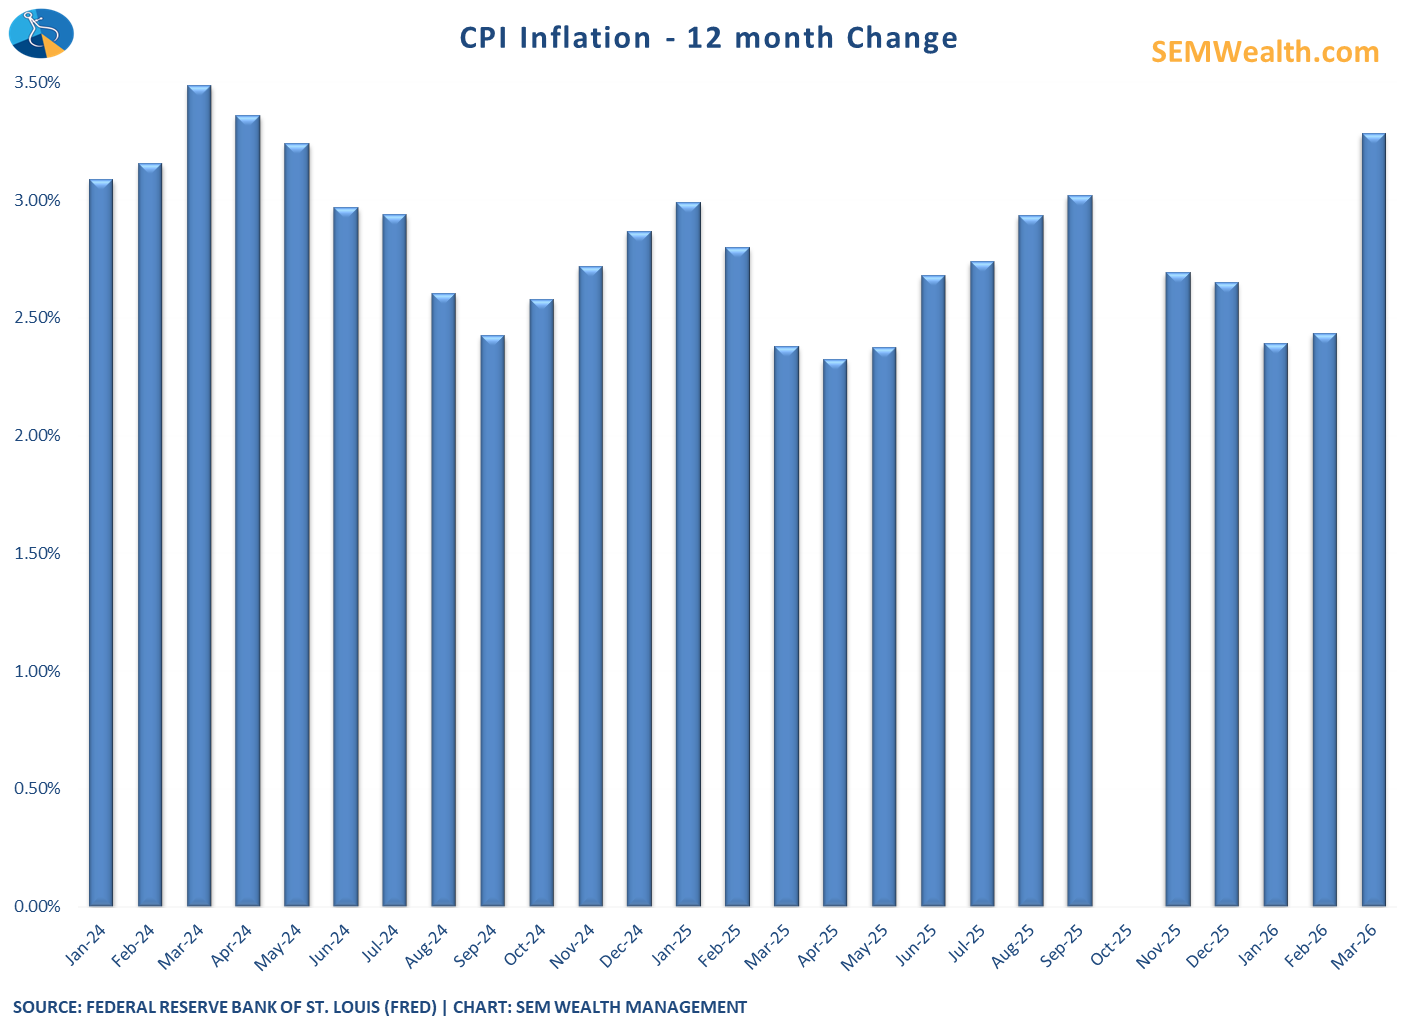
The CPI report on Friday (for March) showed a huge jump in consumer prices, rising at a 3.3% rate versus a year ago.
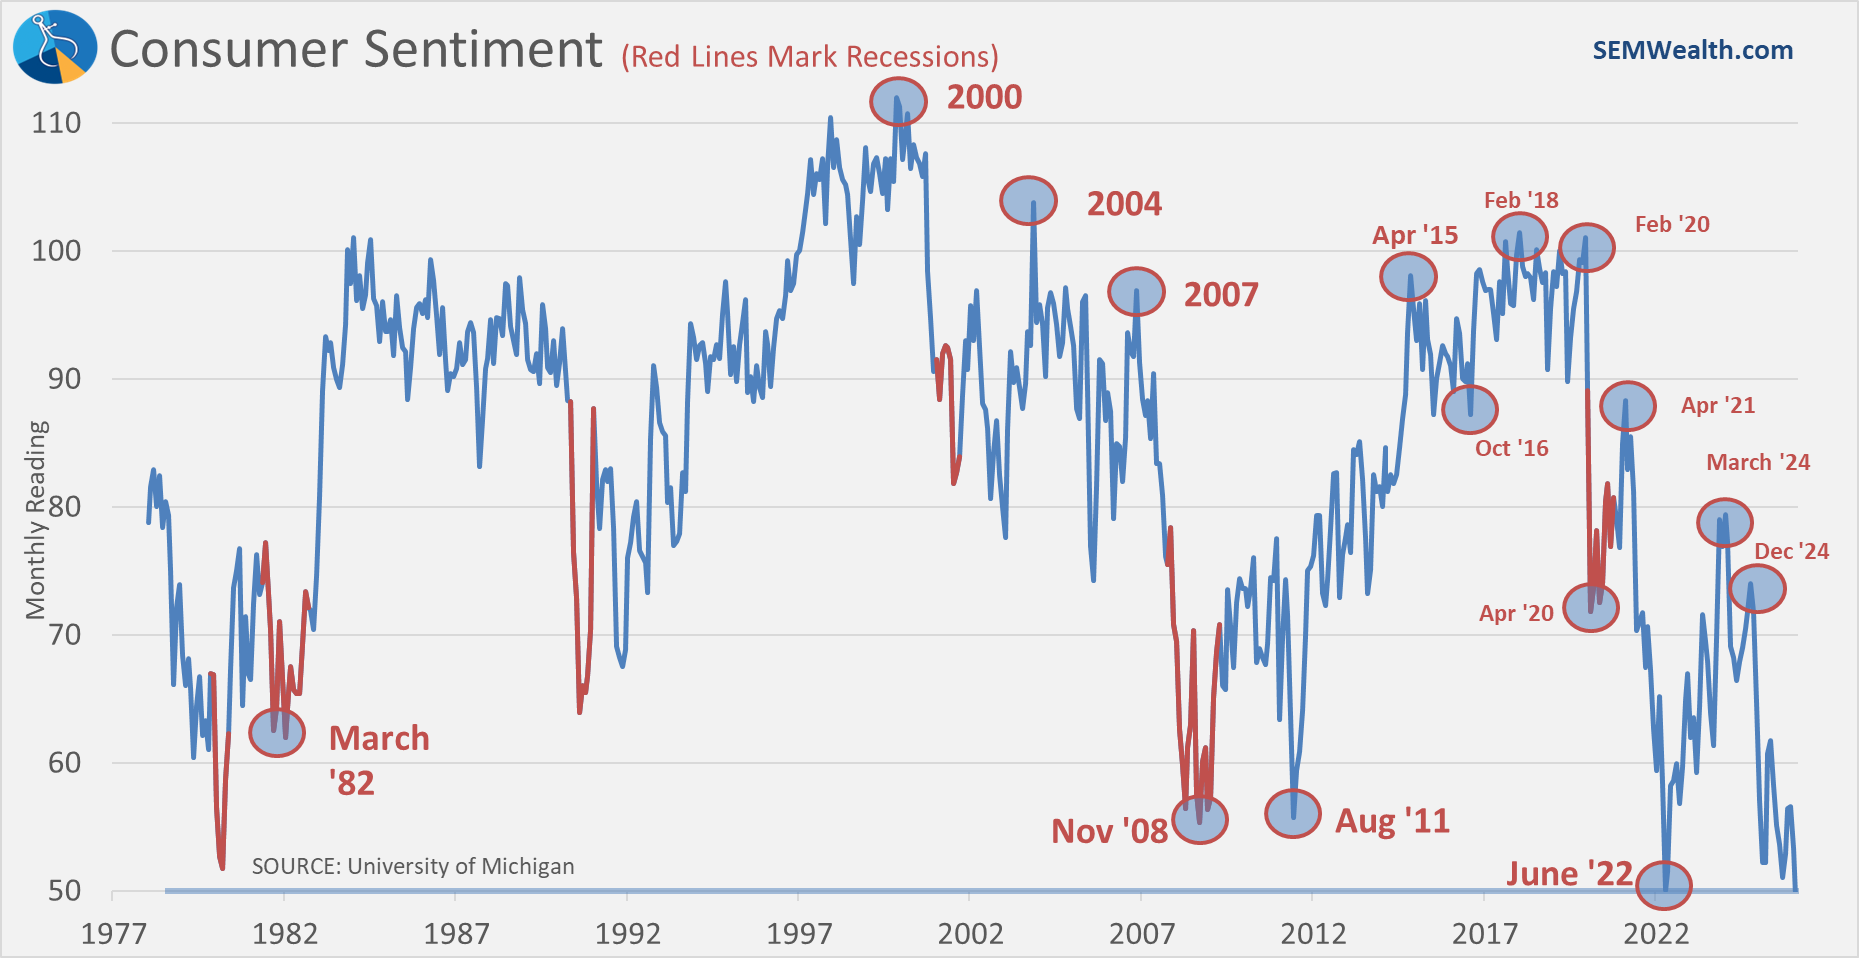
This clearly is weighing on Consumers. The first reading of April Consumer Sentiment saw the index dropping to its lowest level on record. This is likely going to be revised higher if the conflict with Iran continues to cool throughout the month, but it is eye-opening to see consumers so pessimistic on the future.
Our updated dashboard shows a slightly negative leaning economy. Only stock prices are showing strong economic growth.
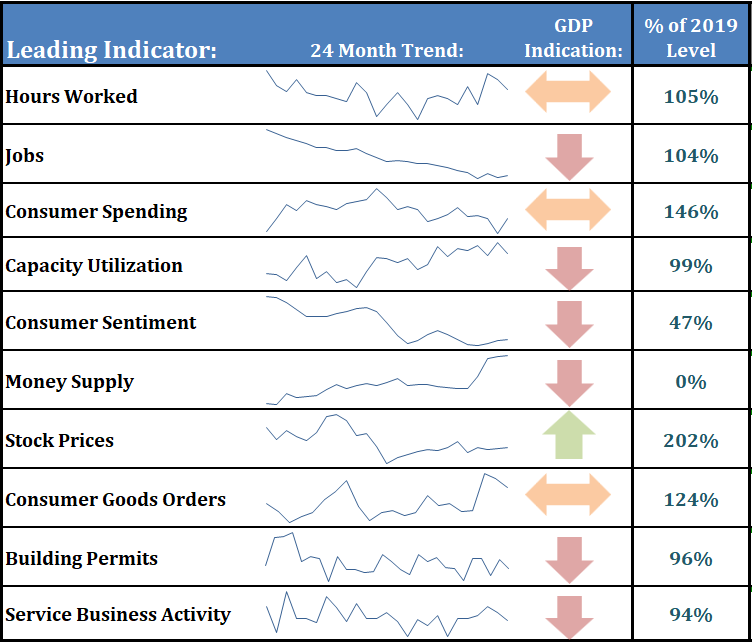
As we saw over the last 18 months, data center spending (investment?) accounted for most of the economic growth. That is not normal and if it doesn't filter down to the rest of the economy, is unsustainable.
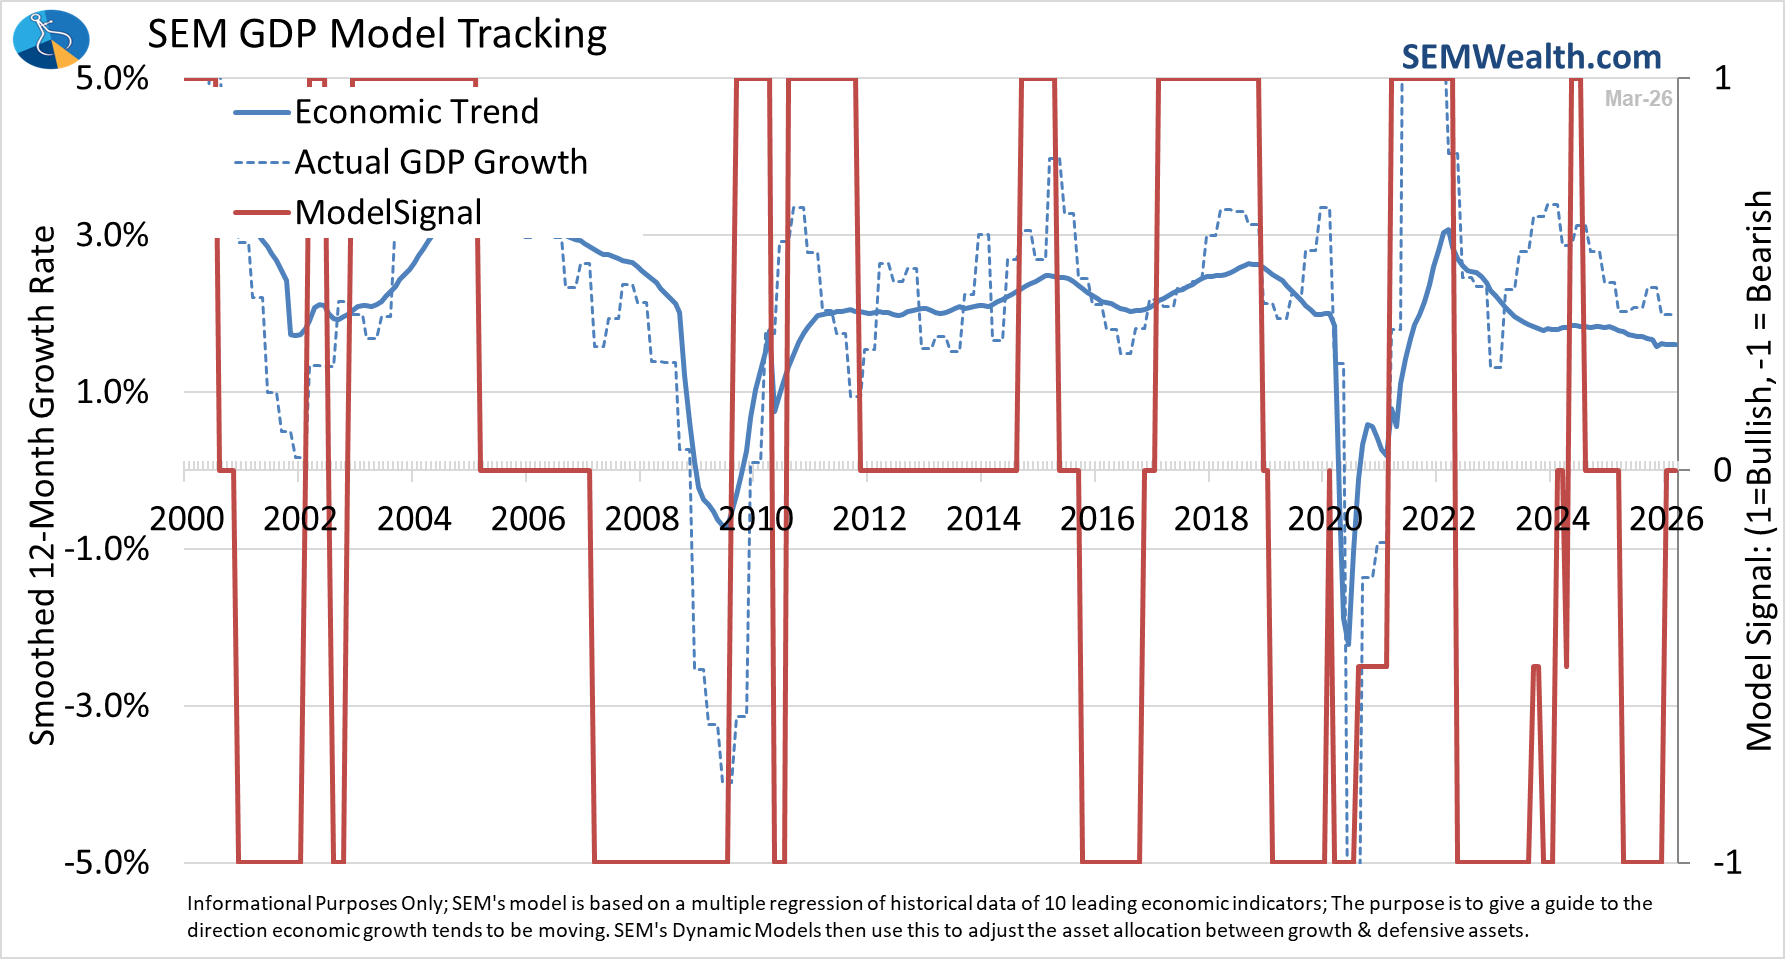
This week's data is a bit lighter, but it will include two reports which are important for our economic model – Capacity Utilization (Thursday) and Building Permits (Friday).
Toby's Take
A look at our intern's top WSJ stories from the week
4/6/2026 - A Downed Airman, a Mountain Hideout and a High-Risk Rescue in Iran - WSJ
Over the weekend breaking news with the Iran war happened. Two airmen flying an F-15E were shot at causing them to eject 200 miles in enemy territory. The pilot of the aircraft was rescued almost immediately, but the second airmen couldn't be found. Through the use of 100 special forces, multiple high-grade aircraft, and the CIA, the second airman was found. In the process, the United States military also destroyed any damaged/grounded aircraft in order to prevent Iran from learning anything. This whole situation heated up the war a lot giving Iran a sense of pride knowing that they shot down an American plane. Regardless of how they feel, this was a victory for America because we got both men home.
4/7/2026 - Hopes Fade for Deal With Iran Ahead of Tuesday-Night Deadline - WSJ
The Iranian war is inching closer to escalating even more. President Trump gave Iran a deadline of tonight to reopen the Strait of Hormuz. He said that if they don't then the U.S would be "blowing everything up." The plan is that if the deal isn't met, then the U.S. would target their bridges and power plants taking this war to a much larger scale. We can't say for sure if President Trump will hold true to that because he has been known to extend deadlines, but he has also been known to execute on these threats. We will have to wait and see.
4/8/2026 - The Day Trump’s Iran Threat Gripped the World - WSJ
President Trump's threat to destroy Iran if they didn't come to an agreement by 8pm last night thankfully wasn't held true. President Trump agreed to a two week cease fire deal to extend the time for the two countries to make a deal. He said that this deal works with the reopening of the Strait of Hormuz. If Iran does actually allow the strait to open up again we may see a lot of different stocks to shoot up and oil go down finally.
4/9/2026 - What a Lasting Cease-Fire Would Do for the American Economy - WSJ
Since the war in Iran began the United States economy has been hit very hard. Starting with the price of oil/gas has gone up even higher than it was before the war. Even more impacts were made on mortgage rates going up causing consumer spending to go down affecting businesses even more than they were already being affected by the rise in energy and transportation costs. All in all, this was has really taken a toll on the economy and we can all feel it. However, this two week long cease-fire is a really good sign to the war coming to an end. Granted it will take a while before the economy will level out again, but the chance of it happening soon is stronger than it has been in weeks! If the United states, Israel, and Iran can keep this cease-fire we may reach peace again.
4/10/2026 - Artemis II’s Next Challenge: The Heat and High Stakes of a Fiery Re-Entry - WSJ
The Artemis II craft launched 9 days ago! The whole world watched as the United States sent a spacecraft to orbit the moon and see parts of it we haven't seen before. People are very excited about this and if it is successful it could bring attention to that side of the market involving space travel. We know of many companies that are trying to figure out new and innovative ways to tackle space travel and a success here could cause those stocks to rise. The craft is set to land this evening in the Pacific Ocean close to San Diego.
Market Charts
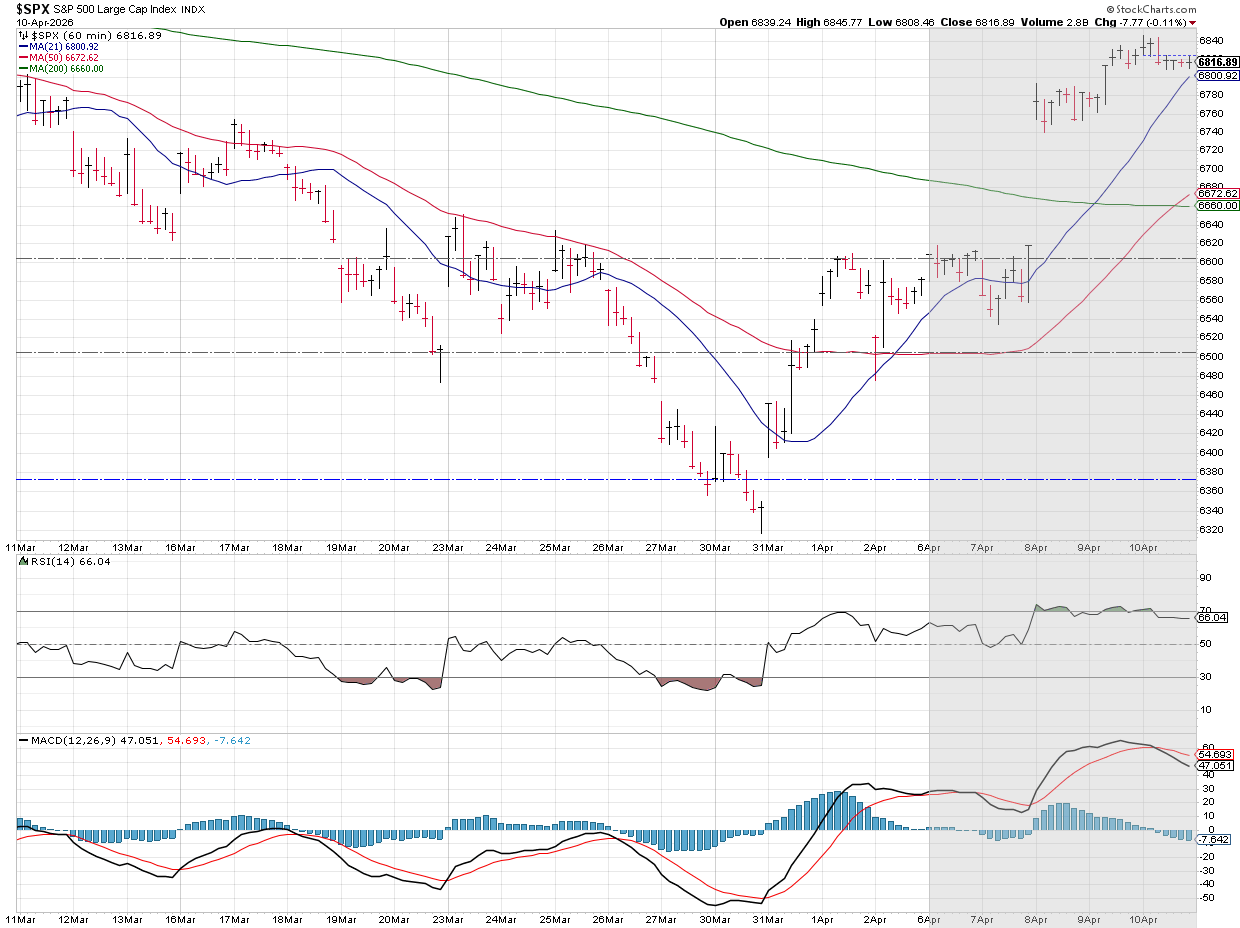
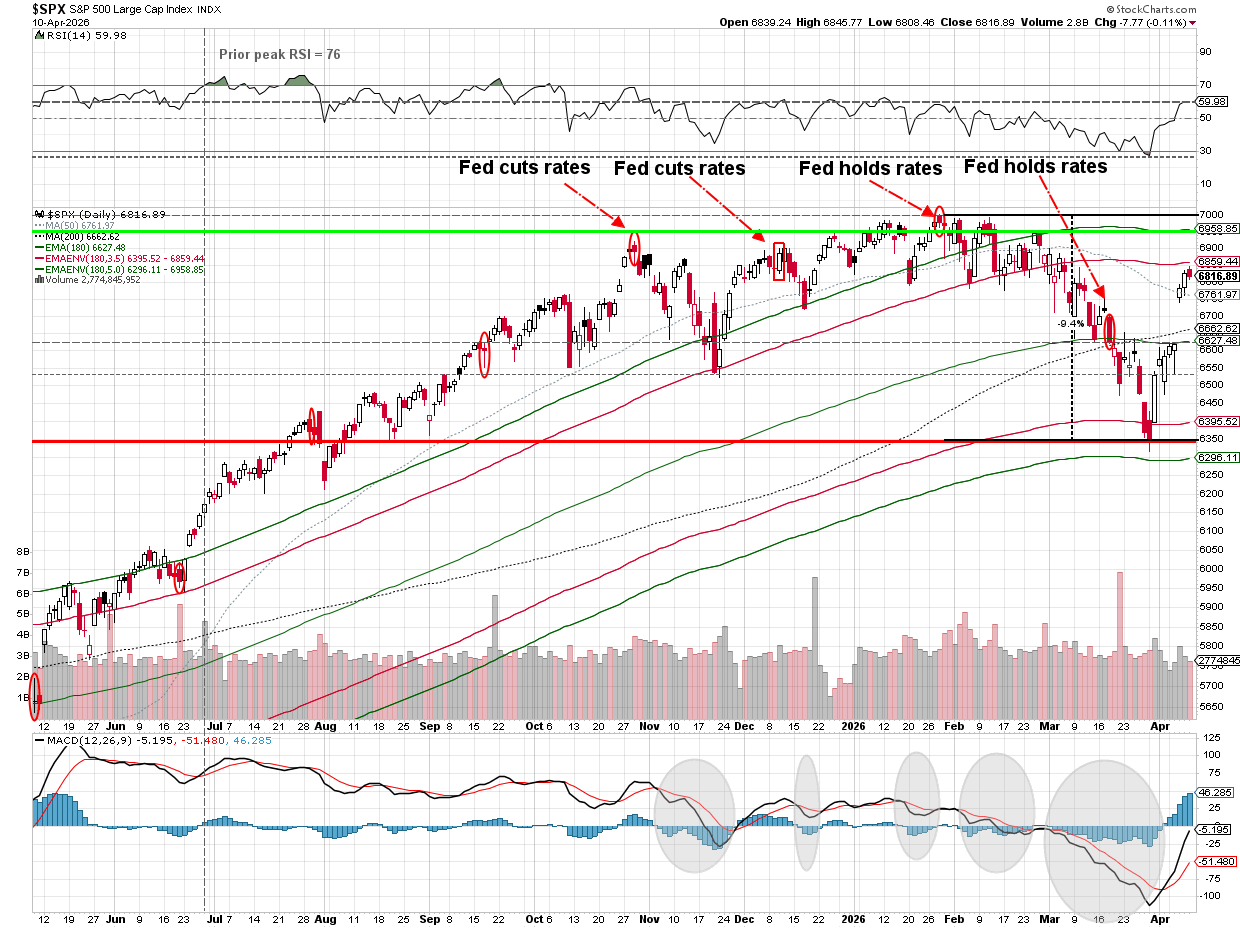
You can see on the short-term chart the relief rally on Wednesday morning, bringing us back to the highest levels since March 11.
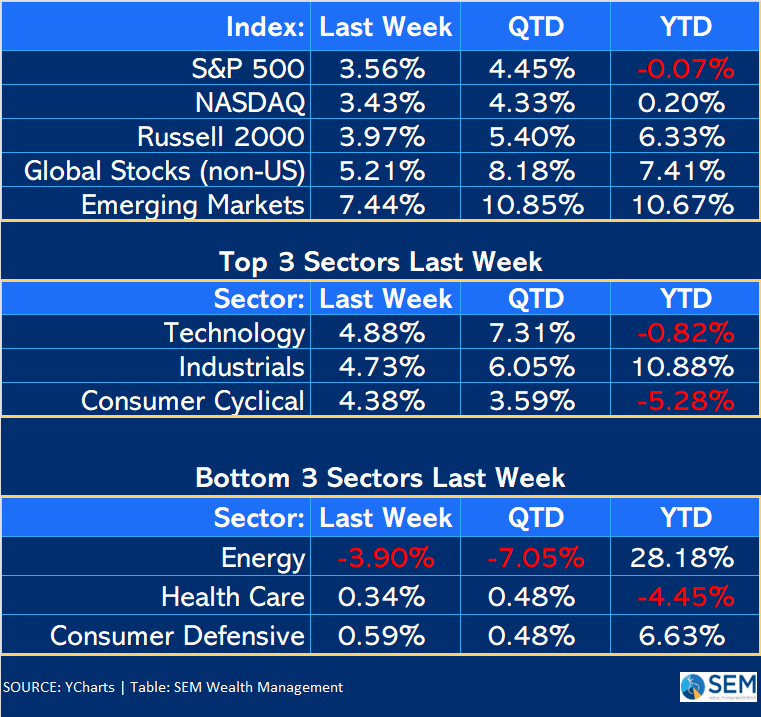
The S&P 500 is now back to the lower part of the range it was in going back to last October.
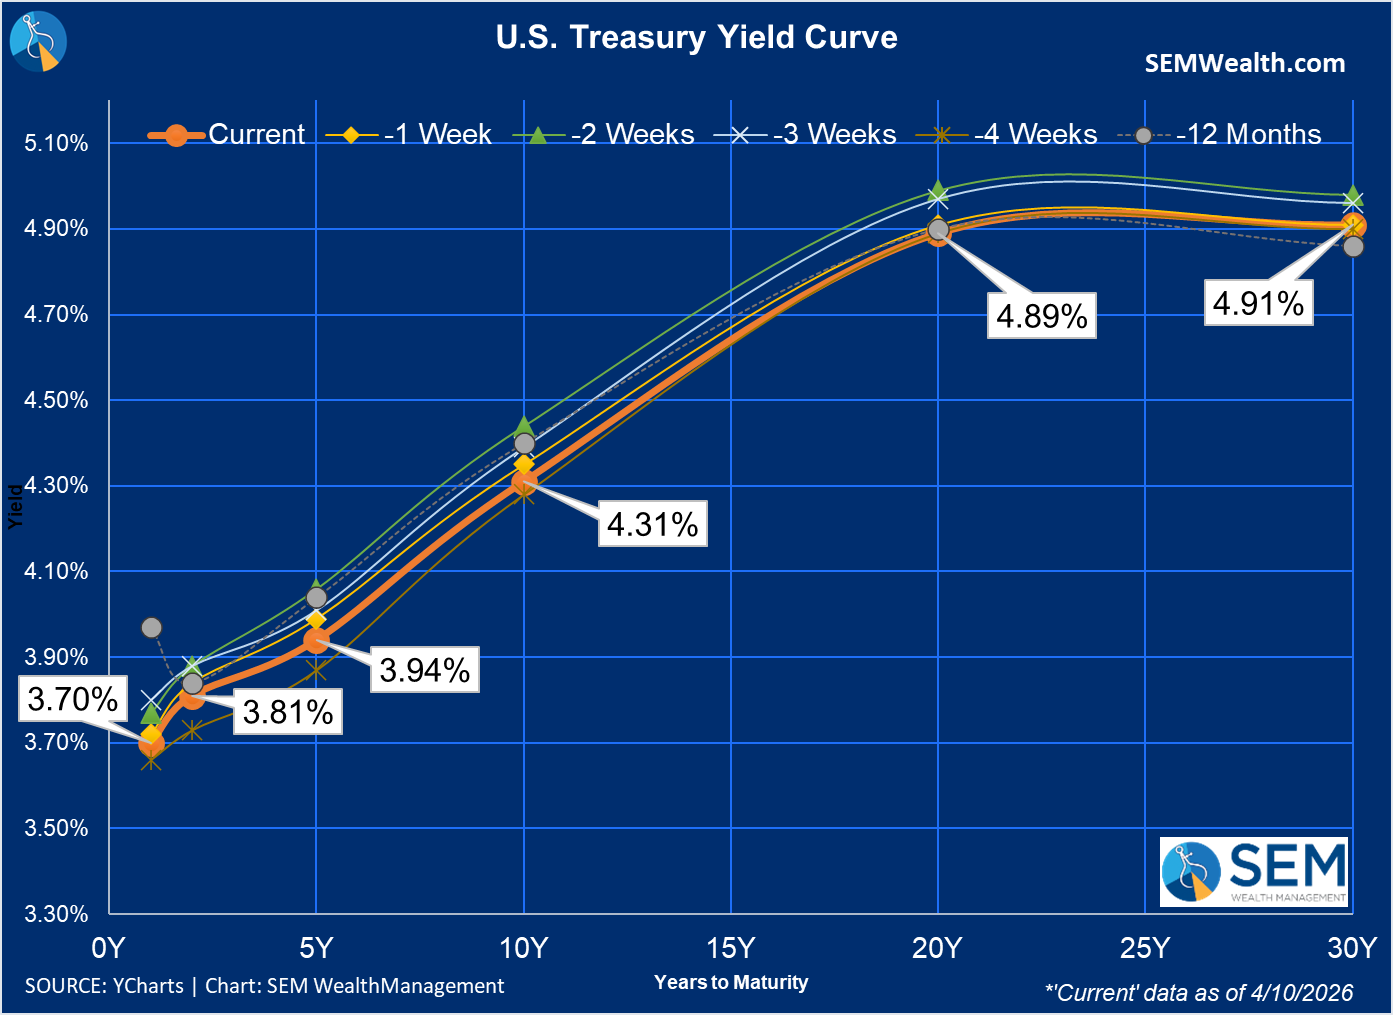
The bond market also breathed a sigh of relief, with rates falling across the board. Short-term rates remain above where they were when the war started, likely due to the likelihood of inflation keeping Fed rate cuts off the table for the foreseeable future.
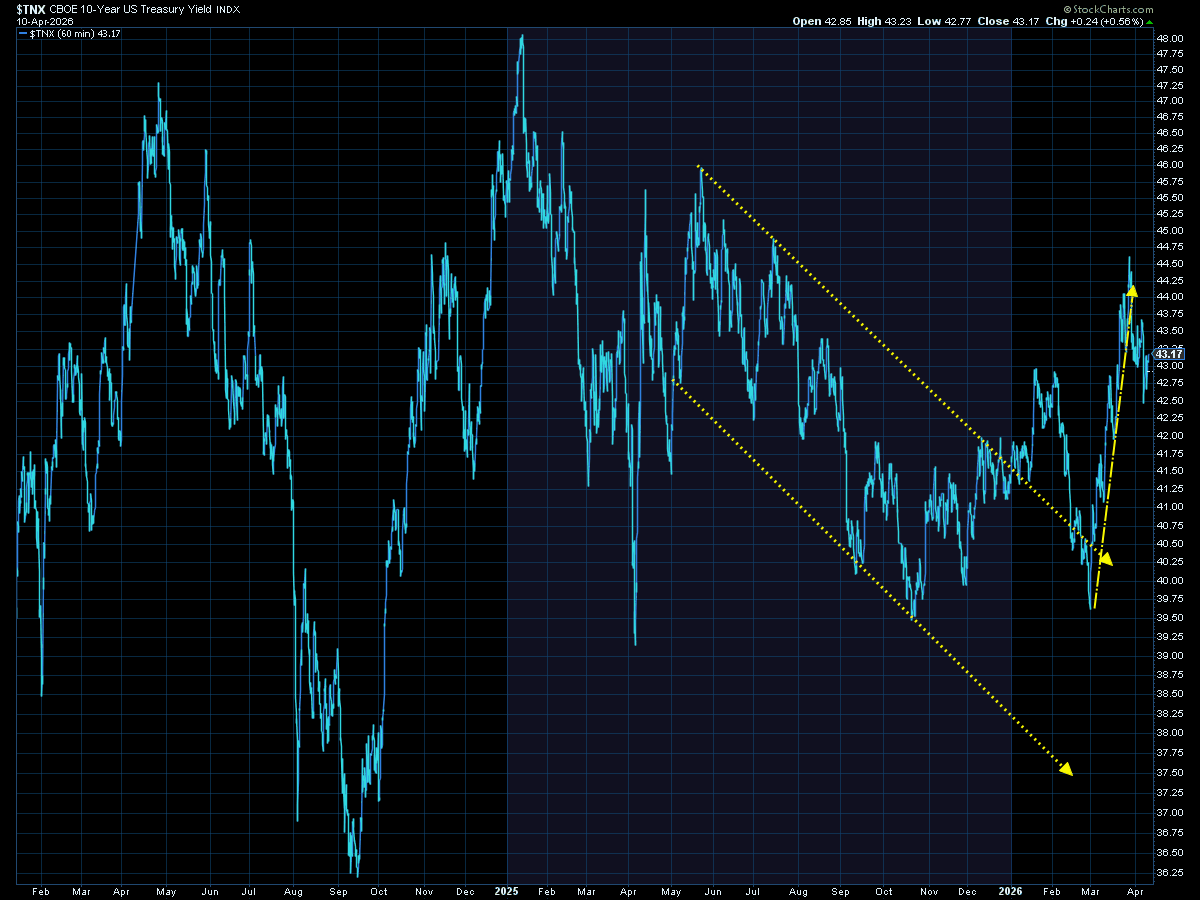
The 10-year bond yield still remains sharply higher than it was to start the year, which will remain a headwind on economic growth.
SEM Market Positioning
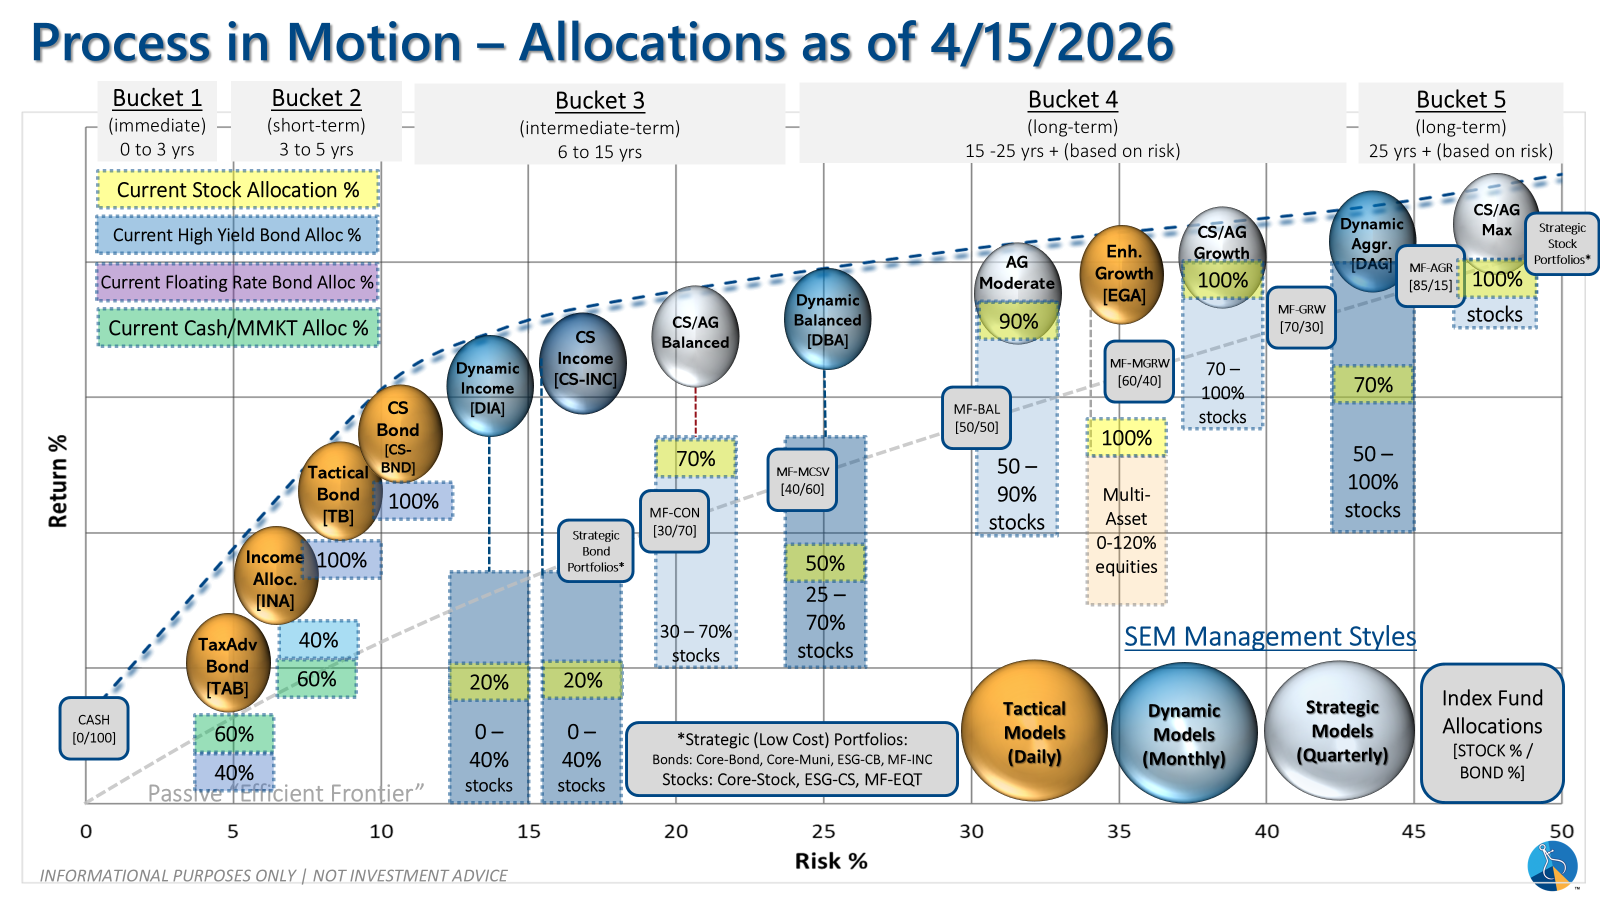
SEM deploys 3 distinct approaches – Tactical, Dynamic, and Strategic. These systems have been described as 'daily, monthly, quarterly' given how often they may make adjustments. Here is where they each stand.
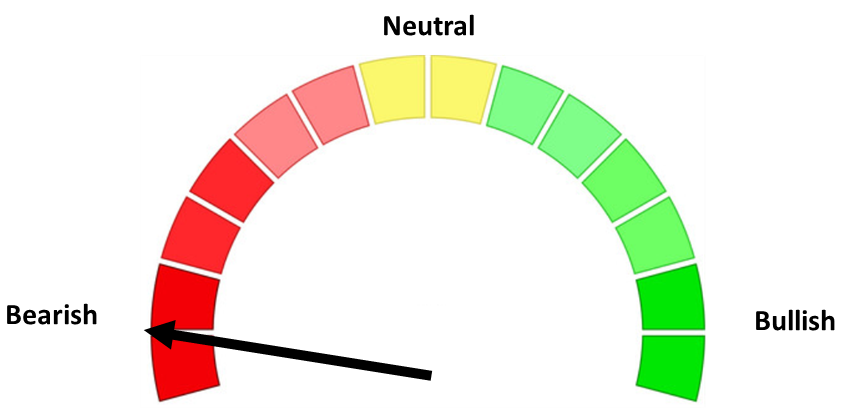
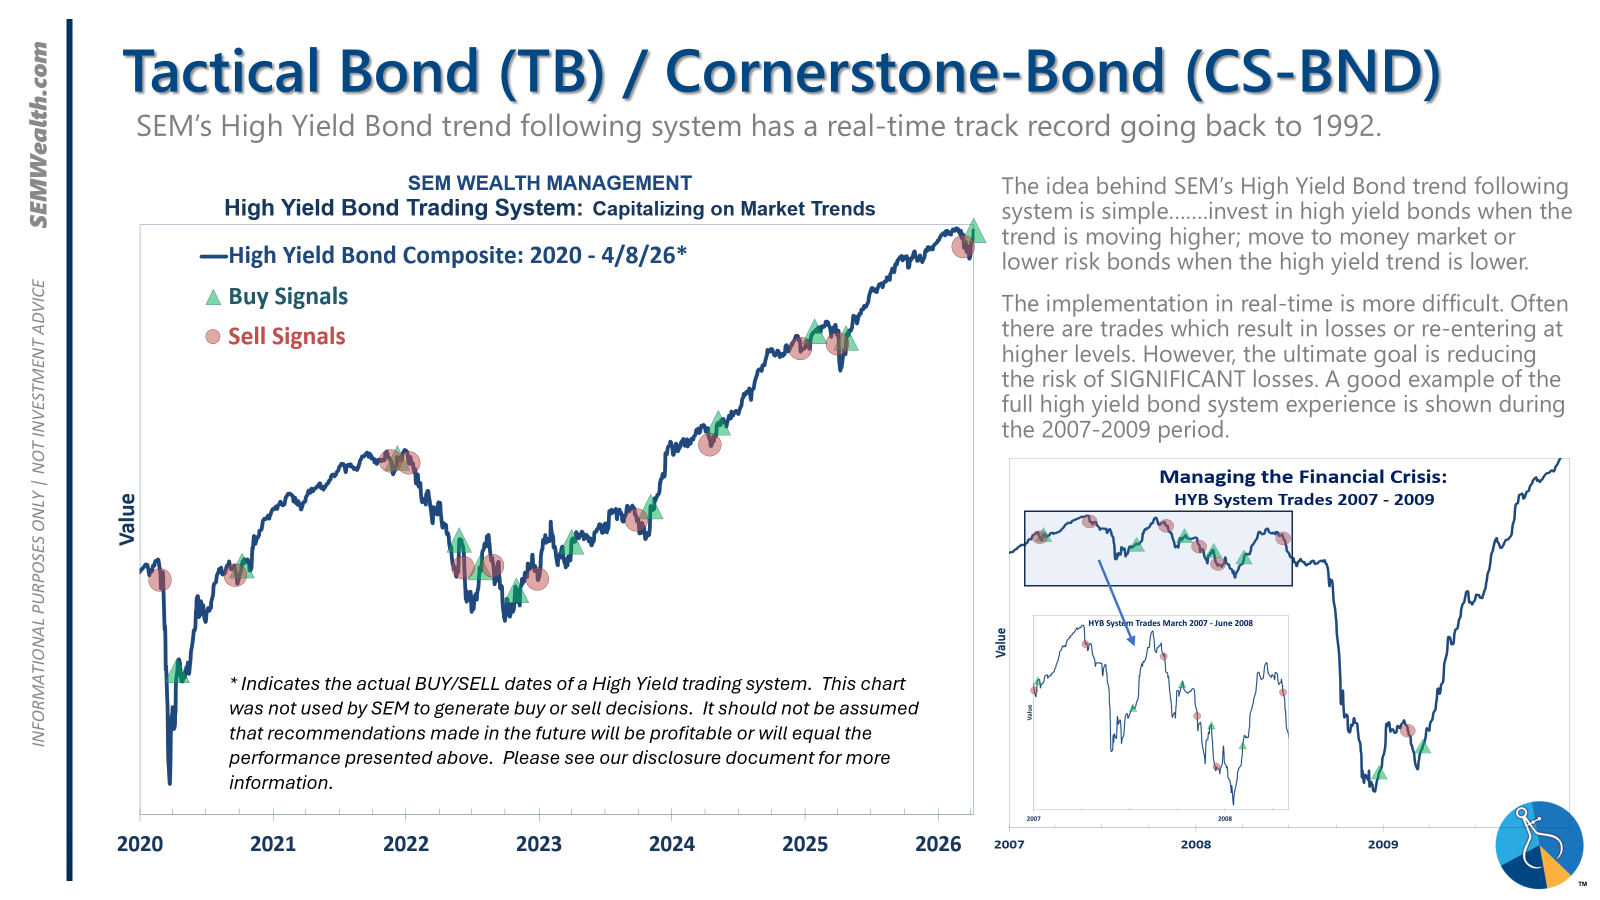
- Tactical = BULLISH | 100% High Yield Bond (4/8/2026) | High-yield spreads remain narrow but trend is slightly higher
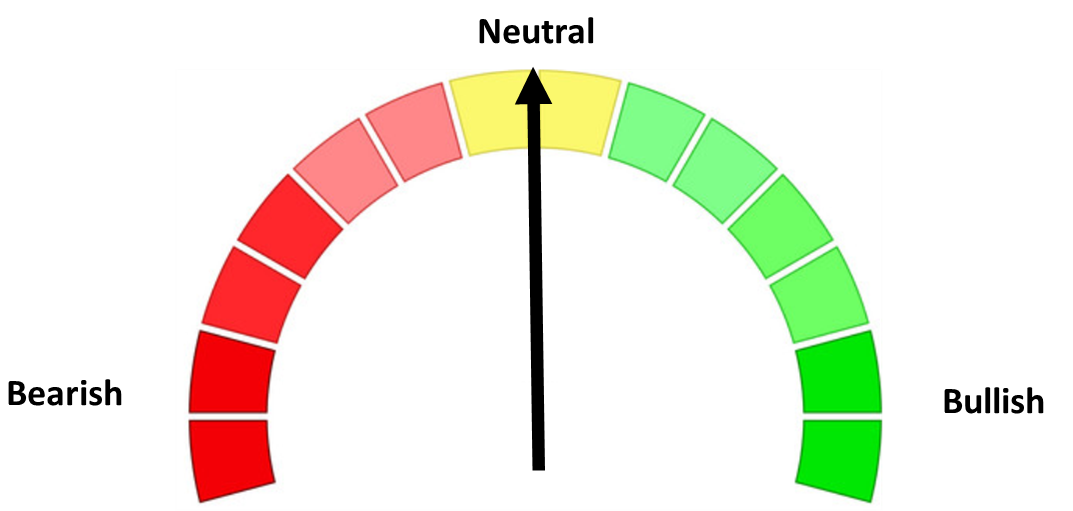
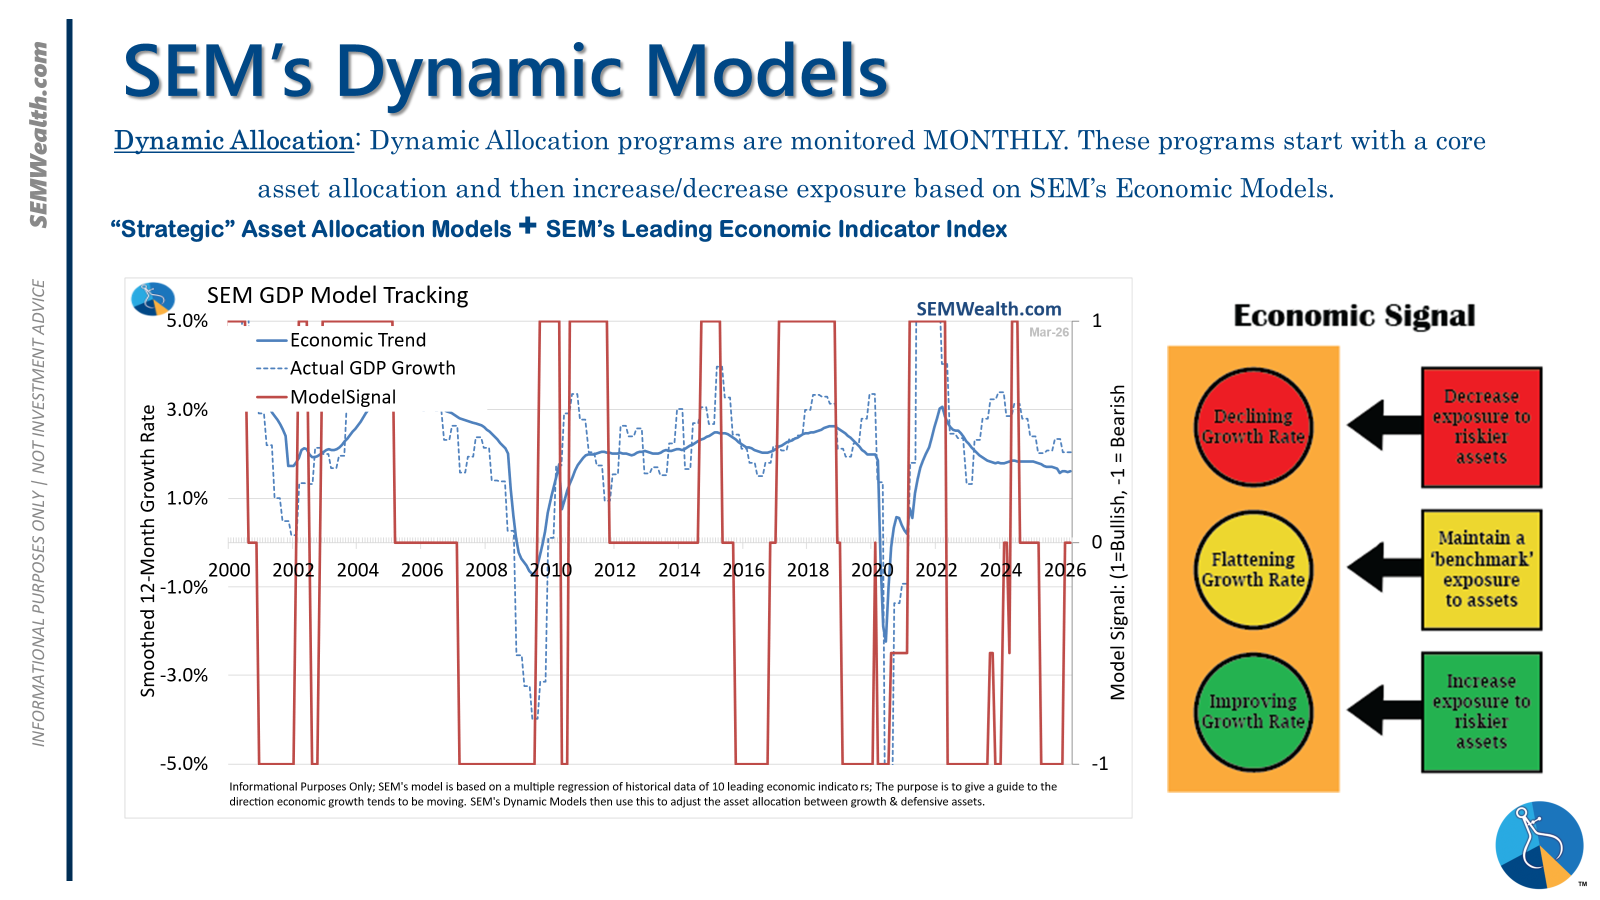
- Dynamic = NEUTRAL (2/15/2026) | "Benchmark" Allocation | Economic model inconclusive
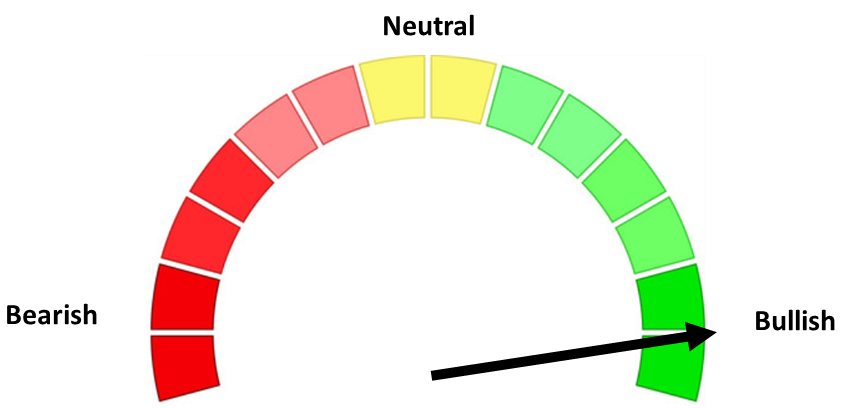
- Strategic = BULLISH (4/15/2026) | V-Bottom projecting "end" of Iran War
Tactical (daily):
- Monitored DAILY
- Models: Tactical Bond, Cornerstone Bond, Income Allocator, Tax Advantaged Bond
- Designed to follow the trends for use in our lower risk models
- BUY Signal issued April 8, 2026 (exiting the sell from March 13)
Dynamic (monthly):
- Monitored MONTHLY
- Models: All "Dynamic" Models (Income, Balanced, Growth, and Asset Allocator)
- Uses SEM's Quantitative Economic Model
- Designed to overweight riskier assets if economic trend is higher & underweight those assets if economic trend is lower.
- NEUTRAL signal issued February 15, 2026 (following BEARISH signal from July 2025)
Strategic (quarterly)*:
- Monitored QUARTERLY
- Models: AmeriGuard (Balanced, Moderate, & Growth) and Cornerstone (Balanced & Growth)
- Core Component: Quantitative Filter using 4 different time horizons across universe of asset classes
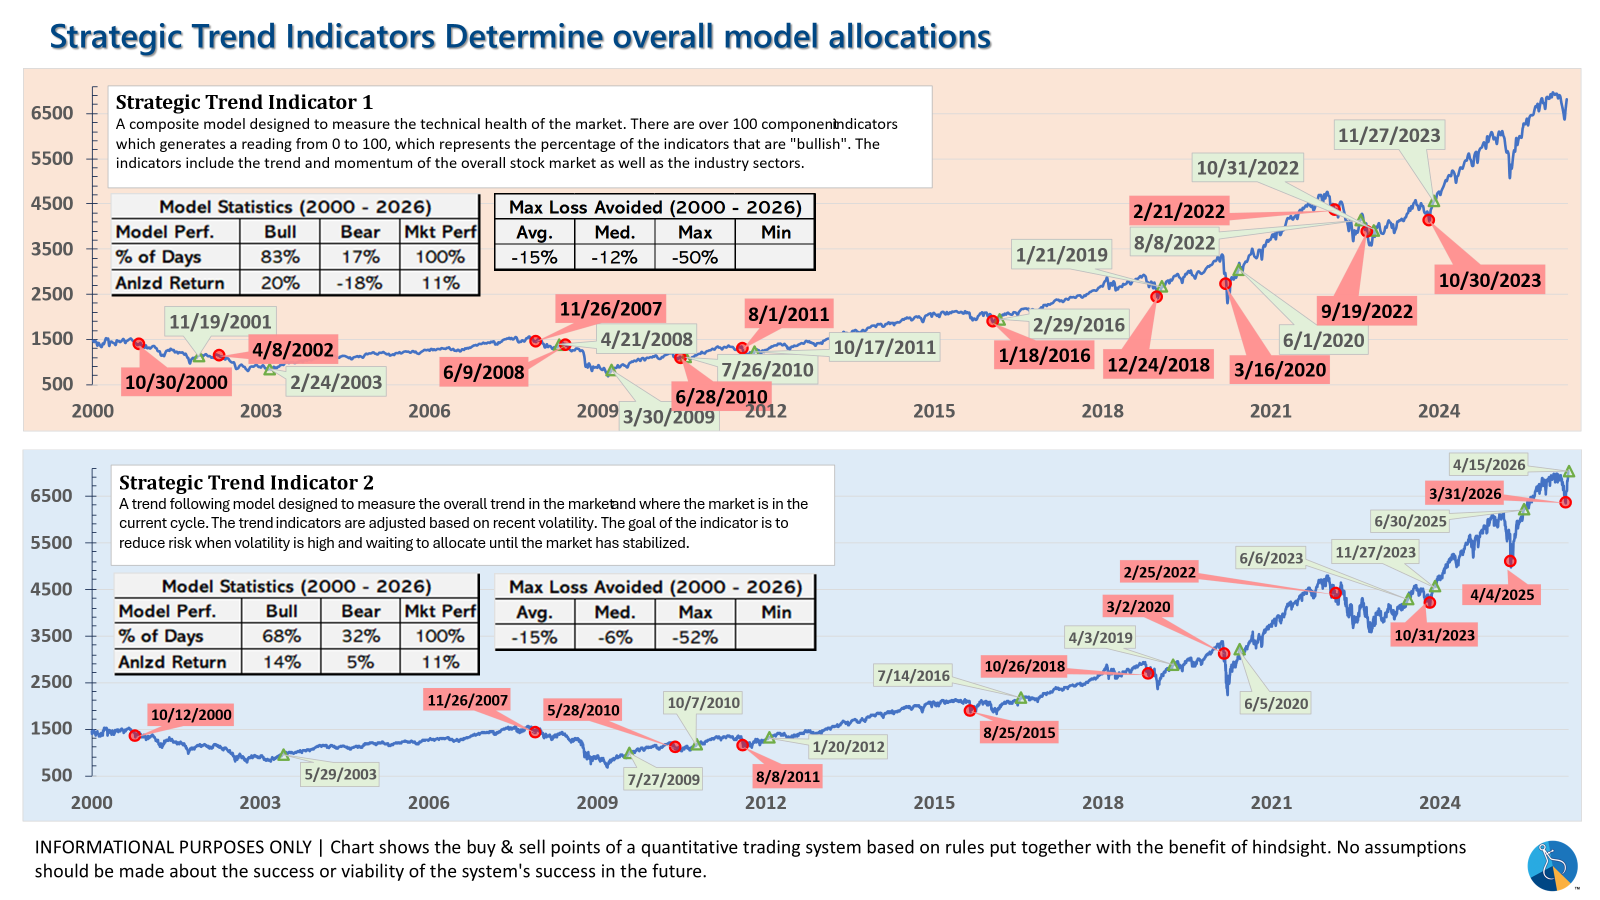
- Trend Indicator: Two different Quantitative Systems monitoring the intermediate-term trend, health of the market, and volatility
- CORE has been overweight small cap and international since October 2025 – overweight increased slightly in January
- Both TREND INDICATORS are BULLISH following 10% drop and "V-Bottom" reversal in early April
- AmeriGuard & Cornerstone Max DO NOT use the Trend indicator and are always 100% invested in stocks using our CORE rotation model.
The core rotation is adjusted quarterly. This quarter we saw half of our international positions reduced (we sold developed markets and kept our emerging markets exposure). We also saw the remaining share of mid-cap reduced in favor of more small cap exposure. We remain with a "barbell" core portfolio – about half in large cap and half in small cap as the models expect the market to "broaden".
The * in quarterly is for the trend models. These models are watched daily but they trade infrequently based on readings of where each believe we are in the cycle. The trend systems can be susceptible to "whipsaws" as we saw with the recent sell and buy signals at the end of October and November. The goal of the systems is to miss major downturns in the market. Risks are high when the market has been stampeding higher as it has for most of 2023. This means sometimes selling too soon. As we saw with the recent trade, the systems can quickly reverse if they are wrong.
Overall, this is how our various models stack up based on the last allocation change:
Curious if your current investment allocation aligns with your overall objectives and risk tolerance?