Originally posted September 1, 2026 / Last updated October 10, 2026
The money behind the AI buildout keeps changing shape, and this post is my attempt to hold it still long enough to explain it (while providing updates to the landscape as they occur). The post started with a walk through the Nvidia/OpenAI/SoftBank deal in Ohio, what changed in the four weeks after I first mentioned it in the blog, the part of the deal I like, and what would change my mind from being so skeptical. There's also an appendix on the AI tools themselves (same prompt, three tools, one month apart, completely different output) along with every mistake each one made.
We also will continue to update this post as new information comes along. Here's a table of contents. Click the link to jump to that section.
Original Contents:
- The diagram that wouldn't hold still
- What changed in four weeks
- A big shift this summer
- Circularity, or an unstoppable ecosystem?
- When your customer becomes your competitor
- The part of the deal I like
- What I'm watching
- Appendix: The same prompt, three tools, one month later
Updates:
- The supplier becomes the competitor: Nvidia announces purchase of Hugging Face (September 9, 2026)
- Open AI Launches Astra: Is it a gamechanger or another expensive model that won't be used? (September 12, 2026)
- Oracle's "Act of God" Letter (and what the bond market thinks): Is this the first sign of problems with the buildout? (October 10, 2026)
The diagram that wouldn't hold still
About a month ago I read a Wall Street Journal story about Nvidia agreeing to backstop the financing of an OpenAI data center in Ohio, and I couldn't get my head around it. It wasn't because the reporting was bad, but every paragraph introduced another party – a chip maker, a Japanese bank, a public utility, two federal agencies. I even grabbed my notepad to try to diagram it. When I was done I couldn't tell you who actually owed what to whom or even who owned what portions of the various entities.
I'd been using the "Pro" versions of the various popular tools for a while. Chat GPT for about a year and a half, CoPilot about that long, and Gemini for a little over a year. I'd started using Claude in mid-July and had been experimenting with having the tools working together for the last week. So I fed the article to Claude and asked it two questions: "What am I missing?" and "What are the interconnected pieces nobody is discussing?" After some back and forth follow-ups I then I asked it to write me a prompt for a graphic that would show the relationships outlined in the deal. I ran that prompt through Claude, Gemini and ChatGPT (I pay for all three) and ChatGPT gave me the best version on its SECOND attempt.
(Side note 1: This image is not the original version from July, but an UPDATED version as of August 27, 2026 – more on that below)
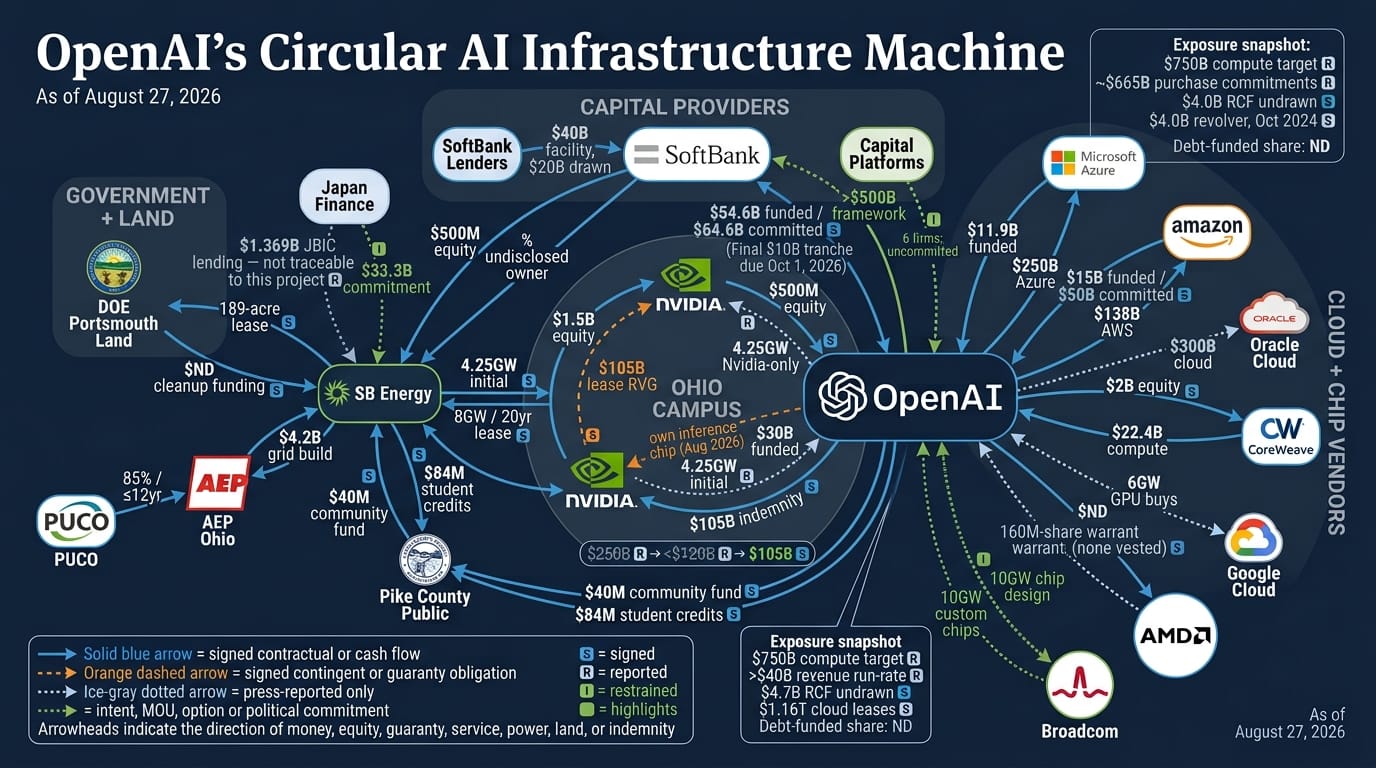
We need to be careful about what this proves. AI found things I'd definitely would have missed, in about 45 minutes on a Saturday. But it only found them because I knew what to ask, how to ask it, and I still spent the rest of the weekend checking the answers – two of which were wrong. As I originally wrote back on August 3, the bottleneck isn't the machine or tools. It's me (the end user), trying to verify it and put it in language our advisors can use so they can turn around and explain it to their clients.
 Jeff Hybiak, CFA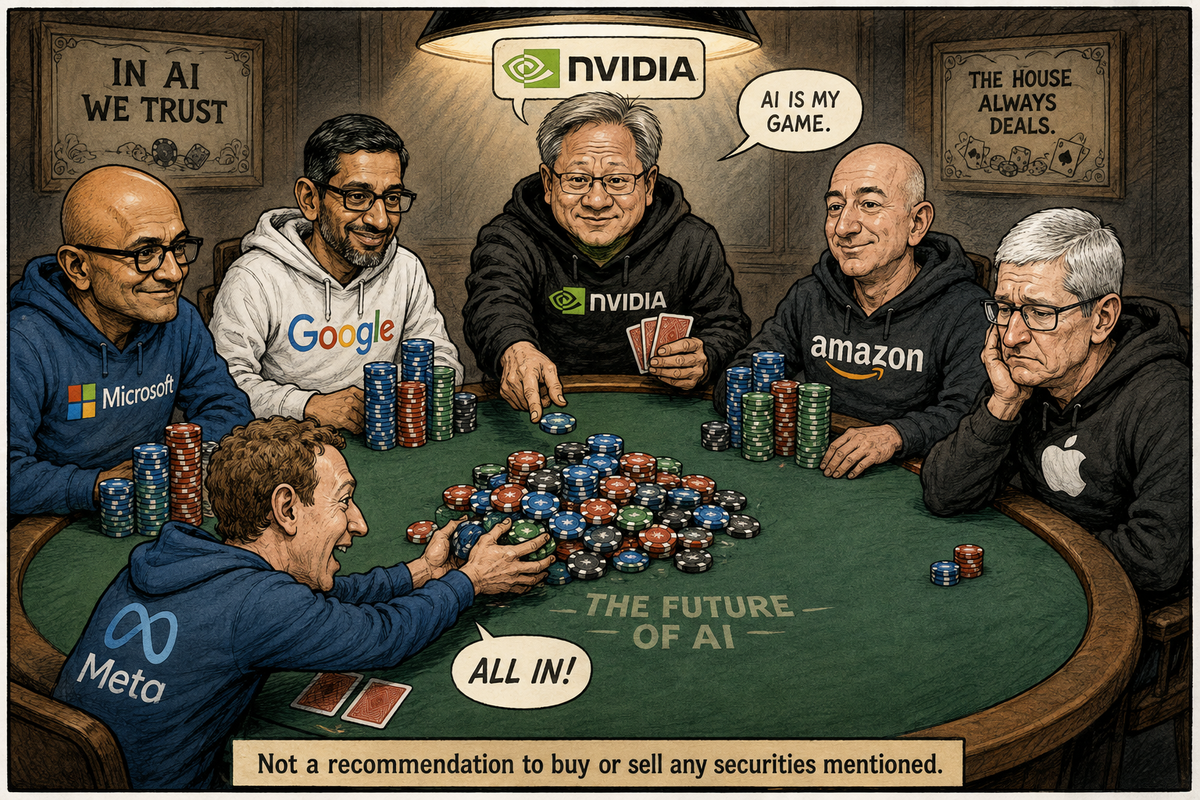
Since then I've spent countless hours researching ideas generated by the graphic, additional news reports, ideas that popped into my mind out on a walk and then prompting the various AI tools for more research and links, reading those links, and attempting to have diagrams drawn to lay this out in a way my brain could understand so I could then turn it into a blog. This is why it's taken me so long to get this post out and why it's over 5000 words!
(Side note 2: there is no clear leader among these tools yet. Back on August 1 Claude gave me the most robust research (and still does in my opinion), ChatGPT drew the best picture, Gemini, which had been my "go to" for images and diagrams gave me complete garbage. The key point – I would not have gotten either result from one of them alone. Anybody telling you they know who wins is just guessing.)
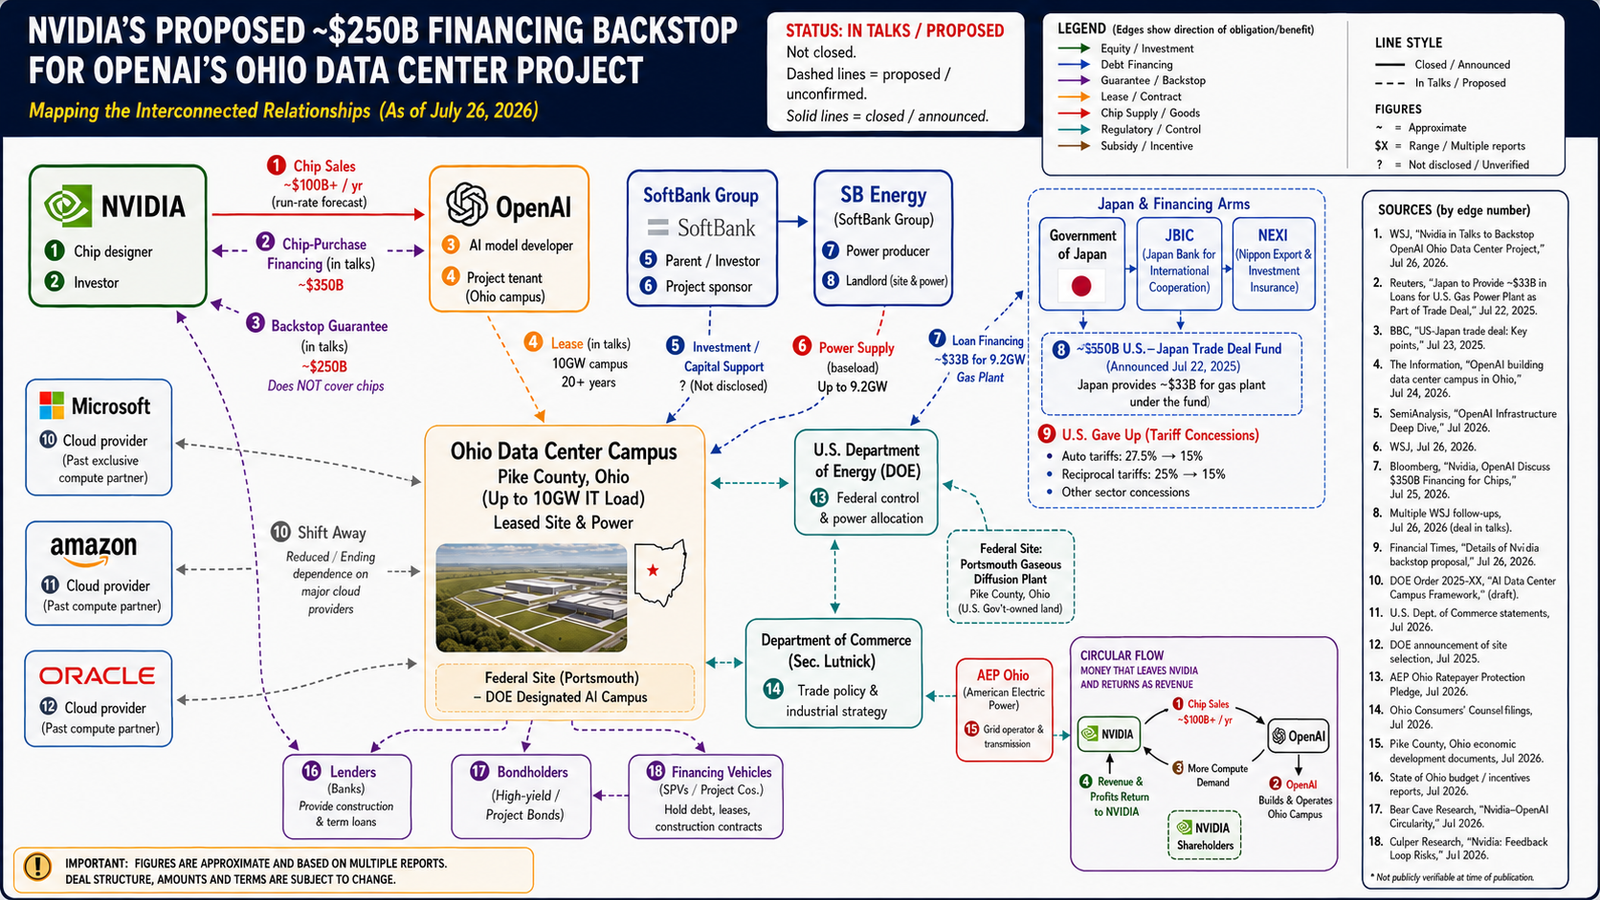
(Side note 3: The image above is the ORIGINAL image I used (and posted in the August 3 blog). I ran the same prompt again a month later, while writing this. Gemini – the tool whose July output I threw away – drew the best picture this time, and it did it in under a minute. ChatGPT took well over five minutes, and half its labels came out broken. I'm not telling you Gemini won. I'm telling you the ranking flipped in four weeks, which means it isn't a ranking. Anybody who picked a winner in July is already picking again. For those of you interested, all three attempts and some of my thoughts and experiences are at the bottom of this post.)
I also gave Claude, the one who did most of the heavy research and verification work a chance. As I've found all along (and admitted by Claude itself), it is not an image generator. Here is what Claude came up with using the same prompt:
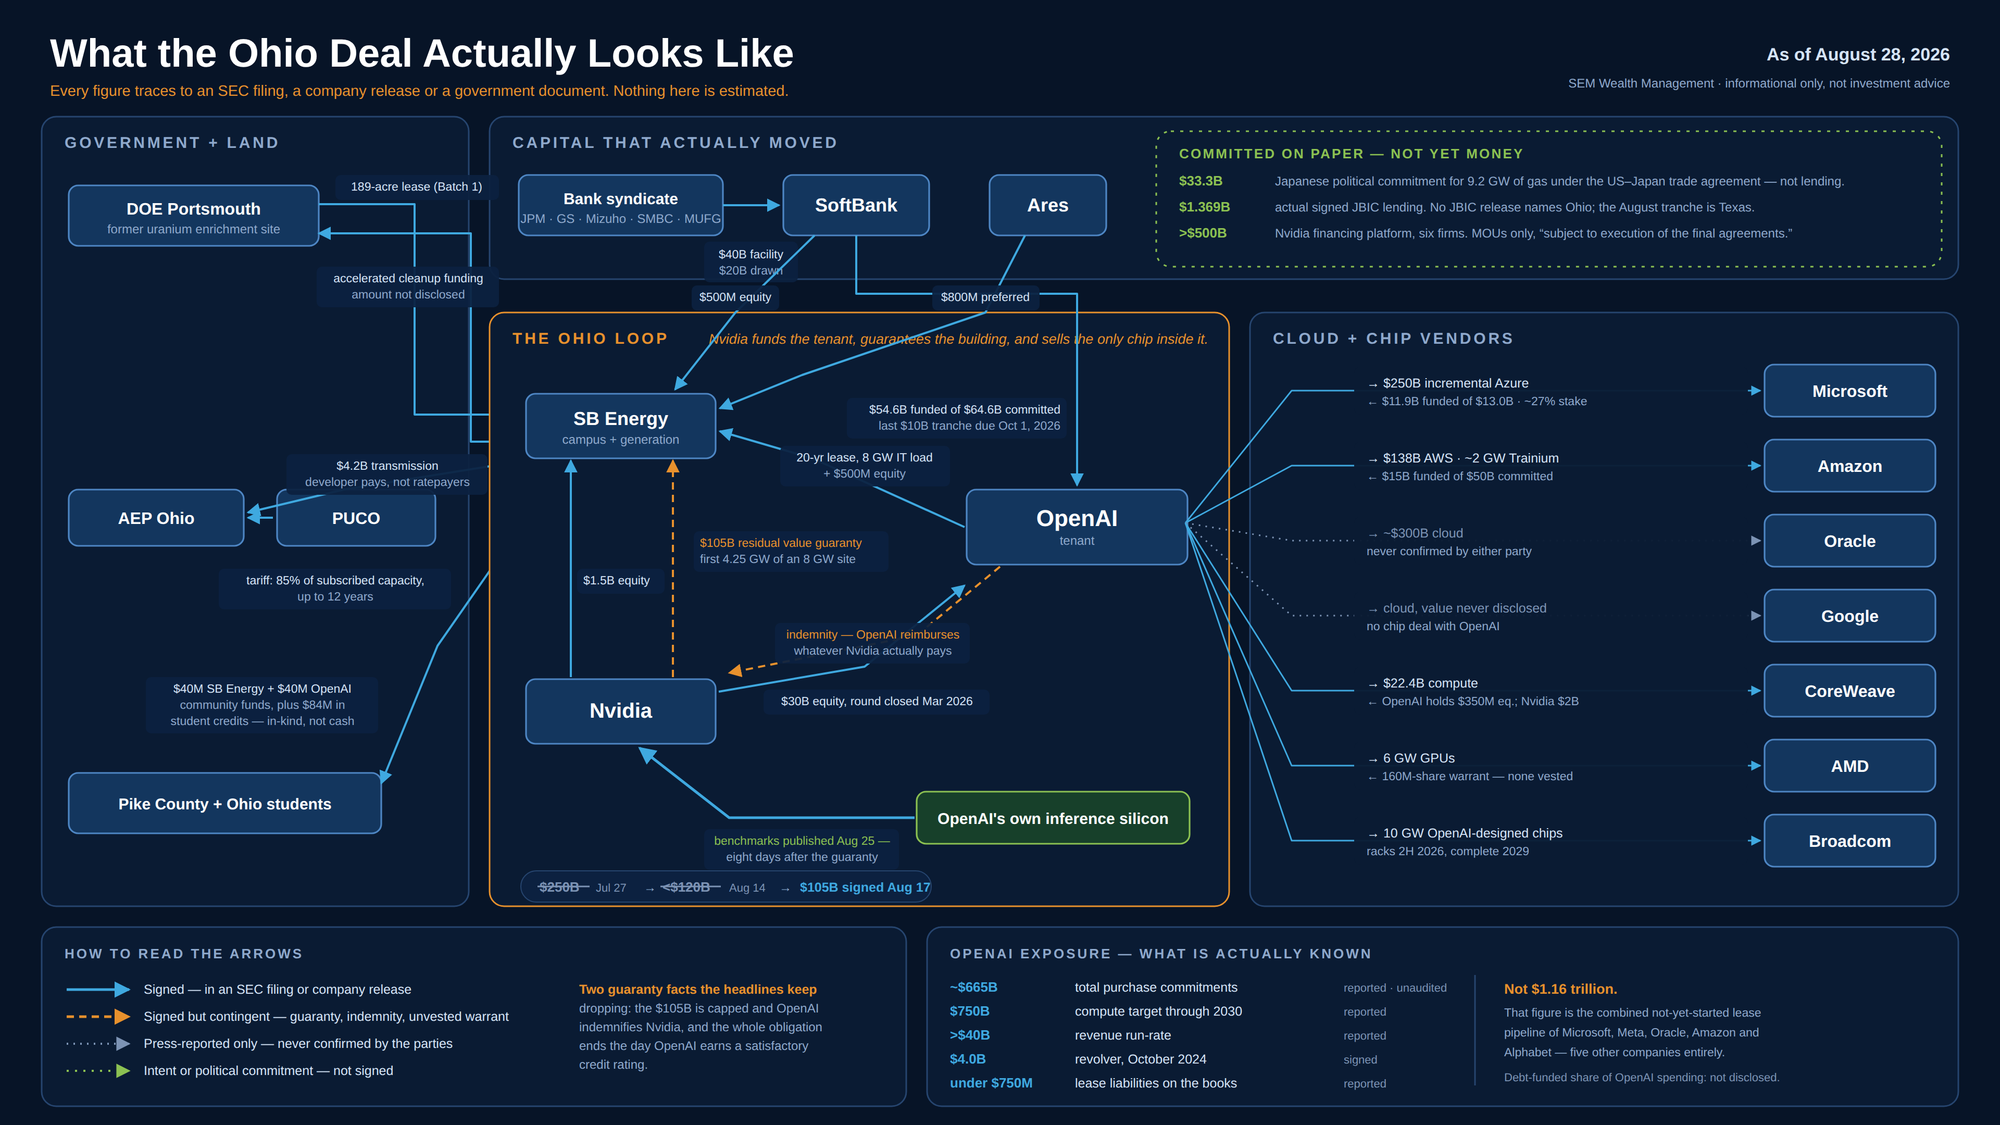
(Side note 4: As you can see, the Claude image is A LOT of text and if I were to use it on a slide I would have to change it to make it audience friendly. I've attempted to have Claude increase fonts, make it more visually appealing, etc. And it is a lot of effort and still doesn't get it over the finish line. Maybe if the audience were all engineers or finance nerds it could work. This actually reminds me of some of Rick's earliest charts he would use in client and advisor presentations (back when they were on overhead projectors).....lots of data and little explanation! There have been times where Claude has said, "I'm going to give you three options and I need your eyes to determine which one is the closest to what will look good in the back of the room." Other times it suggested I use Canva or Adobe if I want something more visually appealing......at least it is honest!)
Anyway, back to what I actually wanted to write about.........I started the outline of my post that Saturday (and made several promises it was coming.) Yet it kept changing nearly every few days as more details emerged. Four weeks later, most of the numbers on the originally diagram were wrong.
What changed in four weeks
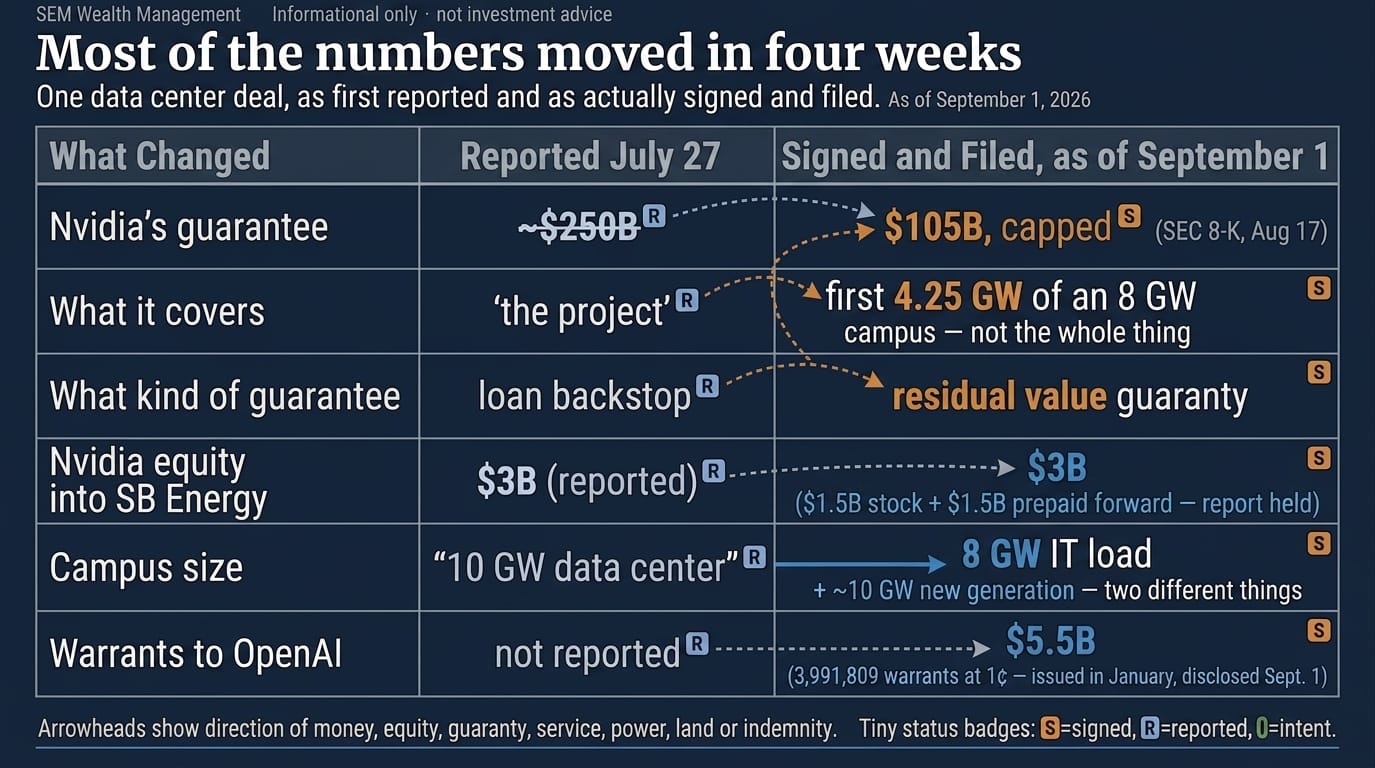
The biggest change is in the amount Nvidia is guaranteeing. The structure of the deal matters more than the number. Nvidia isn't co-signing OpenAI's loan the way you'd co-sign your kid's car loan. It's guaranteeing what the SITE will be worth if OpenAI defaults. OpenAI has agreed to pay back anything Nvidia pays out, and the obligation disappears the day OpenAI earns a credit rating good enough to stand on its own.
That falls in Nvidia's favor, but it's also, structurally, the same bet Lucent (and others) made on telecom gear in 2000 and GMAC made on three-year-old Suburbans back in 2007.....somebody has to guess what the collateral is worth when demand dries up (and it will....eventually), and somebody eats the difference if the guess is wrong. I walked through why that ends badly on August 17:
 Jeff Hybiak, CFA
The bond market reaction has been interesting. Nvidia's Credit Default Swaps (CDS) – the "insurance contracts to protect against losses on their debt" hit record highs after the deal was announced. Nvidia announced a SMALLER, tighter, better-structured deal on August 17, yet the CDSs are still significantly above where they were at the start of the summer (which increases their borrowing costs going forward.)
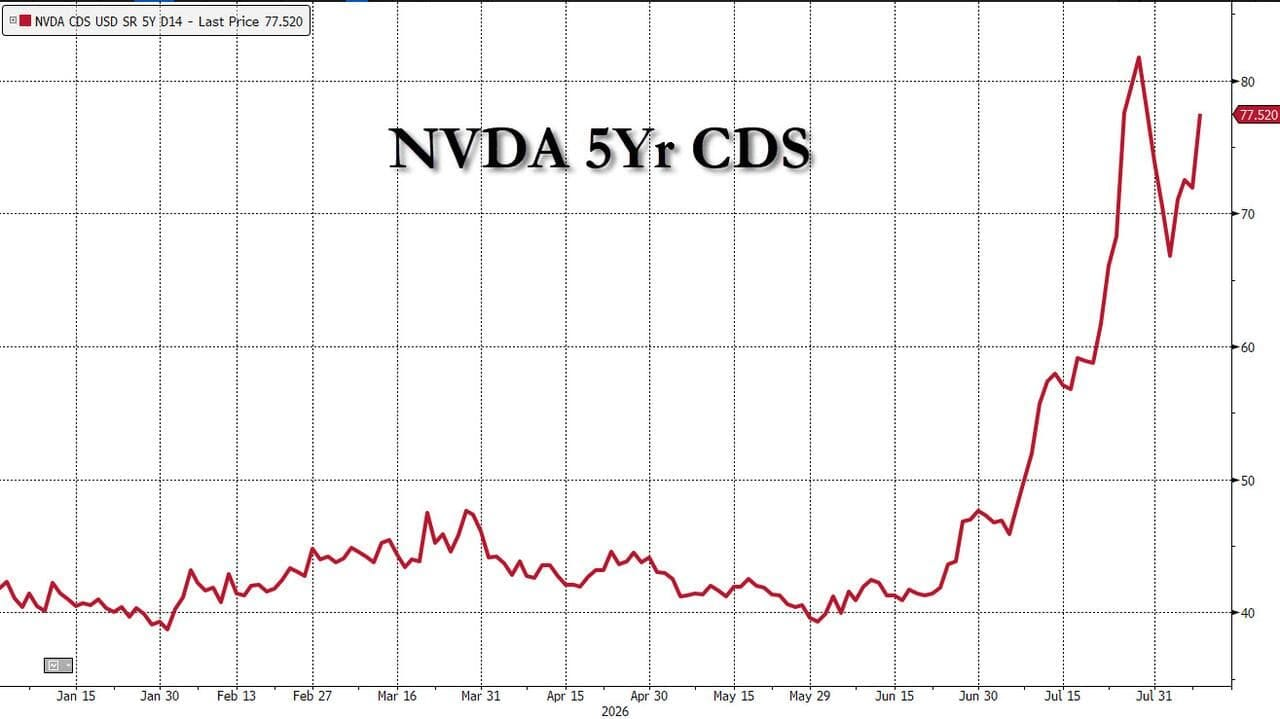
Nvidia might have a "stellar" balance sheet, but the market is telling them (and others) they will not be allowed to borrow indefinitely at low rates. That's worth considering as we move through this cycle.
A big shift this summer
In the August 17 "Hidden Dangers" post, I wrote about private credit funds capping withdrawals. In the second quarter investors asked to get out of these non-traded funds in record numbers, but the funds let only a fraction of them out. Blackstone, Apollo, Ares, Blue Owl, BlackRock, HPS. Nobody broke any rules as the withdrawal caps were in the documents, but it was a sign that something had changed.
We know money has been trying to LEAVE private credit, so the question is who's funding a buildout that needs more capital than ever?
We at least have part of the answer if we look at the six firms Nvidia named on August 10 as partners in a new platform to raise over $500 billion for chip buyers: Apollo, BlackRock, Blackstone, Brookfield, Goldman Sachs and KKR.
Four of those six were gating redemptions in their own private credit funds earlier this year. The money is coming from many of the same companies, but now it has changed sources. It's moving out of redeemable, retail-facing funds (where investors can ask for it back) and into locked-up structures: project-level shell companies, private placements, asset-backed bonds, annuities, and pensions.
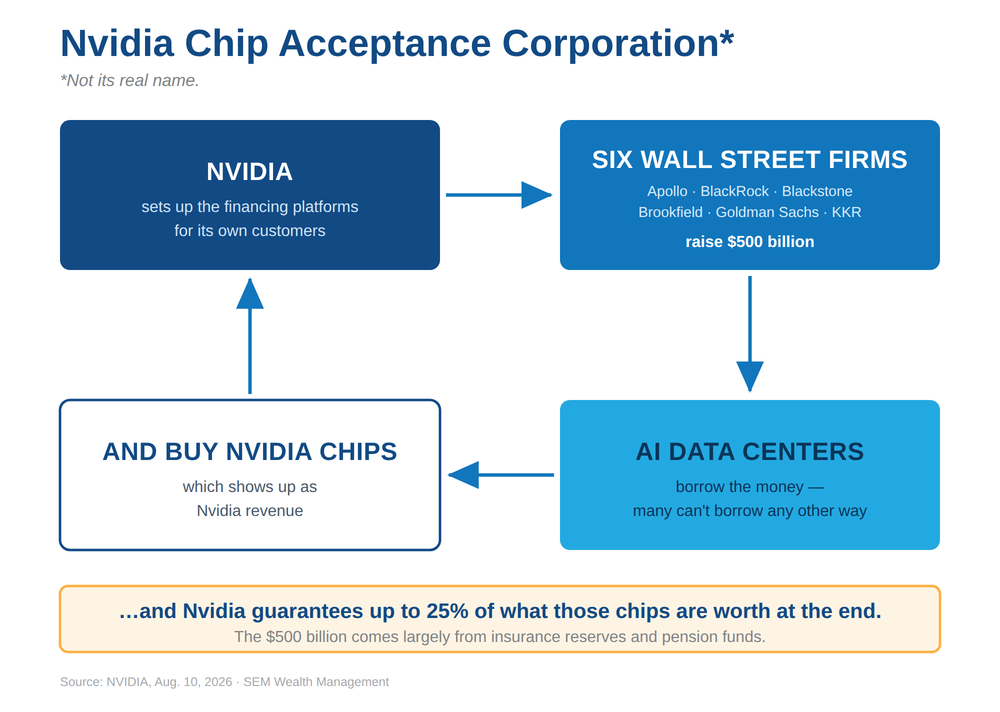
Leverage isn't showing up in one place. It's showing up in ever changing layers that seem to be changing by the week – the chip maker guaranteeing residual values, the landlord borrowing against the lease, the fund borrowing against the landlord. Each layer looks reasonable by itself, it's the size and interrelated transactions that give me pause.
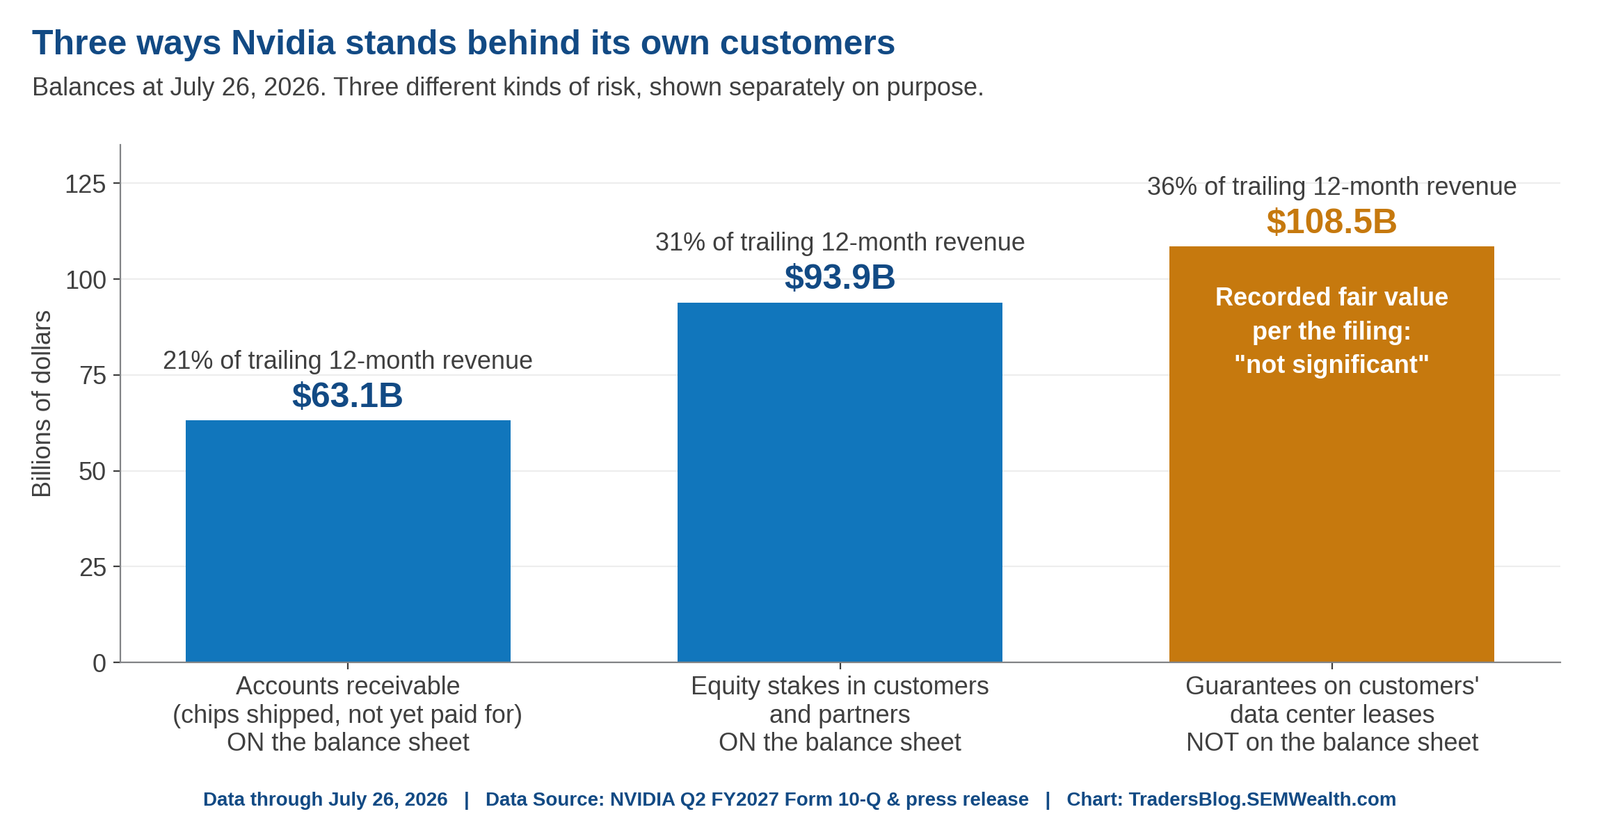
I detailed this in our August 31 blog when discussing Nvidia's latest earnings report. I apologize for harping on this, but once an accountant, always an accountant (and also because the BALANCE SHEET and FOOTNOTES were where the problems emerged when the tech and financial bubbles burst). Here are the places Nvidia's "sales" show up on the balance sheet.
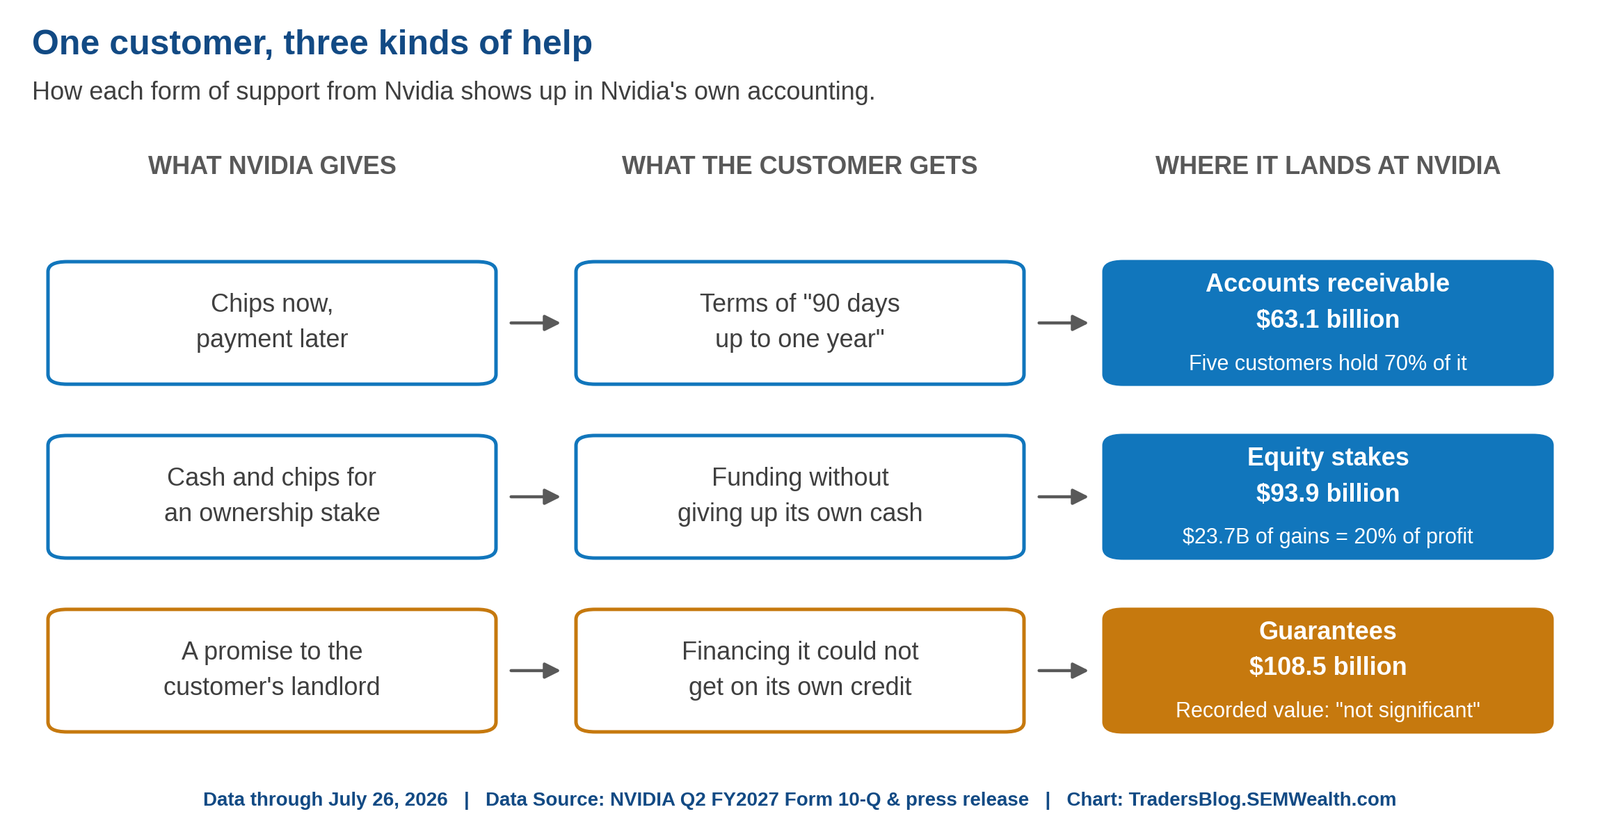
Accounts Receivable is one thing almost all companies carry. It could be a growing problem given that 70% of the money it is owed is from just 5 customers. The "value" of the equity stakes are adding to earnings as they "mark-to-market" those stakes, but the inverse also happens if those values decline. The bigger issue, and the one which started this blog post is the "guarantees" which are not anywhere on their financials, but are adding to revenue/earnings.
Circularity, or an unstoppable ecosystem?
Everything I've written about so far has been about one company and (mostly) just one deal. It was the most recent example, but certainly not the first example I've discussed (and probably won't be the last).
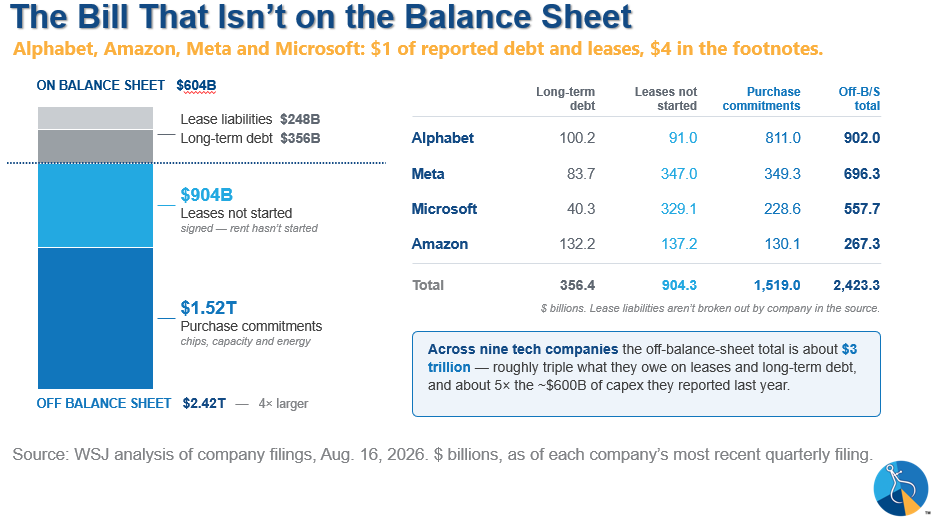
Every quarter the hyperscalers report capital spending, and that number gets treated as a solid commitment. The WSJ went through the filings in August and added up what the nine biggest AI spenders have signed but not yet recorded. For just Alphabet, Amazon, Meta and Microsoft, just $604 billion shows up on the balance sheet as long-term debt and lease liabilities. $2.42 trillion sits in the footnotes – $904 billion of leases that are signed but haven't started, and $1.52 trillion of purchase commitments for chips, capacity and energy. Across all nine companies it's roughly $2.5 trillion, about triple what they owe on debt and leases and five times the capex they reported last year.
Meta's Hyperion data center in Louisiana is the clearest example. The campus covers something like 1,700 football fields. The lease runs 4 years starting in 2029, with renewal options out to 20. Meta also promised to make its bondholders whole (a guarantee it doesn't consider probable), so no liability gets recorded. Nothing hits the balance sheet until rent starts. (They aren't breaking the rules, but the rules allow them to use their "judgment" in assessing the likelihood of the other parties defaulting.....because corporate CEOs and CFOs have always been good at that!)
I actually diagramed this back in October 2025 after reading a Bloomberg Money Stuff column about this. I purposely didn't name Meta or the specific data center as I wanted to talk concepts, not specific deals.
 Jeff Hybiak, CFA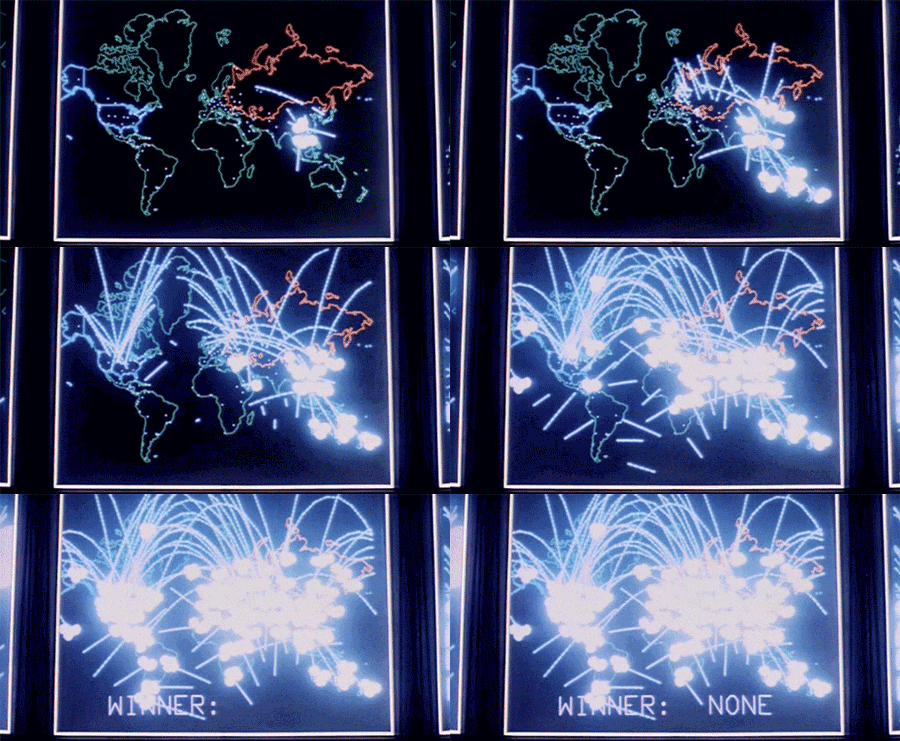
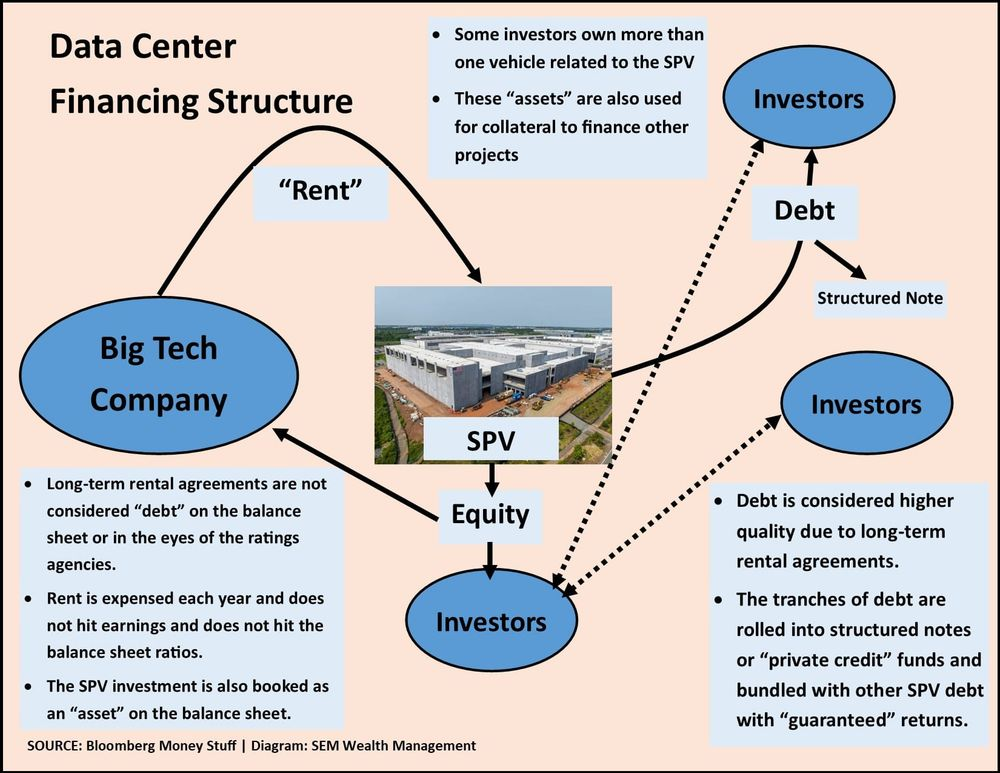
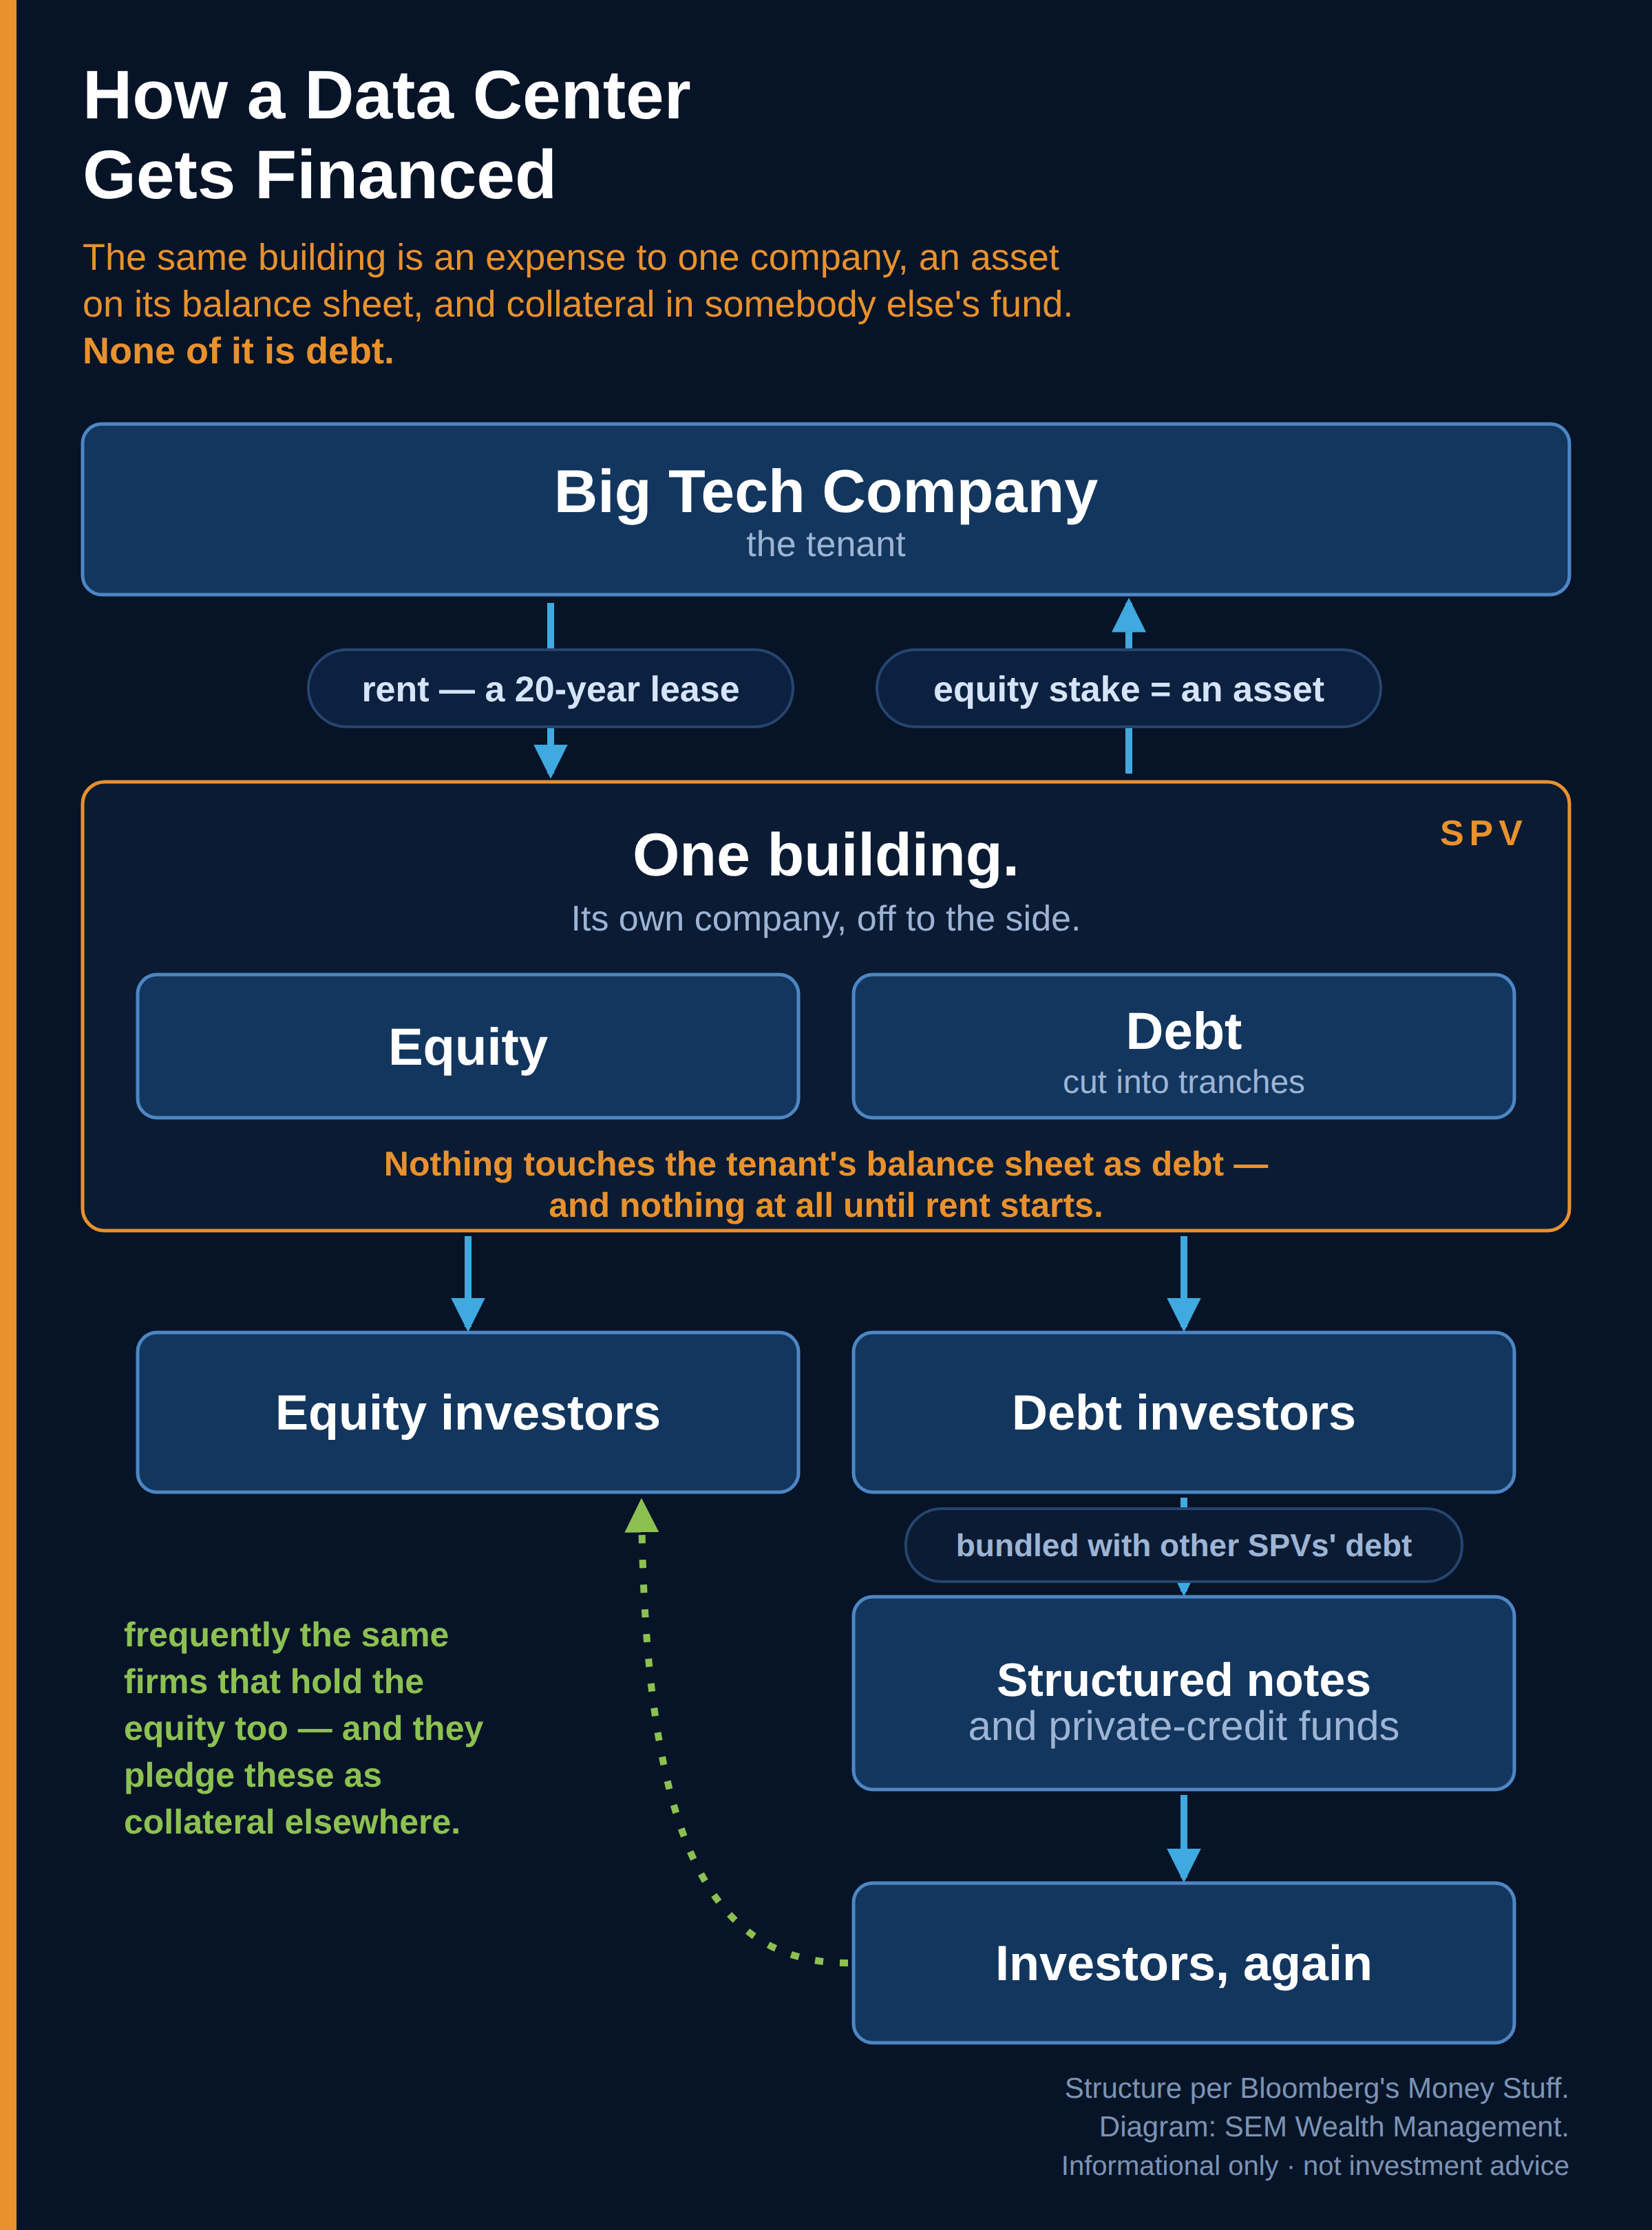
(Side note 5: The image above is the original diagram I created using Publisher/PowerPoint. I asked Gemini, ChatGPT, and Claude to "make this chart look more professional and match the SEM styling stored in your memory." Gemini and ChatGPT basically cleaned up some of the fonts, but it looked essentially the same. This is what Claude came up with (after several back and forth iterations about font sizing and structure). It also fact-checked me and clarified a few things I had missed last October.)
Once again, I should be clear – none of these things breaks current accounting rules. Every number I just quoted came out of a public filing (albeit typically in footnotes). Morgan Stanley's analysts said it about as plainly as you'll hear it from a Wall Street firm back in April: as these commitments get "more frequent, larger, and more complex," it's "becoming increasingly difficult for investors to assess companies' total potential leverage."
When somebody (like me) talks about the circular deals as being just an OpenAI/Nvidia problem, they are only talking about the one that got the most attention. All of the hyperscalers are doing things like this (as are non-hyperscalers like Broadcom and Oracle and CoreWeave and AMD and Intel.......). This web of relationships isn't one deal. It's the entire industry.
This brings us to the harder question and the one I can't answer (yet) – does this leverage driven boom (bubble?) ever break? Circular financing is what a bubble looks like from the inside. It's also what a real ecosystem looks like from the inside – suppliers investing in customers, customers pre-committing to suppliers, everybody building for demand nobody can prove yet. Railroads did it. The telephone system did it. Electric utilities did it. Broadband internet providers did it. All had similarities, but not all ended badly (although all eras saw some sort of big market drop during or after the cycle.) Be careful with anybody who tells you they already know which one this is or how it ends. What I can tell you is that none of this is hidden, but you do have to look closely. It's in the footnotes, it's getting bigger, and it's following a very similar path as the ones that ended badly.
When your customer becomes your competitor
Going back to the original diagram, the one part that I hadn't (yet) thought about is how the arrows point in both directions for most of the companies.
OpenAI is a tenant of Microsoft, Amazon, Google and Oracle and its total compute commitments run roughly $665 billion as of March 2026. Oracle is the extreme case: OpenAI is about half of Oracle's contracted future revenue, which S&P cited when it cut Oracle to one notch above junk in July. OpenAI's exclusivity with Microsoft ended in April, freeing it to sell across all of the hyperscalers (and Microsoft's CoPilot now lets us use both OpenAI and Anthropic's Claude)......also don't forget that Microsoft is a significant shareholder in OpenAI.
On August 25, eight days after Nvidia guaranteed $105 billion of its lease, OpenAI published benchmark results for its own inference chip, claiming up to 1.9 times the work per watt of Nvidia's current hardware (like in 1996-1999 I'm trying to get up to speed with this techy mumbo jumbo as quickly as possible). Now, the chip is inference-only and OpenAI sponsored the tests itself so it may just be noise or a PR stunt. Nvidia responded during their earnings call when CEO Jensen Huang said, "Many of these XPUs are inference-specific chips for one cloud or one service. NVIDIA is 'an entire AI factory' platform that spans the entire AI lifecycle that you can use in any cloud." In other words, the OpenAI chip does one job, Nvidia does all of them.
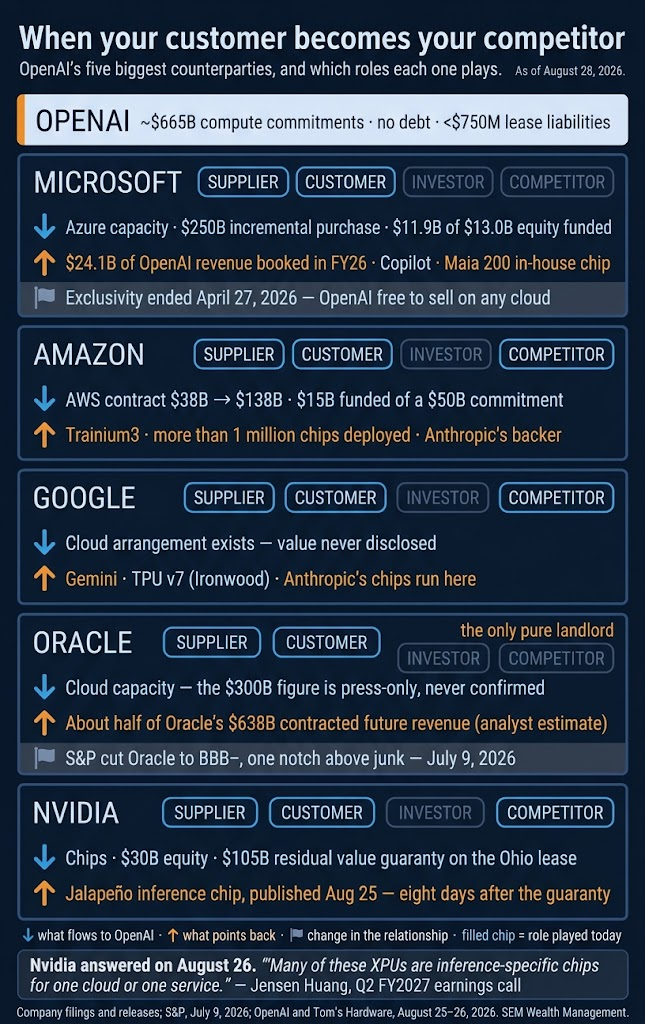
Maybe it isn't an immediate threat to Nvidia, but we should take the direction seriously. It's not just OpenAI producing chips that compete with Nvidia. We see Google, Amazon, Microsoft and Meta already doing the same thing. We also can't forget about Broadcom who is both a supplier to OpenAI but also is helping build everybody else's chips to compete with Nvidia – Google's TPU, Meta's MTIA, and now OpenAI's Jalapeño. Little chips in the Nvidia controlled eco-system could easily bring everything down.
The part of the deal I like
I've spent this whole article on what worries me, so let me spend some time on the positives. The site in Pike County was a uranium enrichment plant. The government selected the site in 1952, enrichment stopped in 2000, the buildings went back to the Department of Energy for demolition in 2011, and more than 3,700 acres have sat there ever since with a couple thousand people working a cleanup expected to run into the next decade. Somebody was always going to pay for that cleanup. Up to now, that somebody was you (the taxpayer).
I'd heard from other reports/commentators that the land was leased and assumed that meant rent, but I couldn't confirm it in any official releases. The DOE is leasing federal parcels to an SB Energy entity (the first batch is 189 acres) under a set of authorities written for exactly this situation: get contaminated federal property cleaned up by handing it to somebody who wants to use it. But what the DOE lists as the consideration isn't a rent check. It's SB Energy funding an accelerated cleanup.
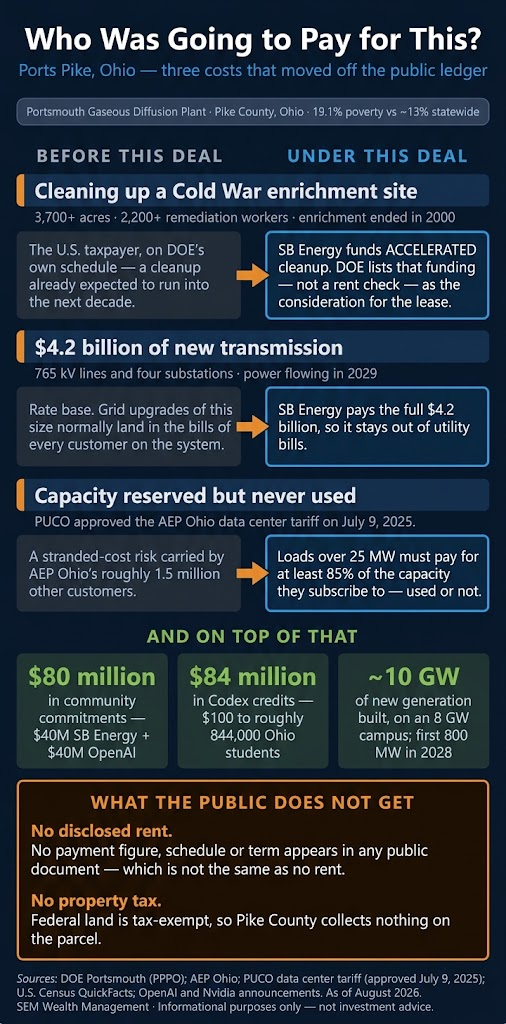
I went in looking for rent and came out with something I like better. Rent is a line in a budget. A Cold War enrichment site getting cleaned up years ahead of when the taxpayer was going to fund it is a permanent change to a county with a 19.1% poverty rate (compared to the Ohio statewide average of 13%). On top of that, $80 million in community commitments split between SB Energy and OpenAI, plus coding-tool credits for Ohio students.
SB Energy is also paying the full $4.2 billion for the new transmission lines rather than putting it in anybody's utility bill. Ohio regulators had already approved a data center policy requiring these customers to pay for at least 85% of the capacity they reserve whether they use it or not – a rule the Ohio Consumers' Counsel supported and the data center industry opposed. State utility regulation, built a century ago to stop exactly this kind of cost-shifting, is doing its job here (for now).
(Side note 6: I know I said this was the section where I talked about what I liked, but I have to mention this.....SB Energy filed to go public on September 1, and the filing is its own circularity chart. SoftBank controls the company and will still control it after the listing, though the actual ownership percentage is still an undisclosed unknown. Nvidia has committed $3 billion: $1.5 billion of a new class of non-voting stock at the IPO price, plus a $1.5 billion prepaid forward signed August 17 (the same day it guaranteed $105 billion of the leases.) OpenAI put in $500 million alongside SoftBank, signed 17 leases for roughly 8 gigawatts in Ohio, and was handed 3,991,809 warrants at an exercise price of one cent, worth $3.6 billion when they were issued in January and $5.5 billion by June 30! So the tenant AND exclusive chip supplier both own a piece of the landlord, and the same exclusive chip supplier also insures the landlord's collateral, and the landlord's parent is also a tenant! There's more to this, but back to the positives.............)
We can't forget about the asset itself. Roughly 10 gigawatts of new generation gets built. If the AI buildout disappoints and we have too much "compute" capacity, we still have the electricity. That's the sharpest difference between this and the broadband buildout I lived through. Under 5% of the fiber laid in 1999 was ever utilized, because fiber could only ever be fiber. Power is power. It runs a data center, a factory, or a subdivision.
The other side of me is also encouraged at the "public-private" partnership aspect of this. I'd prefer it not be a Japanese entity doing a lot of the heavy lifting, but maybe this becomes a diagram for US based energy companies and our Wall Street banks to utilize unusable Federal land, improve our energy infrastructure, and help build out more capacity for the AI boom.
What I'm watching
Every big buildout in history got built ahead of its use – railroads, the electric grid, radio, mainframe computing, and the "broadband" network. The technology almost always survives, but the payoff usually shows up a decade or more after the buildout starts. The market doesn't necessarily have to crash, but in all buildouts there has been a lag between the initial buildout and the actual productivity boost. It's the early BUILDERS who don't always make it, and what kills them is almost never the technology. It's how they financed their spending in the race to be "first".
We still need some details from Nvidia on the actual "official" floor and the guarantee along with more details than Nvidia's announcement on the financing partnerships. Any of these could change and complicate the diagram once again.
Beyond this deal, here's what I'll be watching and probably reporting on as we migrate through the cycle:
- Who's waiting to get paid. The number I like to watch is Days Sales Outstanding (DSO) at the SUPPLIERS – Nvidia and the equipment makers – not the buyers. It isn't printed in the release; you take accounts receivable, divide by revenue, and multiply by the days in the quarter. When a supplier's receivables grow faster than its sales, it is financing its customers whether anybody calls it that or not. That is precisely what Lucent's balance sheet looked like in 1999. Alongside it, the commitments that never touch the balance sheet (as discussed above) aren't hidden either......they're in the footnotes, they're getting bigger, and they get restated every quarter and investors will want to read and track those closely.
- CapEx and (more importantly) where the money for it comes from: The headline spending number gets all the attention, but the funding mix is what matters. The debt-funded share of hyperscaler capital spending went from 9% in fiscal 2024 to 32% by the middle of this year, and only one of the four is still free-cash-flow positive over the last 12 months. Paying for growth with borrowed money instead of cash flow is a late-cycle symptom (telecom did the same thing in the late 90s.) More importantly, if the guidance ever gets CUT, that's the part that should worry all of us as it would mean the returns aren't showing up fast enough to justify the investment.
- The credit market, not the stock market: The cost of insuring Nvidia’s debt stayed near its record highs even AFTER it signed a smaller, better-structured deal. Oracle has been on my list since S&P cut it to one notch above junk. I want spreads, not yields (a yield can fall because the Fed cut rates and tell you nothing about credit.) We also need to watch the ancillary exposure: data-center-backed bonds and overall high yield bonds, which has been our single best early-warning signal for as long as SEM's been around. I've said for years that the bond market is smarter than the stock market, and the reason is simple. The stock market wants the price to go higher. The bond market wants its money back.
What would change my mind in the GOOD direction?
- AI spending broadening out below the hyperscalers
- Adopters (not vendors) showing margin expansion in their filings
- Backlog actually converting into recognized revenue.
- Productivity holding above roughly 2% a year (or increasing)
If those show up, the financing questions above mostly take care of themselves, and this ends the way the electric grid did rather than the way the broadband buildout did.
All of the negatives I brought up here do not make me "bearish" on the market or the technology. We have systems that will flip the switch when necessary and those systems don't ask my opinion. Our high yield model has gone back and forth from cash to high yield and back several times since ChatGPT launched at the end of 2022. That's what being early looks like, and we'll take it because historically speaking when the market breaks the high yield bond market is the first one to warn us.
We won't always be right. We may be a bit early or a bit late. The point is that the decision gets made by an unemotional SYSTEM instead of by how I (or anyone else at SEM) feel about what is most likely going to be a wild, exciting, and occasionally frightful ride.
As always, we will be here reporting on what we see and how we're adjusting our positioning.
Updates
Everything above was as of September 1, 2026. This section is where I add what's changed since then
The Supplier Becomes the Competitor
September 9, 2026
I published this eight days ago and the diagram already moved. On September 2 Nvidia signed an agreement to buy Hugging Face (for approximately $11.9 billion in cash to shareholders plus up to another billion in stock to keep the employees around according to the 8-K). It's expected to close sometime in the first half of 2027, assuming the regulators go along.
Most of us probably first heard of Hugging Face after they announced they were hacked by agents from OpenAI (Dustin wrote about that here). Hugging Face doesn't build the big "frontier" models the way OpenAI and Anthropic do. Instead it's the place where the FREE ones get handed out (roughly 3 million models sitting on a shelf that something like 18 million developers pull from.) Nvidia didn't buy a competing product, but they did buy the store.
This is where it all gets complicated. We'd mentioned OpenAI announcing their own chip to compete with Nvidia shortly after Nvidia promised to back OpenAI's loan for the Ohio Data Center. Now Nvidia is going to be able to distribute non-OpenAI models to its customers. Everything in the "when your customer becomes your competitor" section above was about OpenAI, Google, Amazon and Meta walking down the stack into chips, which is Nvidia's floor. This one is Nvidia walking UP into theirs.
Anybody who has watched Nvidia for a while should recognize the play, because it's the same one that built their moat in the first place. Nvidia has given its software away since 2006.....free to anybody who buys the expensive chips, and the software is the reason customers can't leave, not the silicon. Buying the place developers go to get their models is the same move, just a much bigger scale.
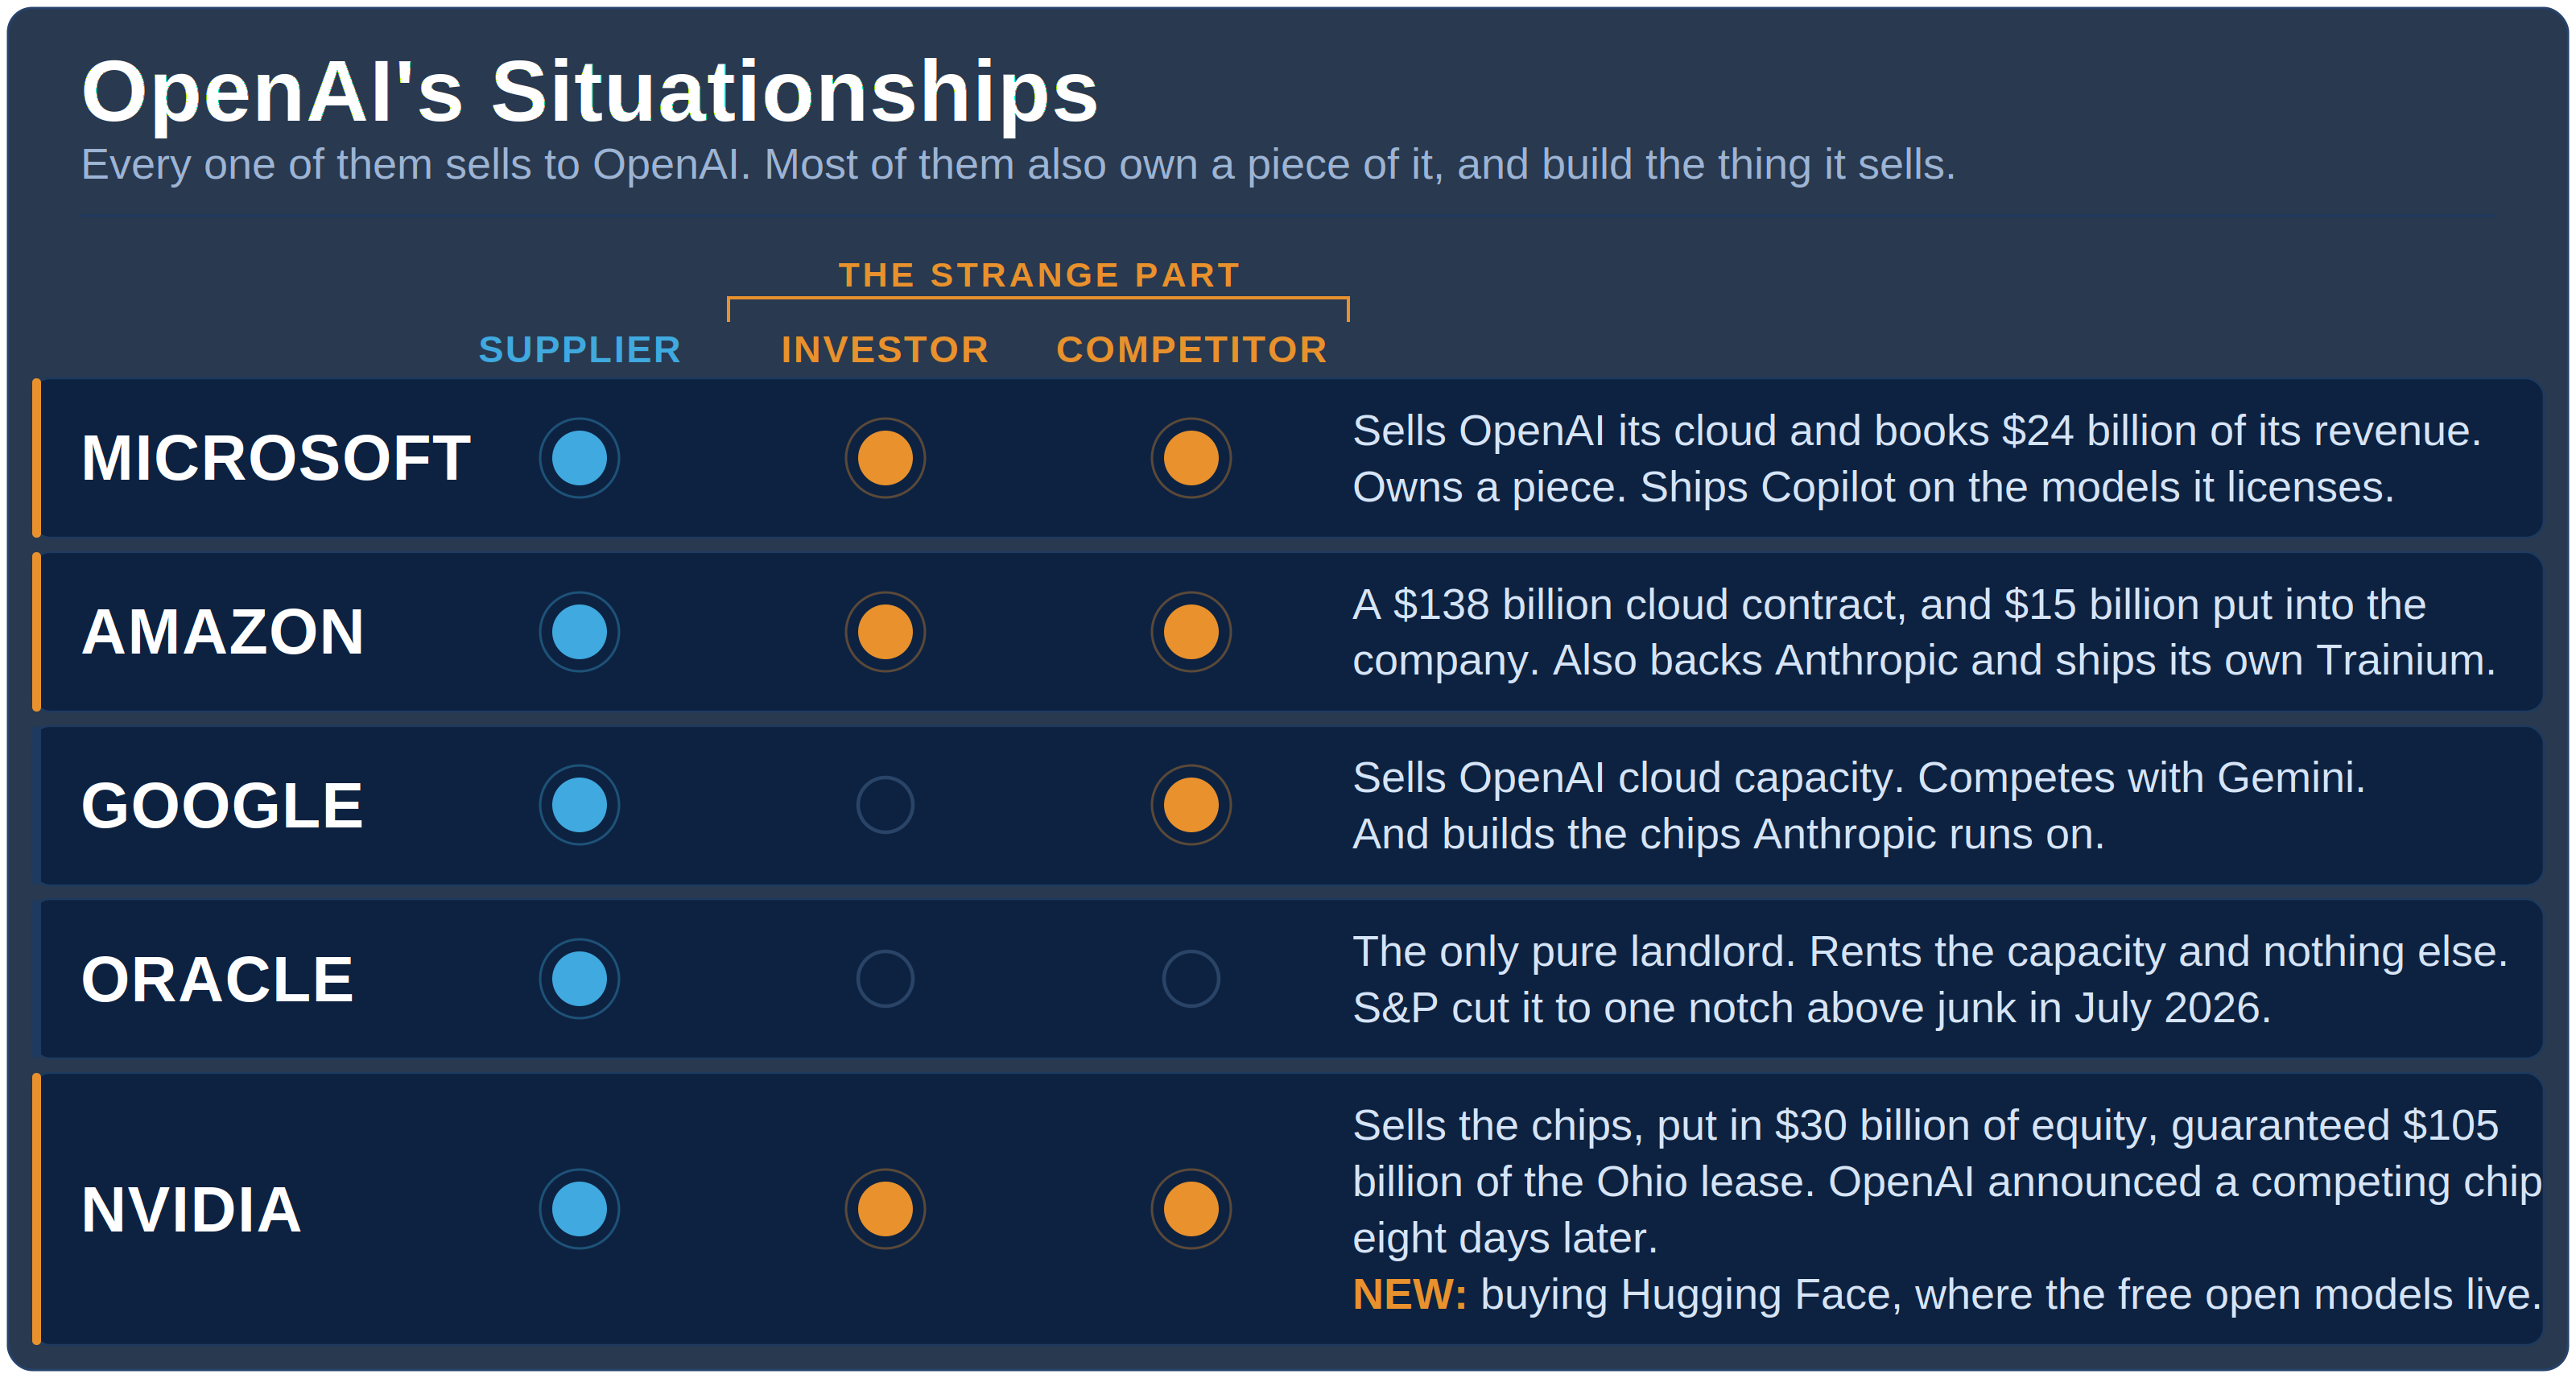
(Side note: once an accountant, always an accountant.........so here's the part I'll be watching. Nearly $13 billion for a company generating maybe $150 million of revenue (it's private, so that's an outside estimate) means almost the entire price lands on Nvidia's balance sheet as "goodwill and intangibles" (the accounting enter that reconciles the "value" paid above the "book value"). That doesn't touch earnings now, it touches them all at once, later, if it doesn't work out. That's now the third thing on my list for that balance sheet, after the receivables and the guarantees I wrote about above. I will point out they're at least paying CASH. In 1999 this deal gets done with stock, so that difference matters.)
On the positive side, Hugging Face's CEO went to Jensen Huang, not the other way around, and Nvidia wrote into the filing that the platform stays open and keeps supporting other companies' chips. More importantly, if this makes good models free and cheap to run, that's two items off my own "what would change my mind in the GOOD direction" list at the end of this post – AI spending broadening out below the hyperscalers, and the ADOPTERS rather than the vendors showing margin improvement. A middle-market company doesn't get AI through a $100 million contract, it gets it by pulling a free model off a shelf. So the same deal shows up on both sides of my own scorecard. Stay tuned!
Open AI Launches Astra
September 12, 2026
In the continued "arms race" between Anthropic's Claude and OpenAI's ChatGPT, by all accounts OpenAI just took the lead after they release "Astra" (GPT 6). I decided to give my original prompt for this a shot, since everyone on TikTok was saying they were switching from Claude to ChatGPT. One thing I noted in a past blog was early data showing users were not willing to switch from Claude's "Opus" to the latest and greatest (Fable5) due to the high "token" cost. My personal experience is I'm not doing enough with Claude to use Fable5 after I saw it burn through my session tokens in about 30 minutes (something I'd previously only done in 5 hours with Opus).
I'm not the authority on this as I'm probably not using it correctly, but with my $20/month "Pro" subscription to ChatGPT, Astra used my full session in 12 minutes (asking me to pay for more tokens or wait 5 hours to continue.) In the name of science I added $100 of tokens to keep going. The full research was impressive. I still need to compare it to the original research. I'll share more of that in later updates.
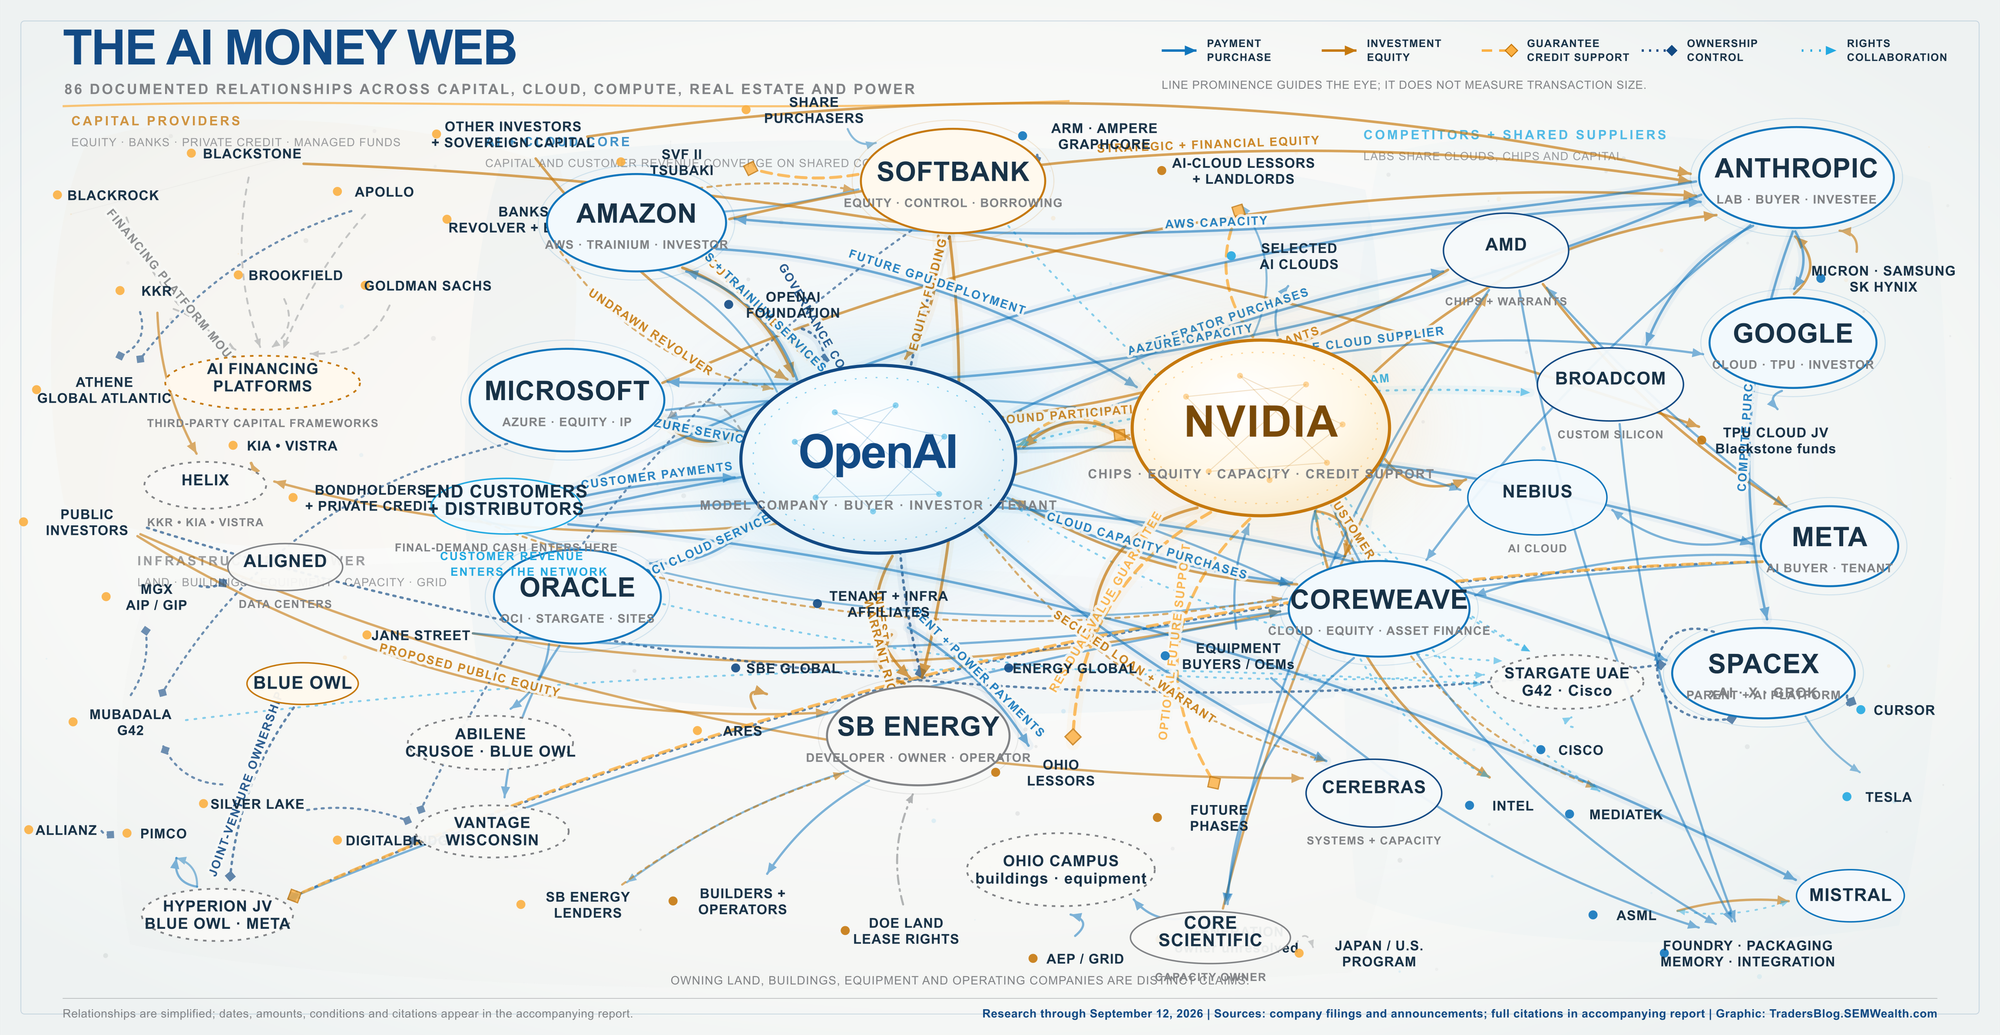
What wasn't impressive was the "phase 2" of the original prompt – the actual diagram to explain the relationships.
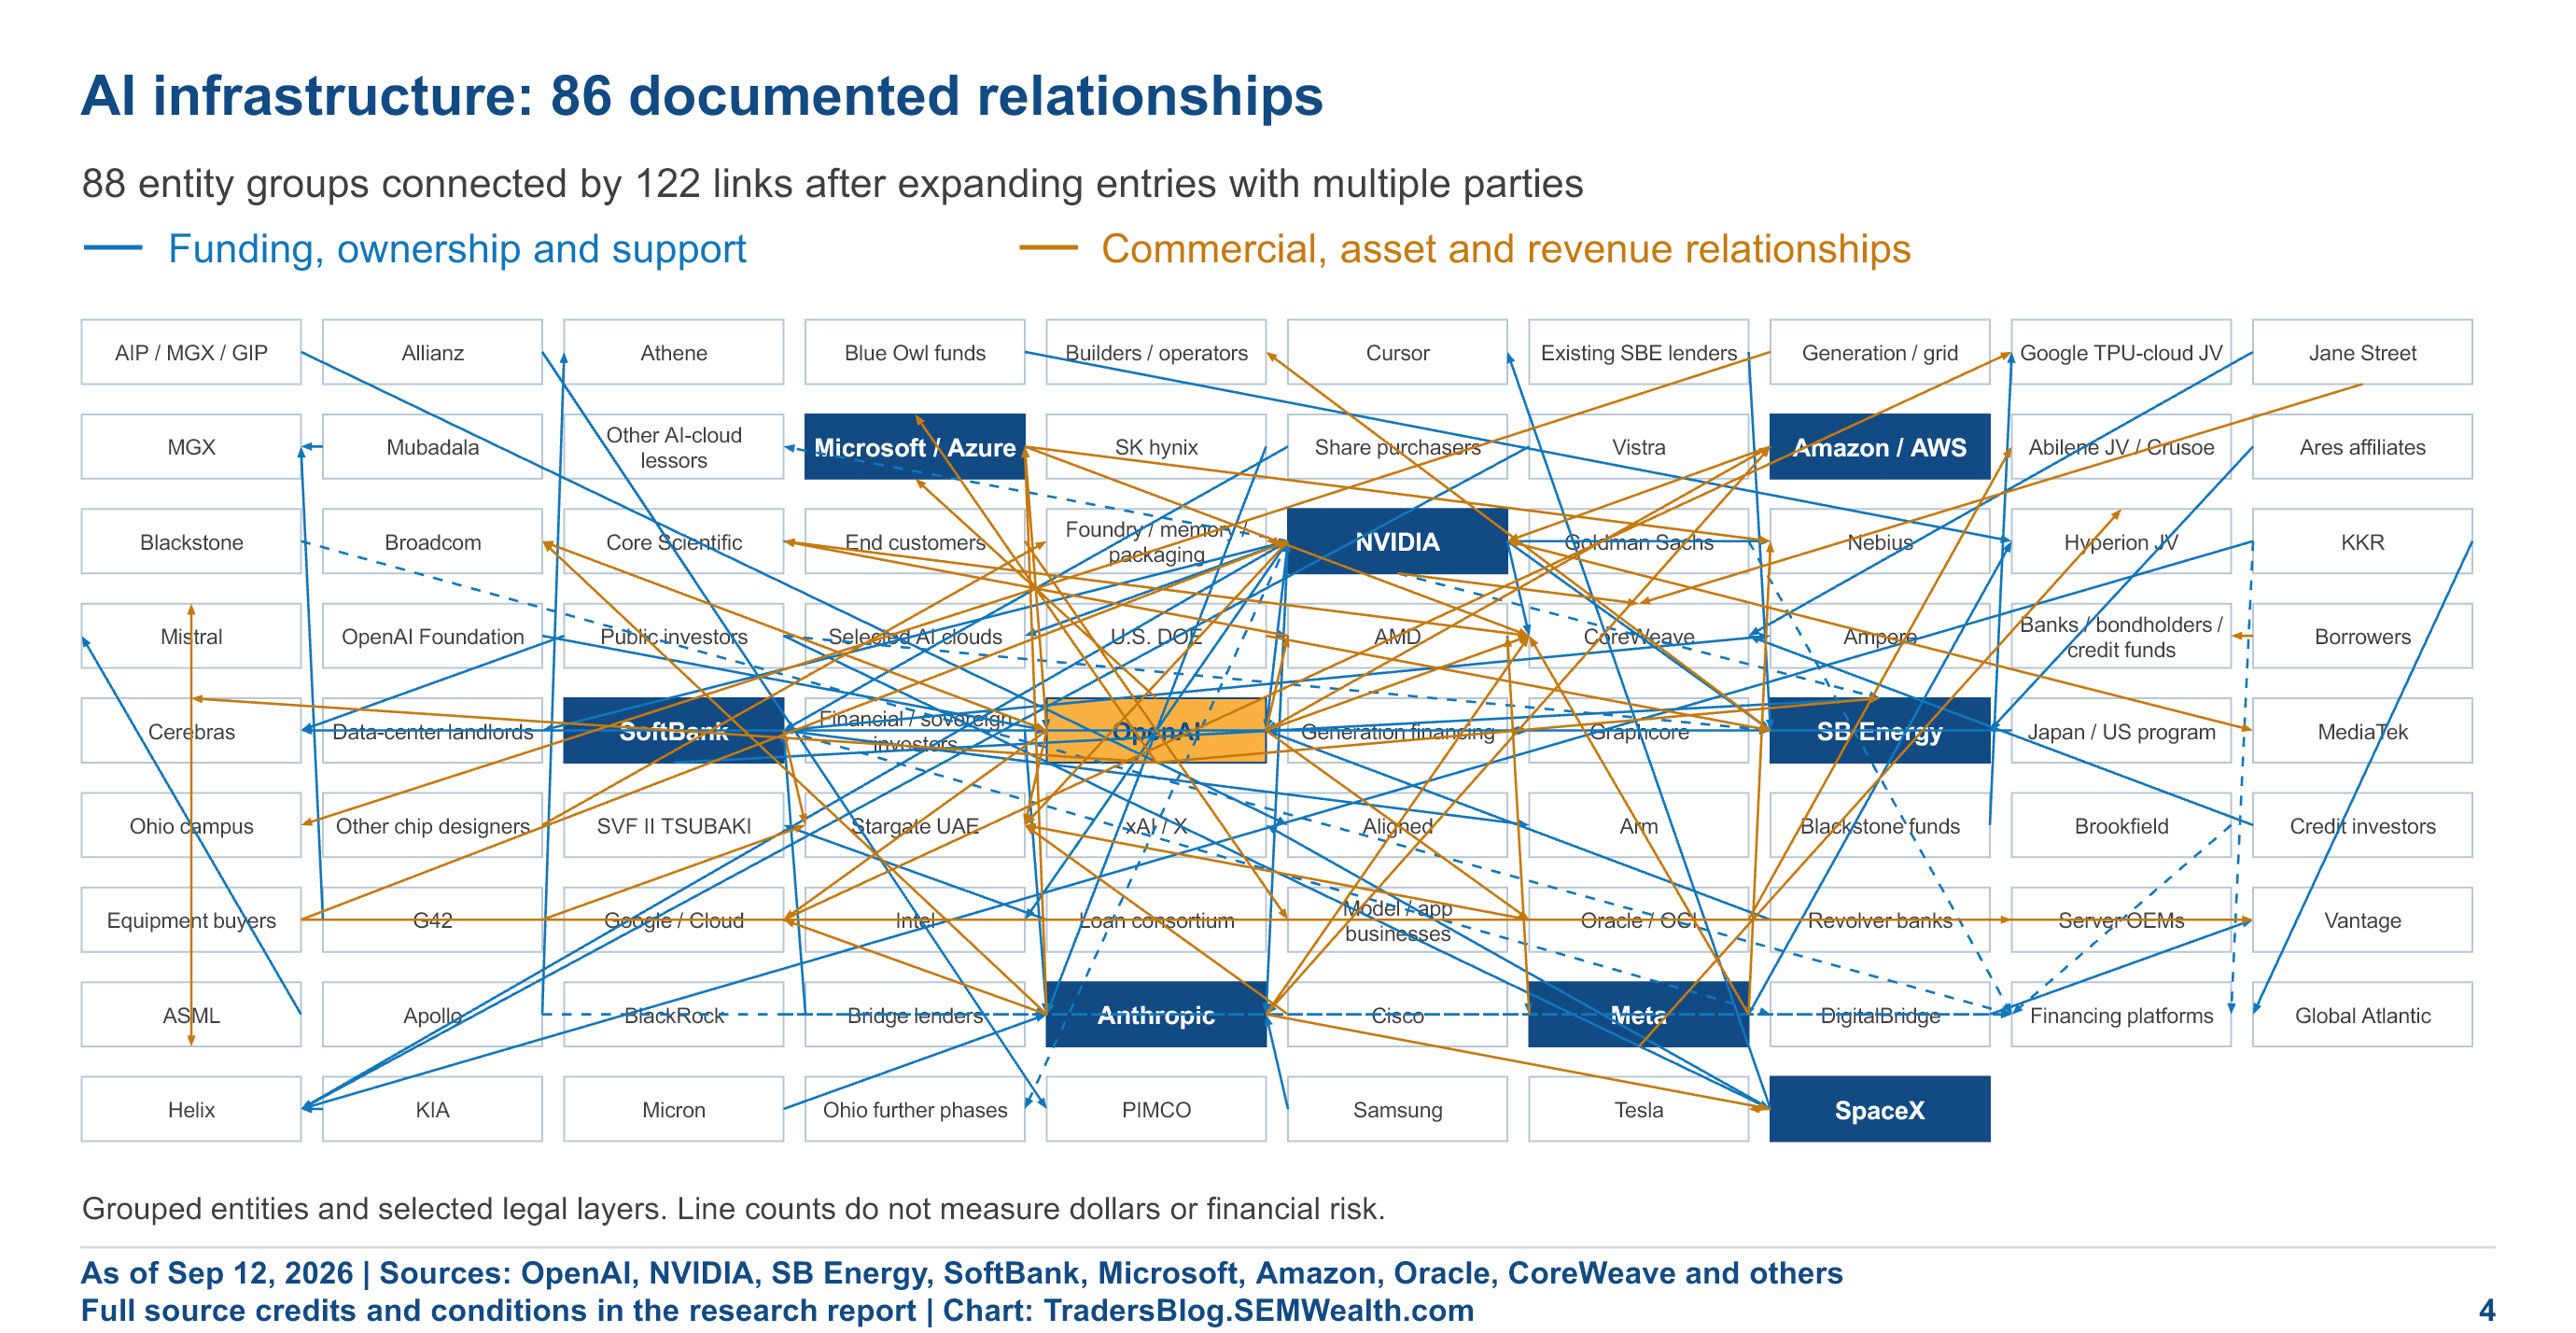
So maybe like Claude, Astra is "too sophisticated" to make images which are visually pleasing. After a few unsuccessful rounds to make it easier to read, I then asked it to write me a prompt to use with GPT 5 to illustrate this.
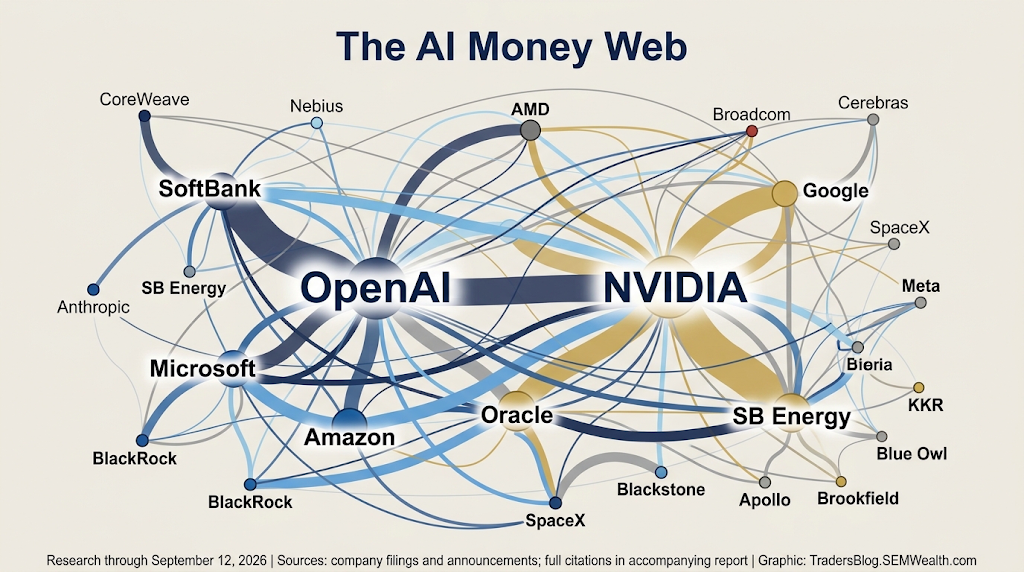
I also fed the same prompt to Gemini just to compare the differences.
Oracle's Act of God Letter
(and what the bond market thinks of it) - October 10, 2026
My first internship was with a CPA firm who in addition to helping farmers file what could be complicated taxes, also helped them hedge for losses (when I first was exposed to risk management). Every farmer understands an "act of God" clause (hail, flood, drought, etc), and every farmer knows the difference between a flood and forgetting to fix the irrigation pump. This is exactly the argument being waged over Oracle's "force majeure" letter.
On September 24, Bloomberg reported that Oracle sent a "force majeure" notice on Project Jupiter, the giant Stargate data center campus going up outside Las Cruces, New Mexico. It's about 2.5 gigawatts (roughly two large nuclear reactors' worth of power) and Oracle is the tenant. Oracle's stock fell about 3.5% that day and Blue Owl's, which owns the developer, fell a bit more.
I don't chase headlines in this post, and most AI news doesn't last a week. This one I'm adding because a signed legal notice doesn't un-happen, and because of what the bond market did around it (and because I've identified Oracle's bonds as a possible first warning of trouble in the buildout.)
What is a force majeure? (the 3rd grade version)
Say you agree to rent your neighbor's new treehouse once it's built. While it's being built you pay a little rent each month. Once it's finished you pay a LOT more. You also promised to bring the extension cord for the lights.
Now the hardware store can't get you an extension cord. So you send your neighbor a note: "If the treehouse isn't ready on time because I couldn't get the cord, that's not my fault, so I'll keep paying the little rent a while longer."
That note is a force majeure notice. It's French for "superior force," and contracts use it for things nobody can control, like floods, fires and wars.
Your neighbor's answer is pretty obvious: "You're the one who promised to bring the cord. I'll see you in court!"
That's the whole argument. Oracle is the renter. Blue Owl (through Stack Infrastructure, the company building the campus) is the neighbor. The extension cord is the natural gas the site needs to make its own electricity, and the pipeline to bring it has been rejected by New Mexico regulators and pushed back to February 2027. The "big rent" is the full lease payment that starts when the campus is supposed to open in 2028. According to Reuters' source, supplying the power is Oracle's job under the contract, and that's why people are arguing about whether a slow pipeline counts as an act of God.
Here's what the letter does NOT do. Oracle can't walk away. The same source says the lease can't be cancelled under any circumstances and Oracle is on the hook for the project's debt costs. Put another way – it buys Oracle time, not a way out.
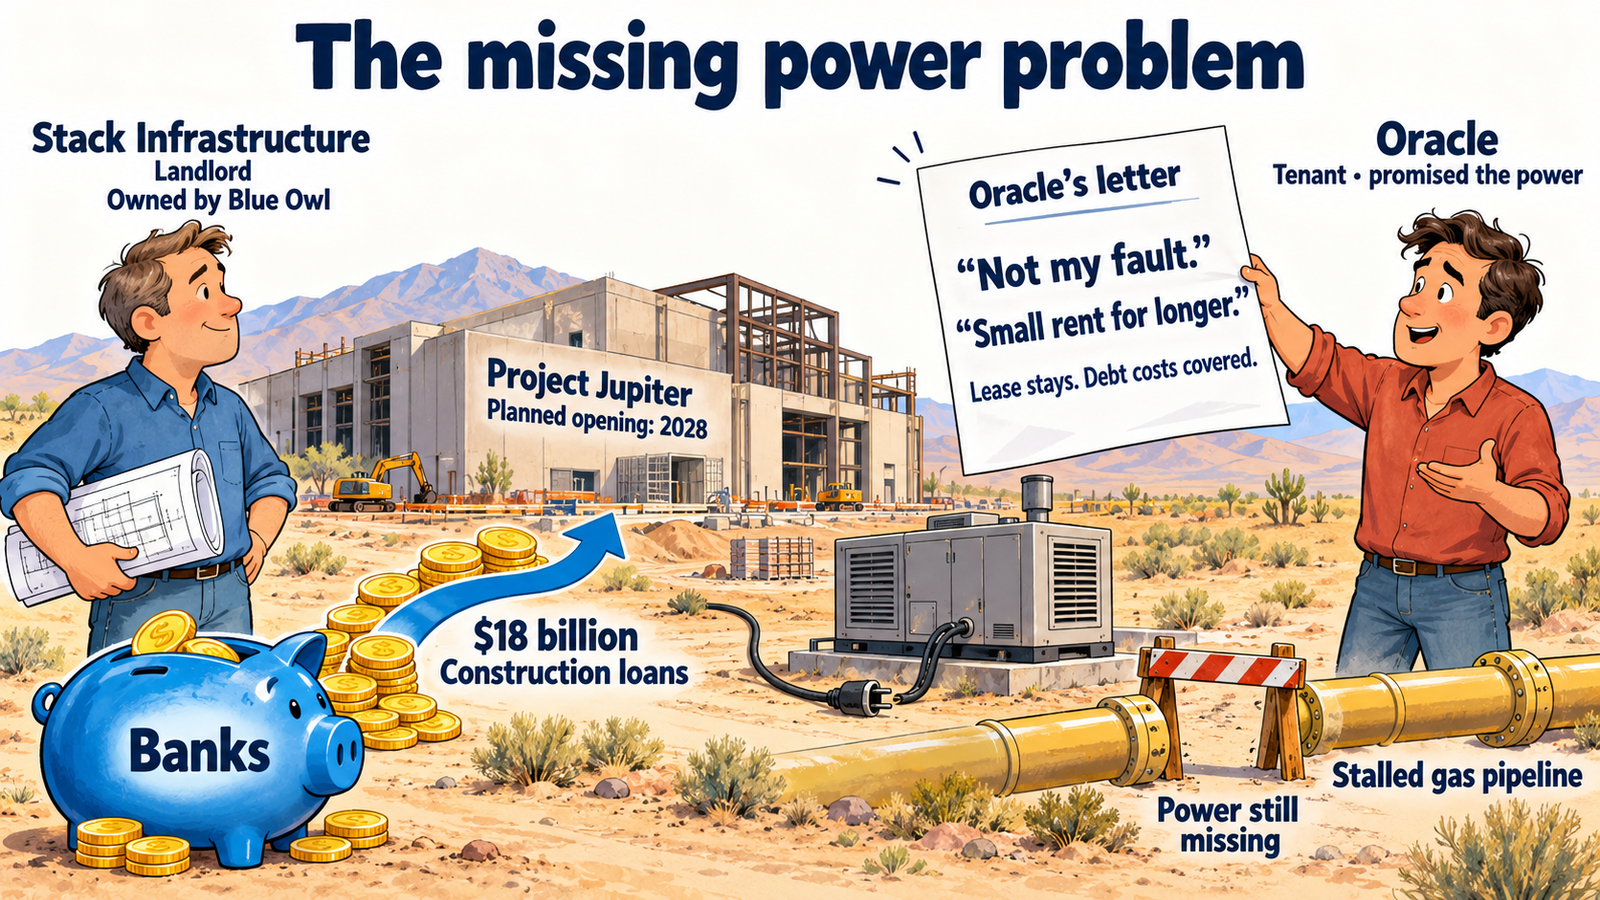
(Side note: this is both the power problem from our AI presentation as well as the public sentiment shift showing up in a contract. I've said all year the thing that slows this buildout down won't be the lack of chips, it'll be electricity, permits and neighbors. Jupiter has all three: a rejected pipeline, an air permit the state has to decide on by November 23, and lawsuits over water.)
What the bond market thinks
Credit spreads are one of my favorite measures of what the market thinks about the risk of a bond. A spread is the extra interest a company pays above what the U.S. Treasury pays to borrow. It's what lenders charge for the chance they don't get their money back.
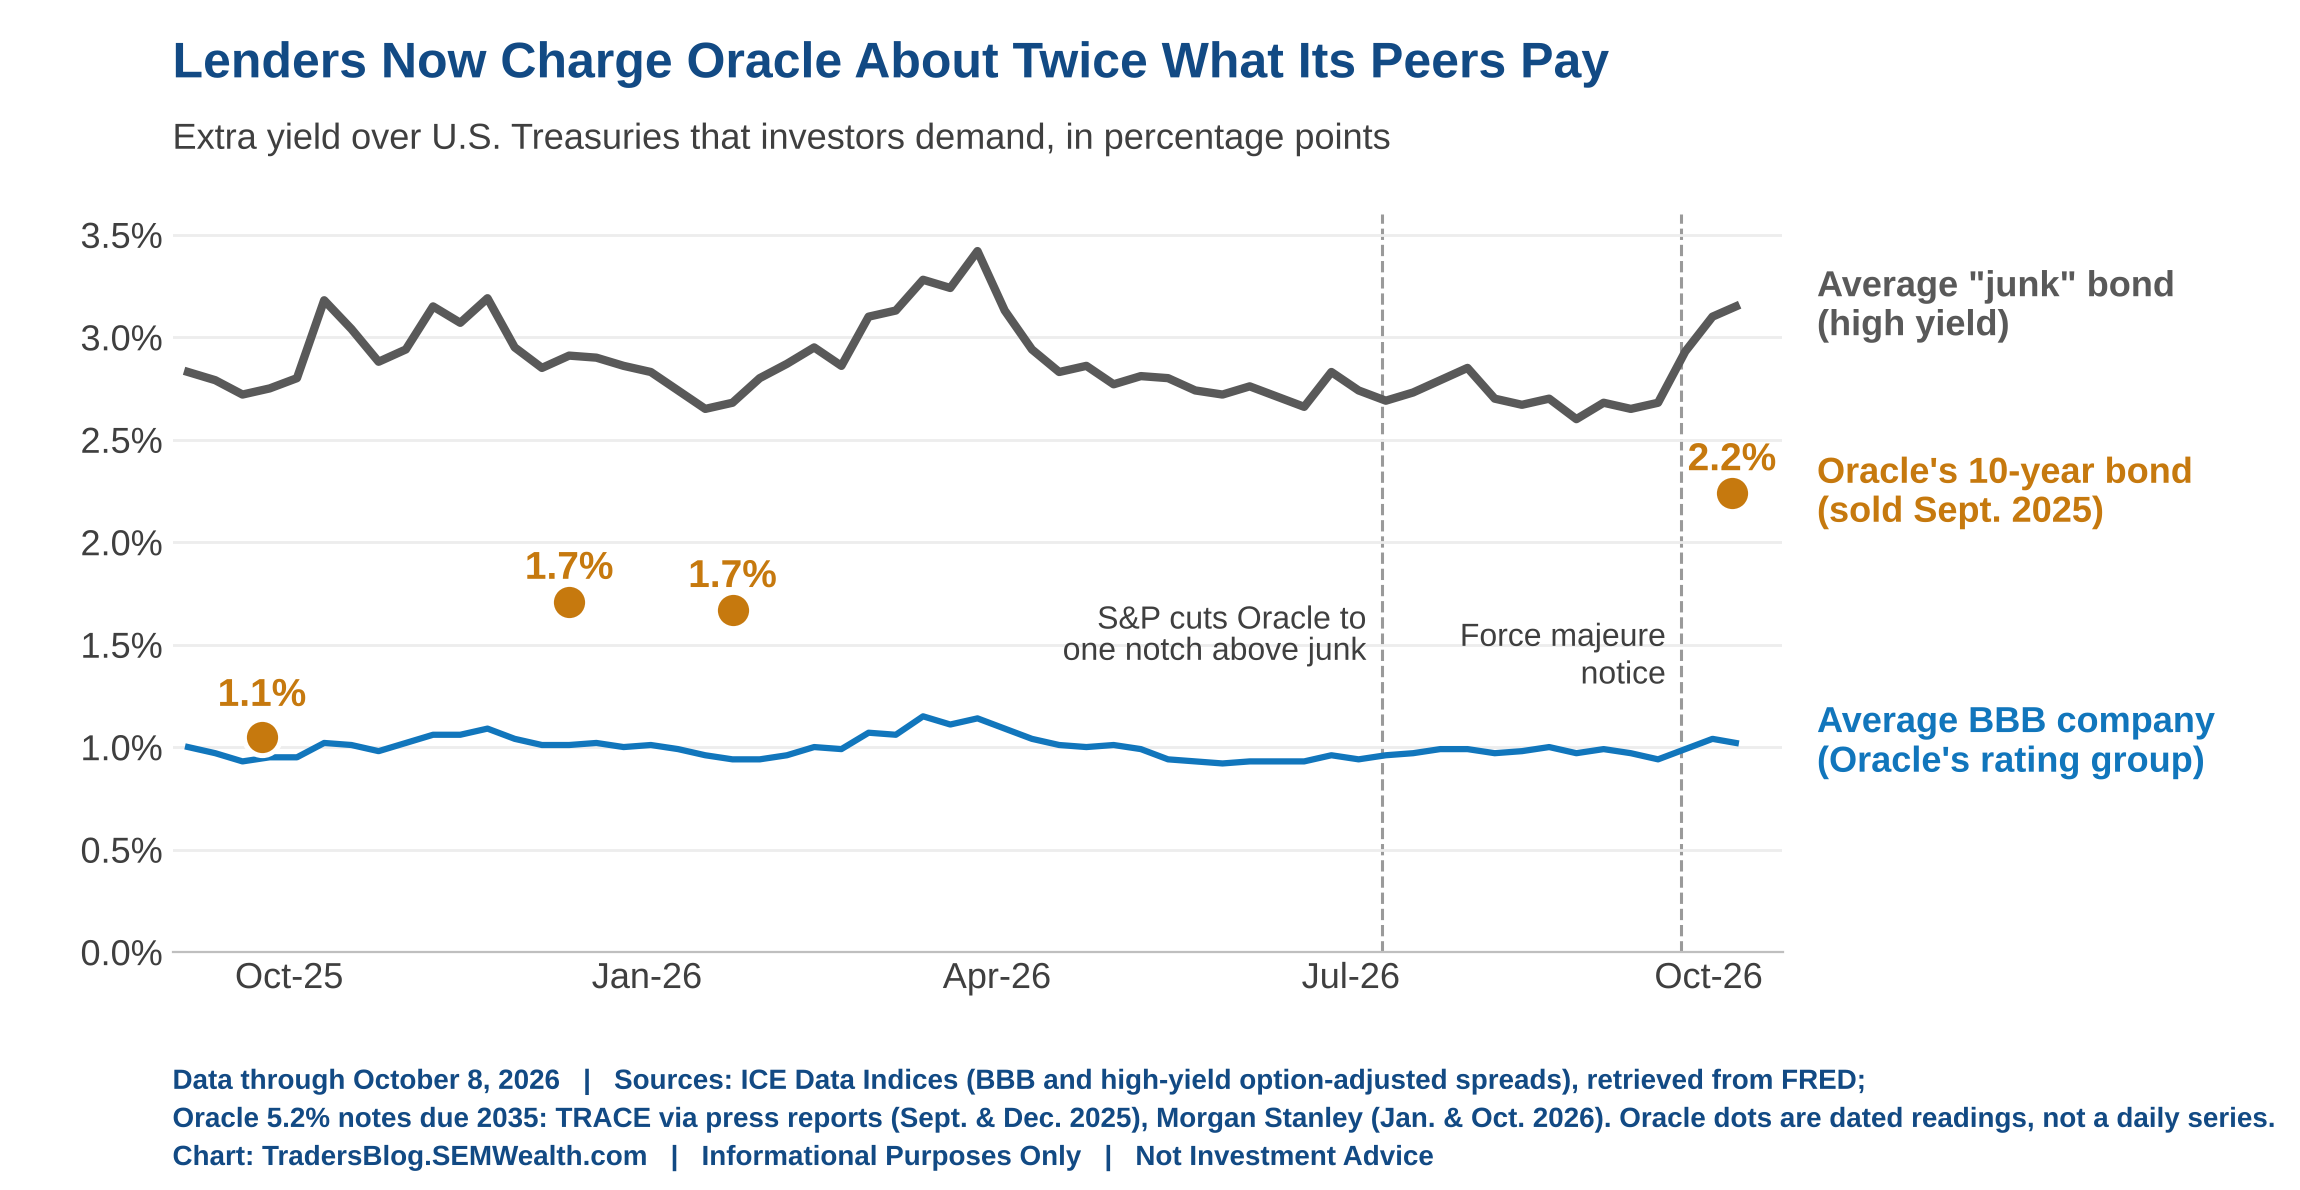
Look at the orange dot on the chart. When Oracle sold this 10-year bond in September 2025, investors asked for about 1% more than Treasuries. That's right in line with every other company with its credit rating (BBB - the lowest rated "investment grade" bonds). Today the market wants about 2.2%. That's more than DOUBLE the average for its rating, and closer to the average "junk" bond than to its own group (BB is the highest rated "junk" or "high yield" bond).
It isn't just that one bond raising concerns:
- The construction loans. The banks that lent $18 billion to build Jupiter tried to sell those loans to other investors and couldn't. The FT reported they were being quoted around 90 cents on the dollar a week before the letter went out.
- The insurance. A Credit Default Swap is an insurance policy against a company not paying its debt. A year ago it cost about $6,000 a year to insure $1 million of Oracle's debt. Morgan Stanley put it around $26,000 last week. (Correction: In the original post I wrote that the cost of insuring Nvidia’s debt hit a record two days after the smaller deal was signed. That was too strong. The numbers I was comparing came from different data providers measuring it different ways, and they don’t show a new record. What they do show is the cost stayed near its highs after the deal got smaller, which was my point (the bond market didn’t relax). I’ve fixed the sentence above.)
- Their overall rating. S&P cut Oracle in July to BBB-, one notch above junk. Moody's is one notch higher with a negative outlook.
Now look at the other two lines on the chart. The average company with Oracle's rating is paying about what it paid a year ago, and as I wrote on October 5, corporate bond spreads overall are still near historic lows. Bond traders aren't worried about everybody. They're worried about Oracle. As I've said many times before, the stock market wants the price to go higher, the bond market wants its money back.
(Side note 2: two weeks after the letter, the Wall Street Journal reported Oracle is talking to Apollo and Goldman Sachs about buying chips through a separate company and leasing them, which keeps the borrowing off Oracle's own balance sheet. That's the off-balance-sheet theme from earlier in this post. Morgan Stanley's view is the rating agencies will count it as debt anyway.)
Before we get overly concerned...
Oracle says Jupiter "remains on our planned schedule," and its spokesman says force majeure notices are common in big projects and don't mean a delay by themselves. Blue Owl says the notice "does not change the financial commitments." Jupiter wasn't going to be producing revenue this year anyway, so this wasn't in anyone's budgets. Oracle is still investment grade, still paying every bill, and still sitting on a backlog of more than $600 billion in signed contracts. A 2.2% spread is a warning, not a default.
On our July advisor calls I said an Oracle default is when I'd go to cash in stocks (subjectively – as a trade – not investment advice). We are NOT there, and nothing in this update says we're close. What would move it from "warning" to "worry" is a second downgrade to junk. Roughly $120 billion of Oracle bonds sit in the investment-grade indexes, and a junk rating forces a lot of those holders to sell whether they want to or not (including annuity companies which includes Apollo's Athene which are heavy holders of "investment grade" bonds as well as other creative financing vehicles).
What I'm watching from here:
- November 23: New Mexico's deadline to decide on the air permit
- February 2027: the new date for the gas pipeline
- Moody's: whether the negative outlook becomes a downgrade
- The gap on the chart: Oracle versus the average BBB company. If that gap closes, the market is saying the worst is behind it. If Oracle drifts up toward the junk line, I'll be back here.
Appendix: the same prompt, three tools, one month later
As I mentioned at the outset, the tools are changing rapidly. I attempted to re-run the same prompt with updated information and received completely different outputs. I asked the same questions, gave the same instructions, used the same three tools, and got these results.
Read these as exhibits, not as sources. Every one of them contains errors, and I've listed the ones I found underneath each (there could be more I missed). The numbers I could verify against filings are in the body of this piece above. The ones on these images are NOT COMPLETELY CORRECT!
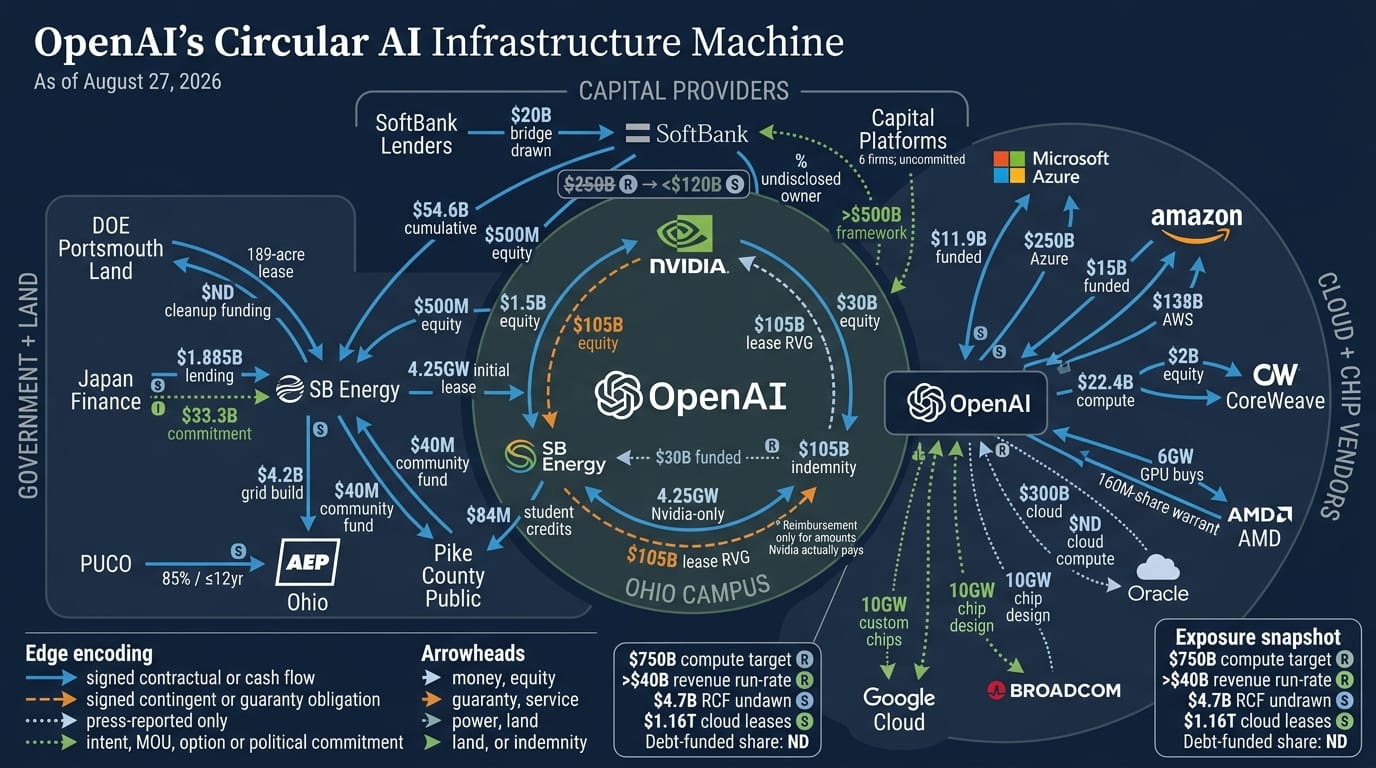
This is the Gemini first option (it was one of those times it gave me two choices). This was (in my opinion) the best-looking of the three. It also lists $1.16 trillion of cloud leases as OpenAI's, prints its own summary box twice, labels the $105 billion guarantee as "equity," hands Broadcom's 10-gigawatt chip program to Google, and shows a $4.7 billion credit facility that doesn't exist – the real one is $4.0 billion. The impressive part was both Gemini outputs took less than 60 seconds.
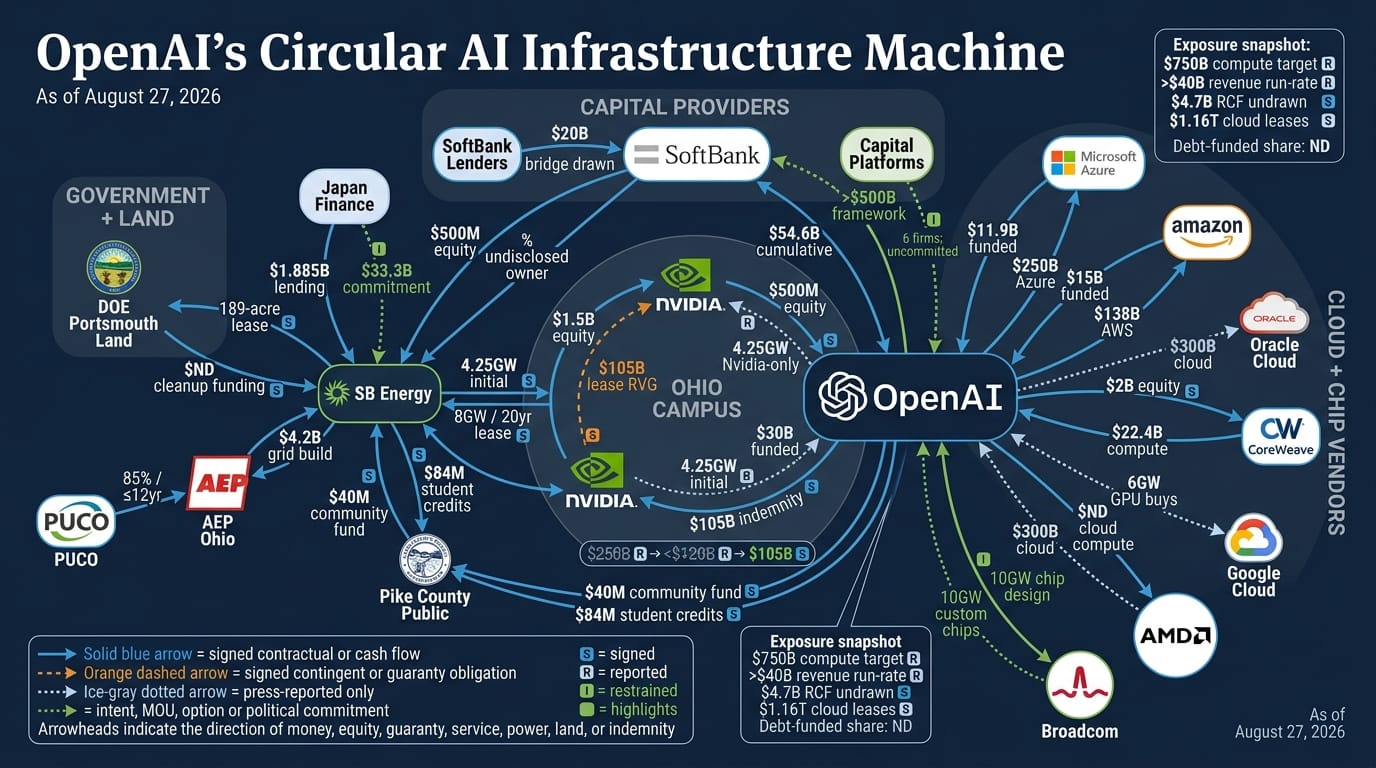
The second Gemini option is above. It had cleaner routing, and it gets the $250B → $120B → $105B trail right, which the first one doesn't. Its legend defines the "intent" category as "restrained," which is not a word that means anything here, it draws Nvidia twice, and lists the date in the upper left and lower right corners. I tried 3 more times to get those small changes done and it got worse and worse.
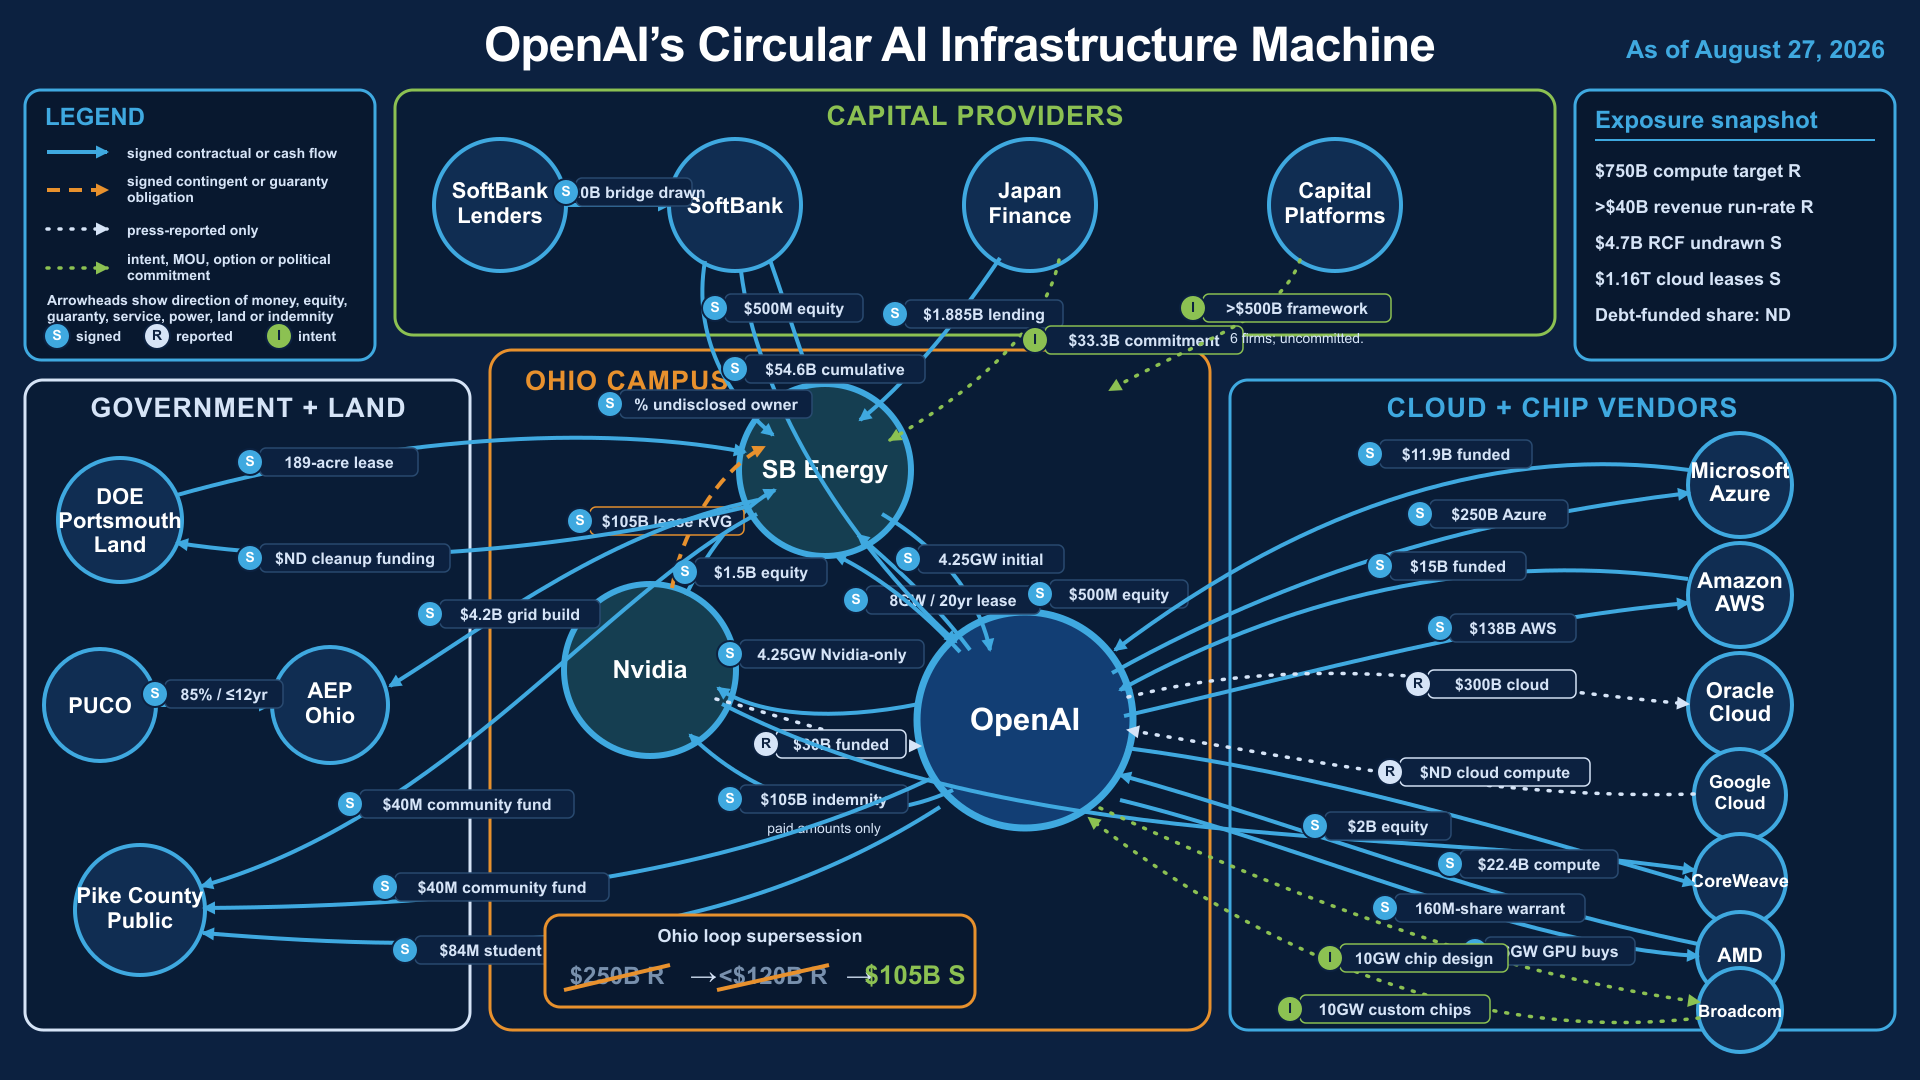
The updated ChatGPT output is above. It took a little over five minutes, and the labels are breaking badly. "$20B bridge drawn" renders as "0B bridge drawn" – the dollar figure is simply gone, and nothing on the page tells you it's missing. Several other labels are truncated or sitting underneath the boxes they belong to. It also could not re-create the image I had used in the original post at the beginning of August even when I gave it the original prompt.
All three also miss the same arrow: OpenAI's own inference chip, pointing back at Nvidia. OpenAI published benchmarks for it on August 25, eight days after Nvidia guaranteed $105 billion of OpenAI's lease. That's the most interesting relationship on the board and not one of the three drew it even though it was in my research notes I provided.
This brings me to the thing that's worth the whole appendix. The prettiest of the three had a number in its summary box that was off by a factor of about 1,500. It listed $1.16 trillion of cloud leases as OpenAI's. That number is correct, however it's the combined not-yet-started lease pipeline of Microsoft, Meta, Oracle, Amazon and Alphabet. It wasn't OpenAI's, but it drafted it as such. OpenAI's own lease liabilities are under $750 million. The machine drew a beautiful picture and put the wrong company's number in the box a reader's eye lands on first. If you rush with these tools, you are likely to use something that isn't fully accurate!
So what's the point? In four weeks the tools got faster, prettier and cheaper. The verification didn't get any easier, and it's still the part nobody can hand off. Humans still need to be involved and those humans most definitely need wisdom, experience, patience, and TIME. This is an arms race and my experience so far tells me you cannot settle on just one tool, you cannot lock in your technique/skills/procedures/prompts because EVERYTHING will change constantly. Most importantly, you cannot blindly trust everything that is coming out of the models, no matter how pretty it looks.
Informational purposes only. Not investment advice. Figures reflect reporting as of August 28, 2026 and are subject to change – which, as this piece argues, they will.