I originally intended to spend most of this week's blog dissecting Nvidia's reported involvement in financing a massive OpenAI data center project and some of the ramifications of what appears to be a new level of complexity in the buildout. The deeper I dug into the story, however, the more it became an example of a broader theme we've discussed repeatedly over the past two years: complexity.
We were then HAMMERED with all kinds of topics which could take up full blogs by themselves. It is after all earnings season. Add to that the new Fed chief's 2nd Fed meeting which left far more questions than answers, fresh economic reports, and more air strikes and attacks on ships in the middle east and it was hard to focus on one topic in a concise manner. A few weeks ago I was lamenting about not having anything to write about. I take that back as this week's blog is an important one, but definitely a long one. As always, I tried to add some visuals and headlines to make it easier to scan.
So buckle up, here's some of my notes and thoughts from last week.
Nvidia Raises "Circularity" Concerns
Last Monday A Wall Street Journal article highlighted just how interconnected the AI economy has become. According to reports, Nvidia is discussing a financing guarantee tied to a massive OpenAI data center project in Ohio. If completed, the arrangement would involve Nvidia, OpenAI, SoftBank, Oracle, U.S. government initiatives, Japanese investment commitments, regional utilities, and potentially hundreds of billions of dollars in infrastructure spending.
I started working on a blog about this specifically as well as working on updating my "AI: Boom, Bubble, or Both" presentation because the circularity I've been discussing since last fall jumped several layers of complexity with this news. The further I dug, the more complicated it became, so I wasn't able to finish it. One of the things I did was task Claude with going out to doing deeper research on some of the inner-workings and "deals" made with the related parties and then having ChatGPT diagram those relationships. This was a scaled down version of what they came up with.
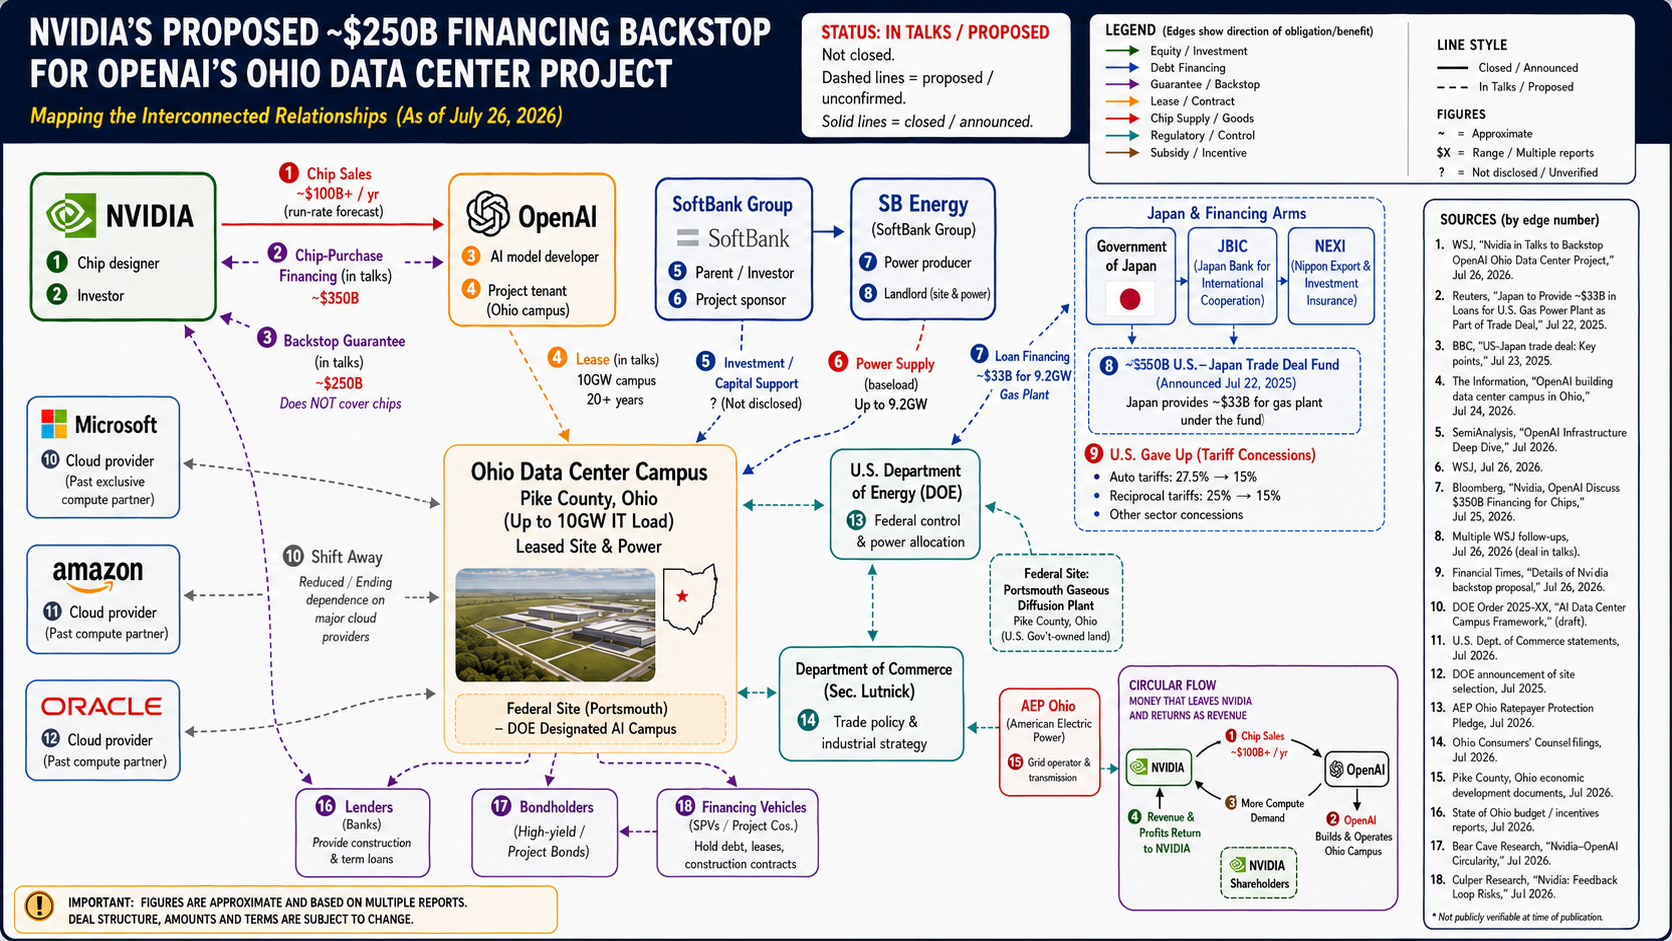
When the AI models have a hard time describing the connectivity of all the players, we know it's getting complicated. On the other hand, the bottleneck in getting the blog finished is the human (me) trying to verify, combine, and make sense in terms our readers can understand.
The market saw the negatives pretty quickly. The most important is Nvidia is going way beyond "vendor financing". They've been selling chips to OpenAI in exchange for shares of OpenAI stock. Now OpenAI wants to build a data center, where they have already placed massive orders for Nvidia chips, but they can't get it financed because they have no credit rating. Nvidia is now reportedly going to back the financing of the project.
The concerns over Nvidia's business are nothing new. Here's an updated chart Bloomberg has been circulating off and on this year.
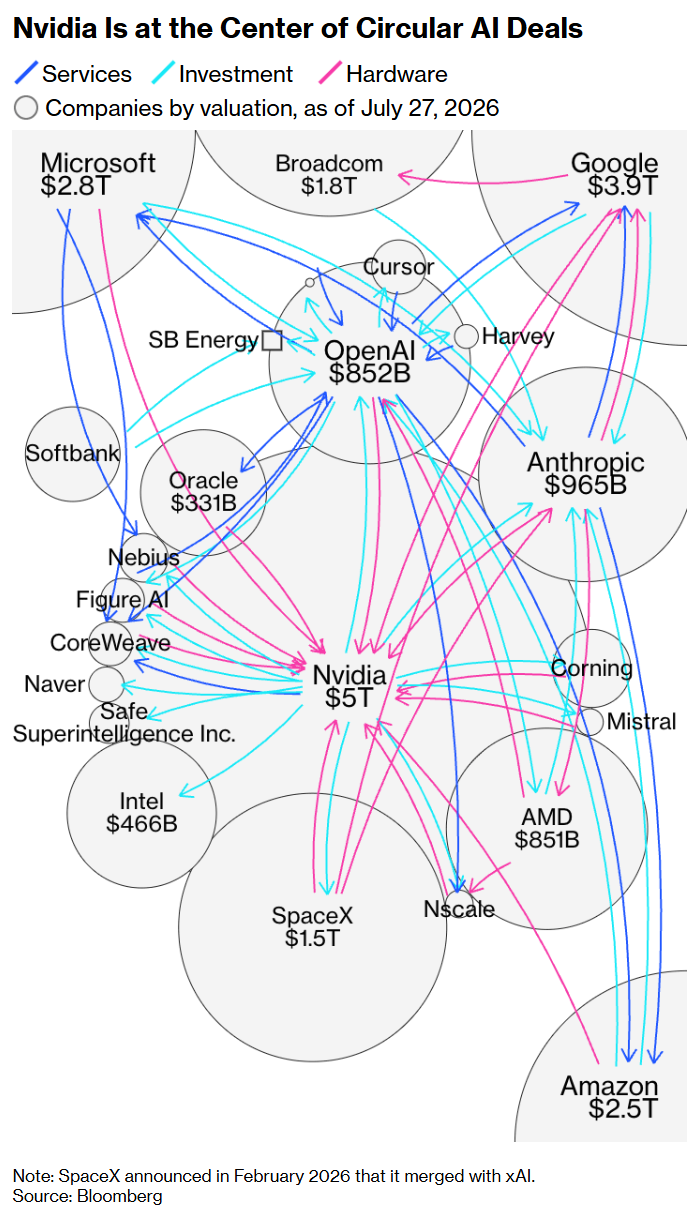
The deal with OpenAI is not final and may fall through, but it is an example of the creativity of Wall Street to continue fueling the boom that has been driving the markets since 2023. It's not necessarily a bad thing (yet), but it is something that certainly rings alarm bells.
The Sensitivity of Expectations
The negativity across the AI-related companies earlier in the week ended quickly after the close on Wednesday, although not all companies won.
The Winners
First, Microsoft's Azure unit, which houses their AI business, grew at a whopping 43% (expectations were for +40% growth) and more importantly increased expected Azure growth next quarter to 45% (from 41%). They confirmed their 2026 Capex targets, although with some announced accounting changes. My accounting shenanigans alarm bells went off when I read about these changes – expanding the depreciation schedule on data centers by 10 years (which lowers expenses) and switching to "operating leases" from "finance leases" (which again lowers expenses). The market didn't seem to care and I didn't have the time to dig into this, but file this one away for future reference.
Microsoft gained 15% the day after earnings.
Amazon also posted impressive results in their AI related business, AWS, which grew by 37%. The confirmed the growth would accelerate next quarter and expanding their capex expectations to $220B for 2026. Free cash flow went negative, but that didn't seem to matter. There also is some circularity concerns happening inside their report. Amazon posted $53B in gains from their stake in Anthropic. Anthropic is also a customer of AWS and purchases billions of dollars each year. the paper value of Anthropic goes up, which gives Amazon a boost from both sides. Again nothing to be concerned about just yet, but something else to file away for future reference.
Amazon was up 15% the day after earnings.
Alphabet (Google) had taken a big hit on their negative free cash flow and big increase in expected capex spending two weeks ago. The back-to-back cloud unit surges from Microsoft and Amazon led analysts to assume Google's cloud business will see similar surges.
Google was up 7% on Friday after those two reports.
Most of the semiconductor names also benefitted on Thursday and Friday as the assumption is if Microsoft, Amazon, and Google are all seeing their AI business demand increasing, this will lead to stronger demand for their products.
The Losers
On Thursday, Meta (Facebook) investors learned the hard way what happens when your stock doesn't hit earnings estimates. Revenue had surged by 28% over the past year, but expenses were up 55%. That led do a big miss on earnings. I've been quite vocal about not understanding what Meta's business plan is supposed to be. They sell advertising on apps they purposely make addicting. Yes they've said they are creating a unit to sell excess data center capacity, but they are over a decade behind Microsoft, Amazon, and Google. They also don't report AI related revenue separately. Even worse, part of their expense footnotes shows they are paying for "third party AI tokens". In other words they've spent hundreds of billions of dollars investing in AI and they cannot tell investors what they are getting from it. Oh by the way, they also increased their expected 2026 capex spending.
Meta lost 9% after their earnings report.
Apple is not considered a hyperscaler because they aren't investing in AI data centers or as far as any of us can tell, AI in general. Of course they are, but they don't report it separately and they most certainly have nothing to offer. Despite having the first "AI" type assistant in Siri, Apple has failed repeatedly in taking advantage of AI inside their infrastructure. Their partnership with OpenAI which added ChatGPT inside the iPhone has been a disaster. The next IOS release is supposed to include a more integrated AI assistant, not one where Siri asks, "Would you like to use ChatGPT for that?". It won't be Apple's own AI, nor will it be ChatGPT. Instead Apple will be using Google's Gemini. The dollar cost is reported to not be "material" for Apple, especially since Google pays Apple over $20B per year to be the default search engine across Apple devices. What is "material" is the fact Apple has no AI strategy.
We learned Thursday evening the other cost Apple is enduring related to AI – component costs. While Apple beat earnings estimates for the quarter, they guided estimates for the rest of the year lower. They had previously reported sharp price increases due to higher component costs, which are specifically tied to the lack of materials due to the AI buildout. It sounds like the increases aren't enough to fully cover Apple's expenses and it is also hitting demand from their end customers.
Apple lost 7% after their earnings report.
Bleeding Cash
Last week I introduced a chart showing the trailing 12 months of Free Cash Flow, which is calculated by summing the Cash Flow from Operations and Cash Flow from Investing Activities. This is a way to see which companies are paying for their business investments and which ones are needing to fund it by selling debt or equity. With Q2 now in the books for all 4 Hyperscalers, we can see only Microsoft is still Free Cash Flow positive.
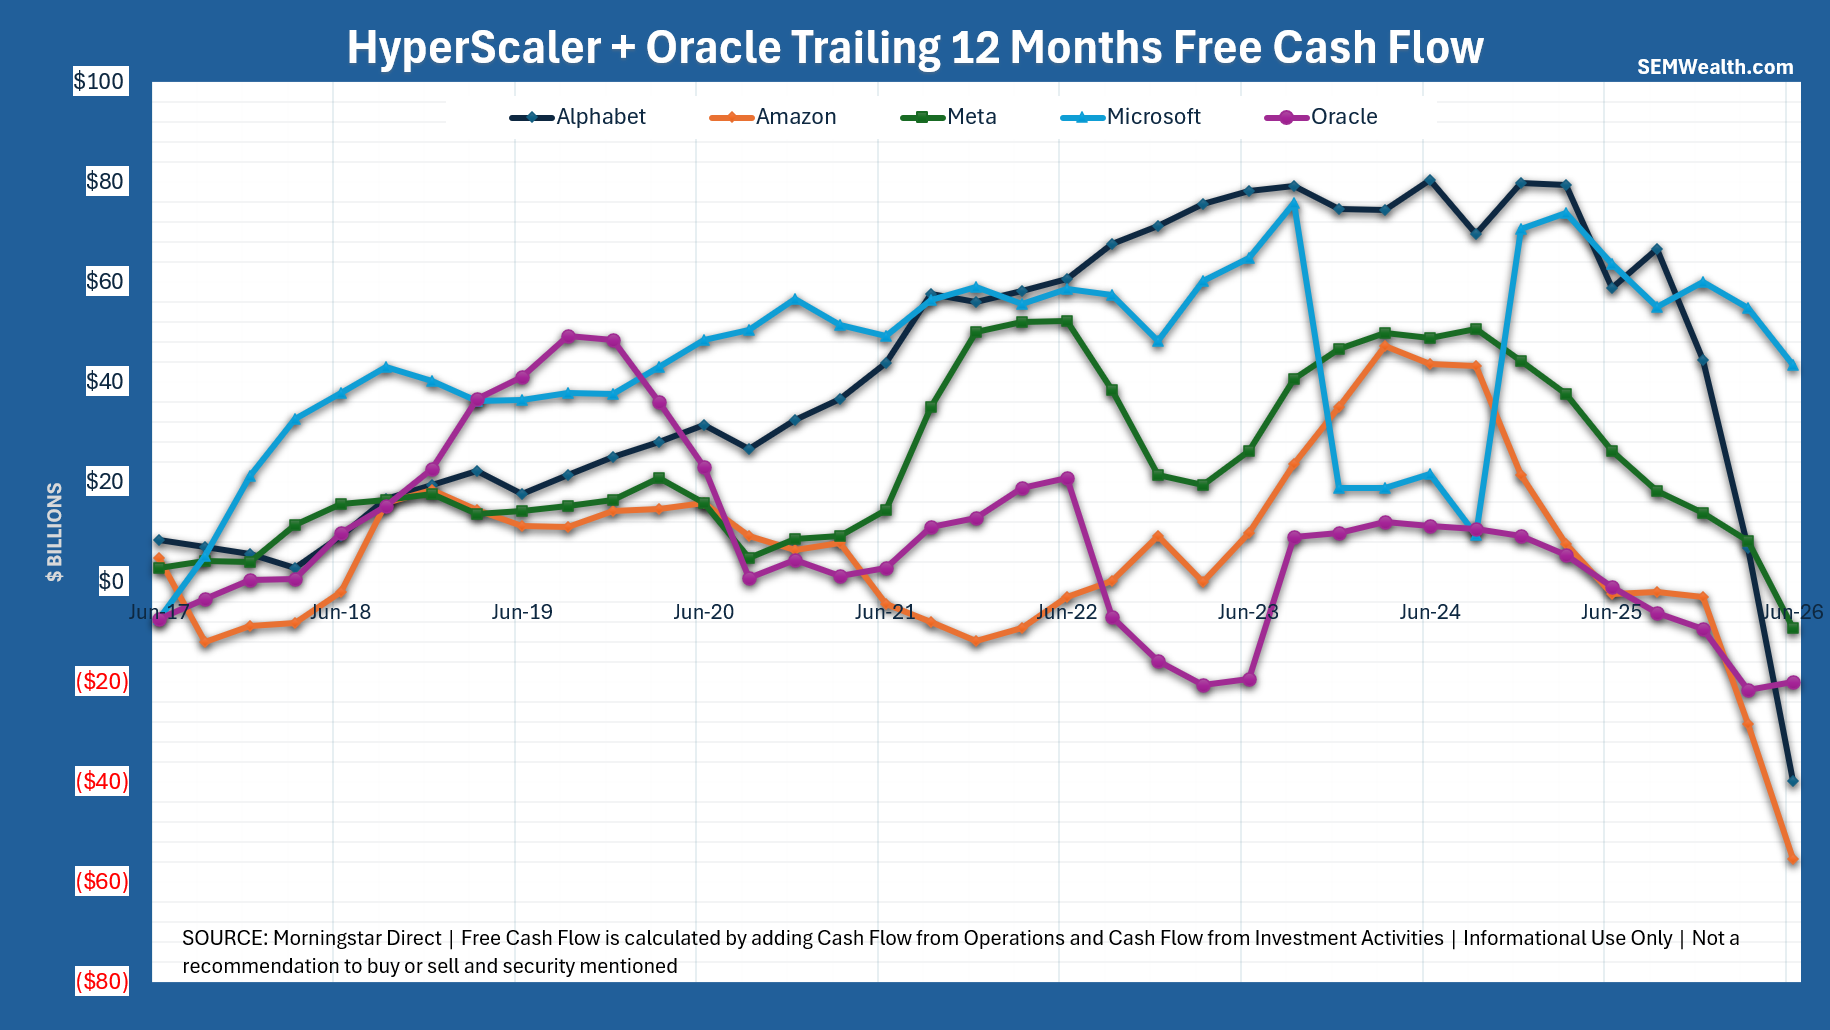
This isn't necessarily a bad thing. The companies still have stellar balance sheets, but as more and more companies demand more and more cash, the cost of the buildout will be going up significantly, which makes the ROI even higher.
What shifted in June?
The S&P 500 and NASDAQ 100, at least for now, peaked on June 2. While the S&P 500 is within a couple percent of its all-time high, the NASDAQ 100 continues to struggle. Of course after a 158% gain since the ChatGPT launch in November 2022, this is nothing to be concerned about.
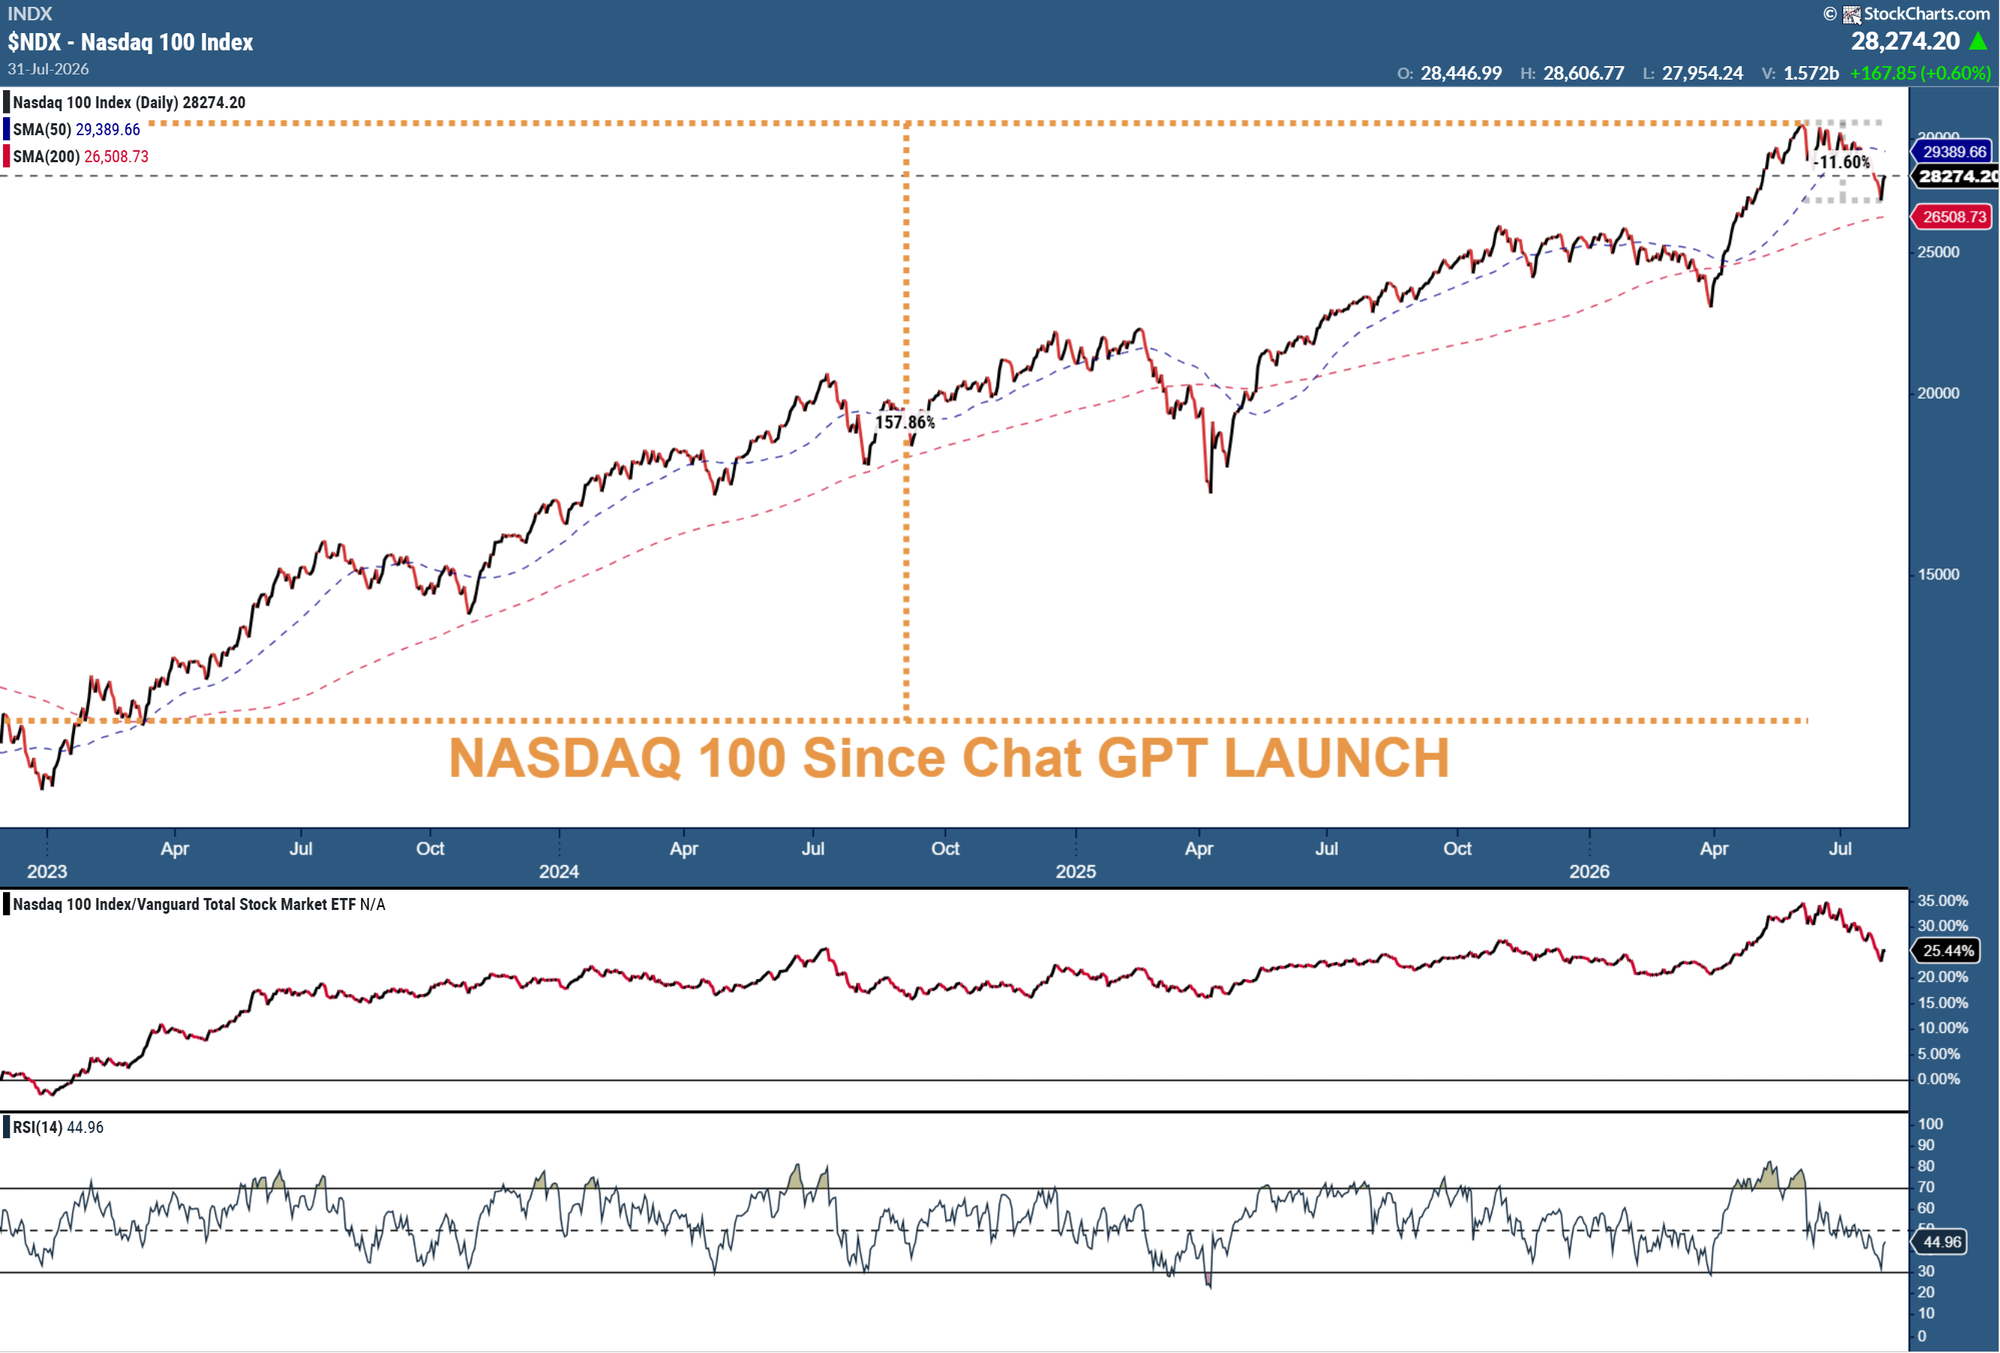
As market analysts, however, we should be aware of what may have happened. If you go back to June 2 & 3, we can see (with hindsight) two announcements, which have set the theme since then.
#1.) Hyperscalers need more money: On June 2, Google announced a plan to sell $80B in stock. Since that time we've seen several hundred billion dollars in new debt and equity being raised to fund the data center buildout.
#2.) You better increase expectations: On June 3, Broadcom beat earnings estimates, but for the first time in a couple of years they did not increase their AI related revenue estimates. Semiconductor stocks were hammered that day and have had a wild ride since then.
Last week's volatility serves as a reminder that we are probably in a different phase of the AI buildout cycle. Whereas throughout 2023-2025 the thought was "everybody wins", we are now starting to see the market punish anybody who is falling behind, while pouring the money they took from the "losers" into the companies that are winning right now.
Looking at the biggest AI related stocks (using the S&P 100 index), we can see the winners and losers being separated. It's hard to call Nvidia a "loser" given their place in the AI infrastructure so far, but we've seen the hyperscalers working to create their own chips, cheaper chips from Korea and China making inroads, and even smaller players chipping away at their market share.
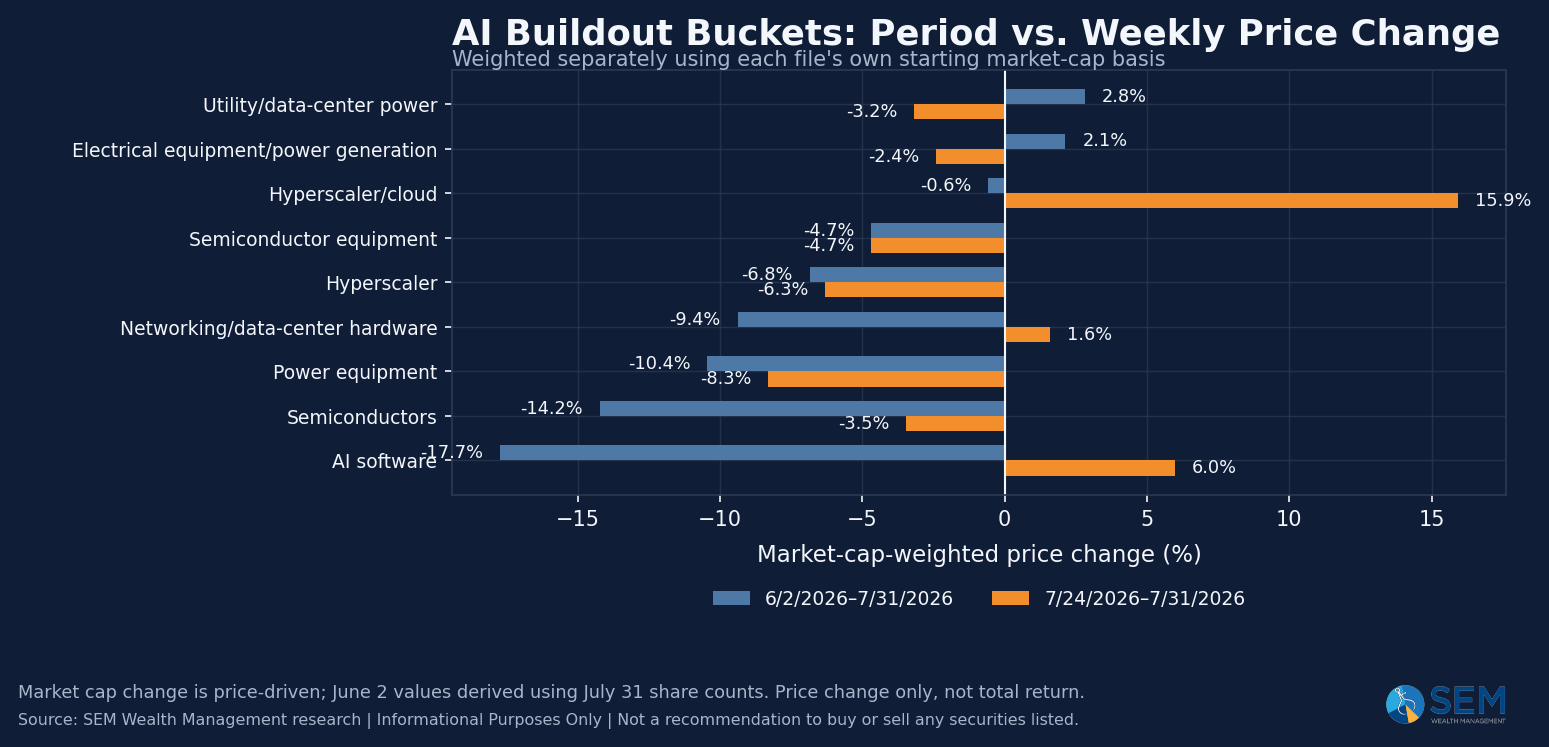
Since June 2, we've seen over $2 Trillion in market cap erased from AI-Linked stocks. Only a handful are winners.
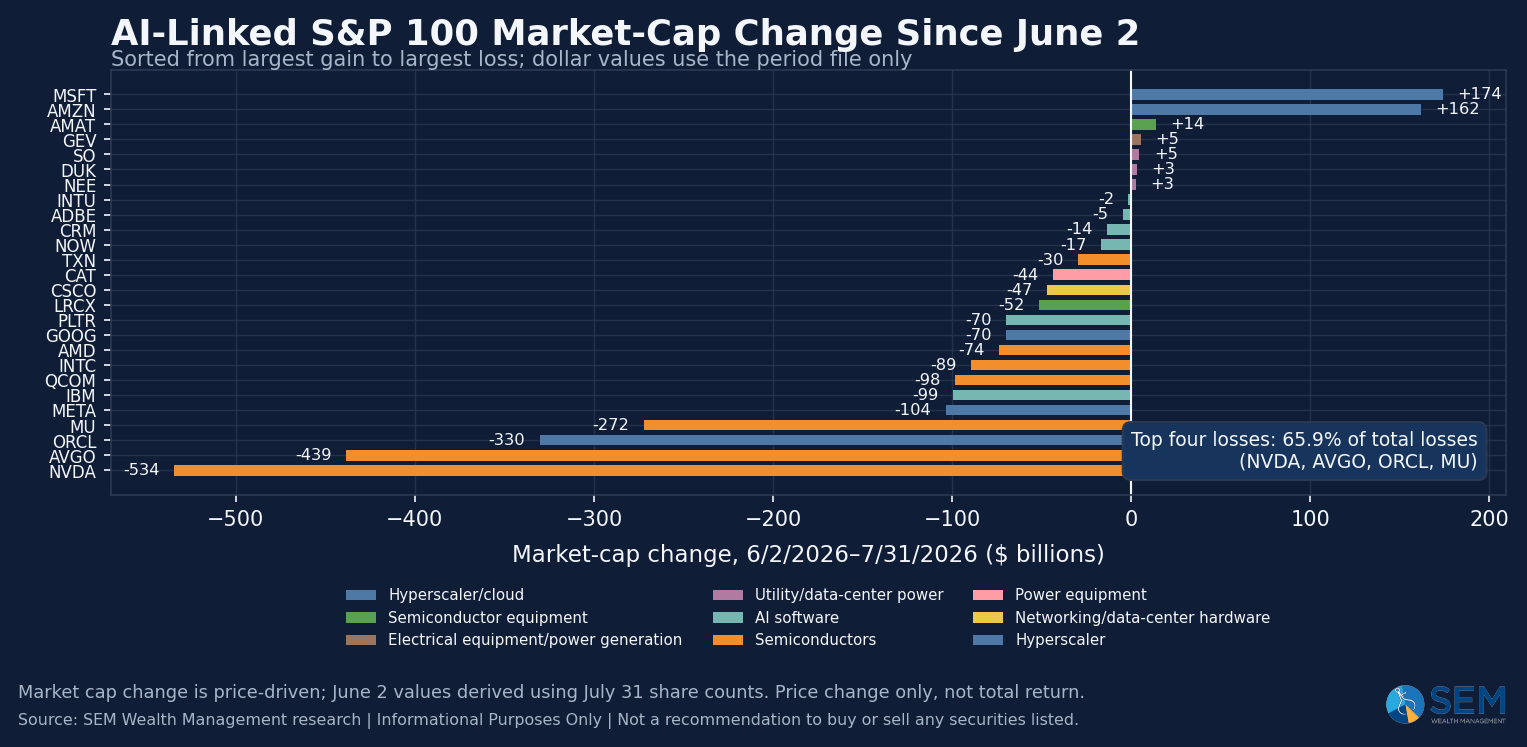
These stocks combined added just over $1 Trillion in market cap last week (erasing 33% of the loss since June 2). Grouping the stocks into the various AI-related sectors, I thought this chart told an interesting story as it shows a shift we may be seeing in the "tone" of the market. The companies helping on the "power" side are still positive since June 2, but they seemed to be a source of selling last week. The huge rally last week nearly pulled the combined hyperscalers positive since early June (even with Meta's losses). AI software companies also rallied last week, but have born the brunt of the selling since early June, along with Semiconductors.
Ok, I've written way more on AI than I intended this week, especially because I still have the "Circularity" blog in the works. Time to get back to our other themes.......
Is the new Fed Chair Really Serious about Inflation?
Fed Chair Kevin Warsh's second Fed meeting and press conference did not go as smooth as he would have hoped. This is most certainly a new "era" in terms of communications, but the reporters asking him questions as well as the bond market seemed frustrated by the fact his words did not back up the Fed's actions.
The most common theme: If inflation is as damaging as you say and isn't moving to your target, why didn't you raise rates?
His answer: The market already has raised rates since our last meeting.
What Mr. Warsh was alluding to is the fact between Fed meetings, short-term rates increased by about 0.10%, but longer-term rates (10, 20, & 30 year) were raised by 0.30%. Following the meeting, the market pushed rates back up to the highs for the past 4 weeks on the long end of the curve and CUT rates a bit on the short end.
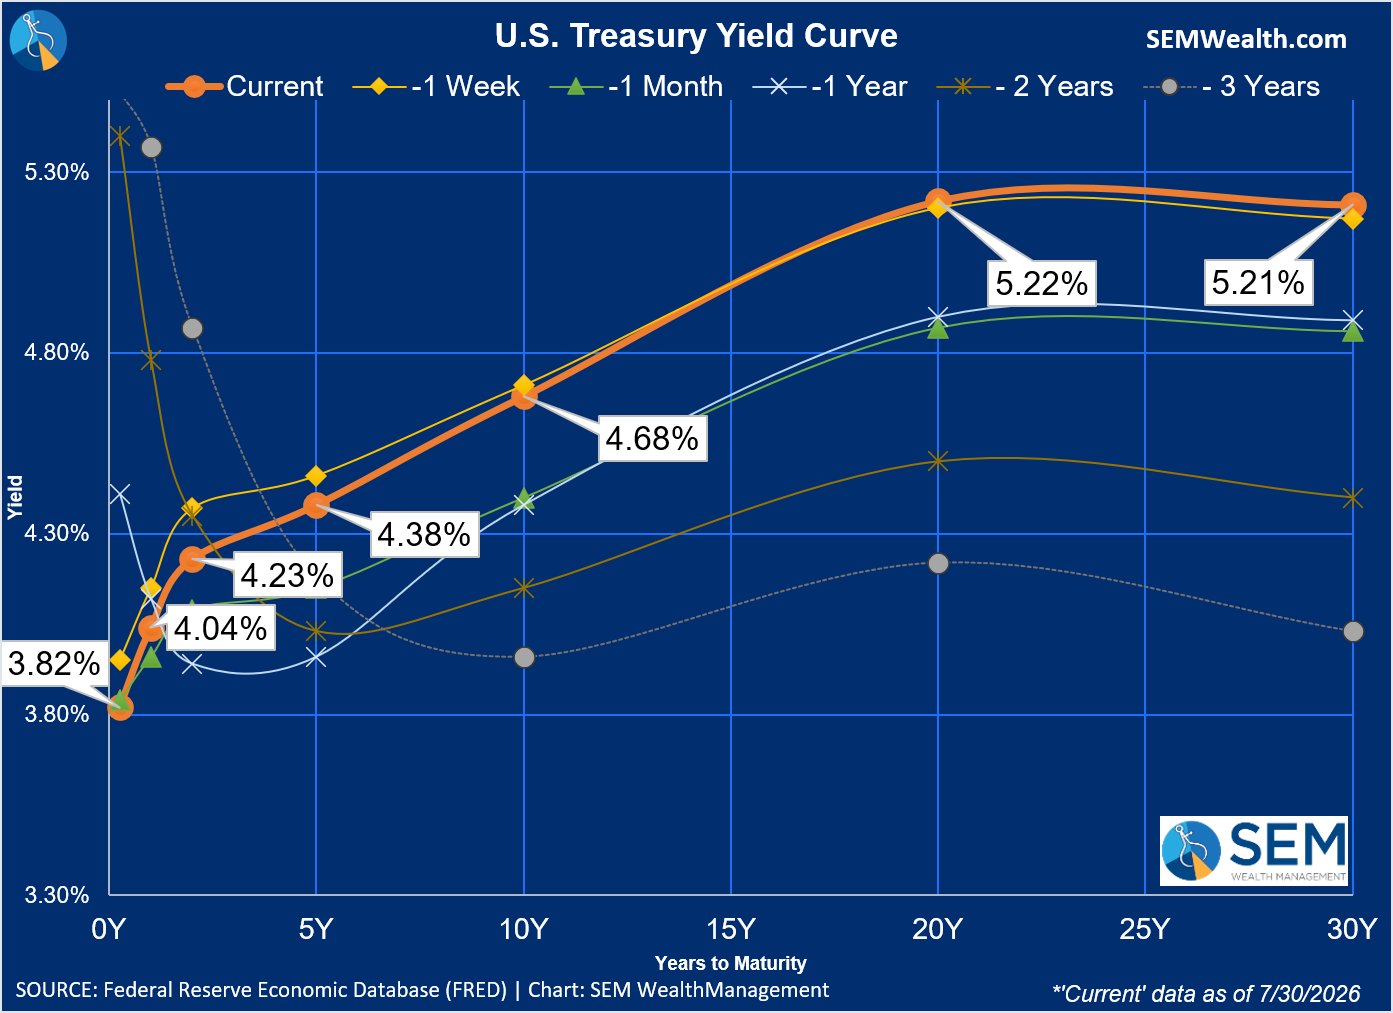
Change is a process and I will continue to give the Fed chair the benefit of the doubt. It can't be easy to change a culture that is embedded in academic theory and a mindset they are all-knowing wizards (despite the evidence inflation has been running above the Fed's "target" for most of the century.....and we've still had two major stock market crashes and recessions.)
We'll have a bunch of Fed speeches coming up now that the meeting is over, so it will be interesting to see despite Mr. Warsh's hope to have less "Fed chatter" moving the markets, if the Fed members seek to clarify whether or not they are serious about inflation.
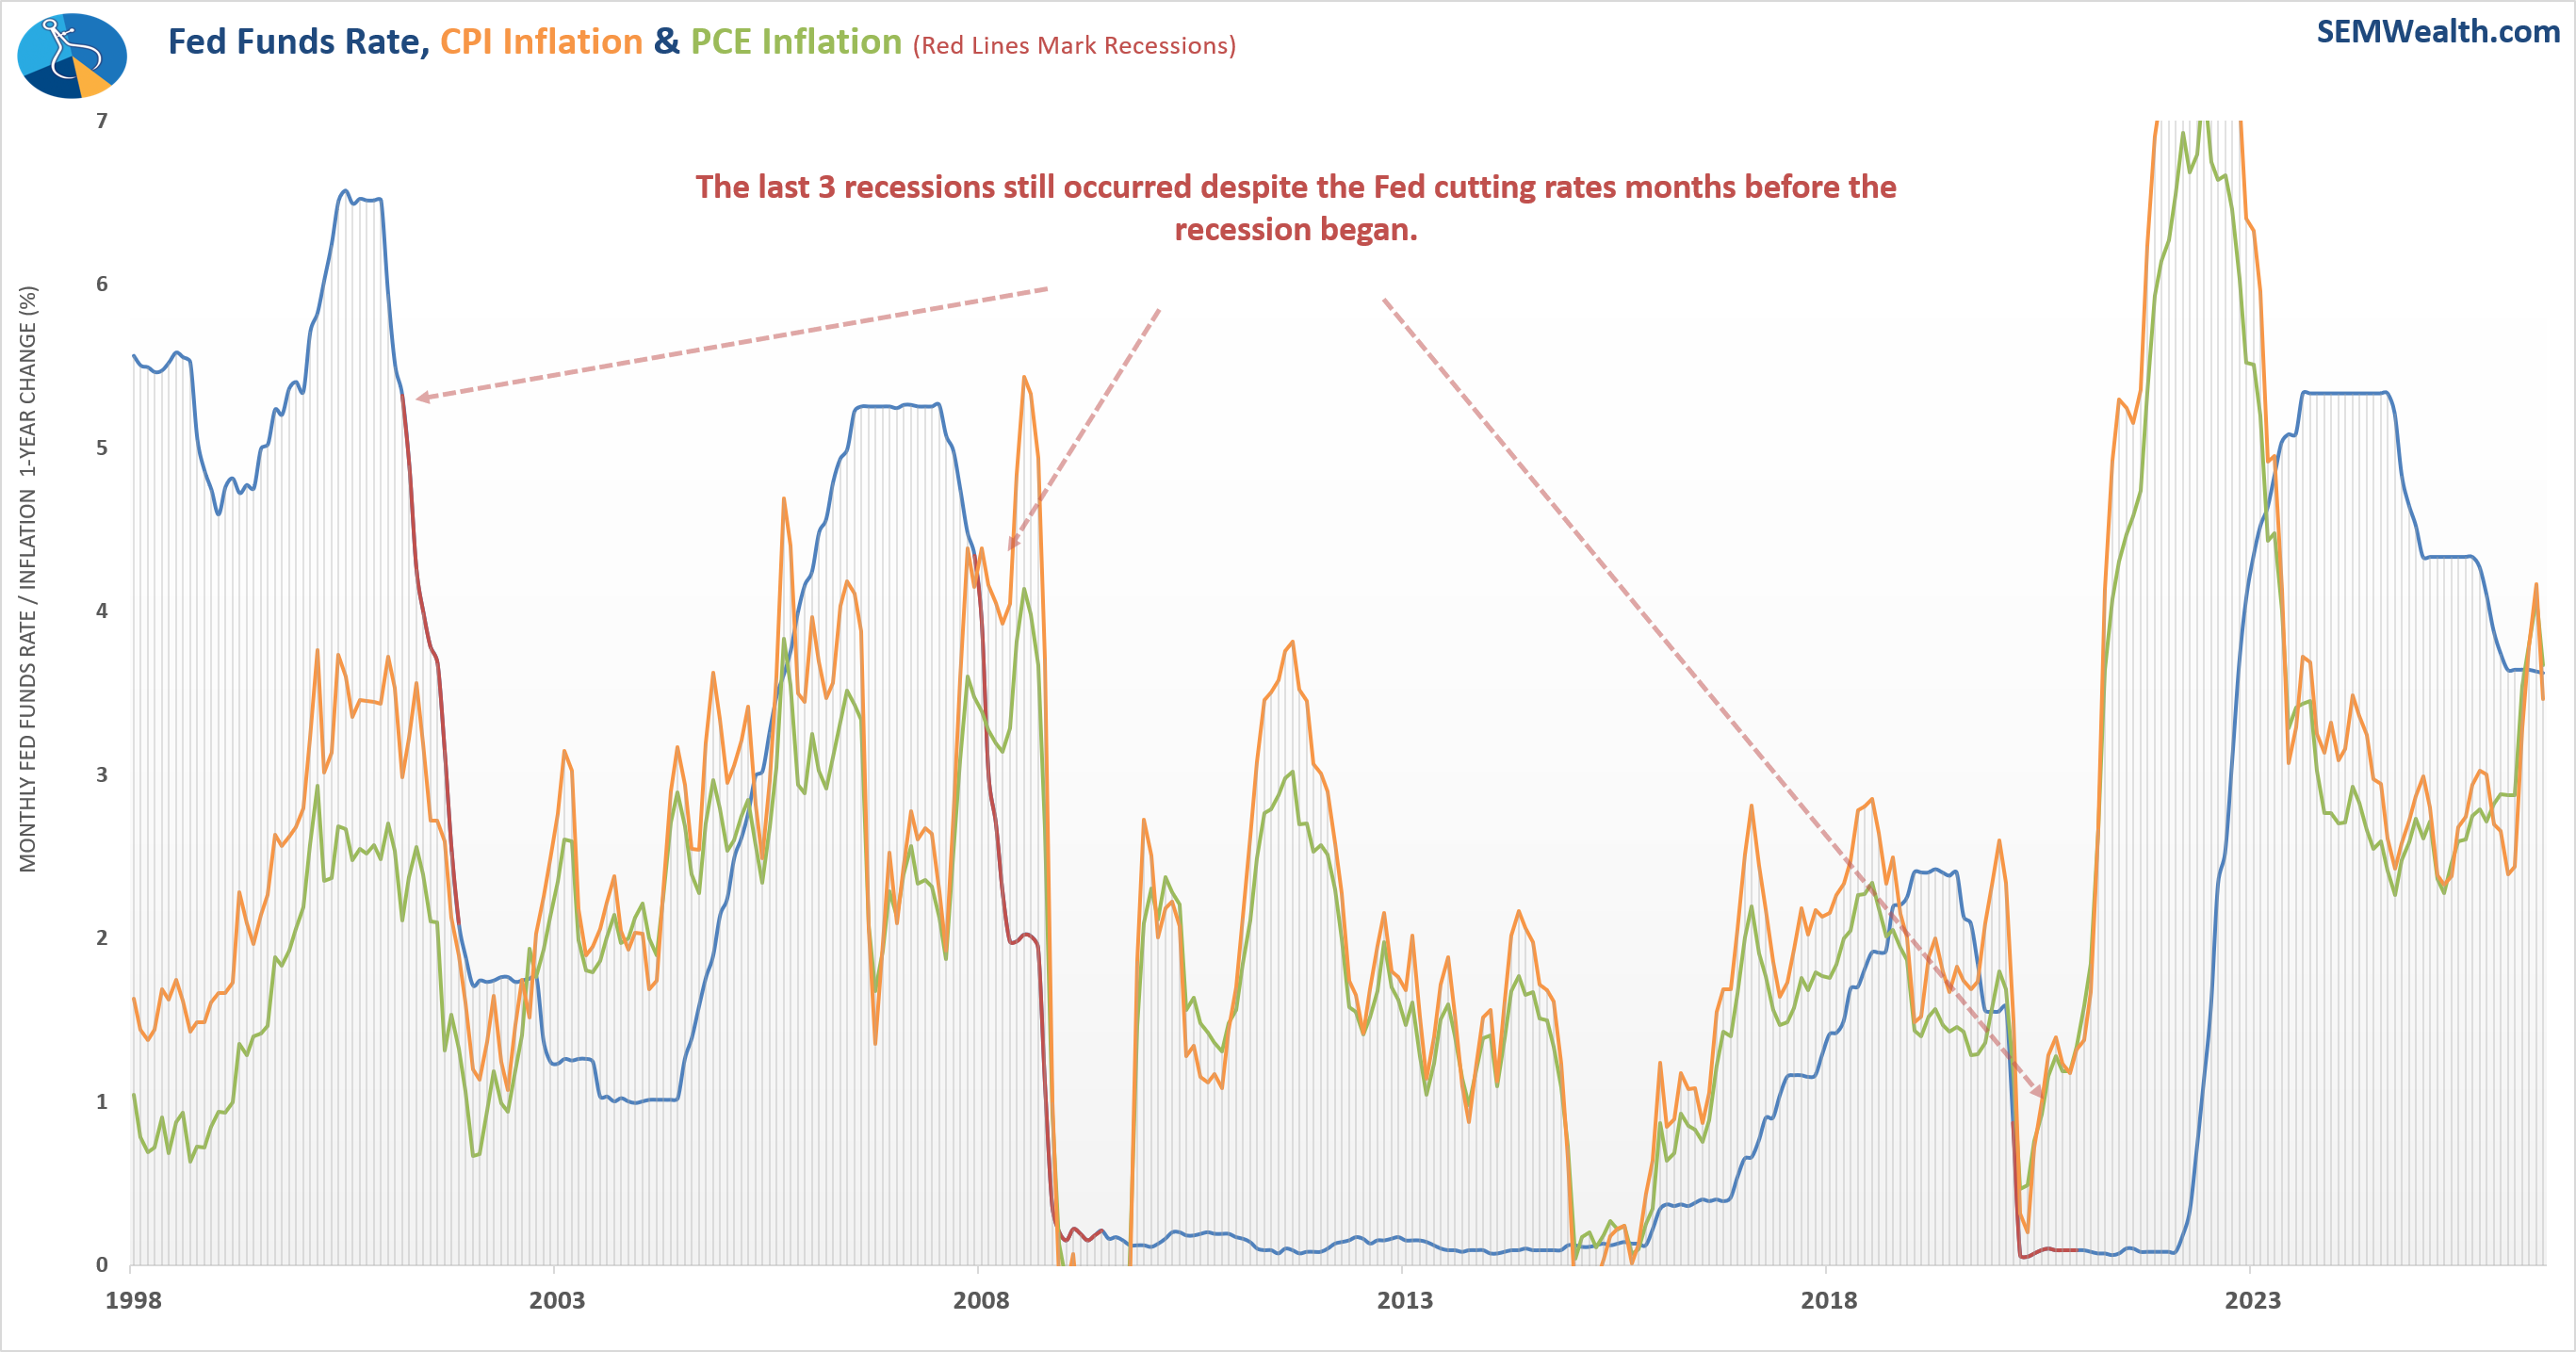
I continue to argue that if the Fed raises rates and shows a commitment to containing inflation, long-term rates will DECLINE (because the market would then trust the Fed to move inflation lower). Lowering inflation and borrowing costs would help the economy far more than what the Fed has been doing the past year.
The latest PCE inflation data, which for now is the Fed's preferred inflation metric (Chair Warsh hinted even that is under review), eased a bit, but the longer-term chart shows the problem. Inflation stopped going down as the Fed cut rates and is now at risk of becoming STRUCTURALLY higher. Money that is too cheap naturally will create inflation.
Can Anybody Make Sense of the Economy?
Despite arguments to the contrary, the US economy is not "thriving" when you measure it against longer-term history. The long-term average growth rate is just over 3% (going back to 1950). We've RARELY hit that level over 12 month periods this century (the blue line in the chart below).
As I will remind everyone until they change the way it's reported, the "official" GDP number is the last 3 months of activity, compounded 4 times. This makes for big swings and doesn't help paint the picture (the orange bars below).
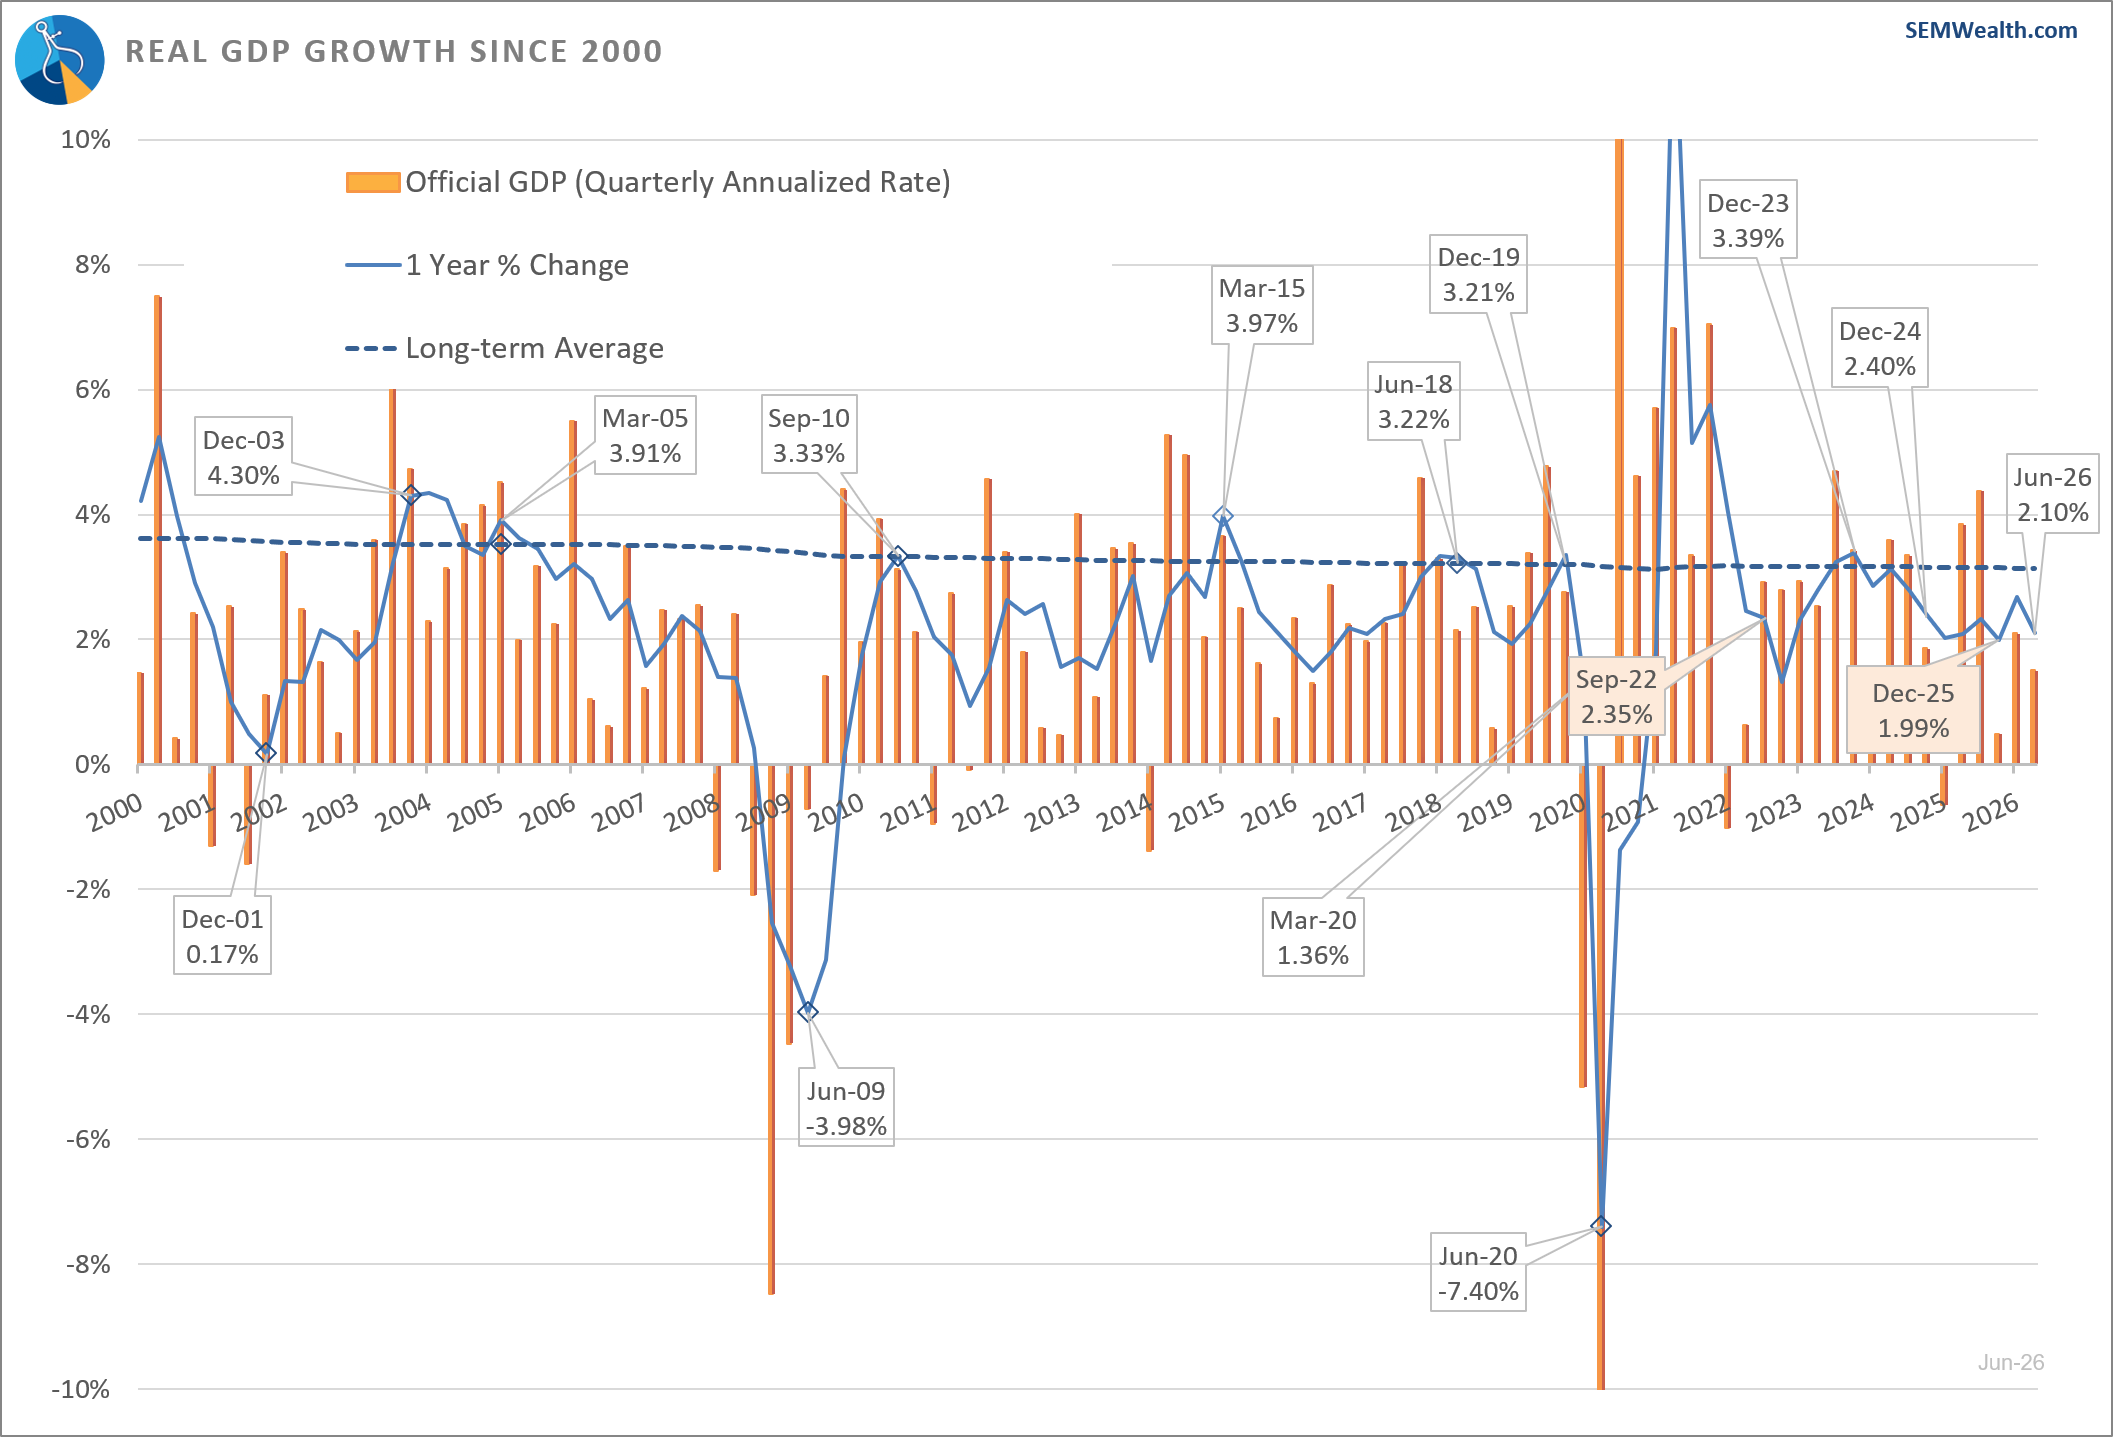
The 2.1% number is "decent", however the investment in data centers and the infrastructure around it added 1% to the growth rate. So like we saw in 2025, we'd be teetering near recessionary numbers without the AI-buildout. This means we will continue to focus on the funding of the data center infrastructure. If that crumbles we have a completly different economy.
The biggest driver of the other half of economic growth outside of data center investment continues to be Consumer Spending which for the 2nd month in a row grew by 6% over the past year. This chart highlights how the stimulus checks during COVID (while the Fed also stimulated) shifted the economy into overdrive (for those who didn't lose their source of income during COVID).
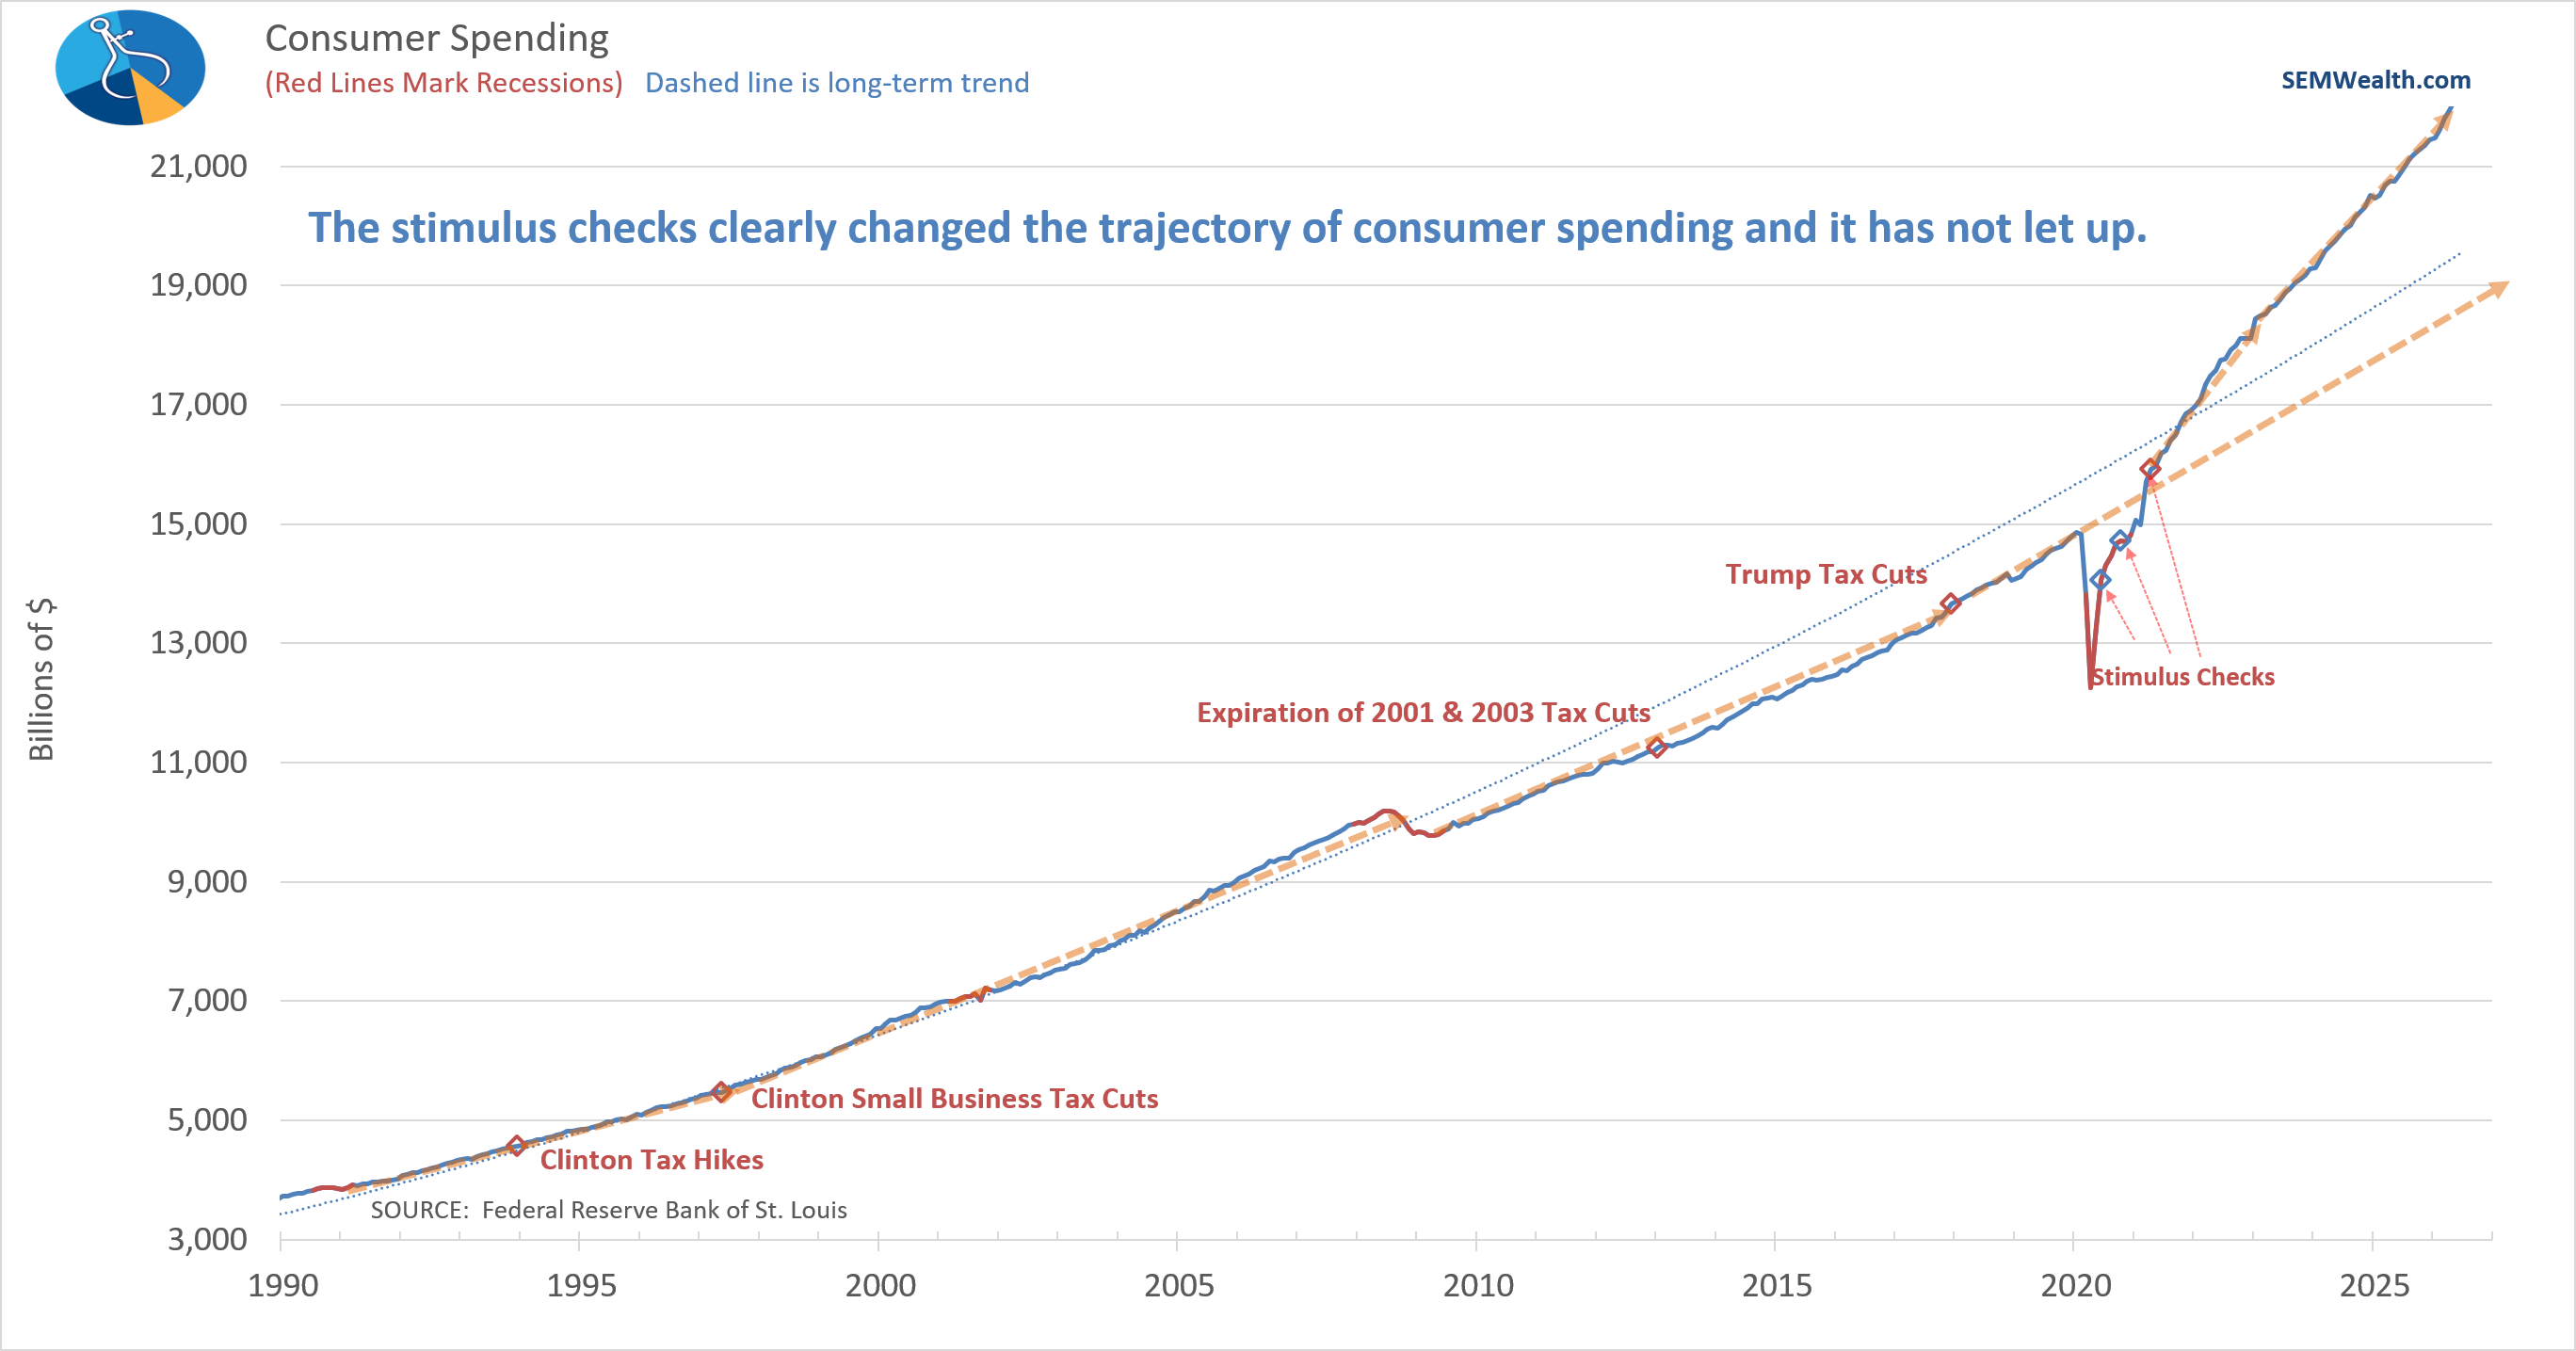
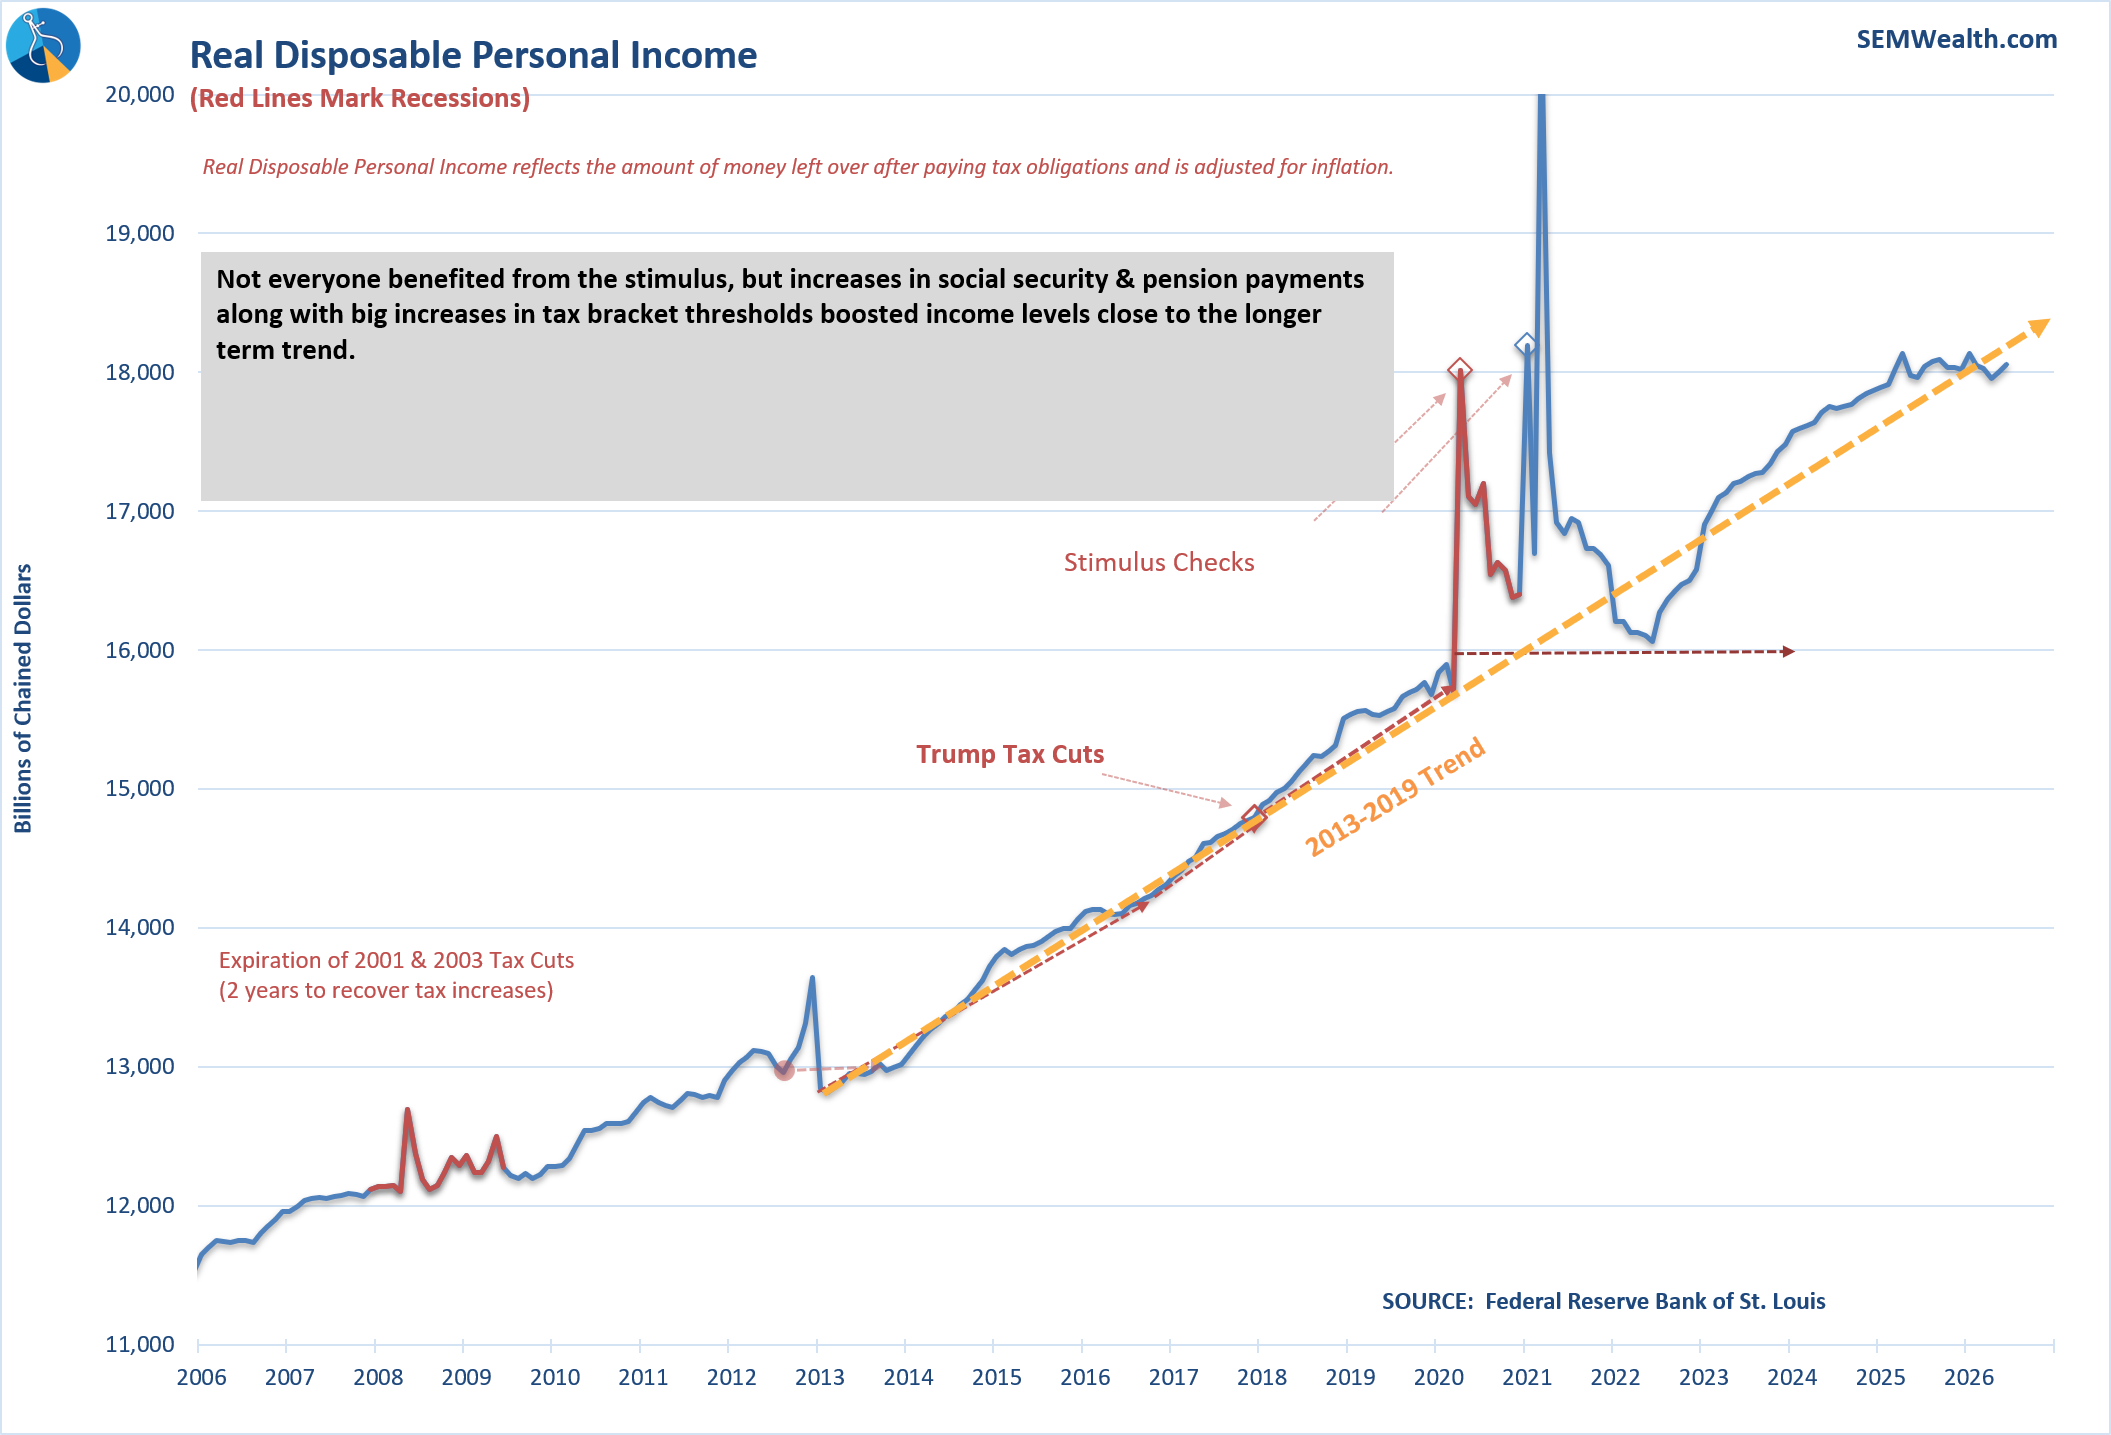
Spending, of course does not tell the whole story. It is the TOTAL spending, so those with more money outweigh those with less. It also doesn't show how much of the spending is being supported by debt. Personal Income by comparison only grew by 1% over the past 12 months and is again below the trend that started in 2013.
Moving into the back half of the year, we have plenty of questions and not a lot of answers. As we always do at SEM, we will let the data determine our path and will be here to report any answers or adjustments along the way.
An IPO Hangover: Why New Listings Keep Lagging the Market
The beauty of the intersection of personal finance and investing is that finance is personal. As humans, we are all wired differently and have our own unique feelings every single day. It's no different in the investing world. For example, we experience it as a subset of behavioral finance: our brain can feel fear of missing out (FOMO) on the new, flashy item that comes across our view.
Take a look at some of the largest companies by market cap that recently went public from the past year.
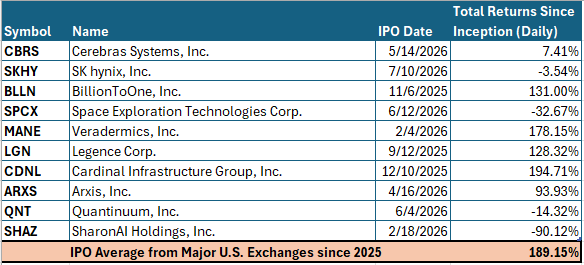
Sort of a mixed bag, right?
In fact, across the 300+ companies that went public on all major U.S. exchanges in the past calendar year, the average return since inception is 189.15%.
Not so fast!
When expanding the time horizon, IPOs have underperformed the broader market over the following three years. A combination of price discovery and supply dynamics, market timing bias, and elevated expectations at listing, followed by growth moderation, can serve as root causes for this below-average performance.
Apollo Wealth explains its view of the three main forces driving this unsatisfactory run for companies that have recently gone public.
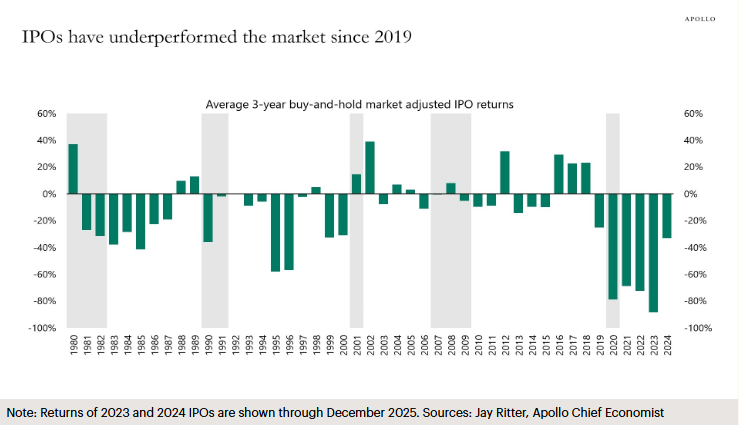
In their view, those main forces are peak valuations, a hostile rate regime, and a low quality-high bar precedent.
- Peak valuations: The 2020–2021 wave came public at rich multiples amid zero rates, stimulus and speculative retail demand, leaving little room for gains.
In 2020, there were over 400 IPOs in the U.S., the highest on record, largely due to SPAC-related dealmaking. However, U.S. companies averaged over a 65% drop from their IPO price due to the broader market reversion back to historical valuations by early 2023.
- A hostile rate regime: The Fed's hiking cycle from 2022 compressed valuations and hit the long-duration, unprofitable growth stocks that dominate IPO cohorts hardest.
In a rising interest rate environment, unprofitable growth stocks see their present value of earnings lowered and their borrowing costs increased.
- Low quality, high bar: The boom pushed marginal companies public before they were ready while the market-adjusted benchmark was set against an index carried by a handful of mega-cap winners.
Companies were incentivized to go public due to public demand, but found they were unable to meet market expectations and underwhelmed early analysts' estimates.
At SEM, we understand the value of long-term investing, staying the course, and holding diversified investment portfolios while remaining flexible enough to adapt to changes in the market environment.
Thank you to all of the visitors who read last week's "Chart of the Week". I hope to continue sharing these talking points about markets, investing, etc., for you to share with family, friends, coworkers, or anyone along the way.
See you next time!
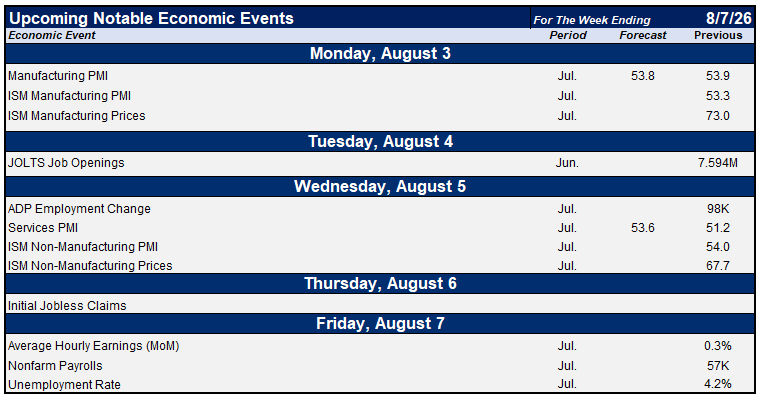
Market and Economic Data
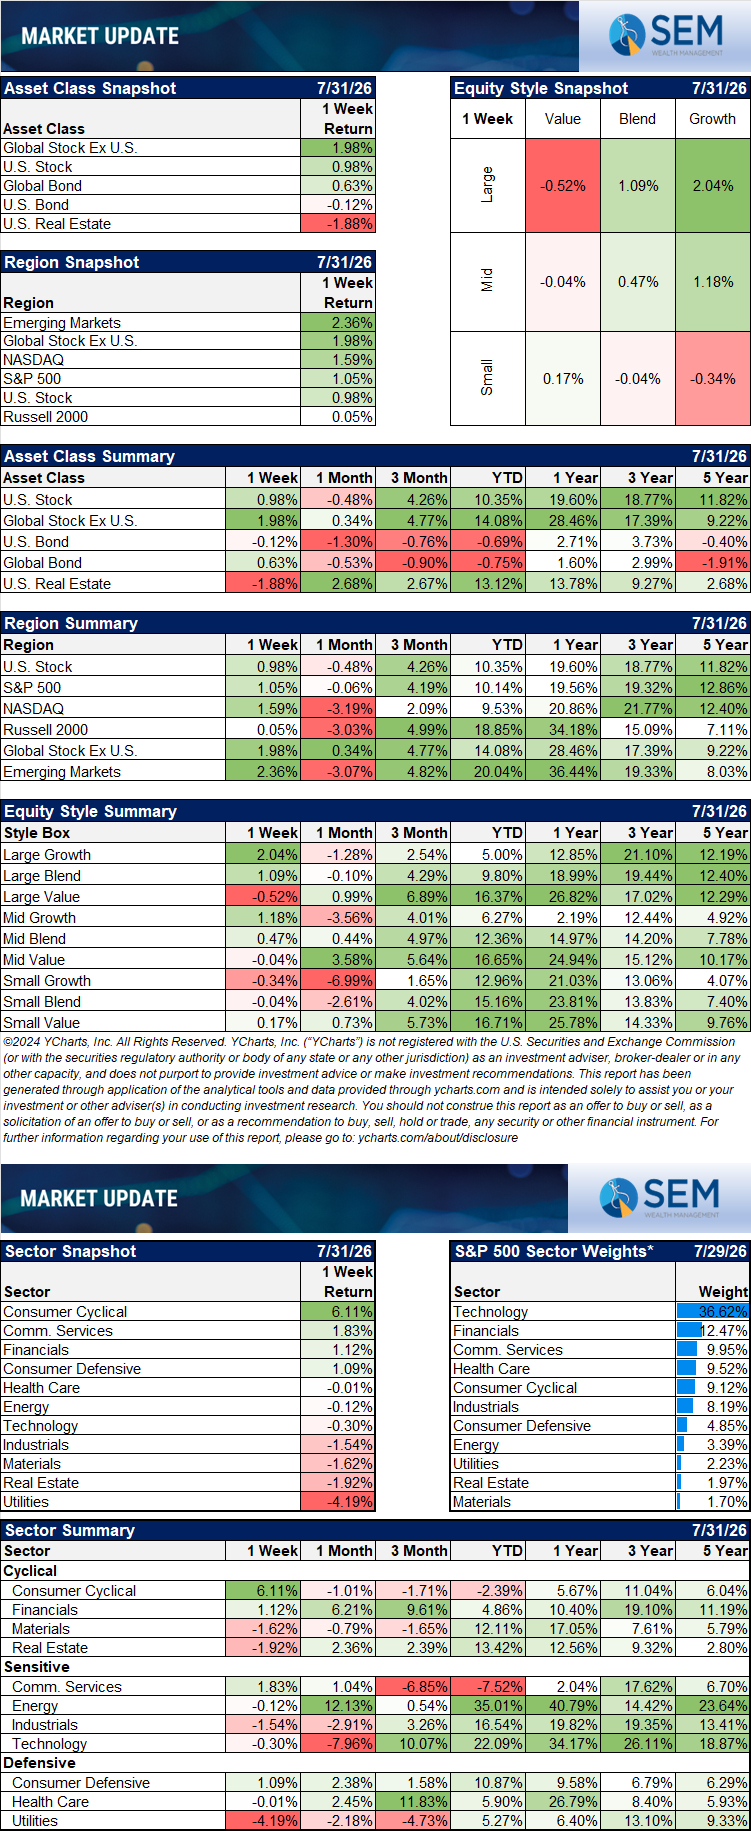
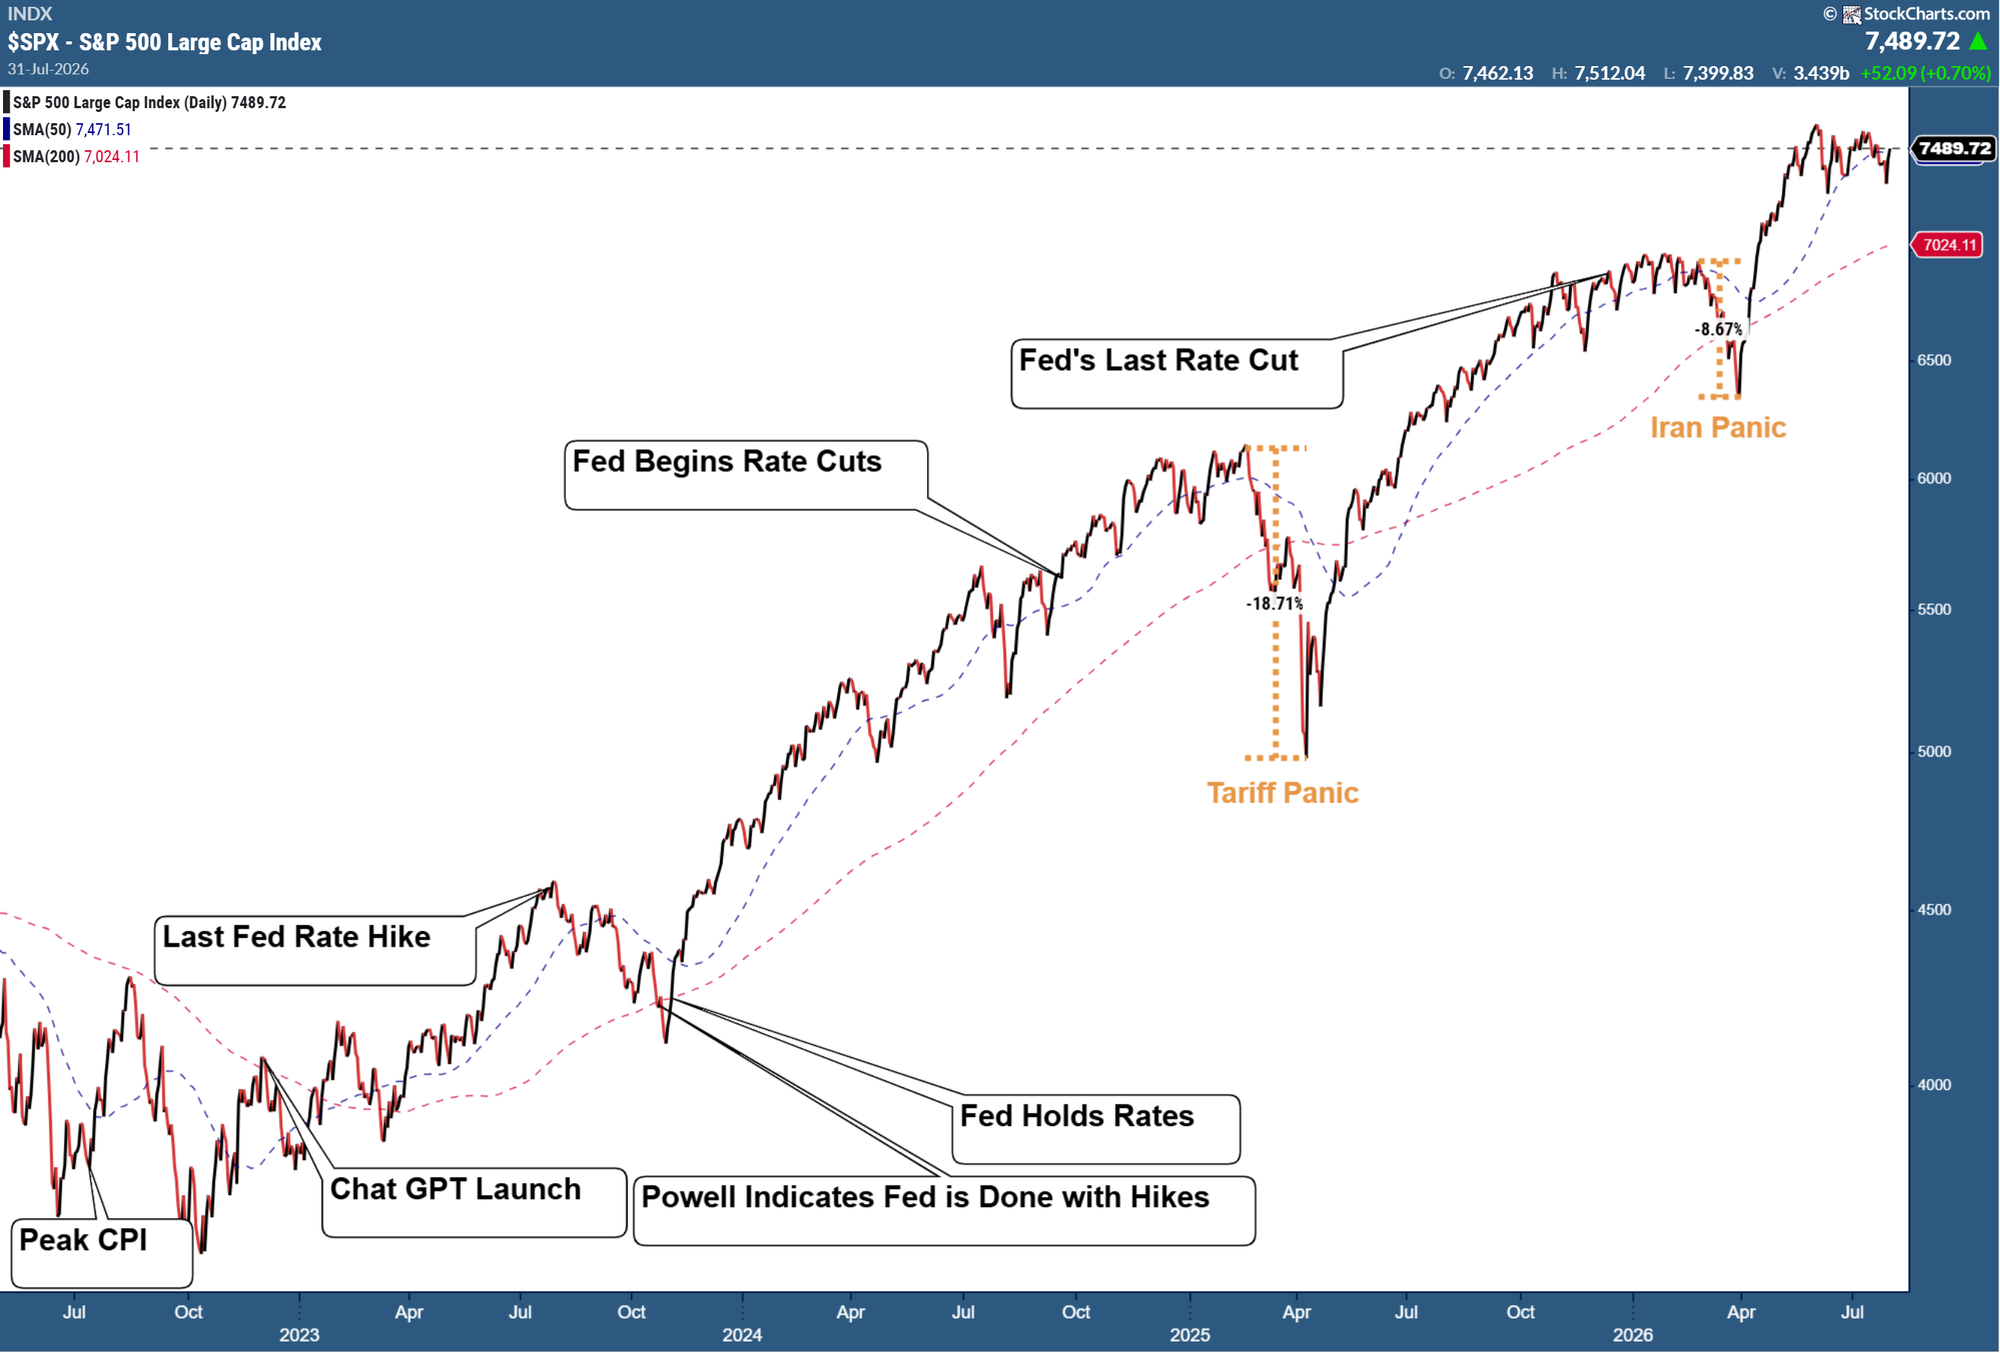
As noted above, in the main article, it was again a choppy and highly volatile week. Friday's rally was enough to give the S&P 500 a winning week.
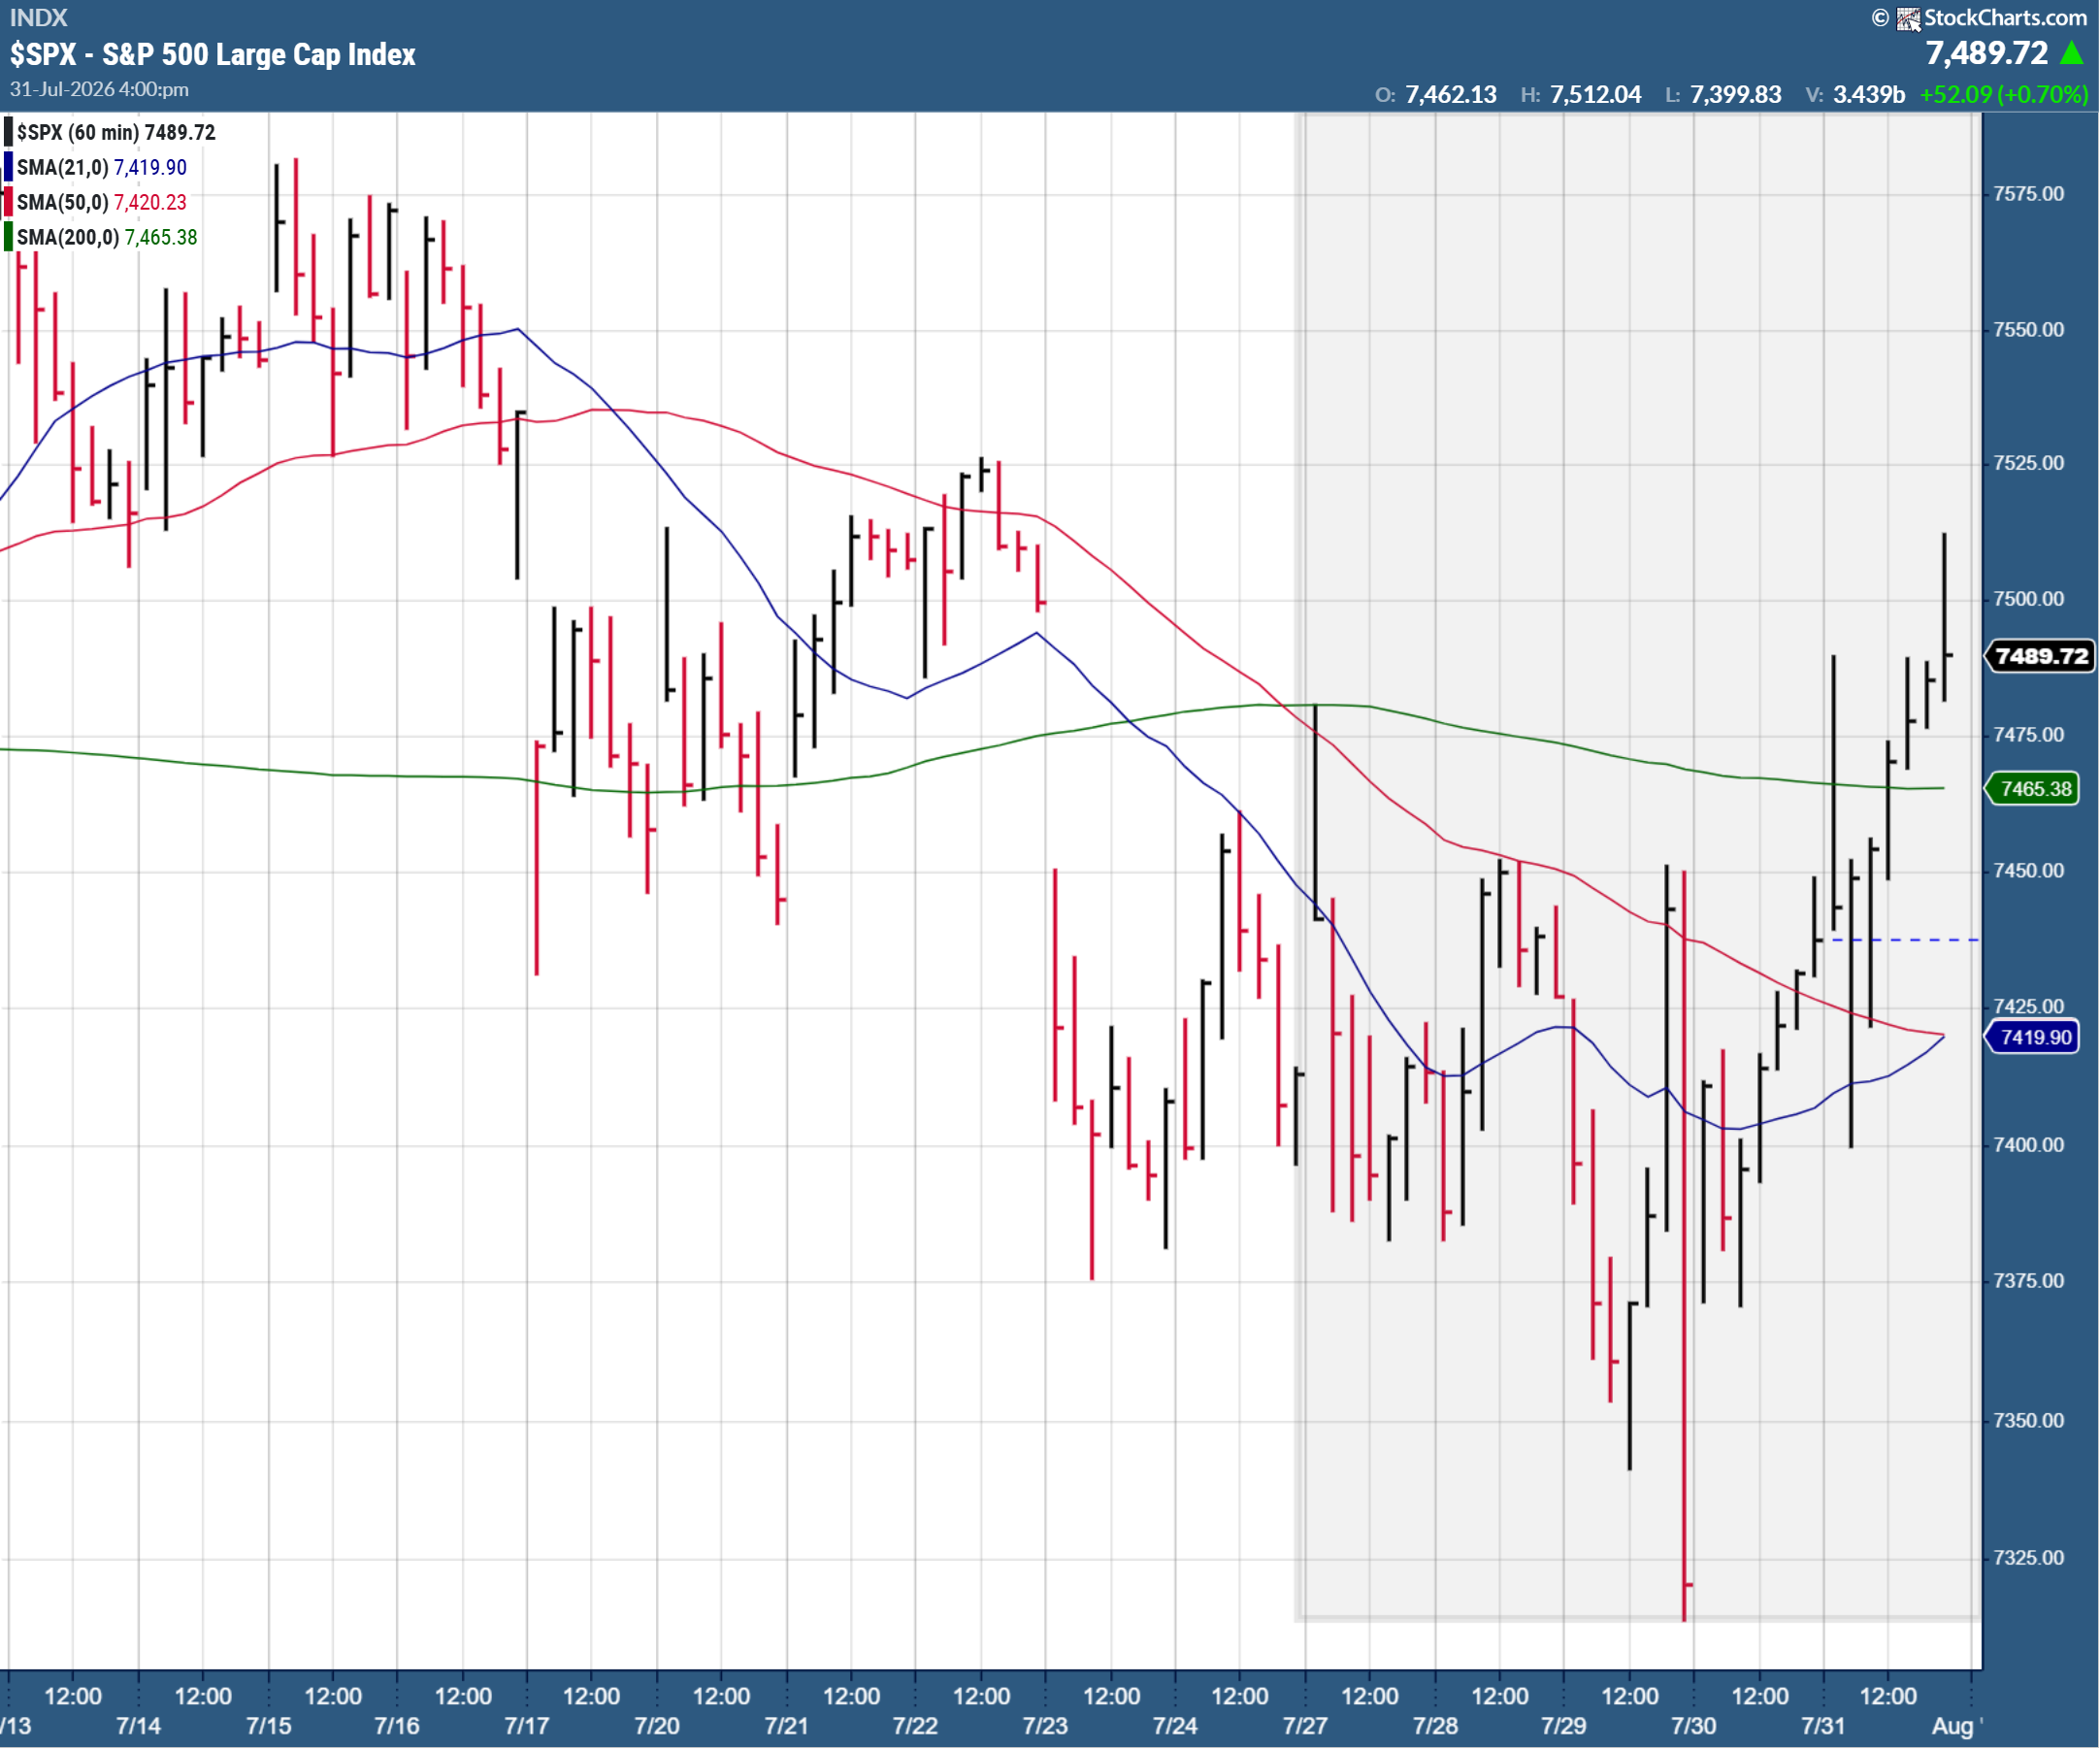
Zooming out, the S&P 500 looks like it is in some sort of very broad consolidation pattern between 7300 and 7600. This 4% band comes after the huge move off the lows when it first appeared the war in Iran was over.
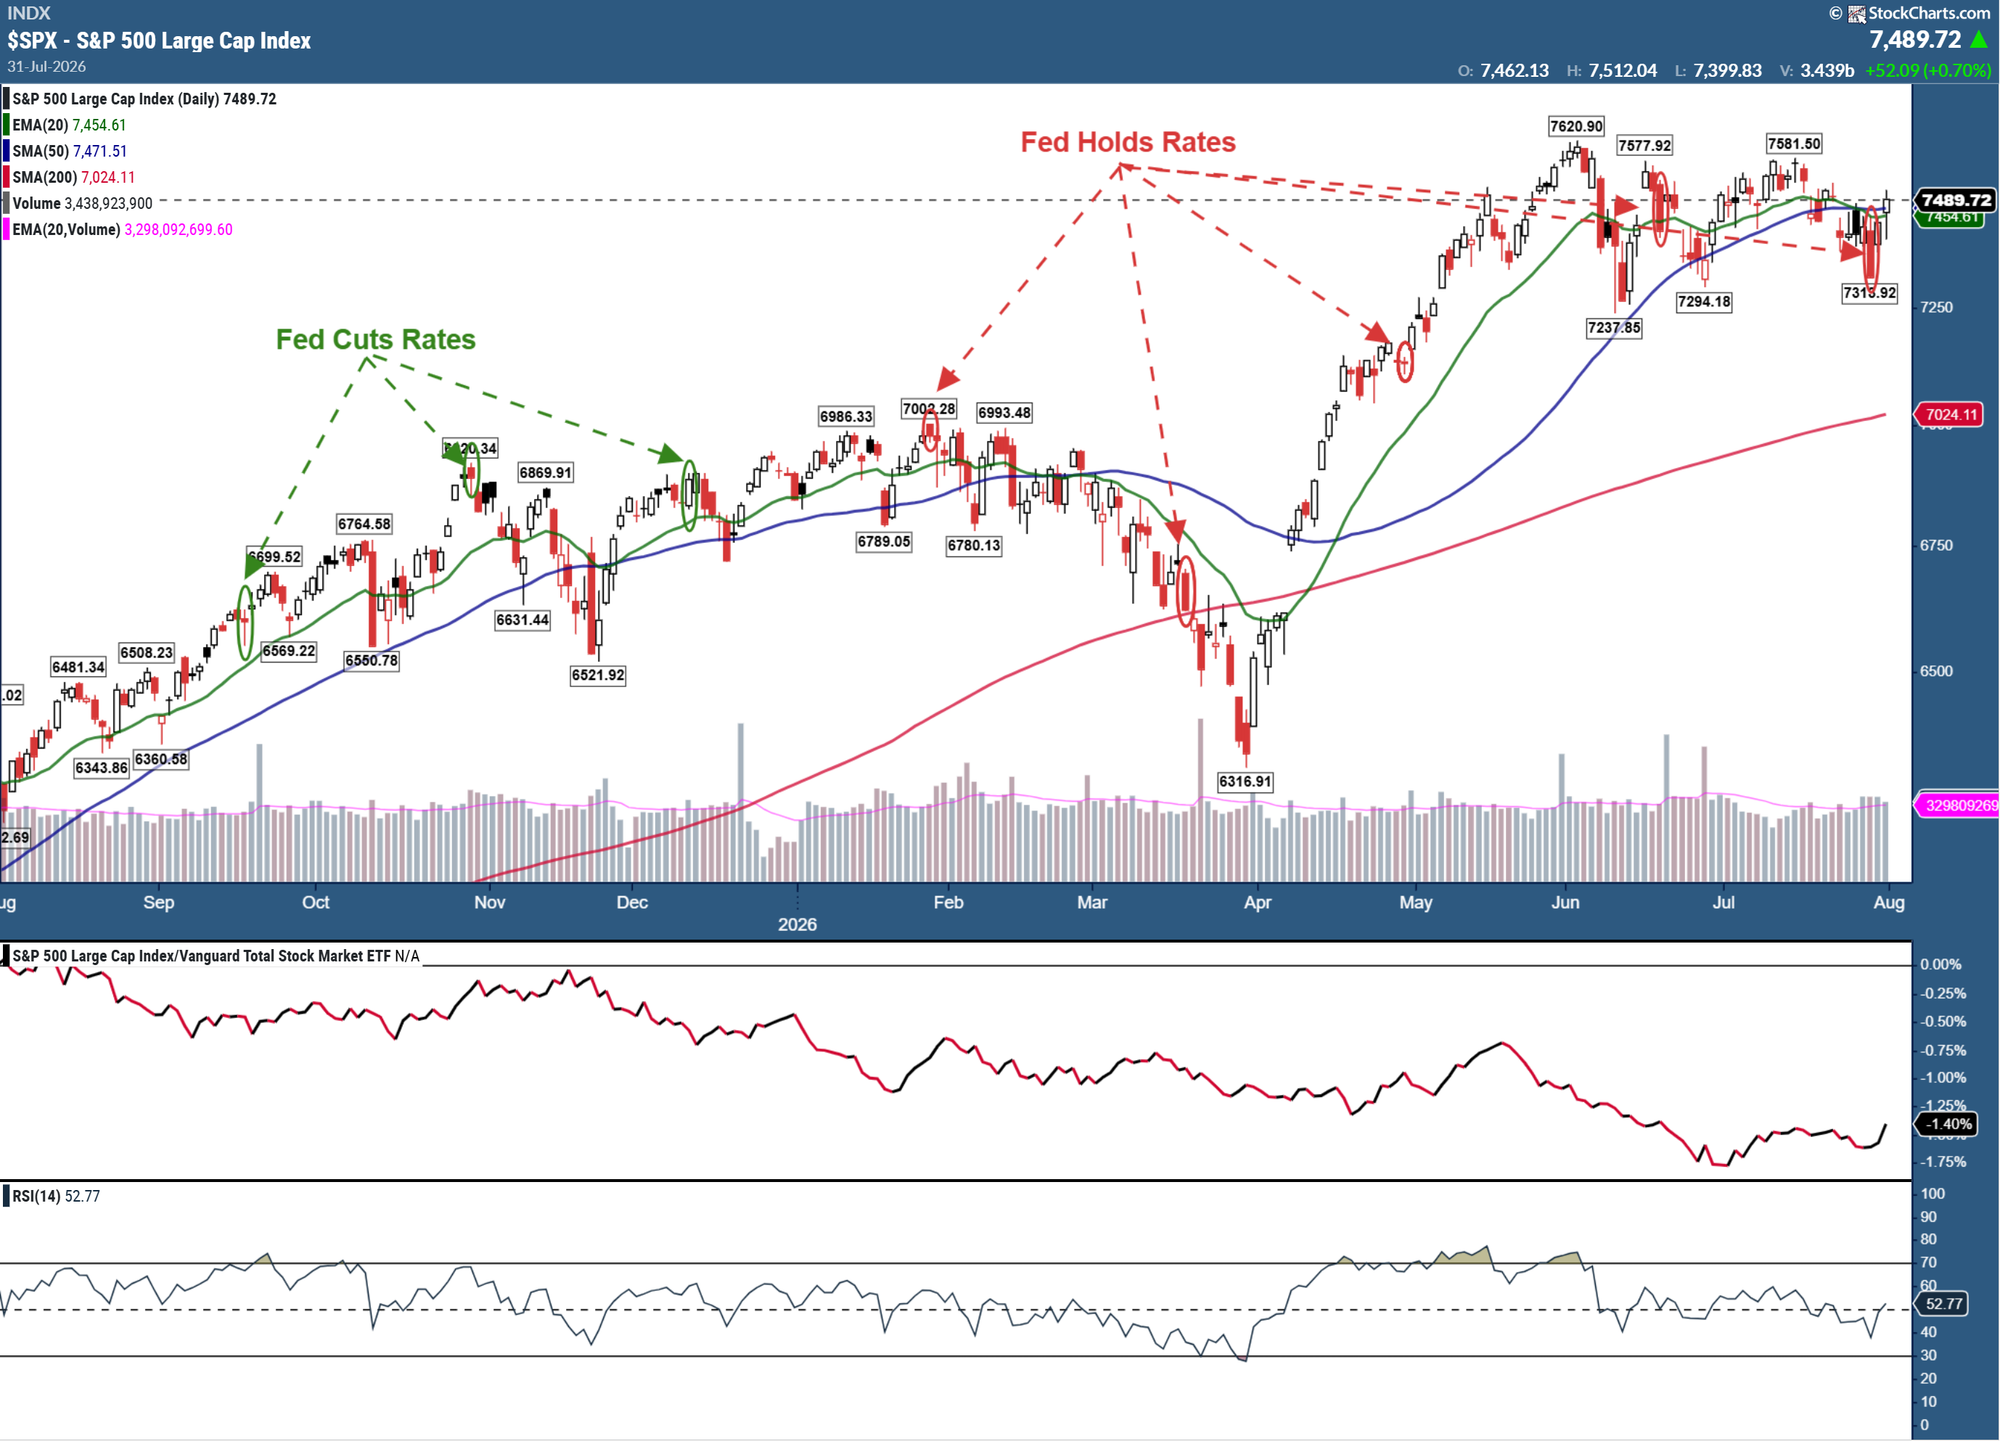
Our new expanded look at the S&P since late 2022 shows some of the key new items that helped create the market bottom (and extend the upside momentum.)
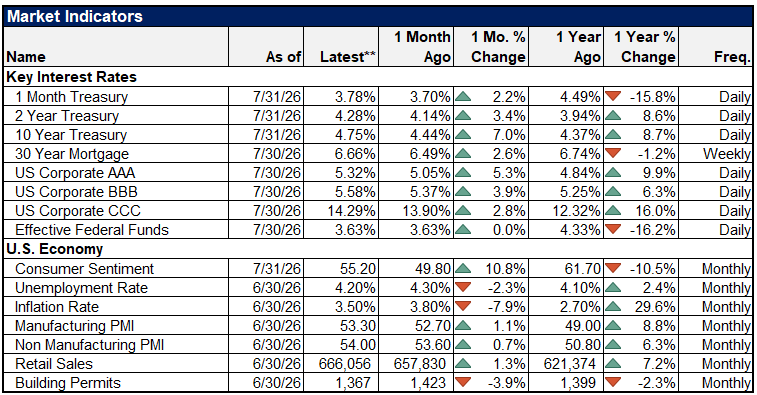
Economic Data
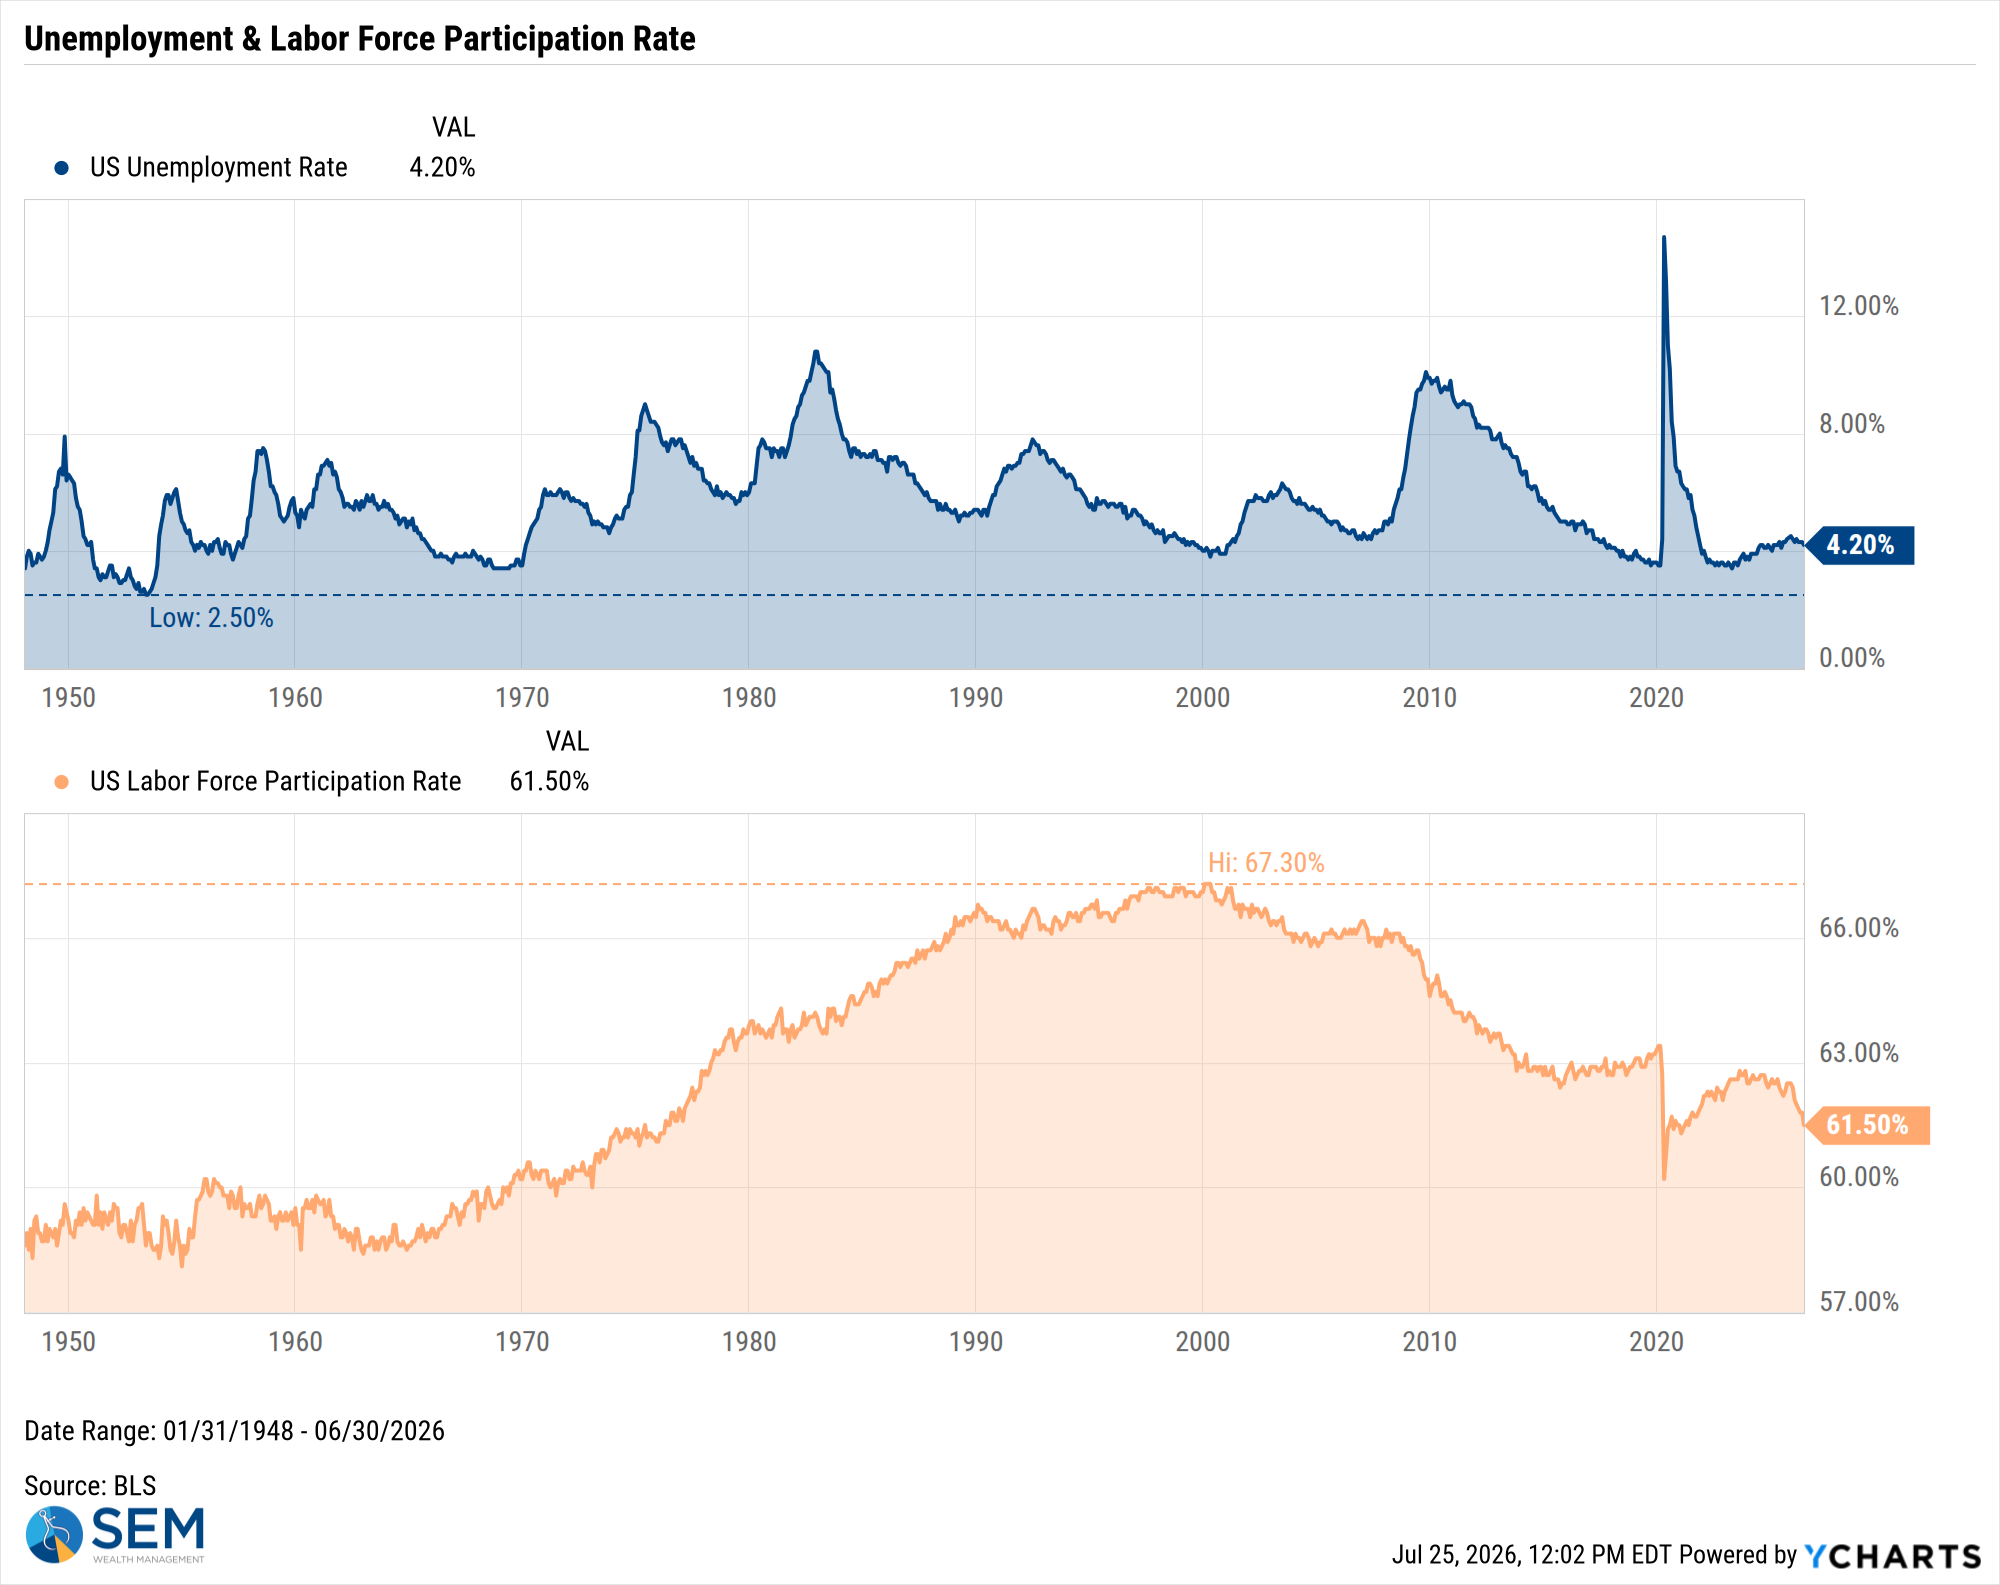
US Unemployment Rate data by YCharts
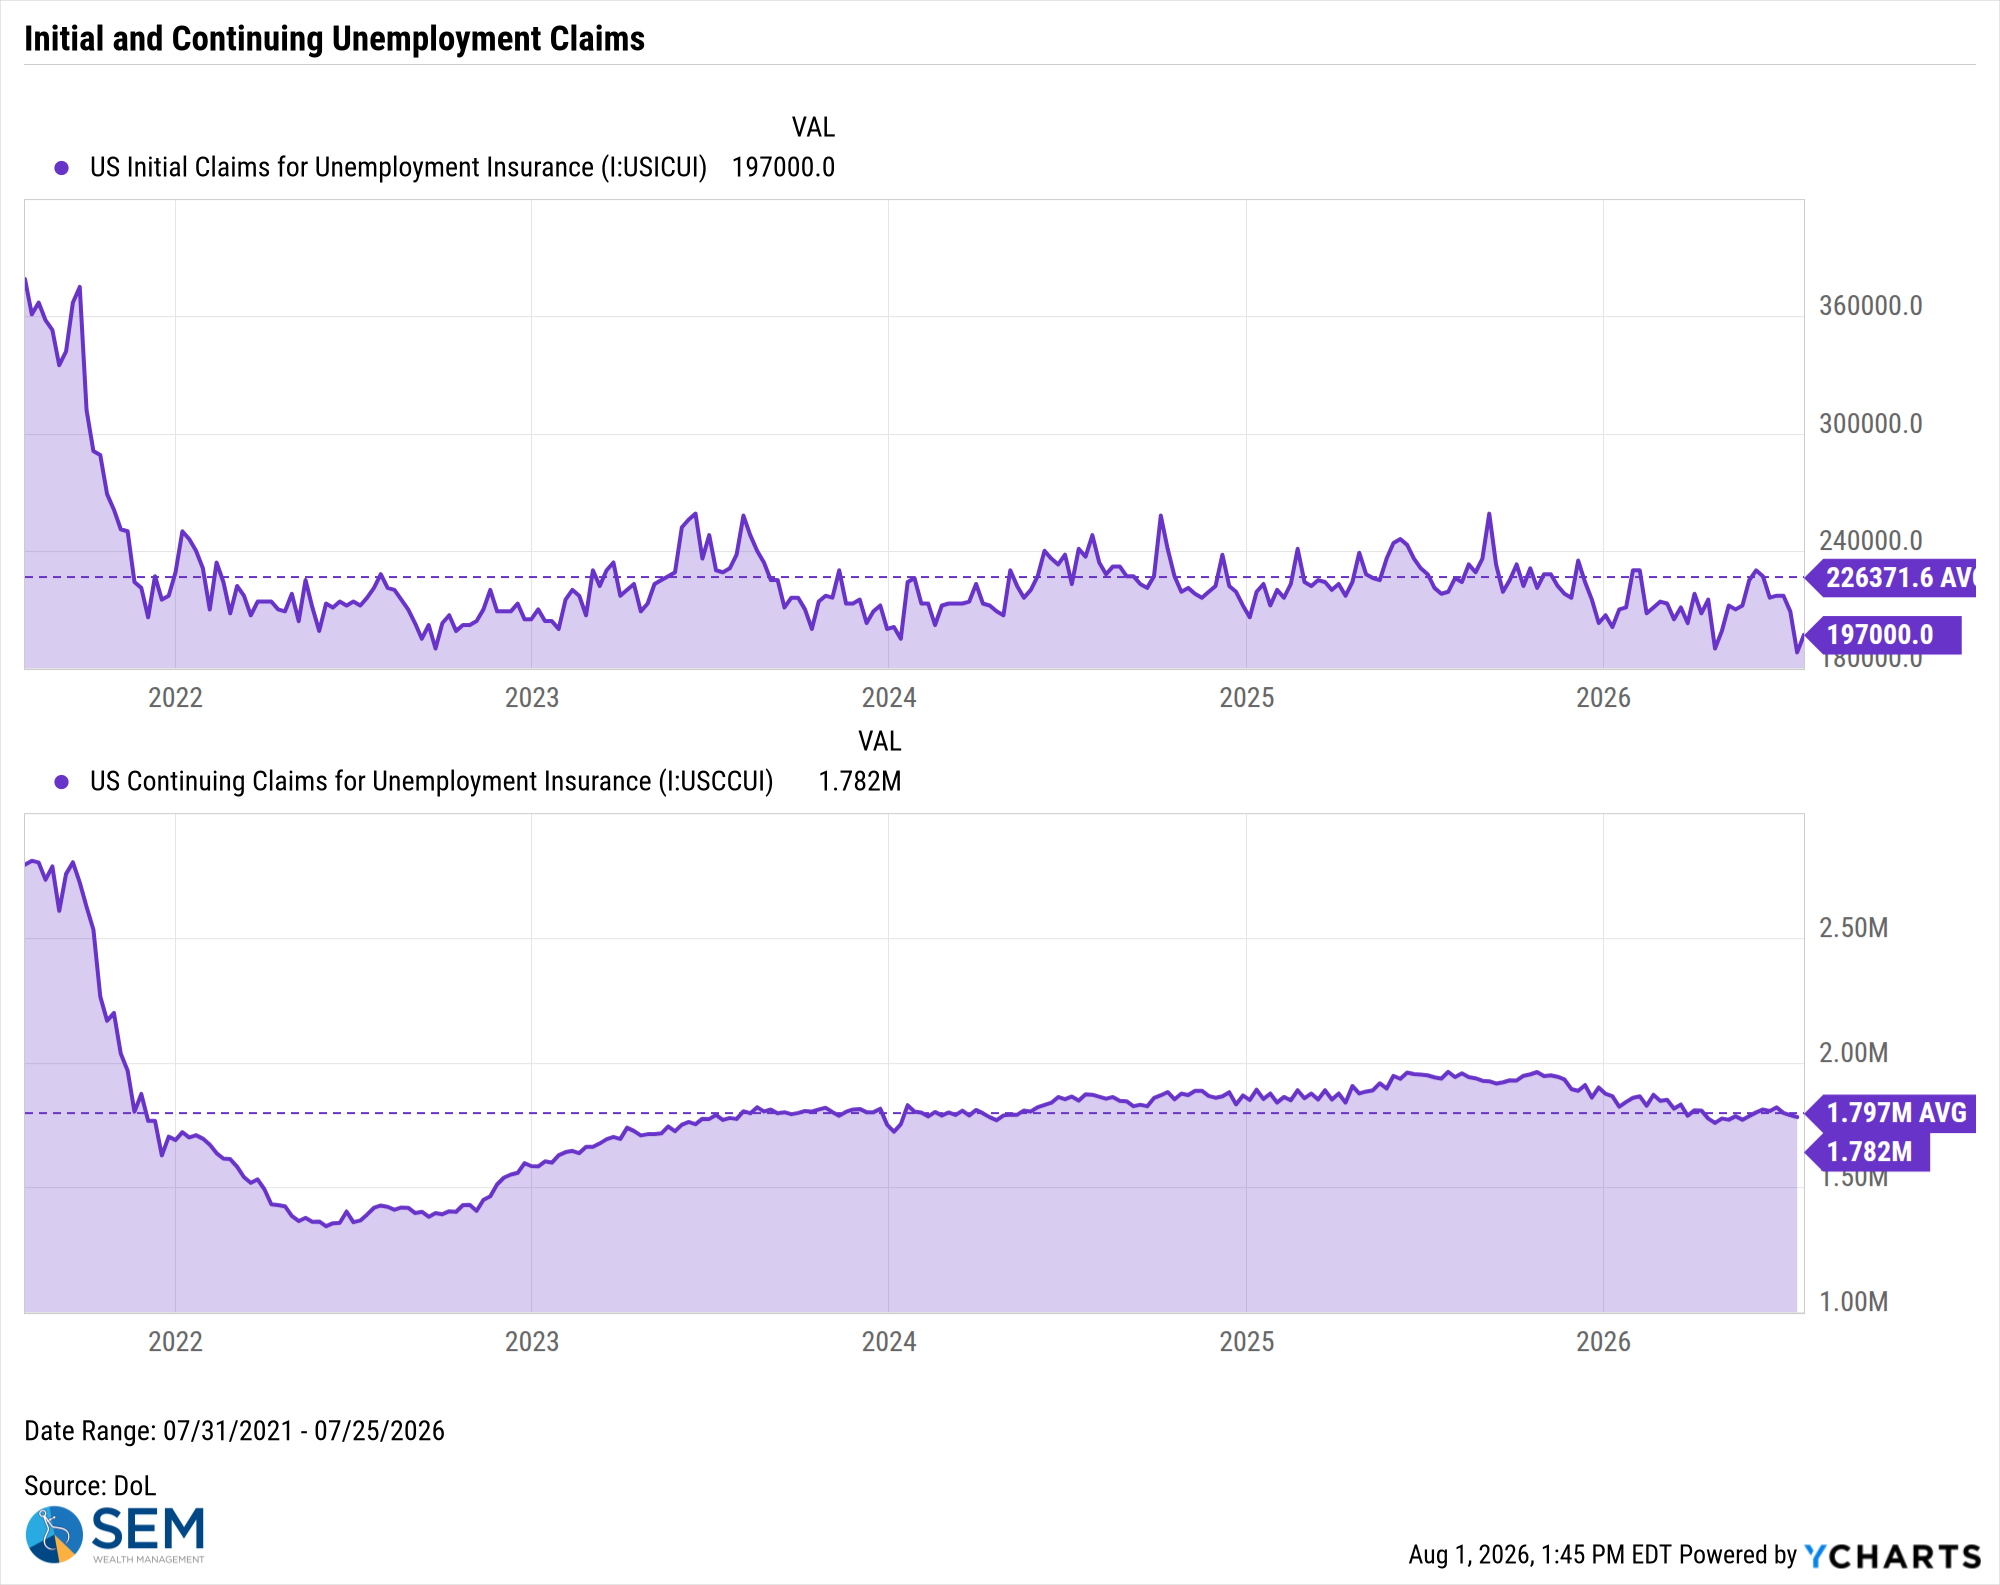
US Initial Claims for Unemployment Insurance data by YCharts
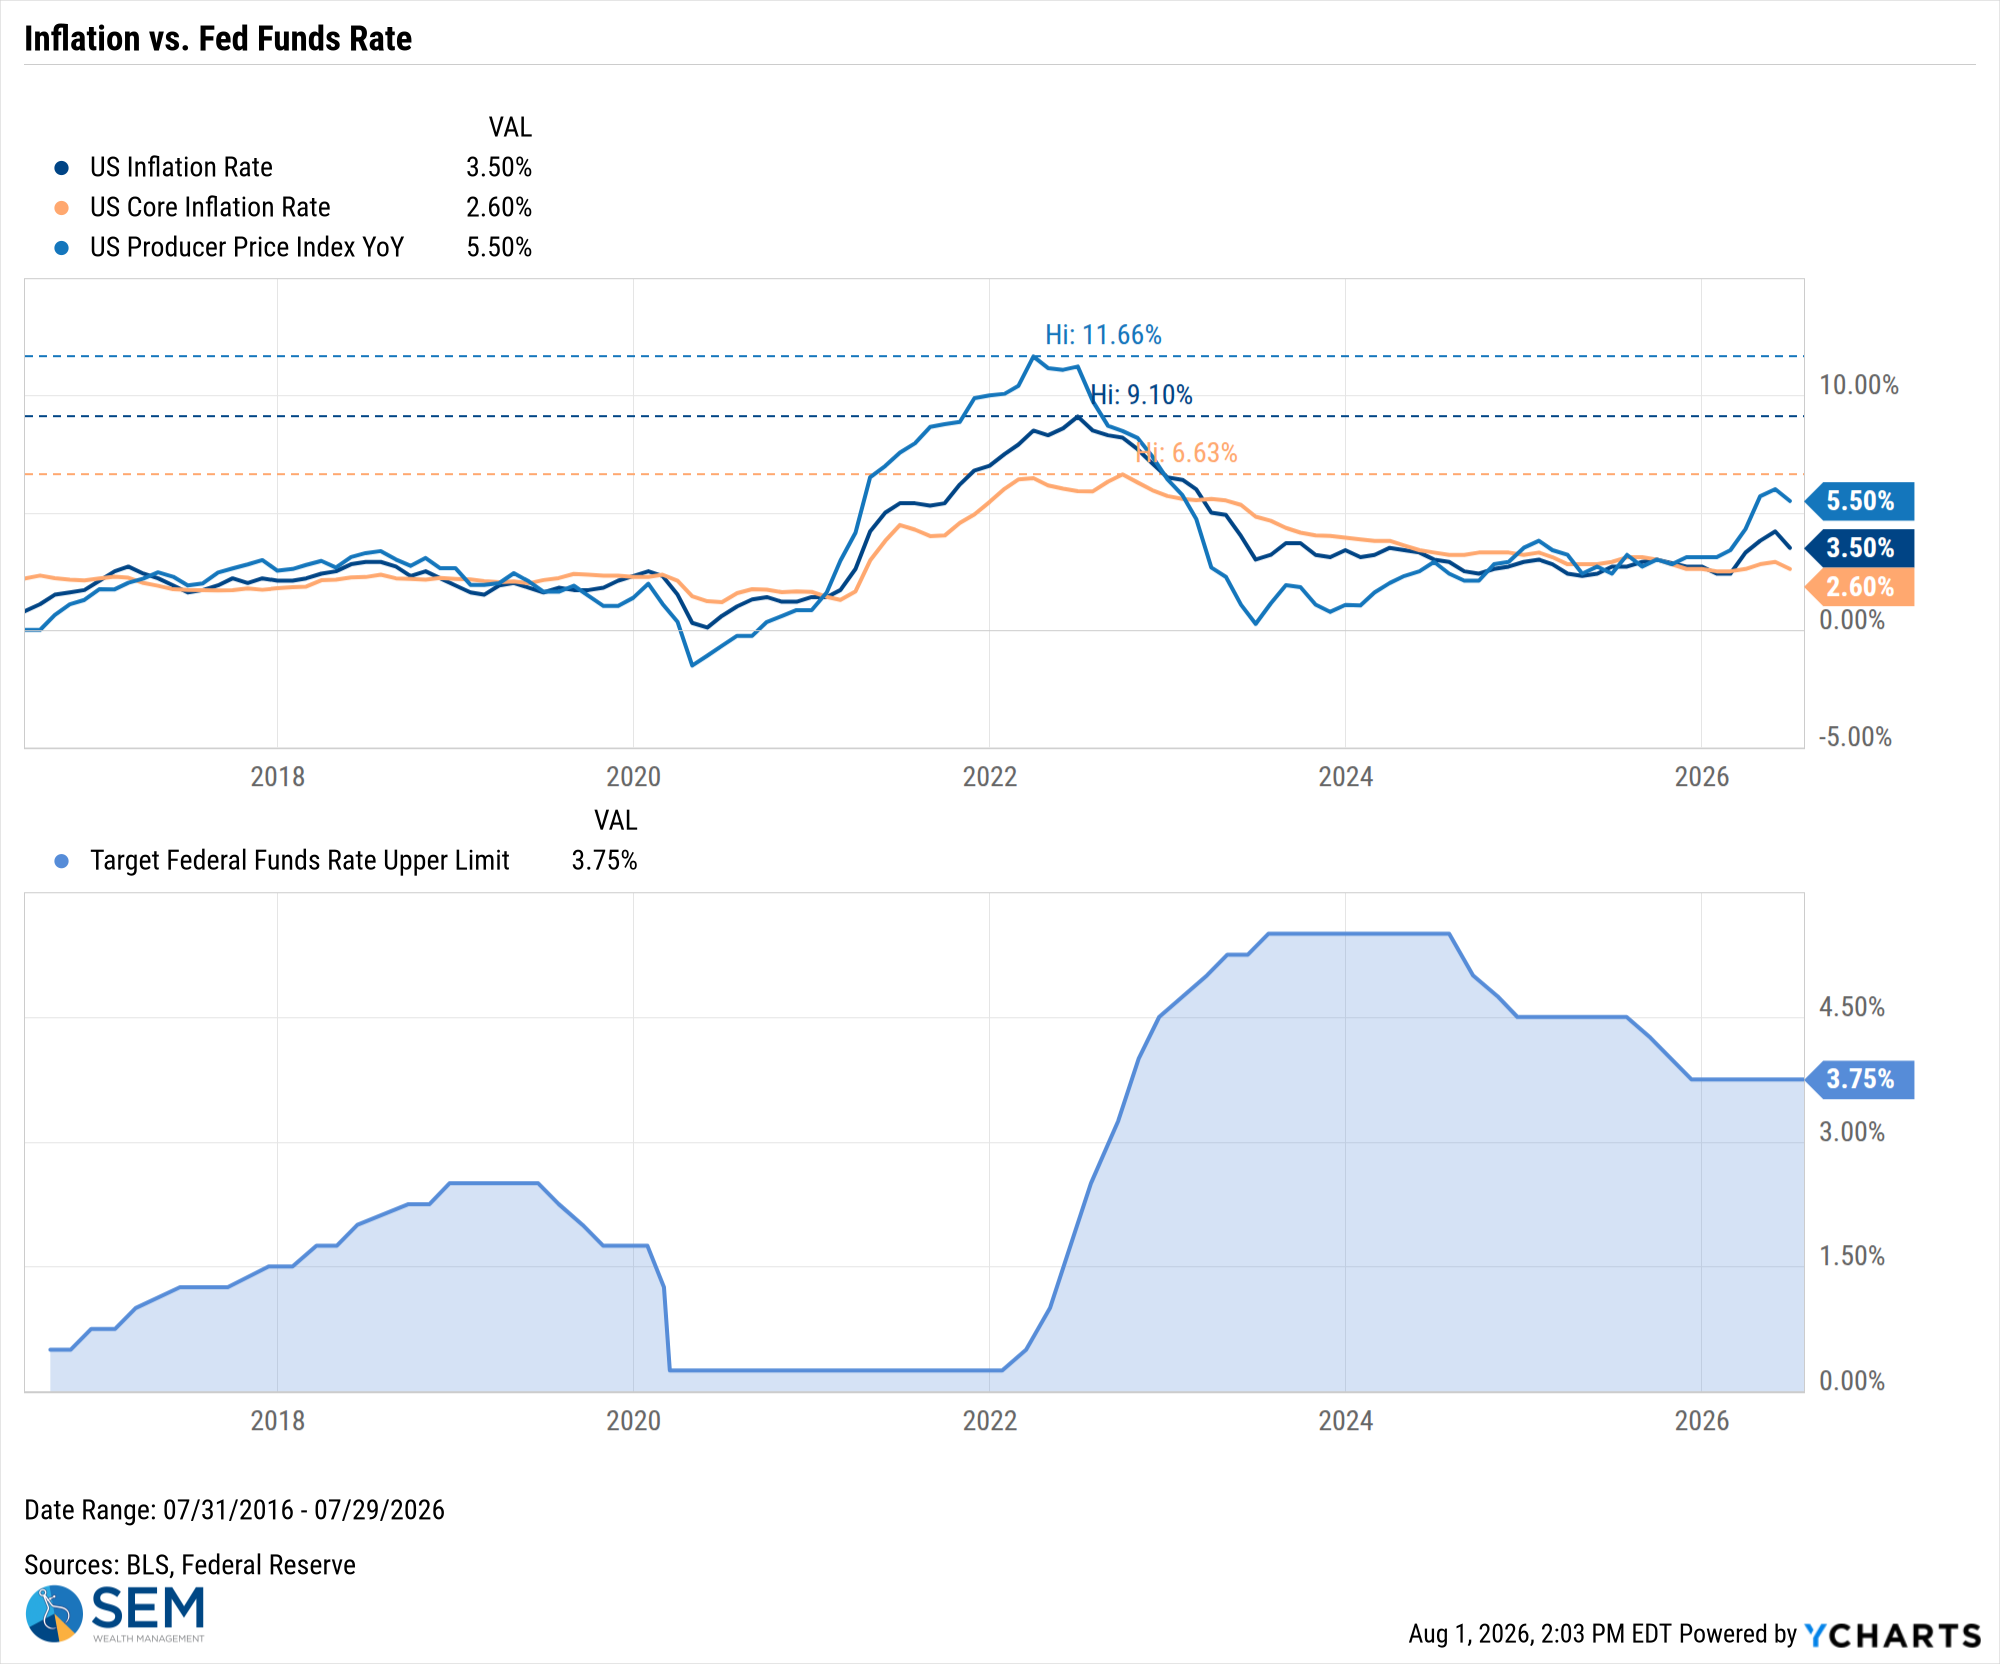
US Inflation Rate data by YCharts
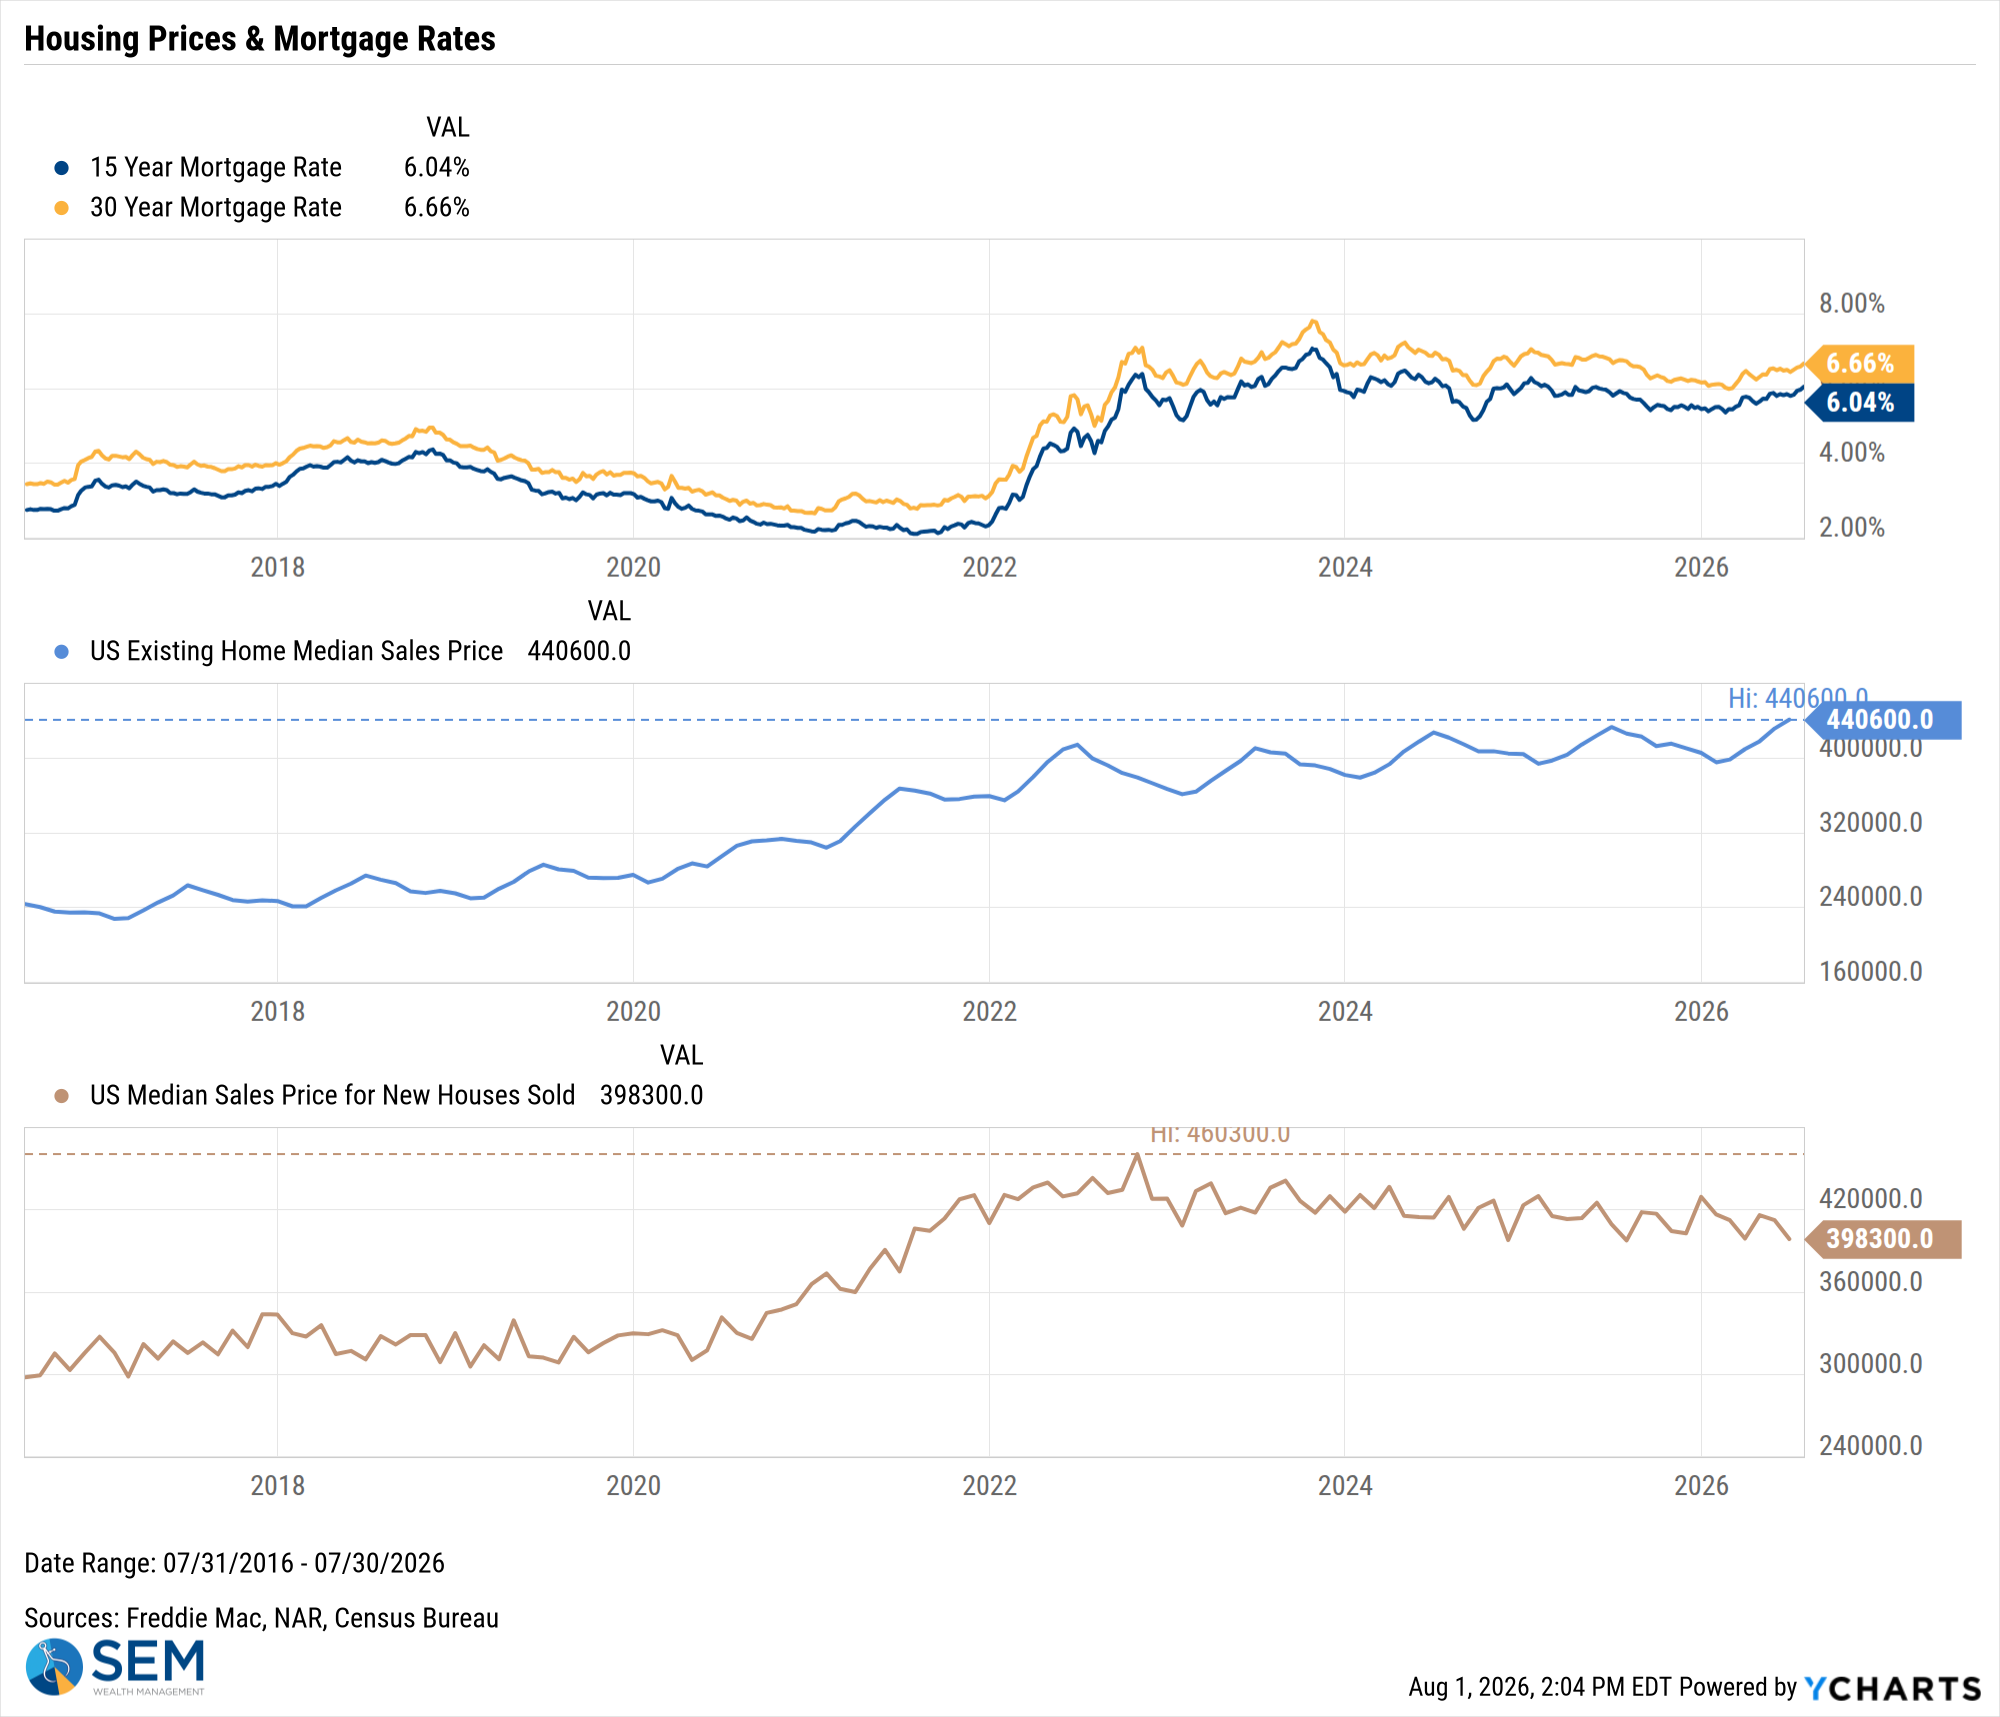
US Existing Home Median Sales Price data by YCharts
SEM Market Positioning
SEM deploys 3 distinct approaches – Tactical, Dynamic, and Strategic. These systems have been described as 'daily, monthly, quarterly' given how often they may make adjustments. Here is where they each stand.
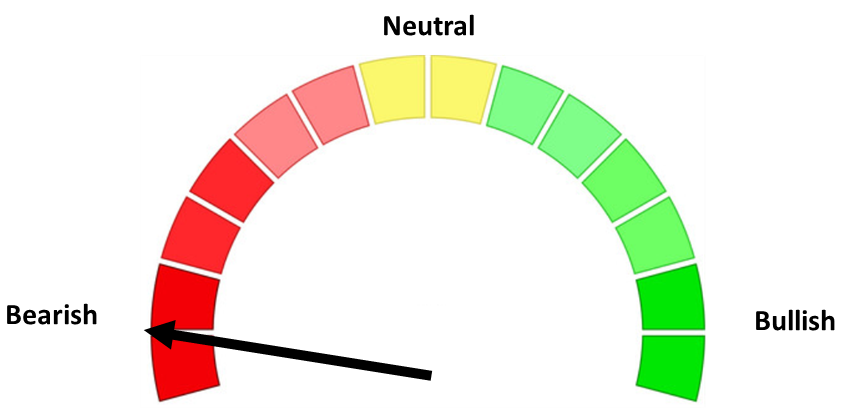
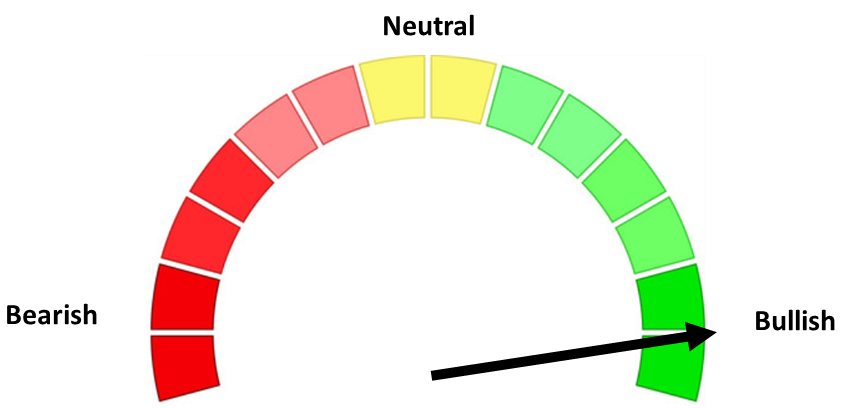
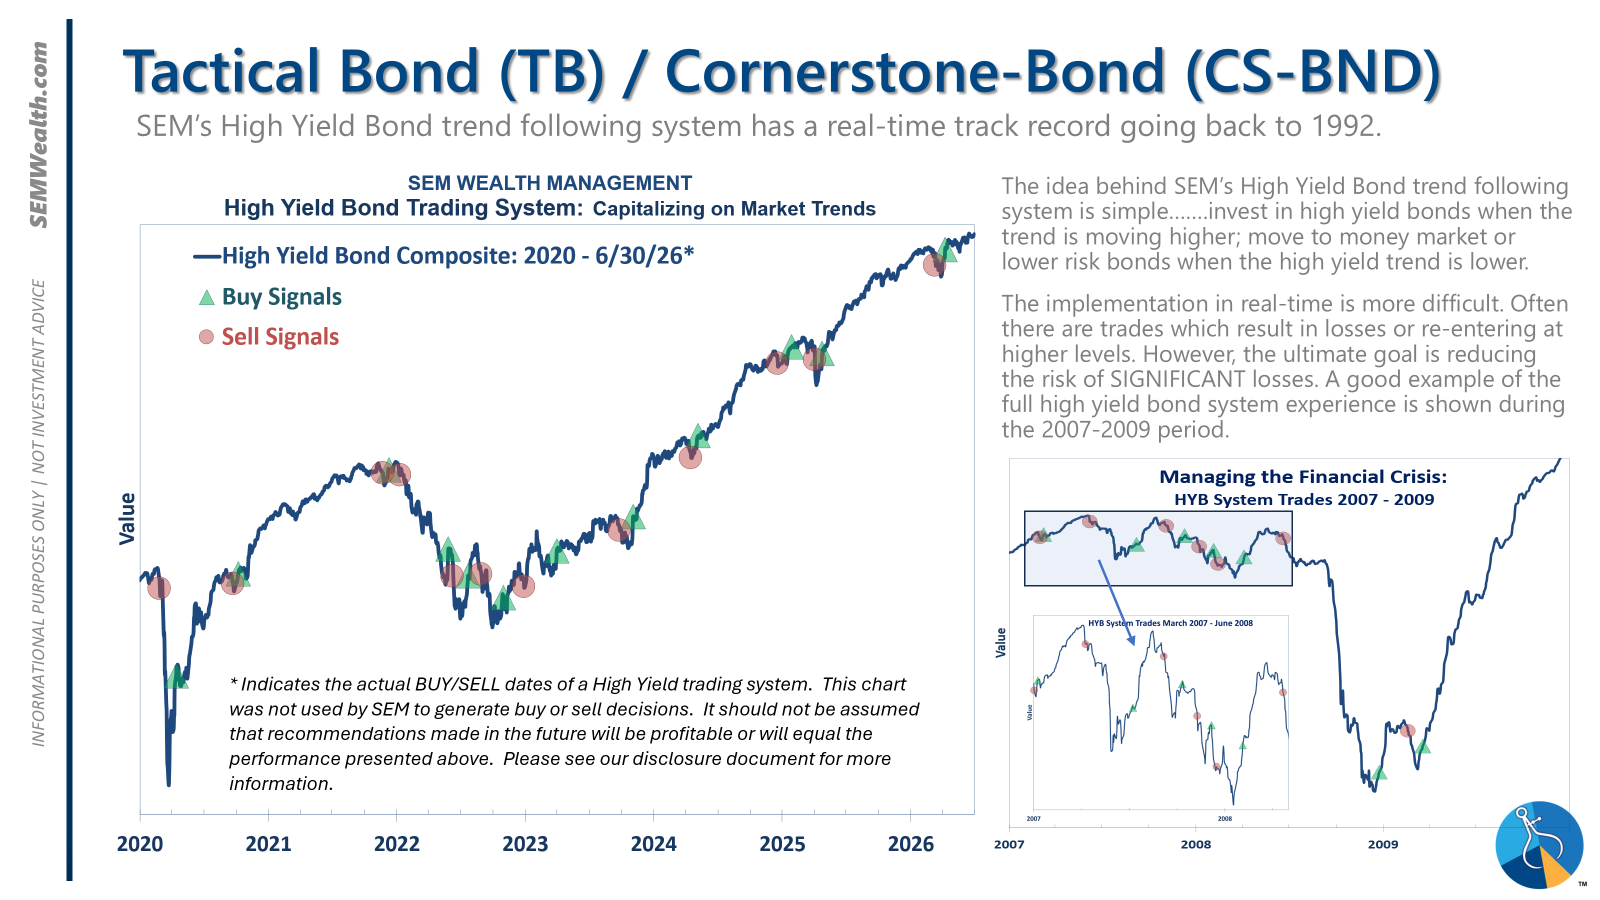
- Tactical = BULLISH | 100% High Yield Bond (4/8/2026) | High-yield spreads remain narrow but trend is slightly higher
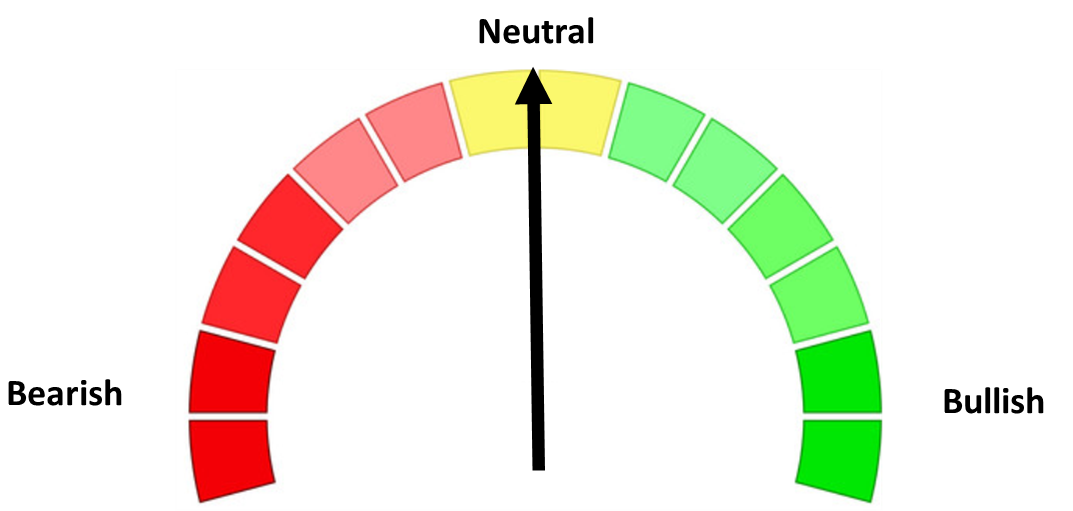
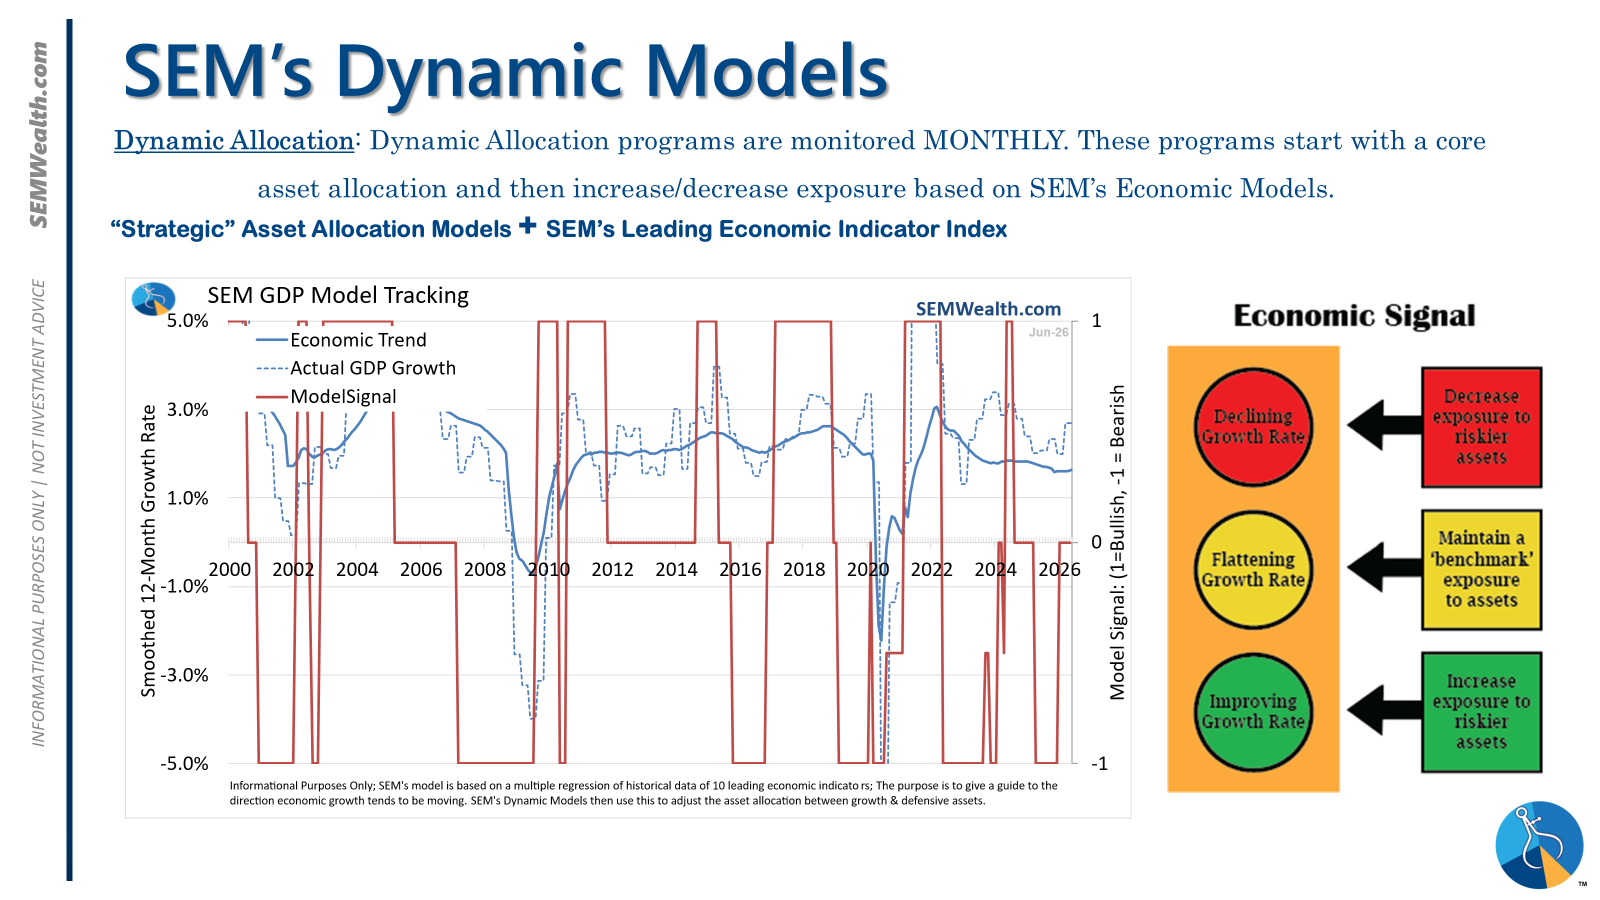
- Dynamic = NEUTRAL (2/15/2026) | "Benchmark" Allocation | Economic model inconclusive
- Strategic = BULLISH (4/15/2026) | V-Bottom projecting "end" of Iran War
Tactical (daily):
- Monitored DAILY
- Models: Tactical Bond, Cornerstone Bond, Income Allocator, Tax Advantaged Bond
- Designed to follow the trends for use in our lower risk models
- BUY Signal issued April 8, 2026 (exiting the sell from March 13)
Dynamic (monthly):
- Monitored MONTHLY
- Models: All "Dynamic" Models (Income, Balanced, Growth, and Asset Allocator)
- Uses SEM's Quantitative Economic Model
- Designed to overweight riskier assets if economic trend is higher & underweight those assets if economic trend is lower.
- NEUTRAL signal issued February 15, 2026 (following BEARISH signal from July 2025)
Strategic (quarterly)*:
- Monitored QUARTERLY
- Models: AmeriGuard (Balanced, Moderate, & Growth) and Cornerstone (Balanced & Growth)
- Core Component: Quantitative Filter using 4 different time horizons across universe of asset classes
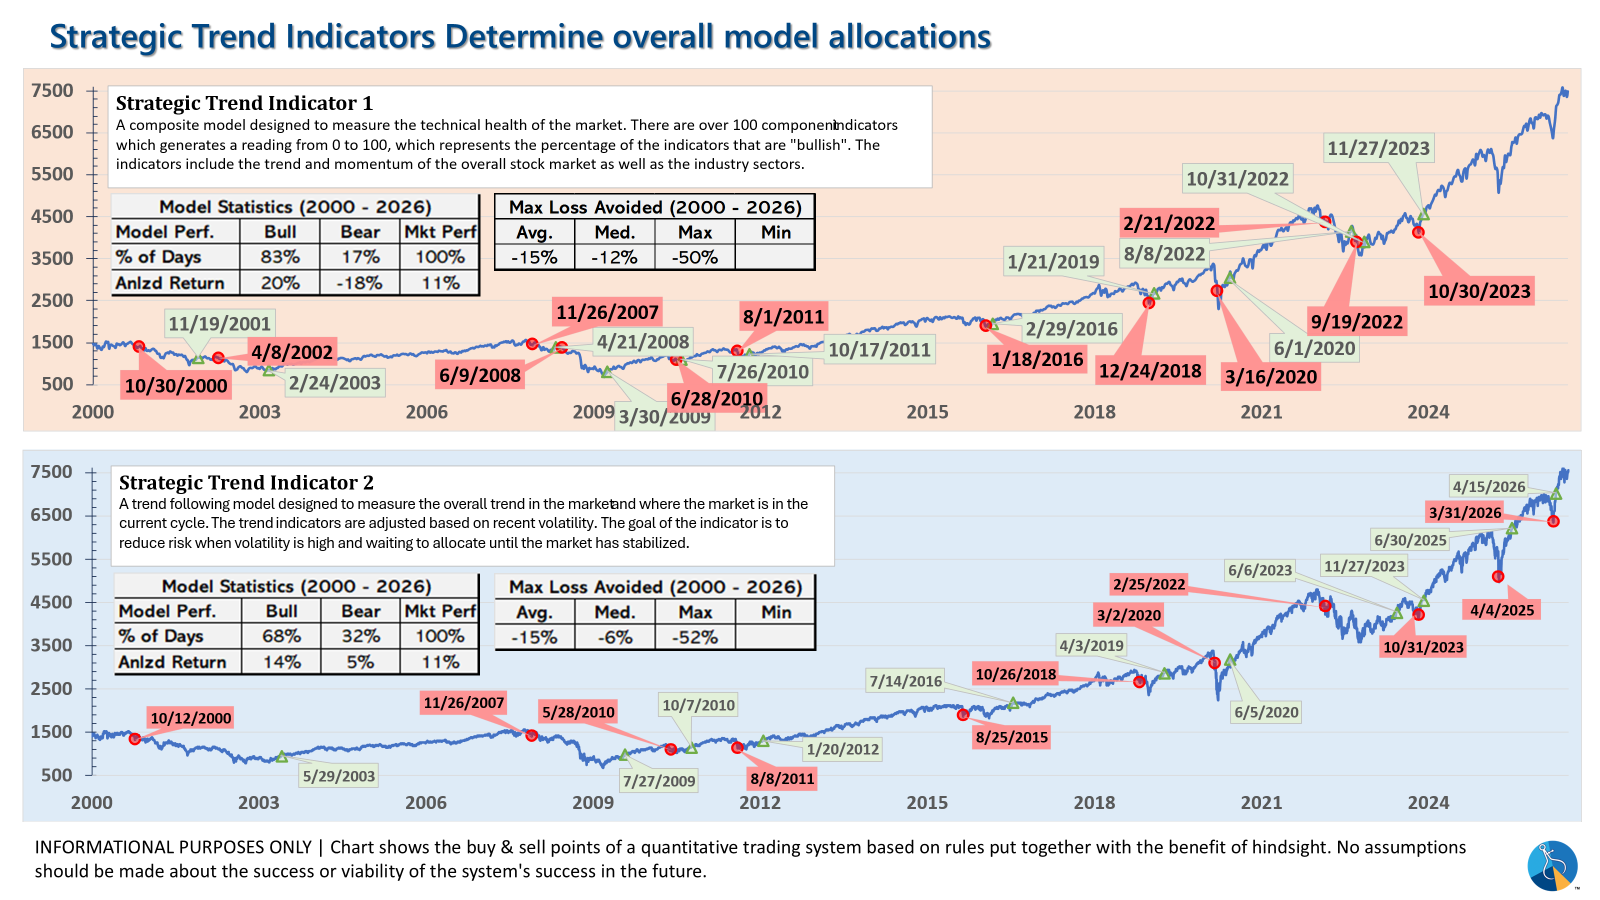
- Trend Indicator: Two different Quantitative Systems monitoring the intermediate-term trend, health of the market, and volatility
- CORE has been overweight small cap and international since October 2025 – overweight increased slightly in January
- Both TREND INDICATORS are BULLISH following 10% drop and "V-Bottom" reversal in early April
- AmeriGuard & Cornerstone Max DO NOT use the Trend indicator and are always 100% invested in stocks using our CORE rotation model.
The core rotation is adjusted quarterly. This quarter we saw half of our international positions reduced (we sold developed markets and kept our emerging markets exposure). We also saw the remaining share of mid-cap reduced in favor of more small cap exposure. We remain with a "barbell" core portfolio – about half in large cap and half in small cap as the models expect the market to "broaden".
The * in quarterly is for the trend models. These models are watched daily but they trade infrequently based on readings of where each believe we are in the cycle. The trend systems can be susceptible to "whipsaws" as we saw with the recent sell and buy signals at the end of October and November. The goal of the systems is to miss major downturns in the market. Risks are high when the market has been stampeding higher as it has for most of 2023. This means sometimes selling too soon. As we saw with the recent trade, the systems can quickly reverse if they are wrong.
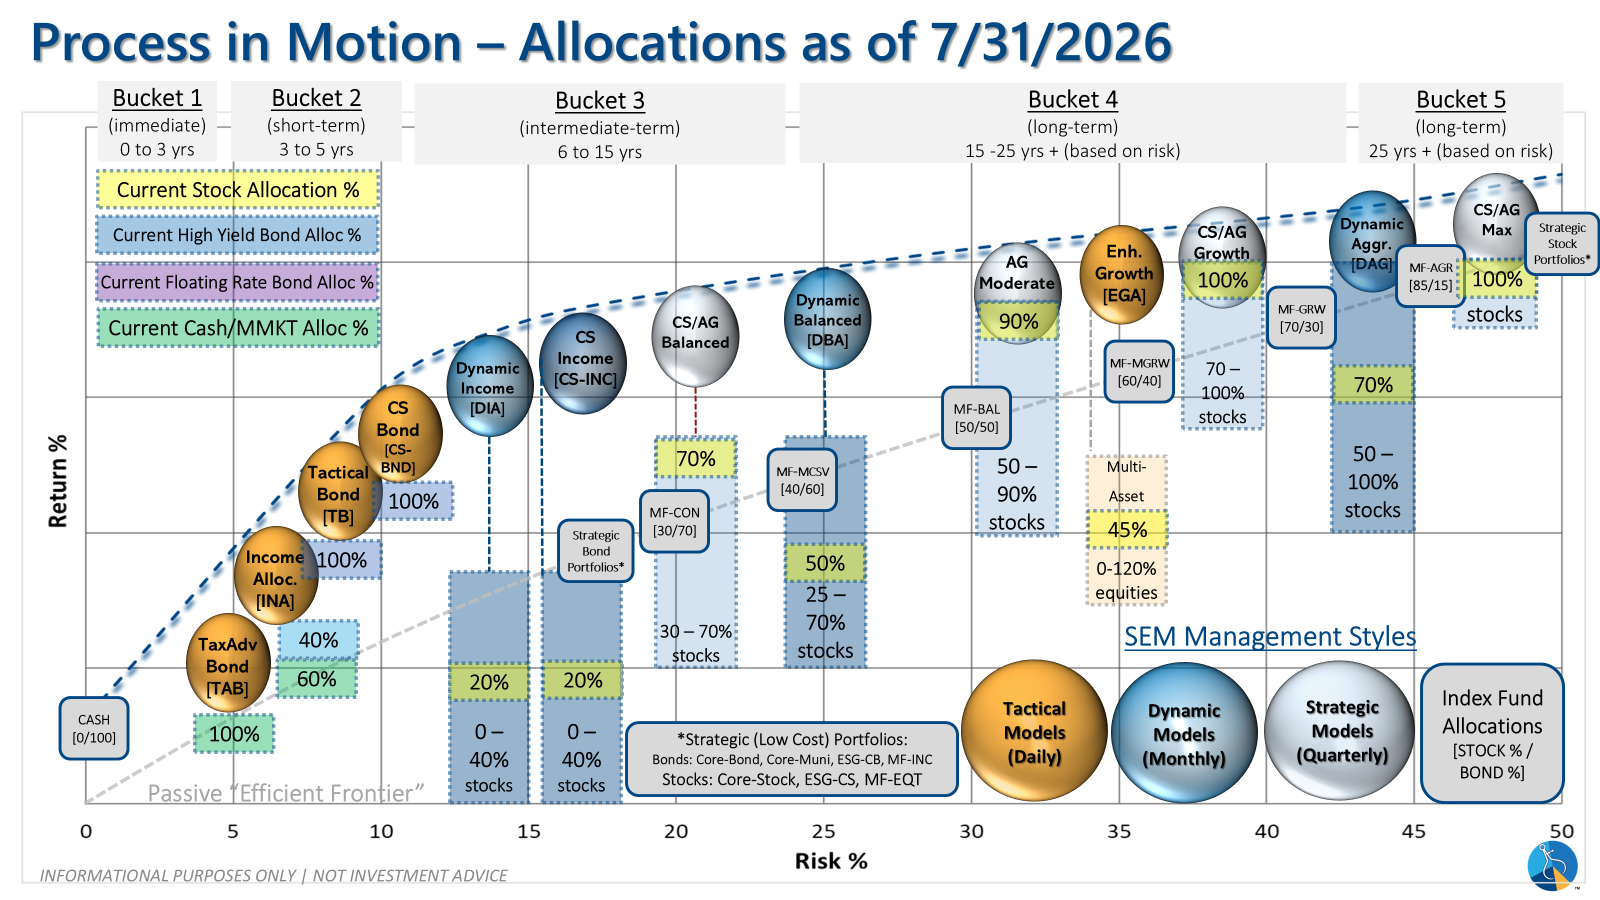
Overall, this is how our various models stack up based on the last allocation change:
Curious if your current investment allocation aligns with your overall objectives and risk tolerance?