Inflation is one of the most difficult things to understand. I won't spend the time this week trying to explain it. After week's of blog word counts which got completely away from me, I'm trying to keep my portion brief this week. Last week I delivered my "AI: Boom, Bubble, or Both" keynote to a large group of advisors in Pennsylvania. It was within driving distance (5 hours with traffic). When we left on Wednesday gas prices were $4.09 here. When we got back, they had jumped to $4.19. I about choked when I saw diesel prices over $6.50. Needless to say, the fall RV trips have been pushed to next year at these prices.
Inflation is on all of our minds and with the Fed meeting this week, let's take a look at the 3 arguments I heard last week about inflation.
Inflation is ?????
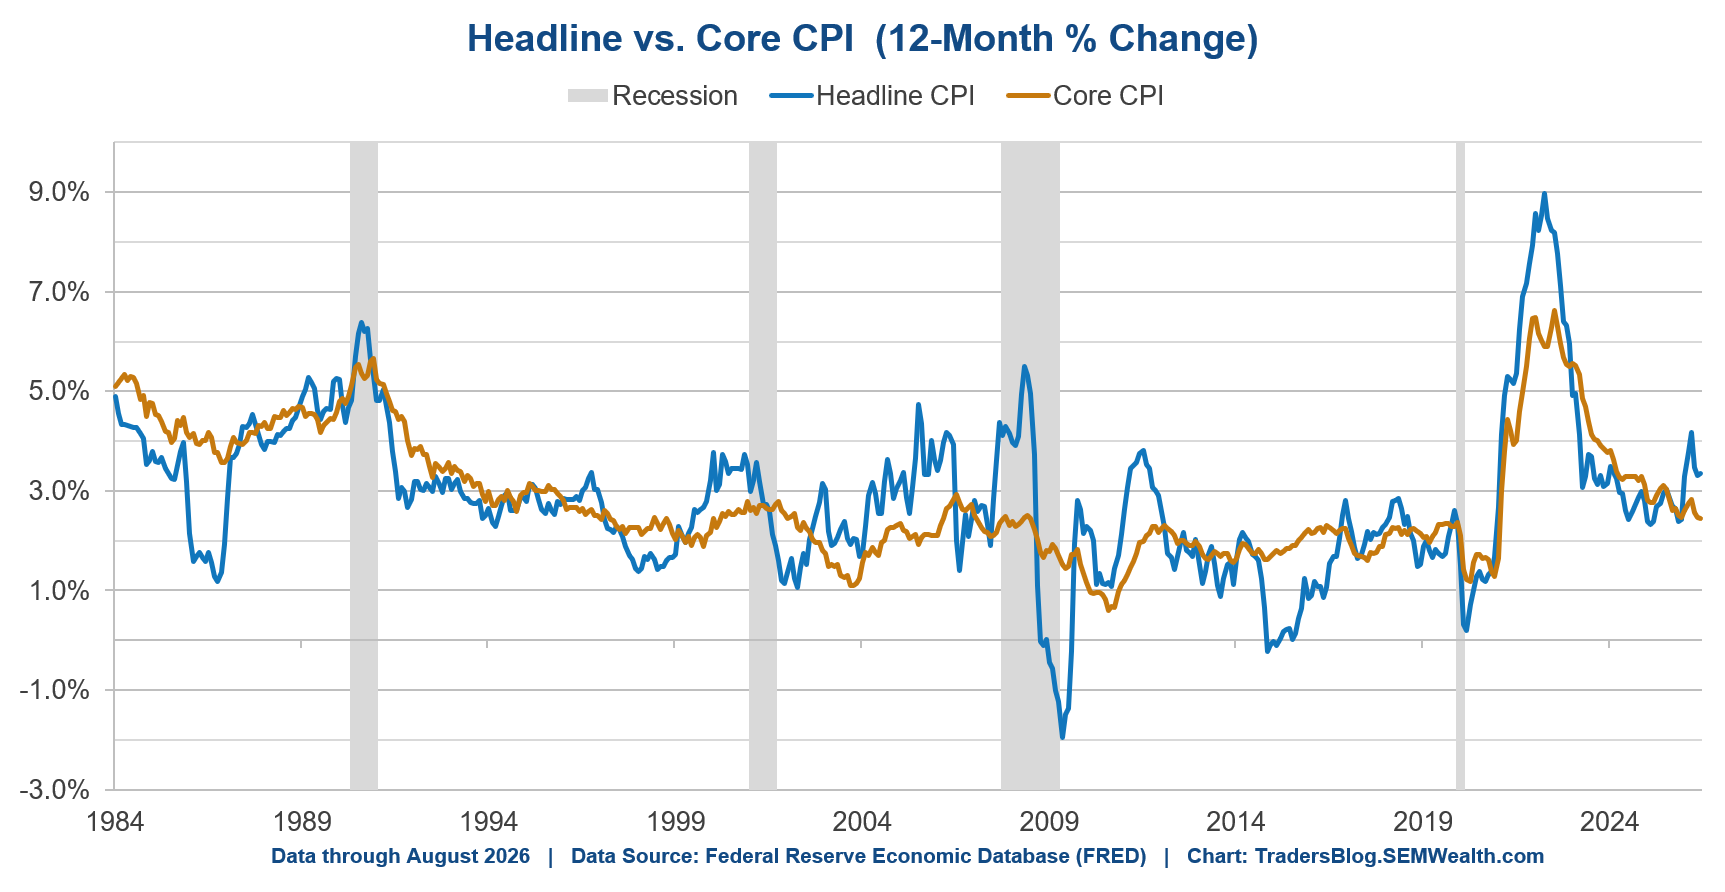
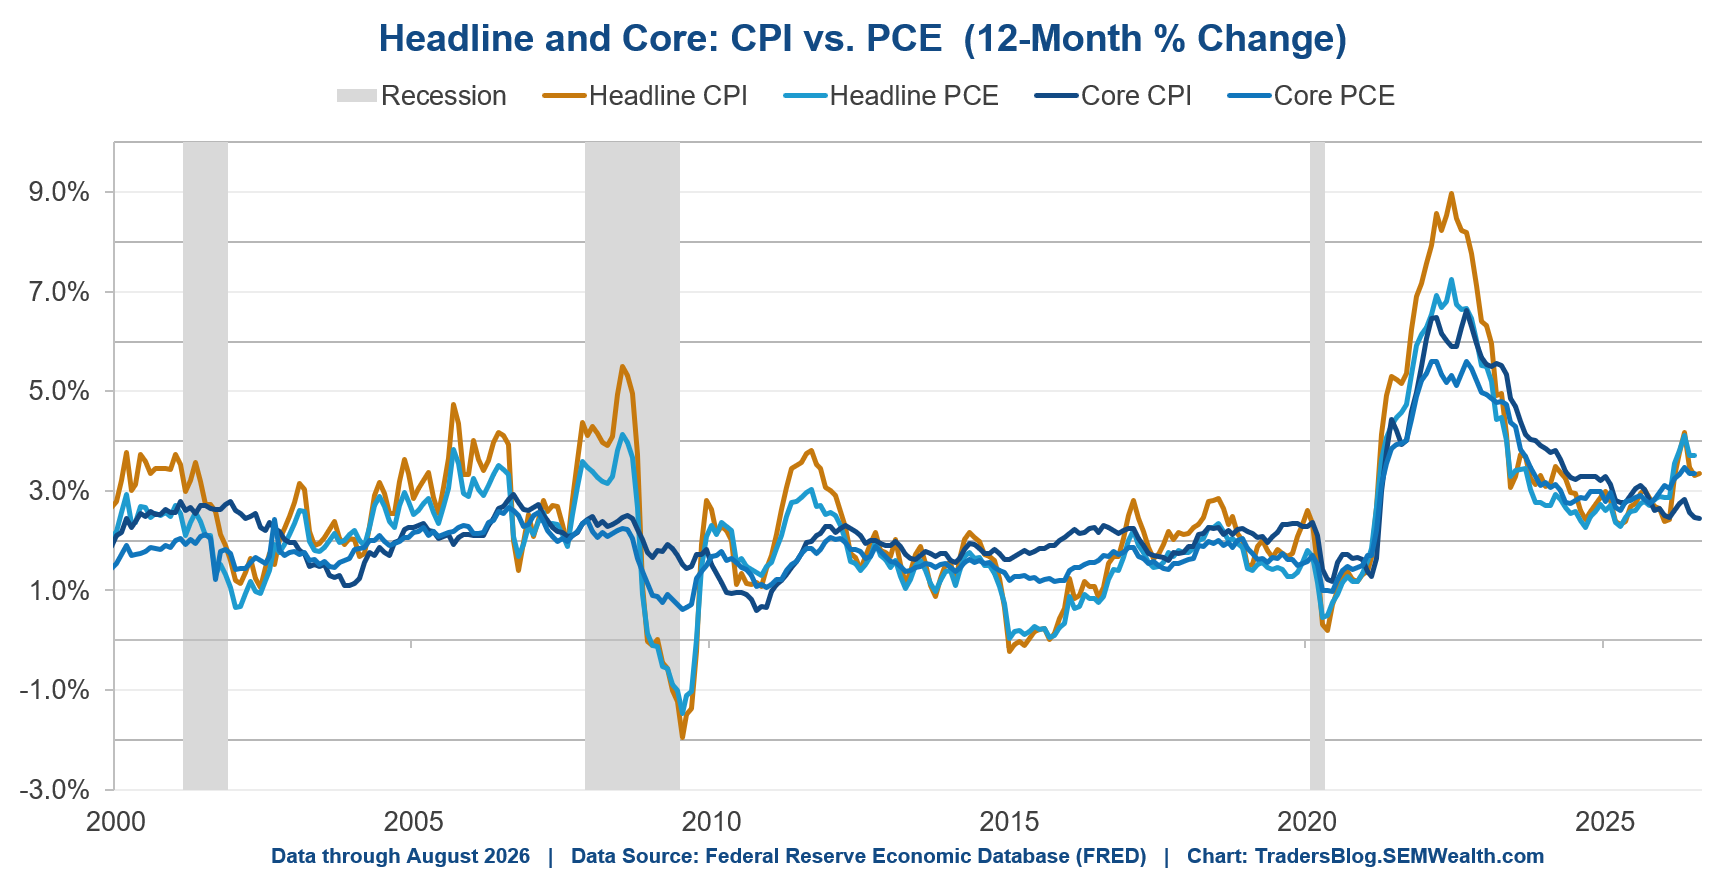
Based on who was the one explaining it, the CPI report on Friday showed inflation was coming down as expected, inflation was temporarily high due to the war in Iran, or inflation has become structural due to the AI/Data Center buildout. Can all 3 be right?
First, here's the data. Remember "headline" is what we pay. Core excludes food and energy (the items that absorb a large chunk of the budget for middle class households)
Inflation is "coming down"
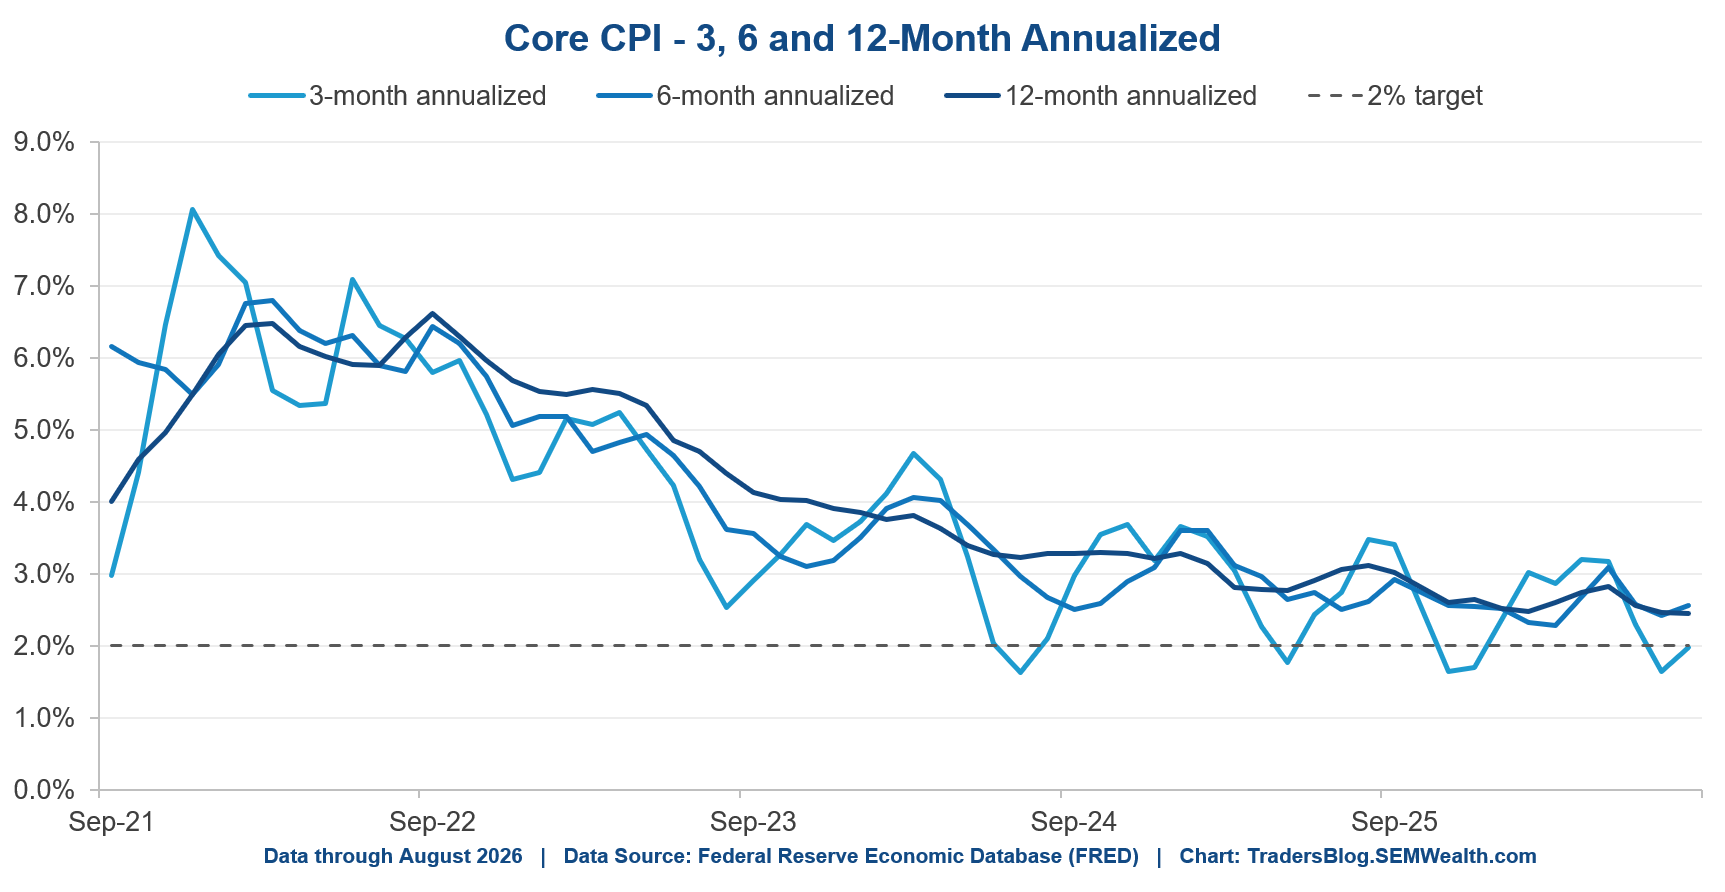
This group is probably using this chart, which shows "Core" (no food and energy). The 3-month ANNUALIZED rate is below 2%, so I guess they are right.
Inflation is "temporary"
Food & energy are a big part of the stack, so the "inflation is temporary" crowd can point to that.
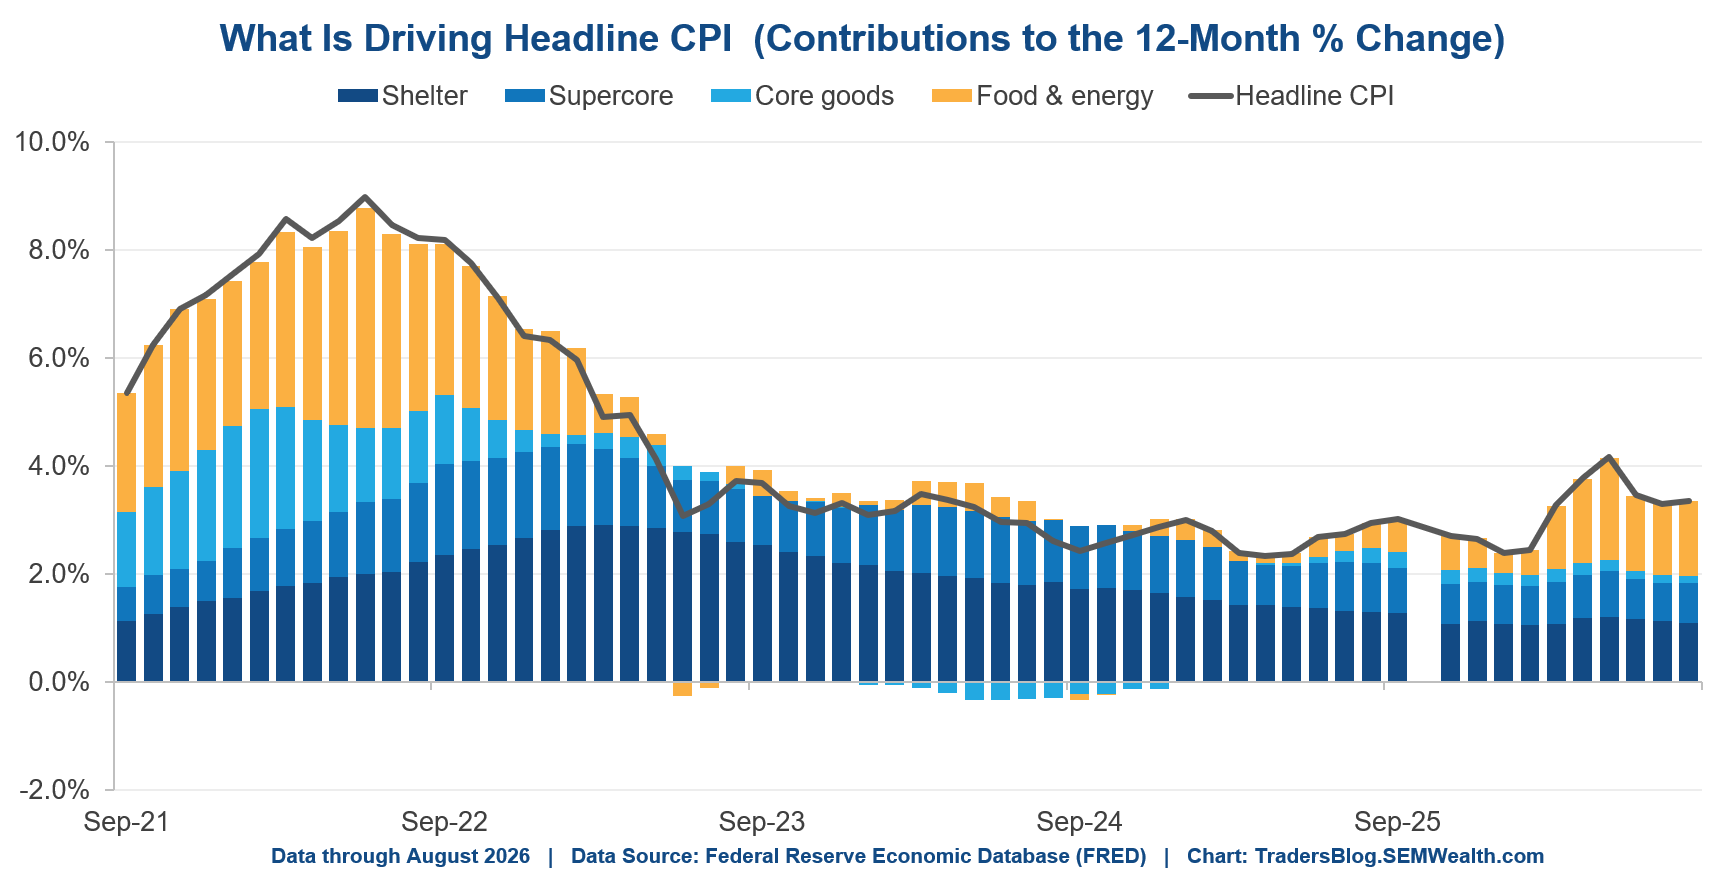
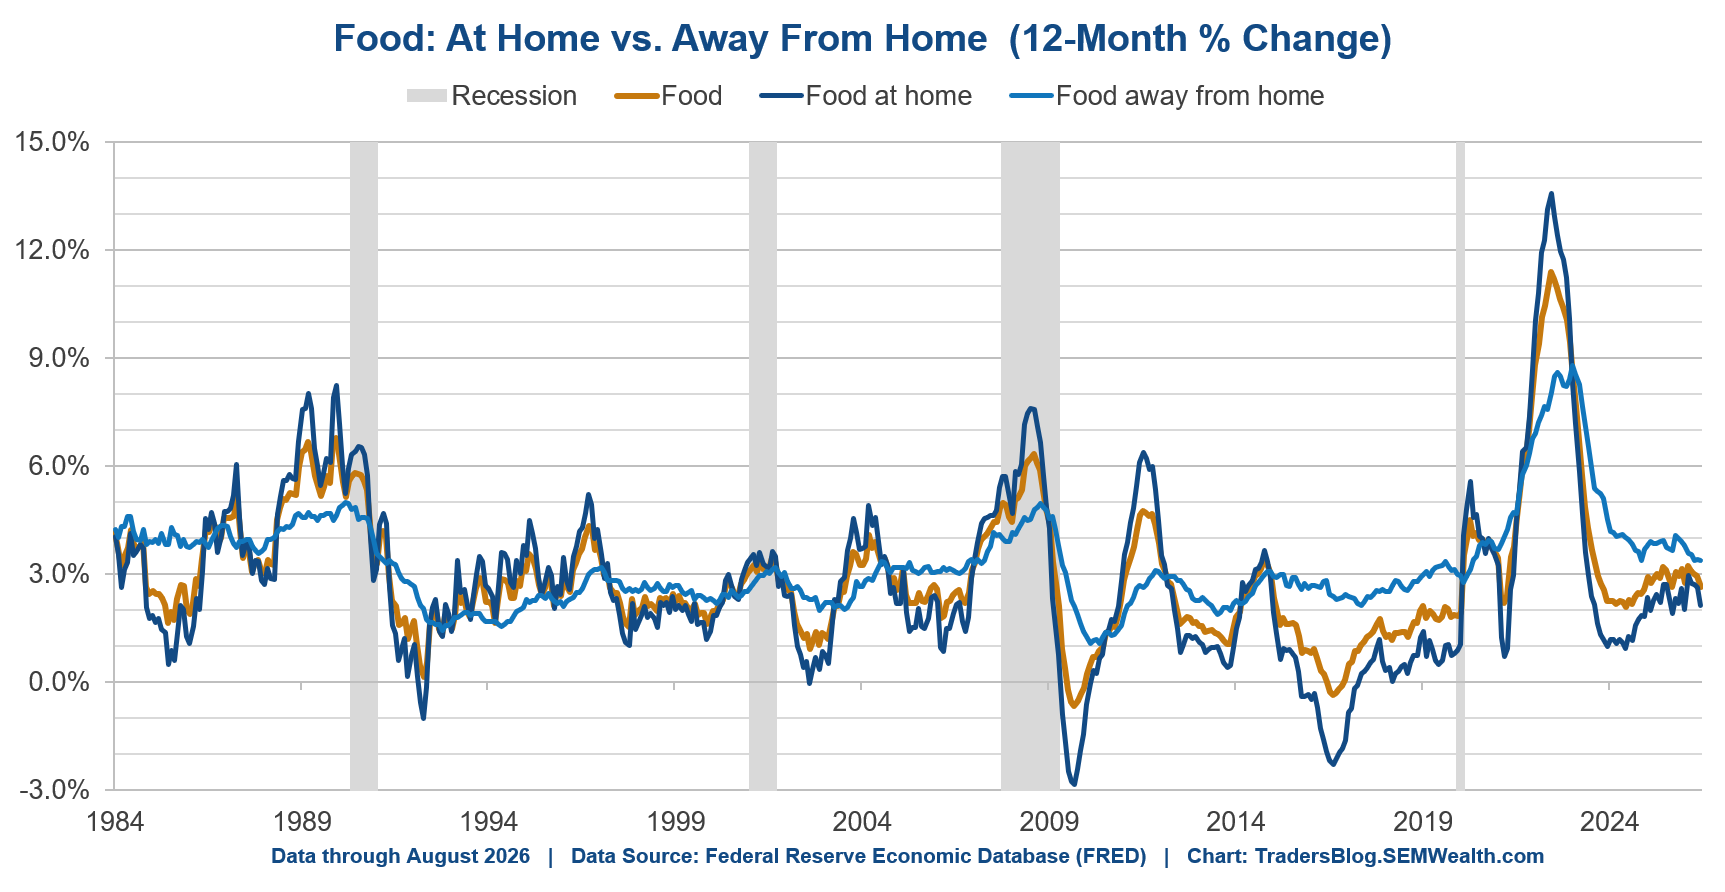
Even better, the overall "food" category is coming down and right around 2%.
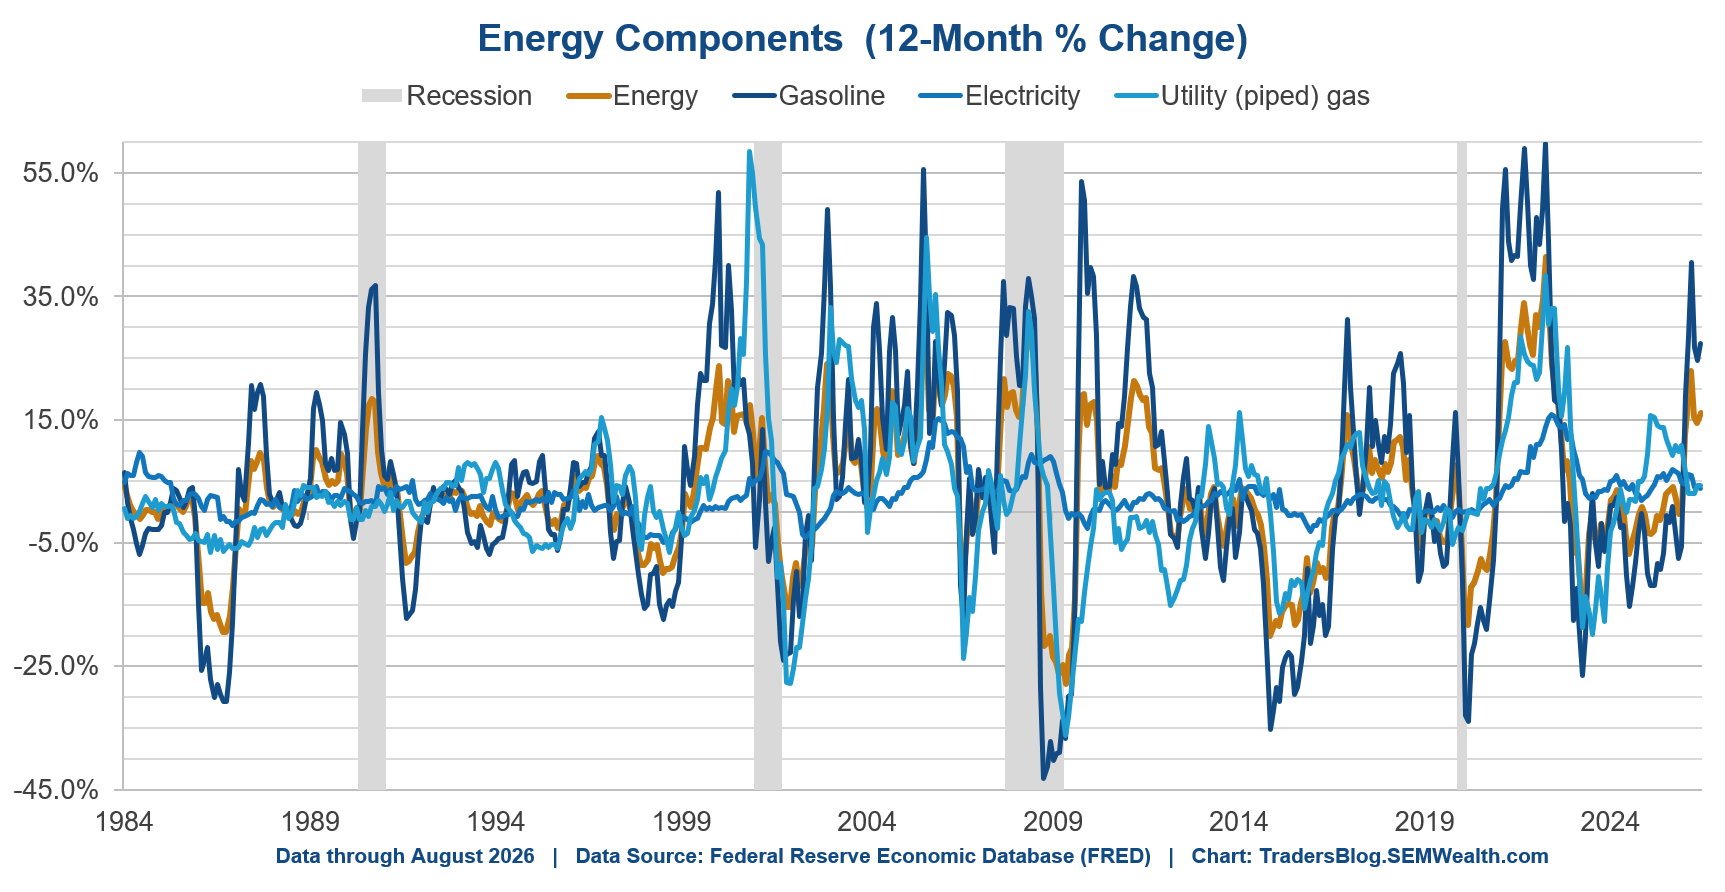
It's the energy portion that is the problem. Maybe when/if the war with Iran is over, this will come down.
Inflation has become structural
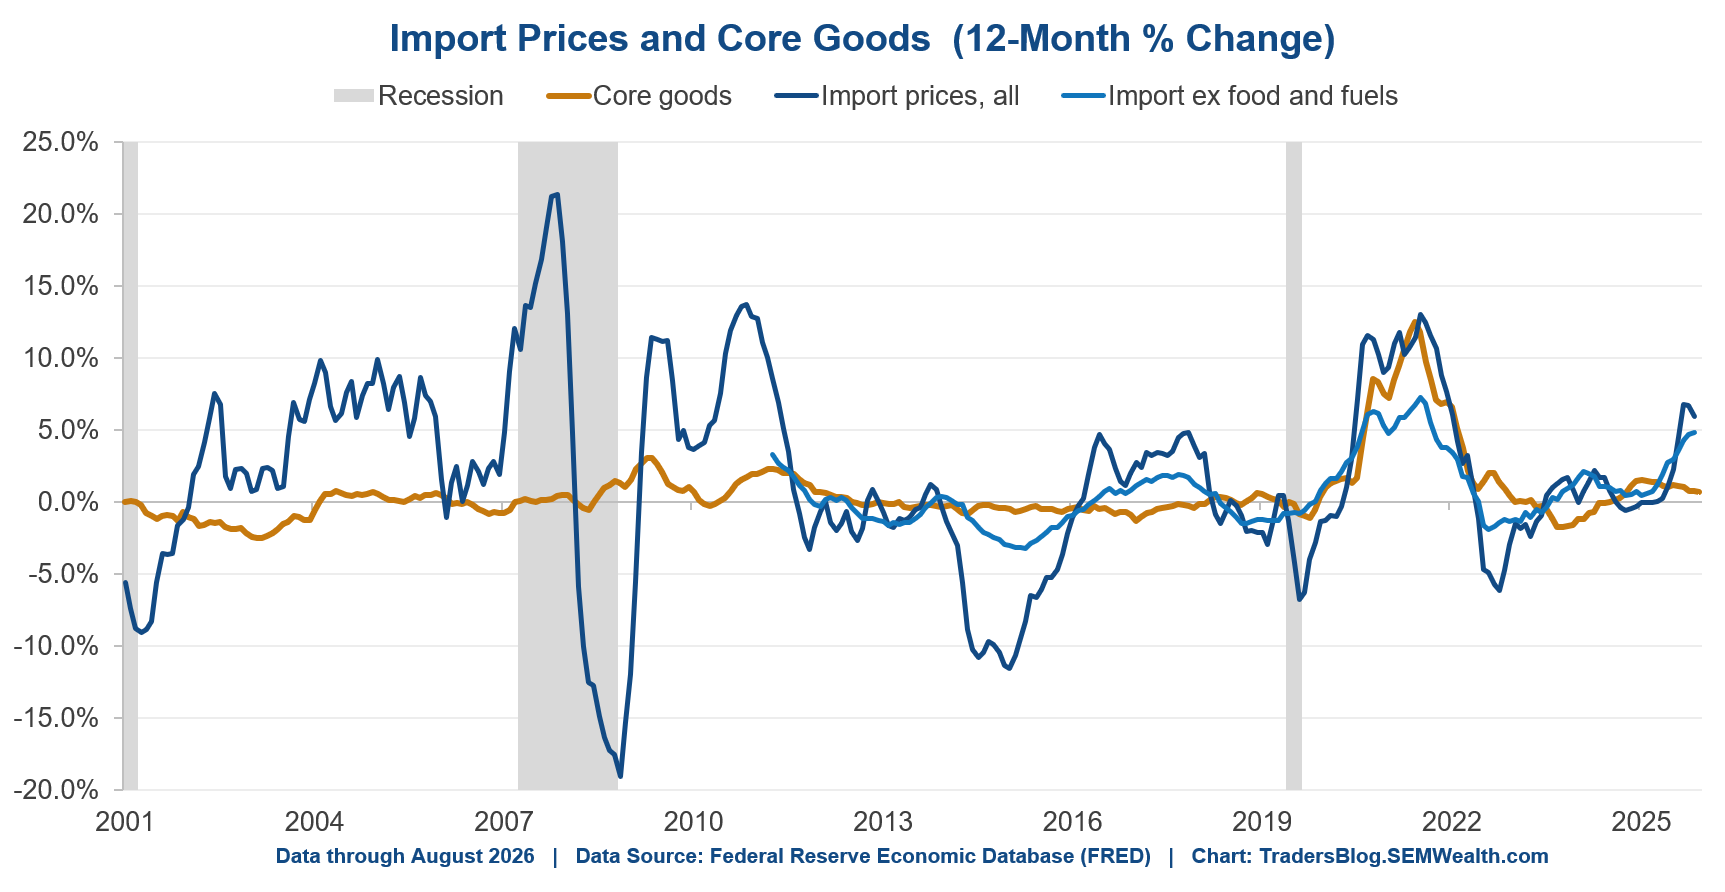
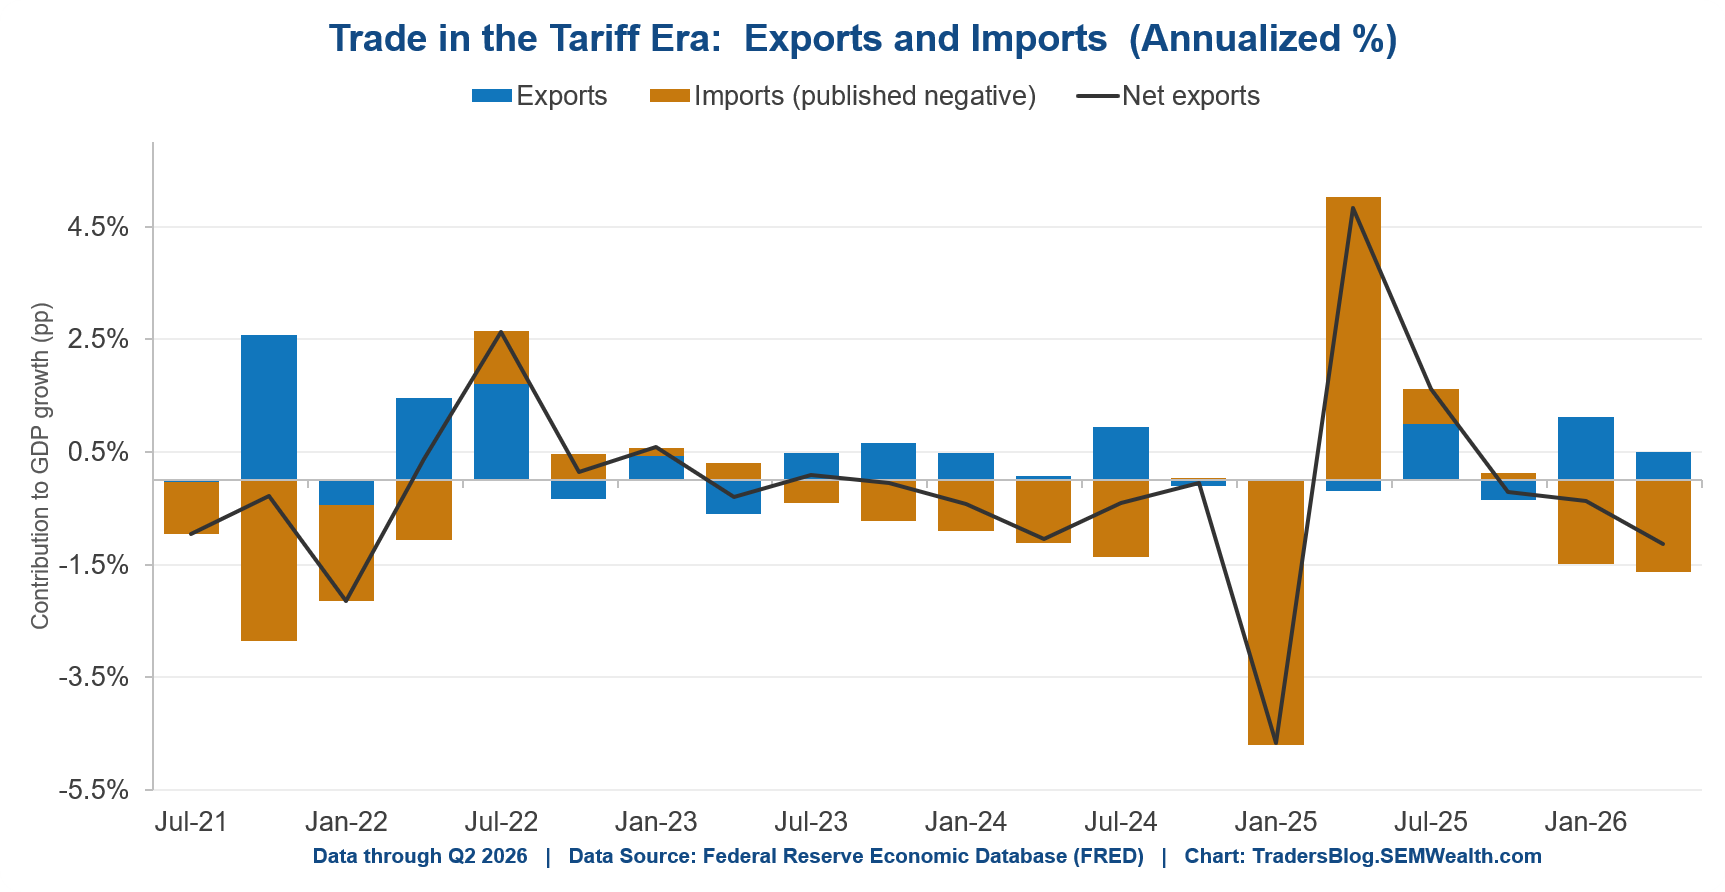
This group can point to a few places. The first is producer prices, especially the prices of imported goods. This is NOT a tariff related issue as we will discuss shortly.
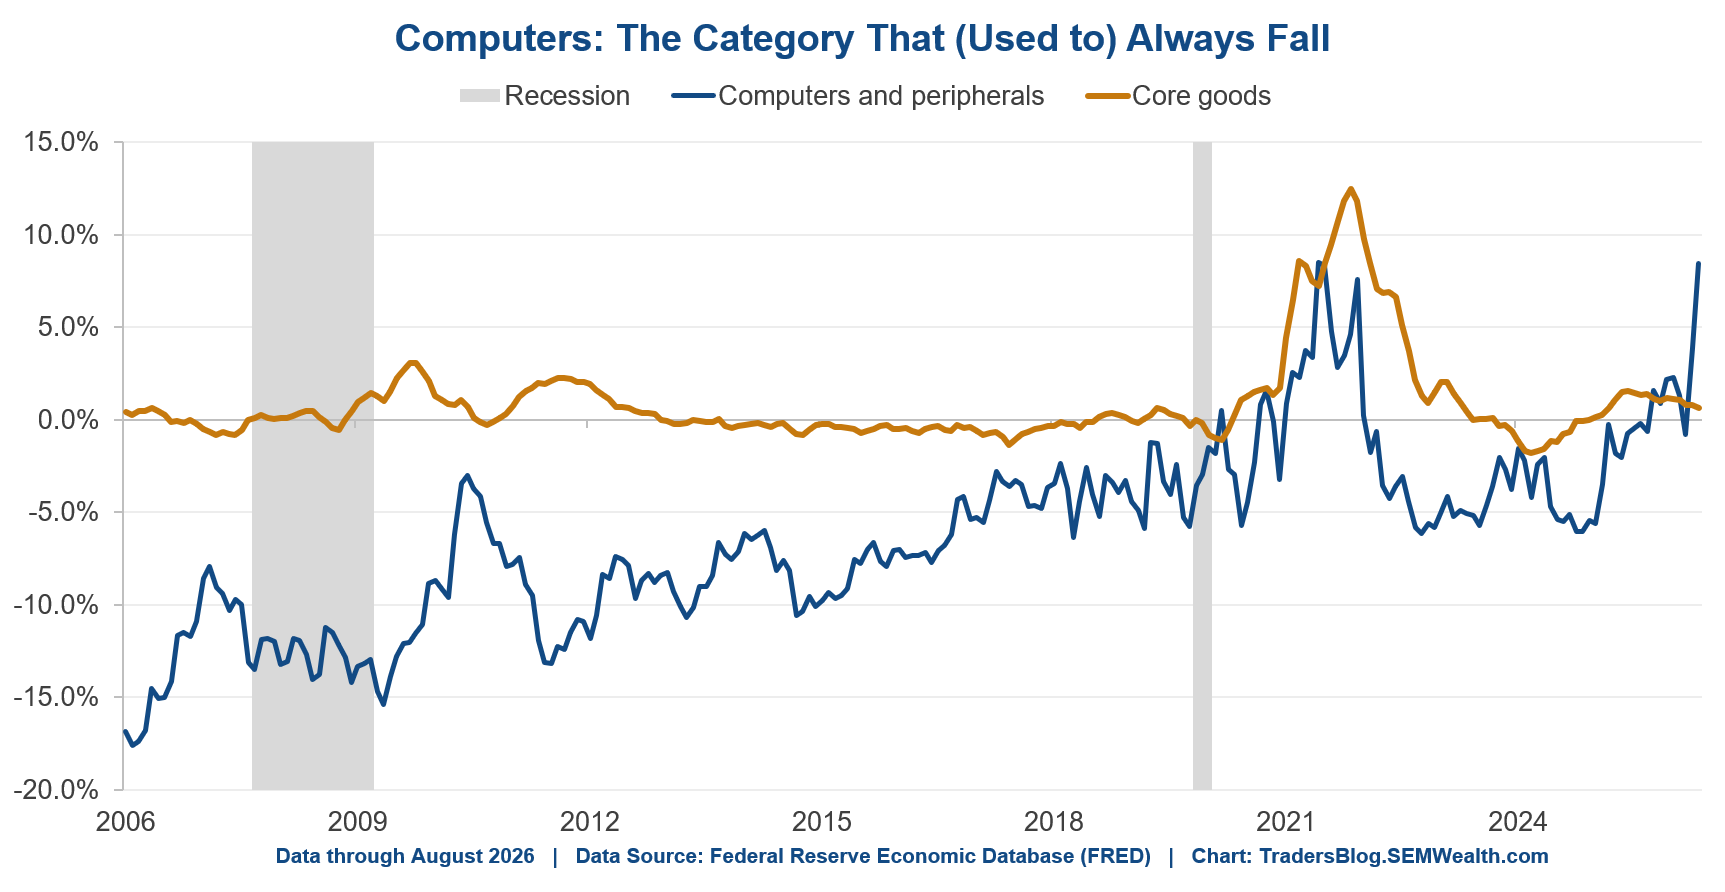
We've been talking on and off about the inflationary pressures of the AI/Data Center build-out. We can see some of this in the prices of computers and peripherals, a category that usually sees prices falling.
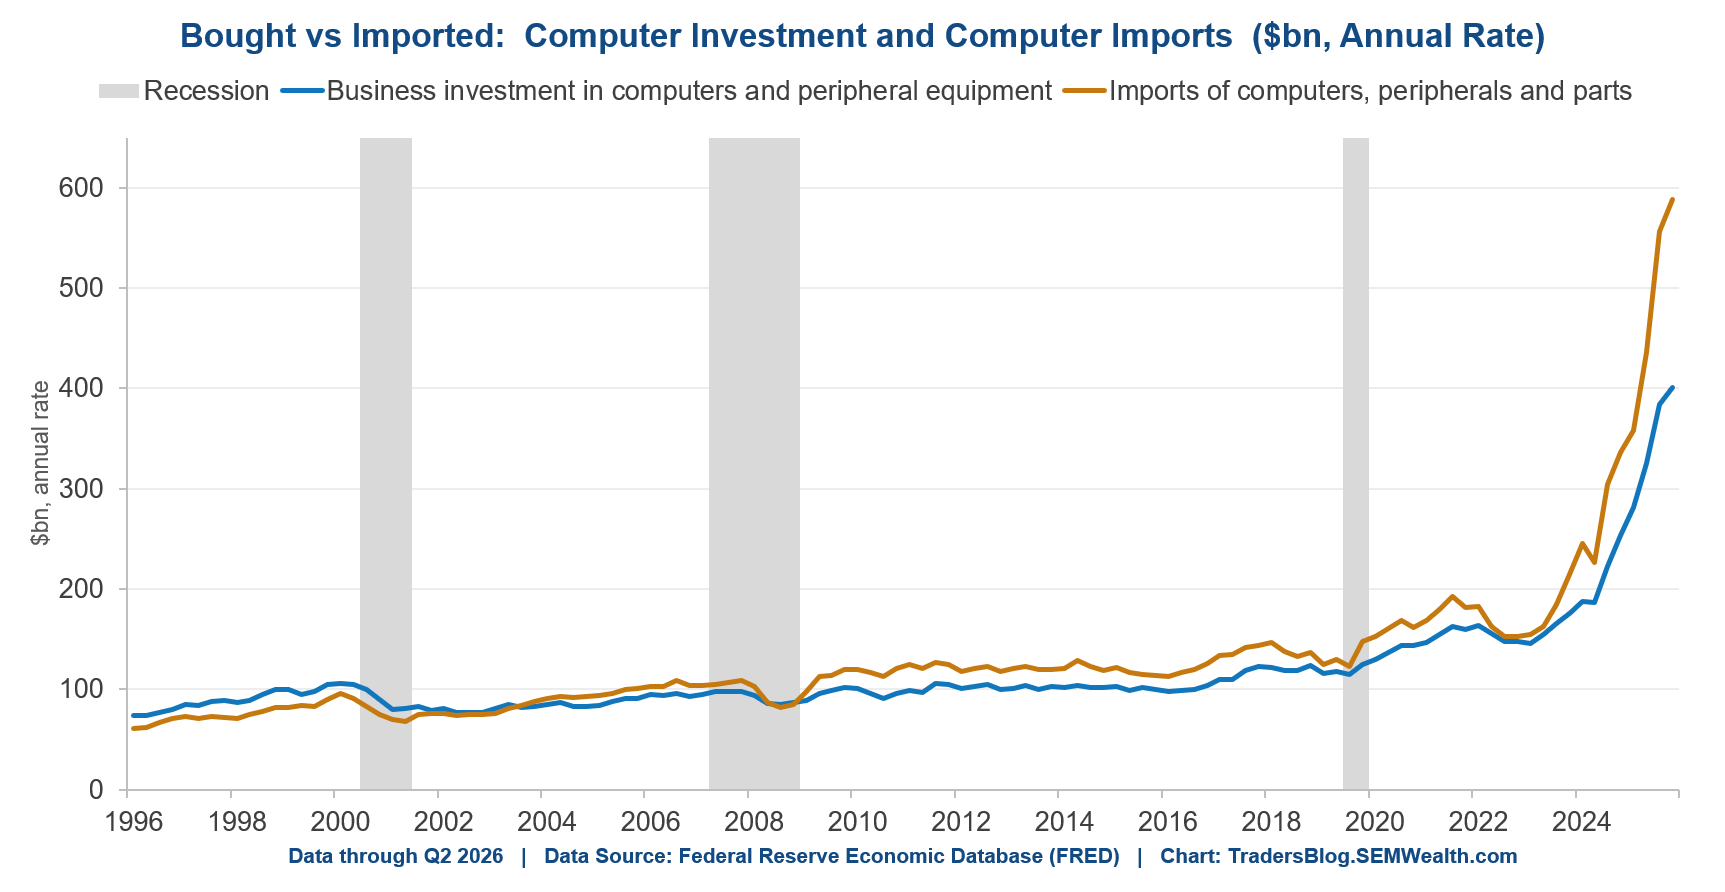
This chart from the GDP data highlights how much we are importing in this category (and the reason our trade deficit has been increasing).
Inflation is Difficult to Diagnose
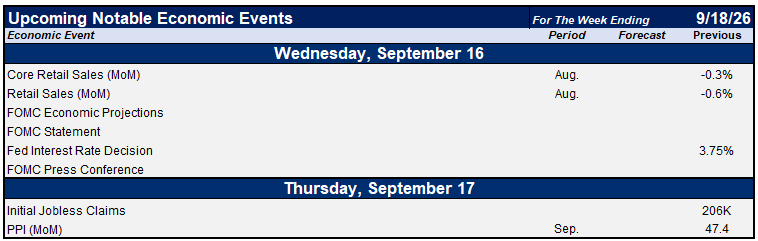
I've also said versions of this plenty of times, "I'm glad I'm not the Fed chair." You can make a case for any of the above being "right", but we won't know until we have the benefit of hindsight. The Fed says they (for now) prefer the PCE inflation rate over CPI, but they won't have August prices until after their meeting. PCE was showing higher inflation readings than the CPI, so with CPI coming in the same, I would argue (based on the limited 'messaging' Chair Warsh has given us and the signals the market is giving the Fed (something he said he was watching.....more on that below), the Fed probably needs to raise rates at least once if they truly are serious about inflation.
What is the market saying?
If the Fed is watching the messages from the markets, I believe they are being told they need to raise rates. Short-term rates jumped on Friday following the CPI release. The yield curve across the board was higher for the week and has pushed significantly higher since the last Fed meeting.
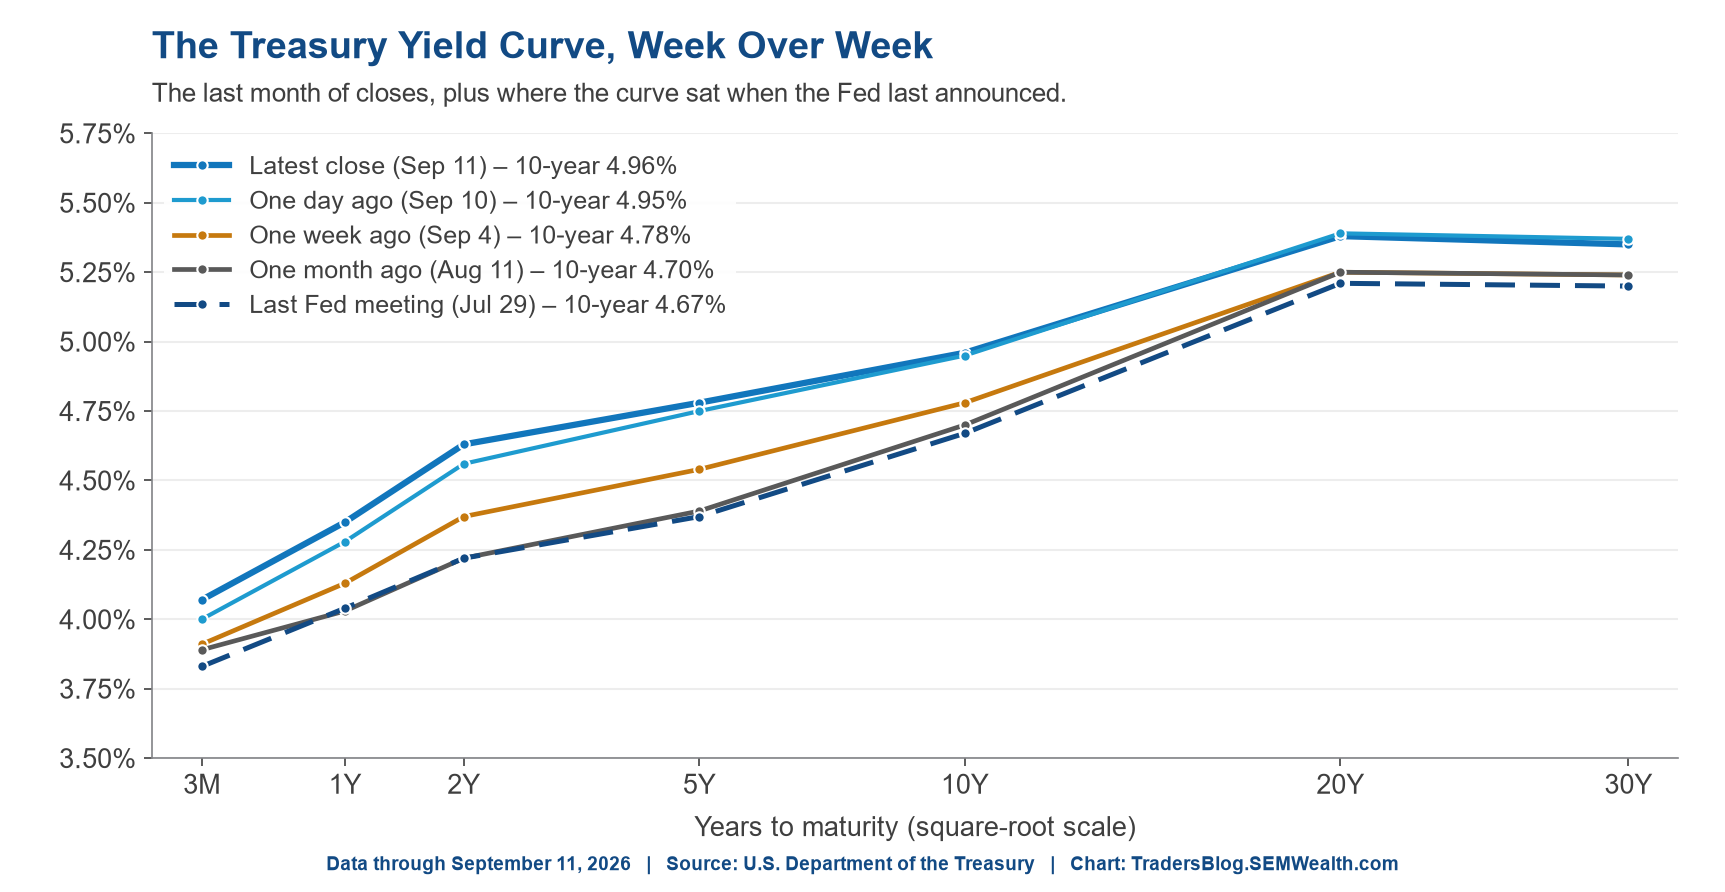
I guess one could argue (and maybe Chair Warsh or members of the Fed will say this when them are meeting) the market is doing the Fed's work for them. They've already raised rates. The bigger problem is WHY the market is raising rates. This chart shows us the two components to Treasury Yields – inflation expectations and REAL rates (what you earn after inflation).
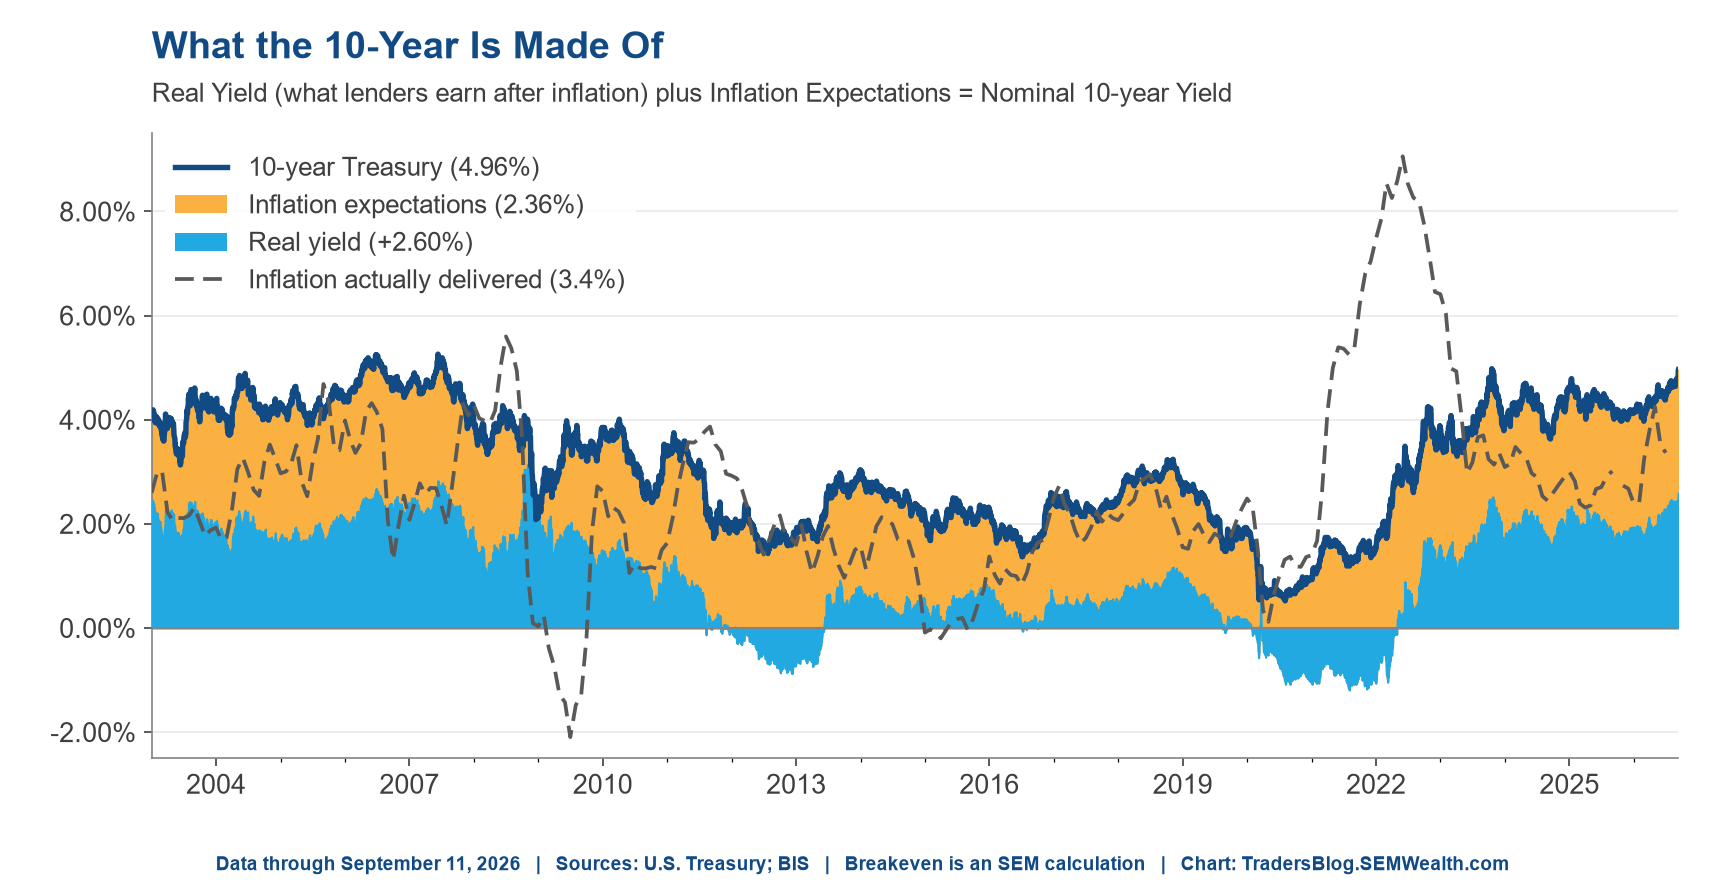
If we look at what is changing recently, it is not inflation expectations. The big move up the last 3 months is the "real yield".
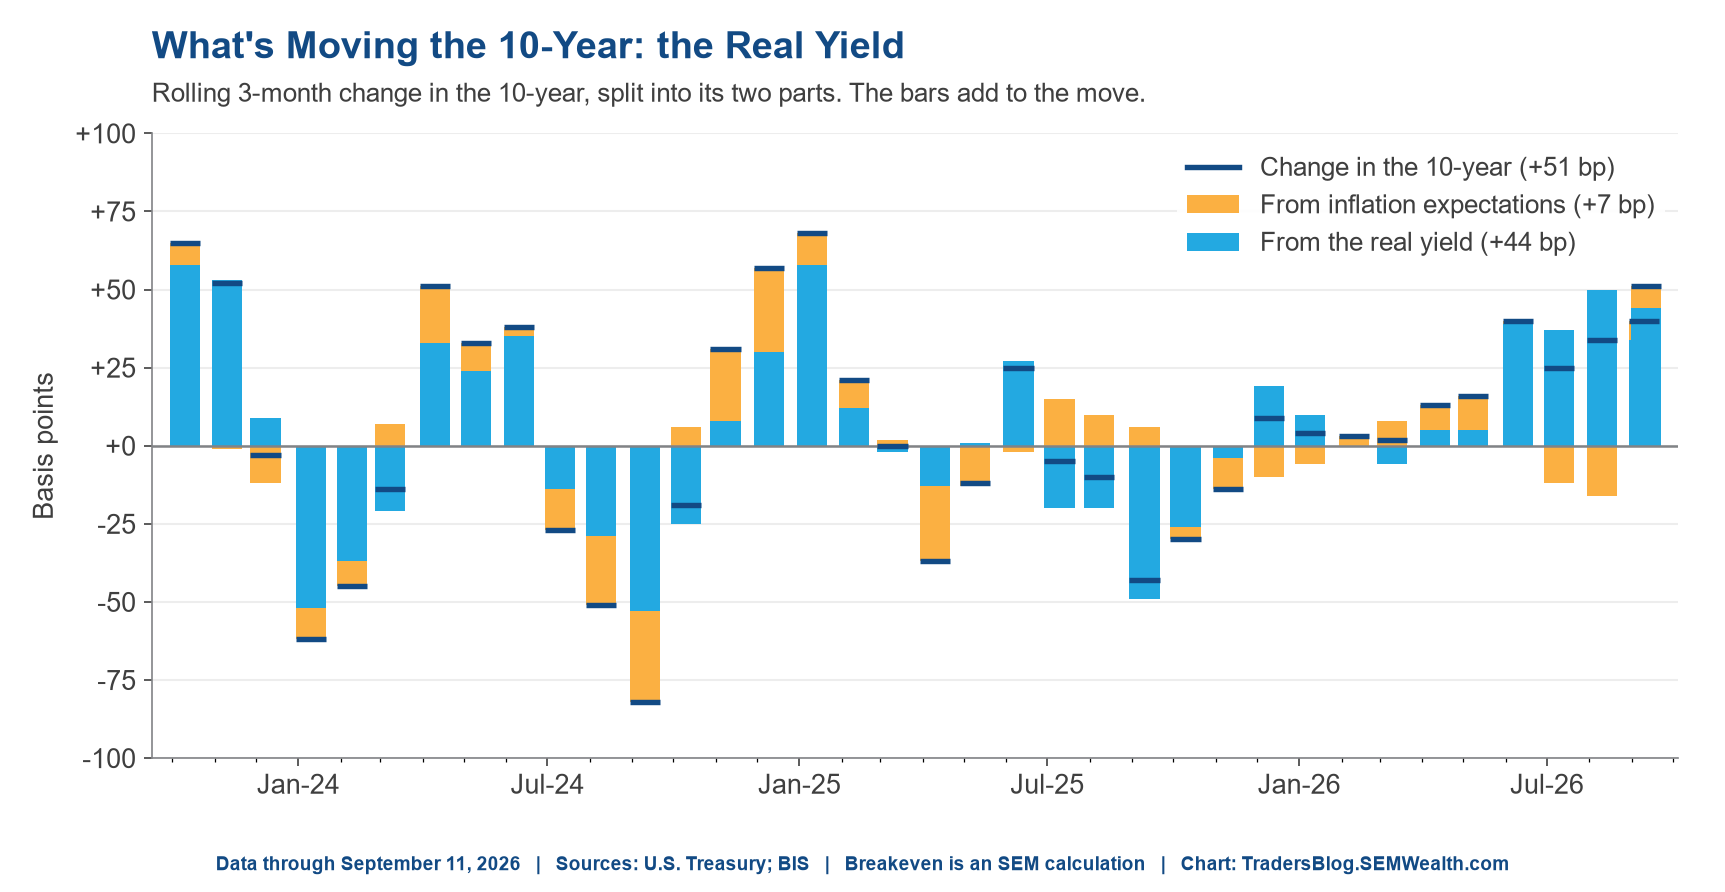
There are several reasons this could be happening (including multiple reasons):
1.) Stronger economic growth (or a jump in productivity)
2.) Higher Fed rates for longer than expected
3.) Demanding higher compensation for holding Treasuries
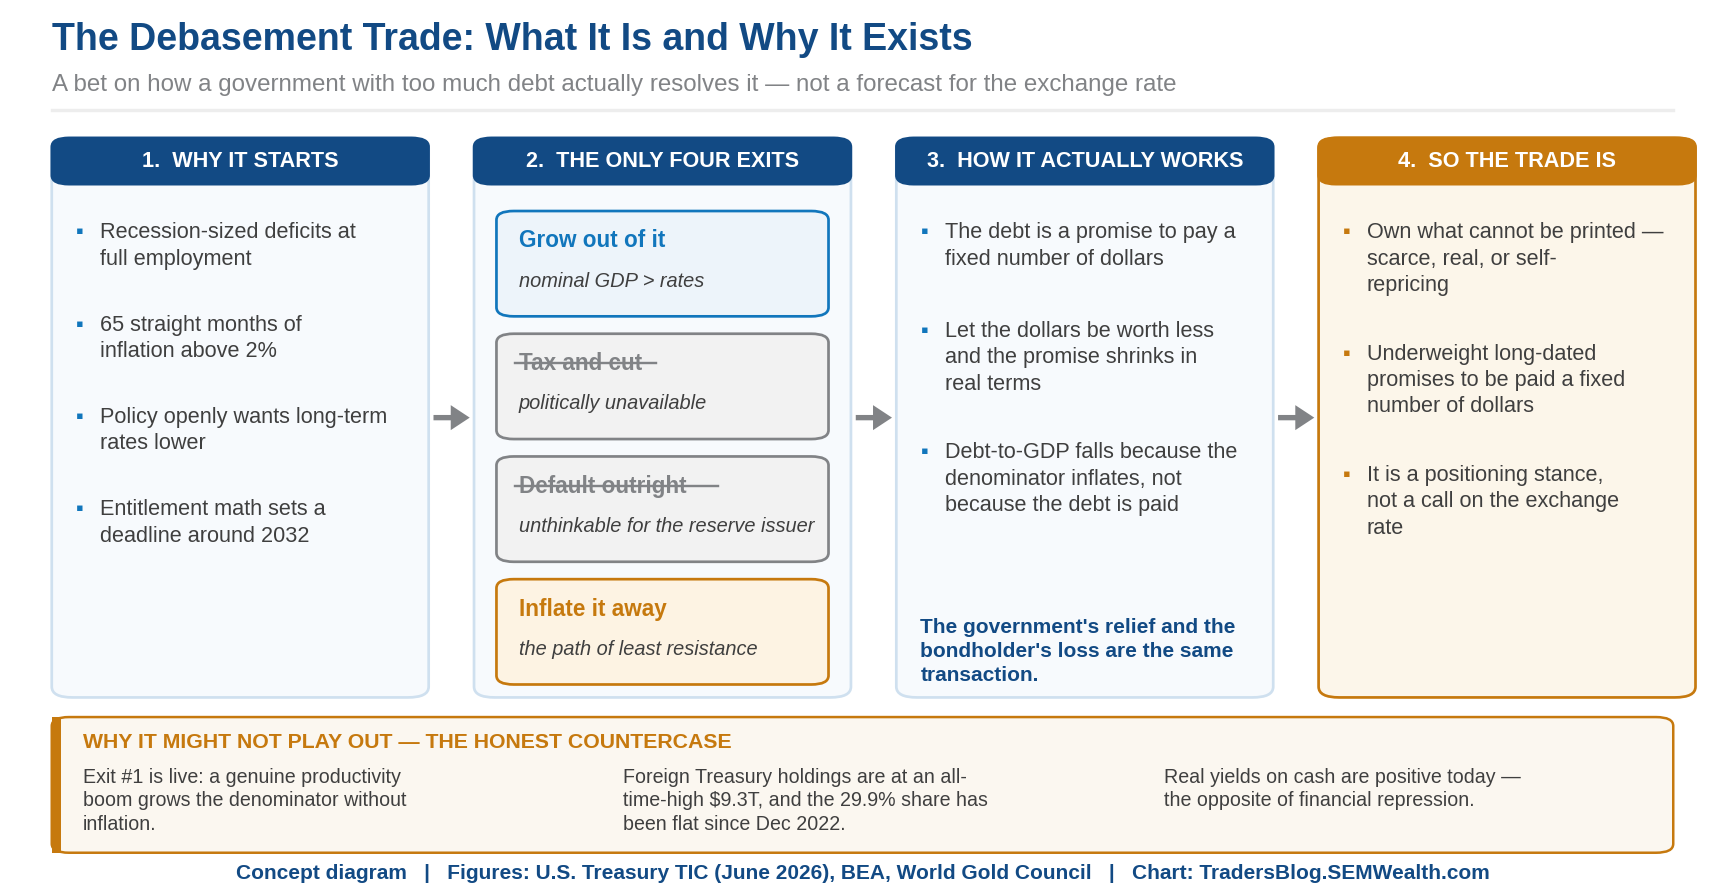
All could be the case with various degrees. The last one comes down to the "debasement trade" I discussed a few weeks back. Here's a table I used on an advisor call last week. Essentially, the "demand" for higher compensation comes down to too much debt, inflation that is too high, and little being done to fix either.
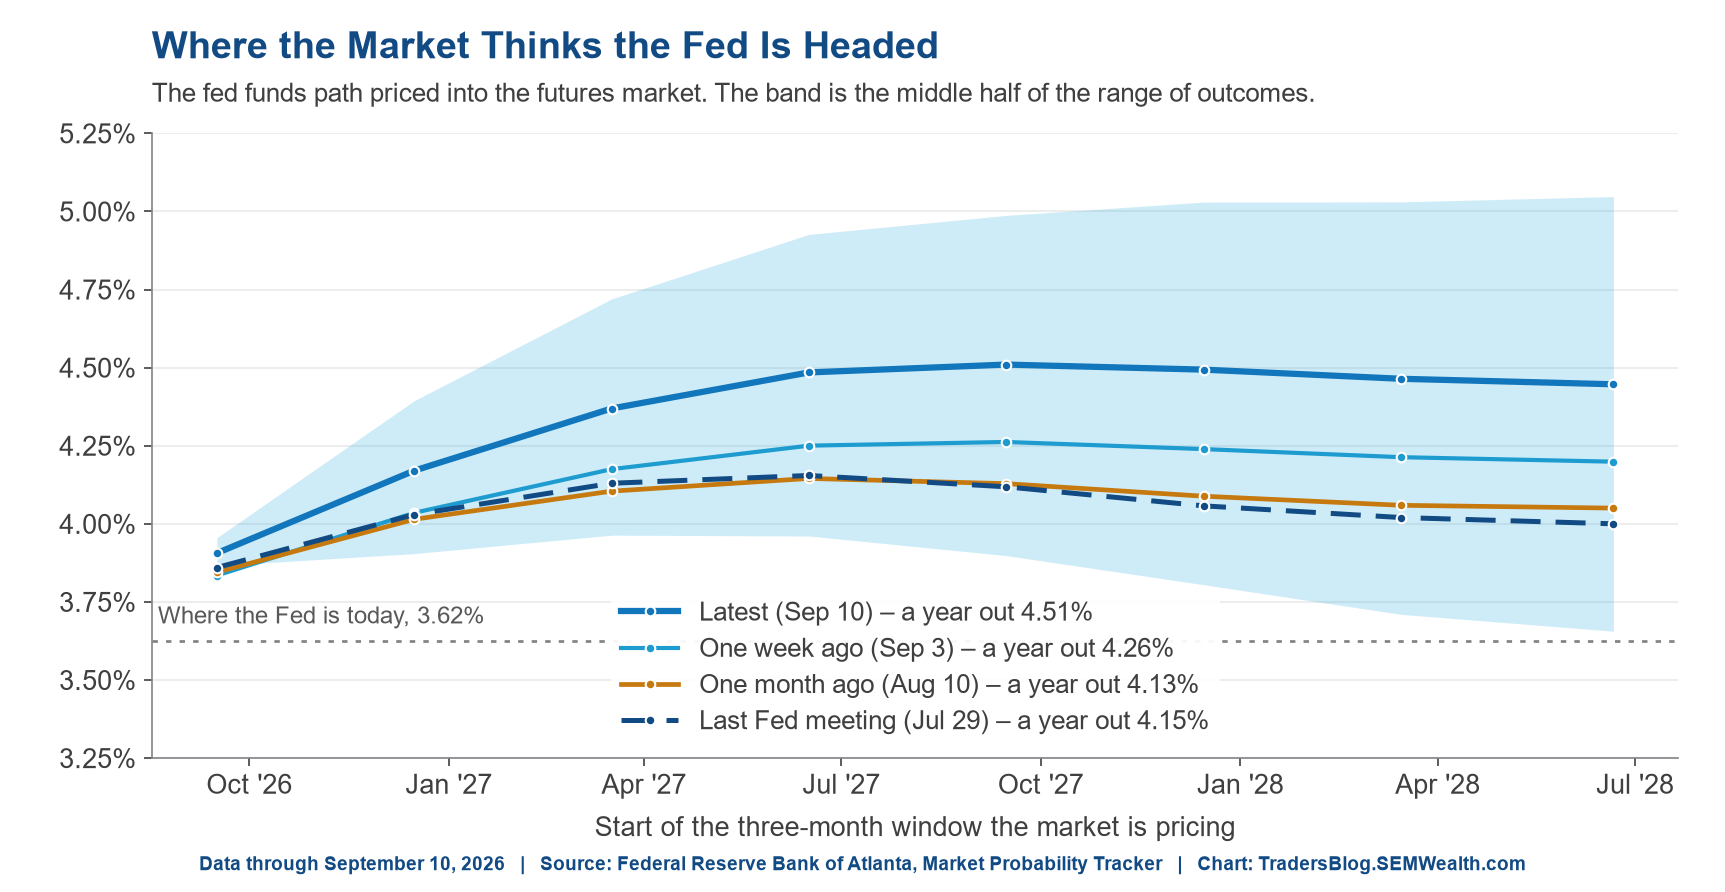
That's bigger picture stuff that needs to be addressed. Back to the Fed, the odds of a Fed rate hike this week jumped to 90% following the CPI report. This chart shows us the market implied rate path over various times. Note both the move higher in the past week and the steepness of the curve versus where it was during the last Fed meeting.
Wednesday could be interesting!
'Surprising' Consumer Sentiment
In our blog last week we walked through our new economic dashboard, our "Nowcast", and our Economic Cycle indicator. One thing we noticed in the research and had to acknowledge – just because consumers are "downbeat" doesn't mean overall consumer spending cannot continue to power higher (since consumer spending is DOLLAR weighted, not an AVERAGE per household). So while sentiment is not weighted as high in our updated economic model, it still can have an impact longer-term.
Last week we got our first read on September's Consumer Sentiment and unsurprisingly given what we saw with the CPI report, it was down again. However, what was a surprise is the sentiment by political party. It appears the high inflation readings are wearing on even the Republican base.
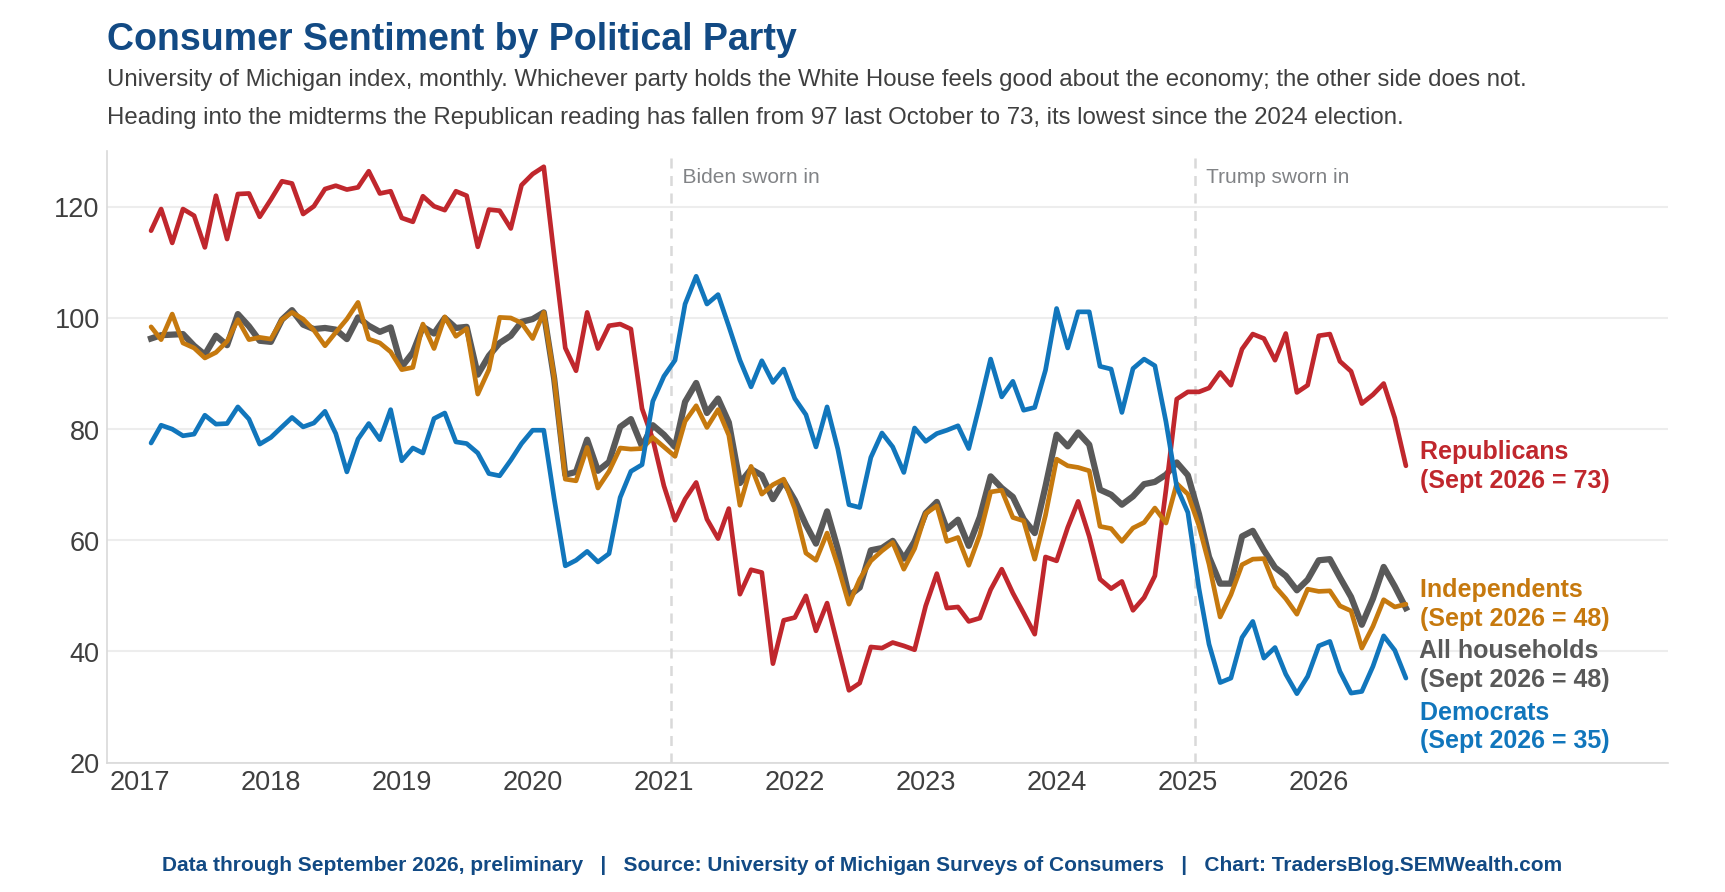
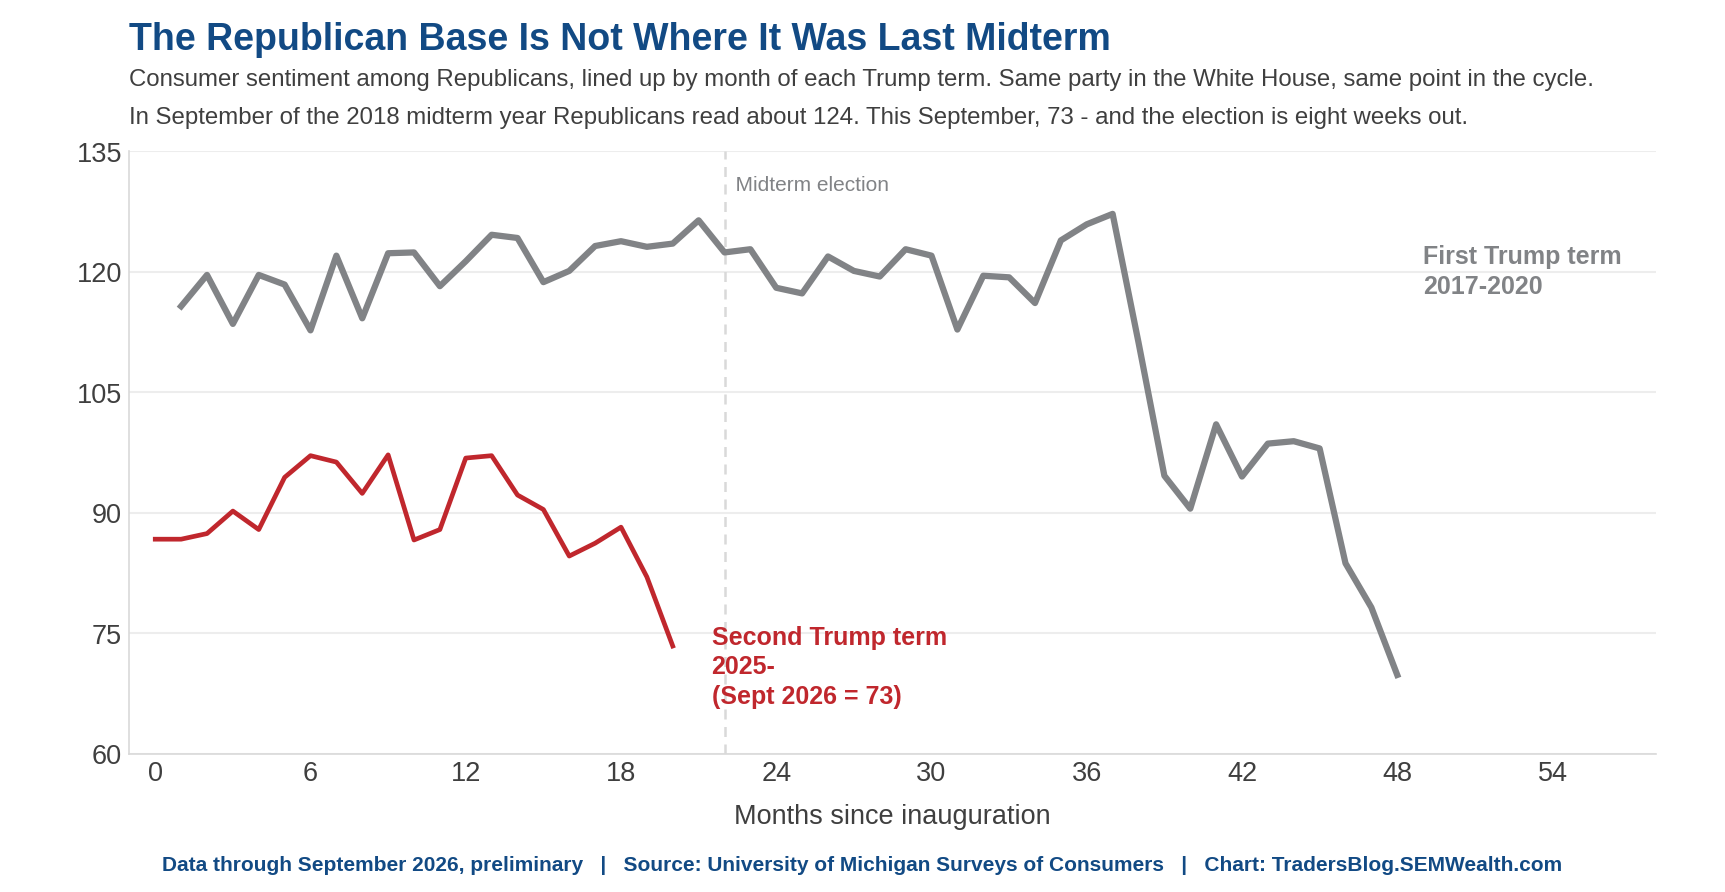
This isn't necessarily dire as Democrats also had plummeting sentiment in 2022 before gas prices reversed just ahead of the mid-terms – enough for them to "outperform" what the political experts thought they would based on sentiment. Gas mentions by respondents has climbed to 29% in the latest survey, so if we see those prices decline, Republican sentiment might also reverse. "Enthusiasm" tends to be a key driver of voter turnout, especially during mid-terms. It's hard to argue the Republican base is enthusiastic about where the economy is heading when you look at how much sentiment has dropped since President Trump's first term.
As I feel is necessary to say, especially in today's political environment – this is not a political statement. I'm just reporting the data and what it might mean to the markets and economy. The markets have certainly enjoyed a nice steady run on the back of "ok" economic growth over the past 2 years. If Republicans lose both chambers of Congress in the mid-terms (something that is becoming more and more possible), there could be plenty of obstacles thrown at the market (and economy) the next two years.
The Everchanging AI Landscape Changed Again
At the start of the month I finally posted the promised article that started with the OpenAI-Nvidia-SB Energy Ohio Data Center project. I decided to make this a "living" document to keep track of all the changes in that eco-system. Last week there were two updates – the Nvidia purchase of Hugging Face and what it means to OpenAI (and others) and a relatively "expensive" test (both time and money) I did after hearing how powerful ChatGPT-6 (Astra) was.
We've added an index at the top and will continue to bump the post to the top of our feed as there are updates. Check it out here.
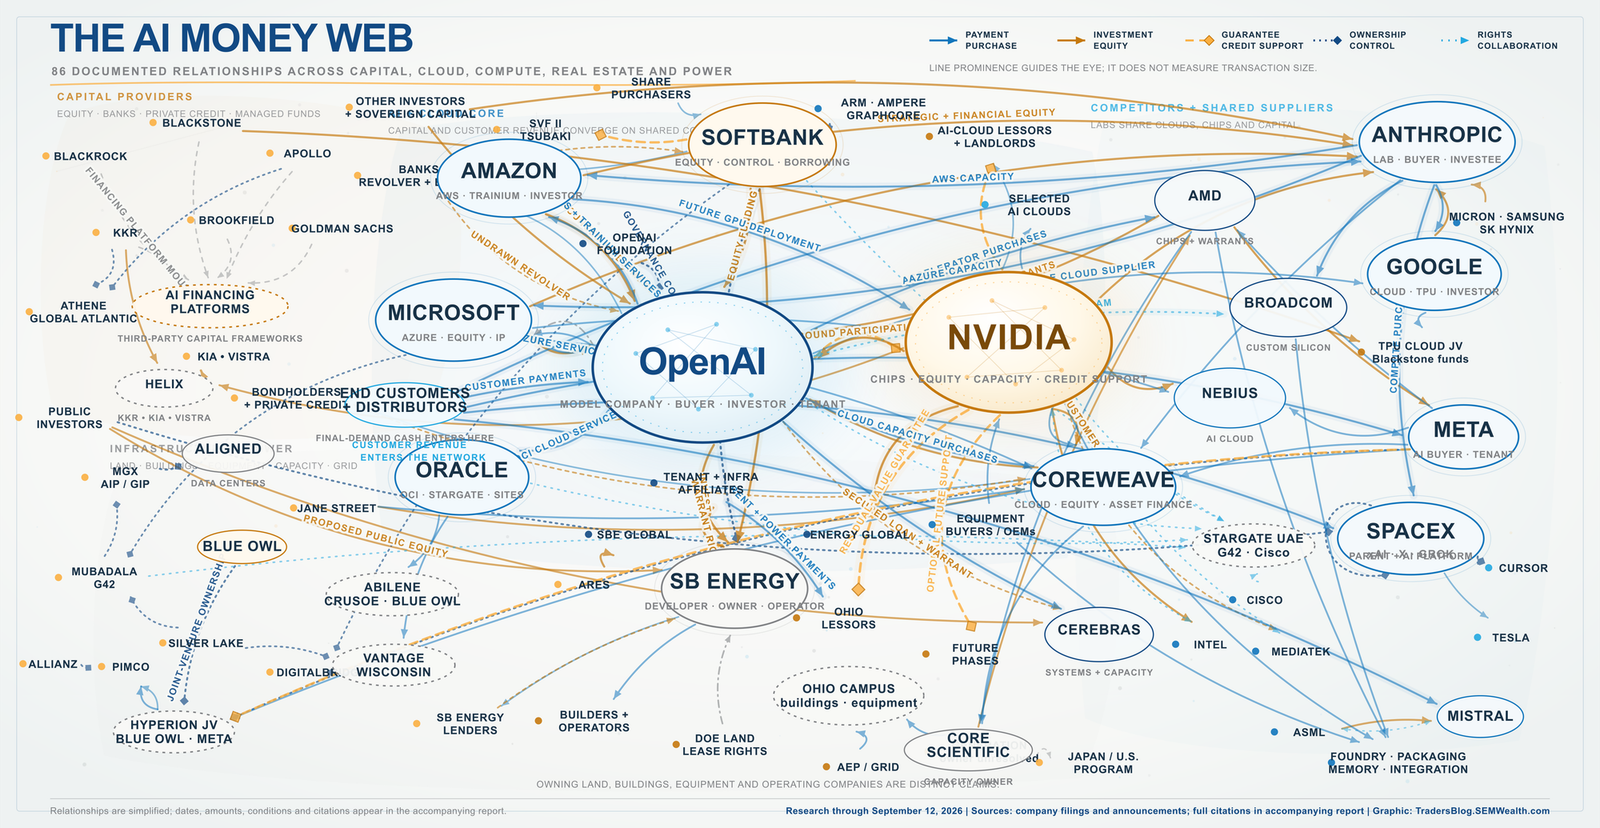
One final AI note which won't be in the "Everchanging" blog (yet), on Saturday the CEOs of Anthropic, OpenAI and xAI all essentially said, within hours of each other, that the AI race needs to slow down. It started with an essay from Anthropic's CEO calling for more controls and oversight. The headlines and possible market reaction is likely going to be more noise than necessary. The important thing to understand is they ARE NOT slowing development, only proposing there are some checkpoints before models are released. The cynic in me could say this is the CEO's of the 3 leading "frontier" AI model developers getting ahead of regulation by announcing their own regulations before the politicians do it. The capital expenditure line items will continue to be the place to monitor what the companies are ACTUALLY doing.
Probably the bigger news is OpenAI saying they were delaying their IPO until 2027. They have been using their privately held stock as their "cash" for a large chunk of their deals, so delaying this may be more important than delaying the release of new models.
We haven't forgotten
Friday was a somber day as our country remembered the 9/11 attacks on our country. As we've done every year since 2010, we reposted with small updates my thoughts.
 Jeff Hybiak, CFA
Invested in America: A Story of Opportunity and Gratitude
Coming back from the Labor Day holiday weekend and the 25th anniversary of the tragic September 11 attacks, my thoughts, appreciation, and feed, frankly, have recently centered around a strong feeling of American pride and patriotism.
So, with this week's "Chart of the Week," I felt it was my duty to participate, as an American, in a moment of solidarity and admiration that’s forever indebted to participating in a small snippet of America's longest-running wealth story.
Huge h/t to Meb Faber, co-founder and the Chief Investment Officer of Cambria Investment Management, and his new book, "Investing in America: The Rise of a 250-Year Bull Market". It's packed with charts that tell the story of the U.S. market by decade. I highly recommend checking it out.
The Long-Term Case for Investing in America
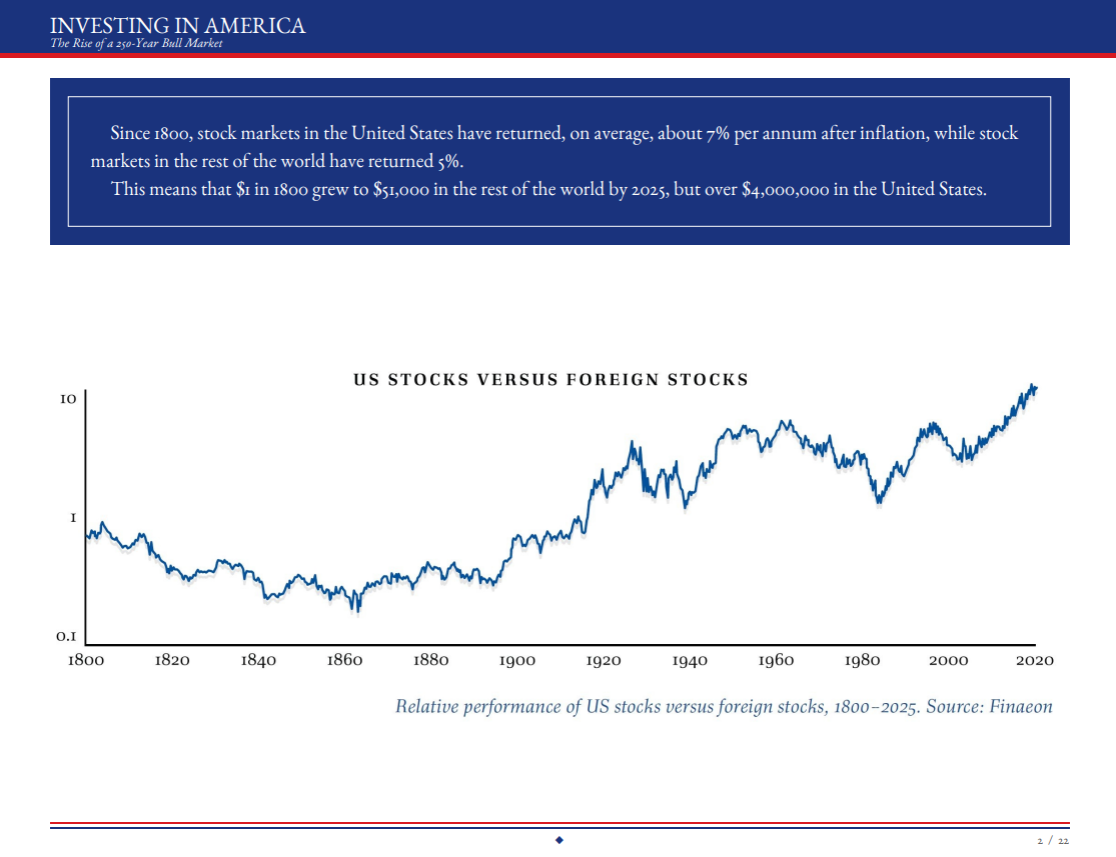
- Since 1800, U.S. stocks have delivered approximately 7% annual returns after inflation, compared to about 5% for international markets.
- A single dollar invested in U.S. stocks in 1800 would have grown to more than $4 million by 2025, highlighting the remarkable wealth-creation power of American businesses.
The Worst Markets Often Create the Best Opportunities
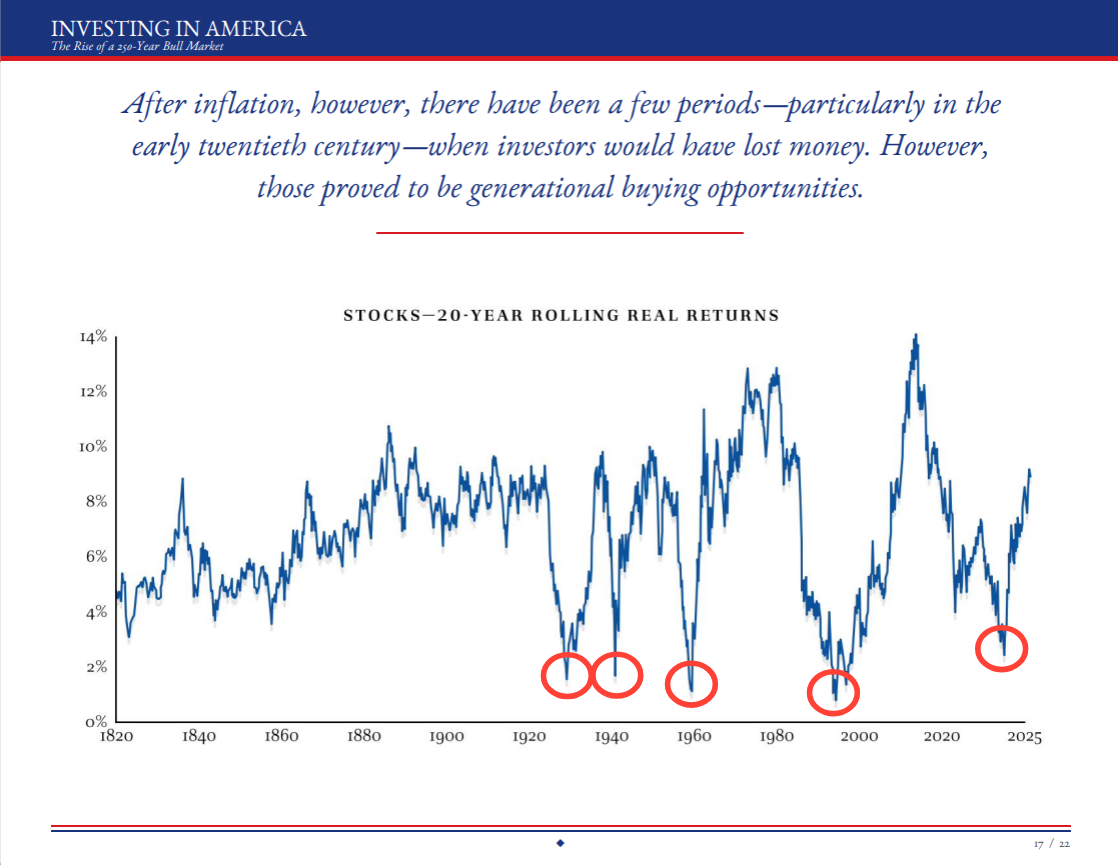
- Market downturns are not exceptions to investing success. They have historically been part of the journey, and even provide generational opportunities if investors remain invested and disciplined.
Bull Markets Tend to Be Larger and Bigger Than Bear Markets
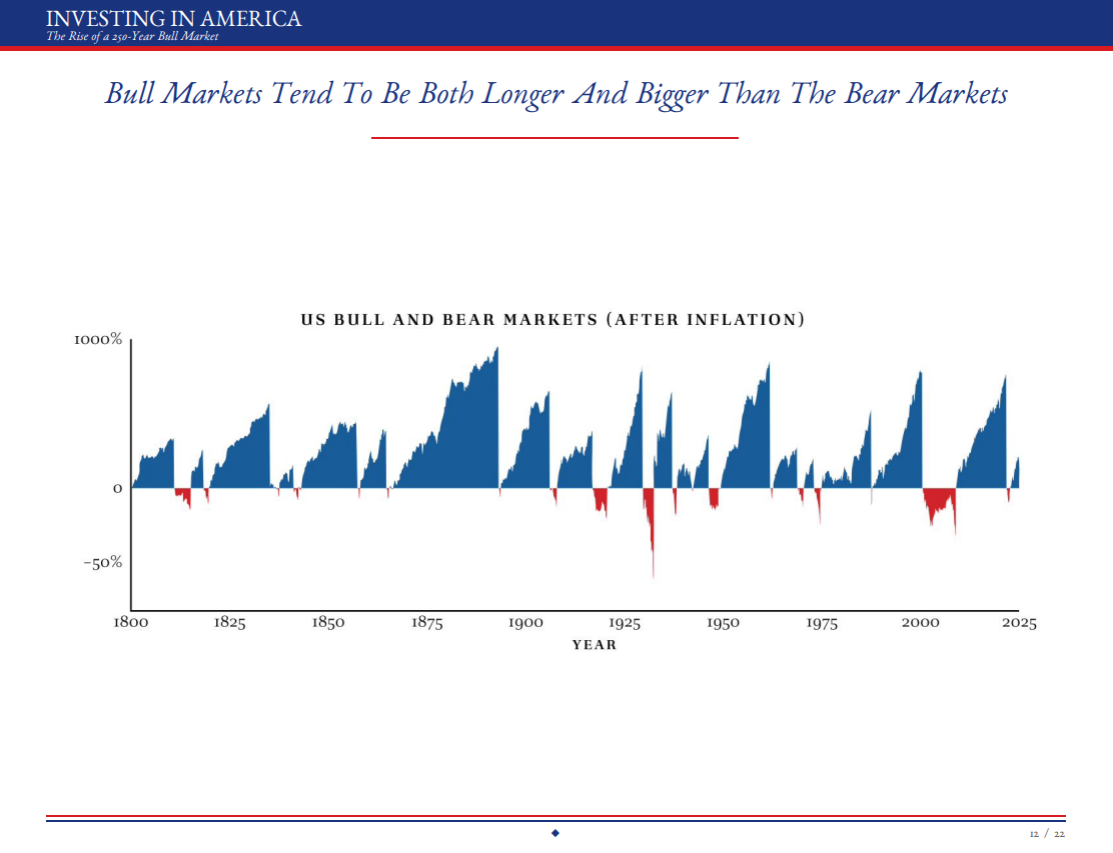
- Over the past two centuries, U.S. bull markets have generally been longer-lasting and larger in magnitude than bear markets.
- This asymmetry has rewarded disciplined investors who stayed invested through market cycles.
America's Economy Continues to Evolve
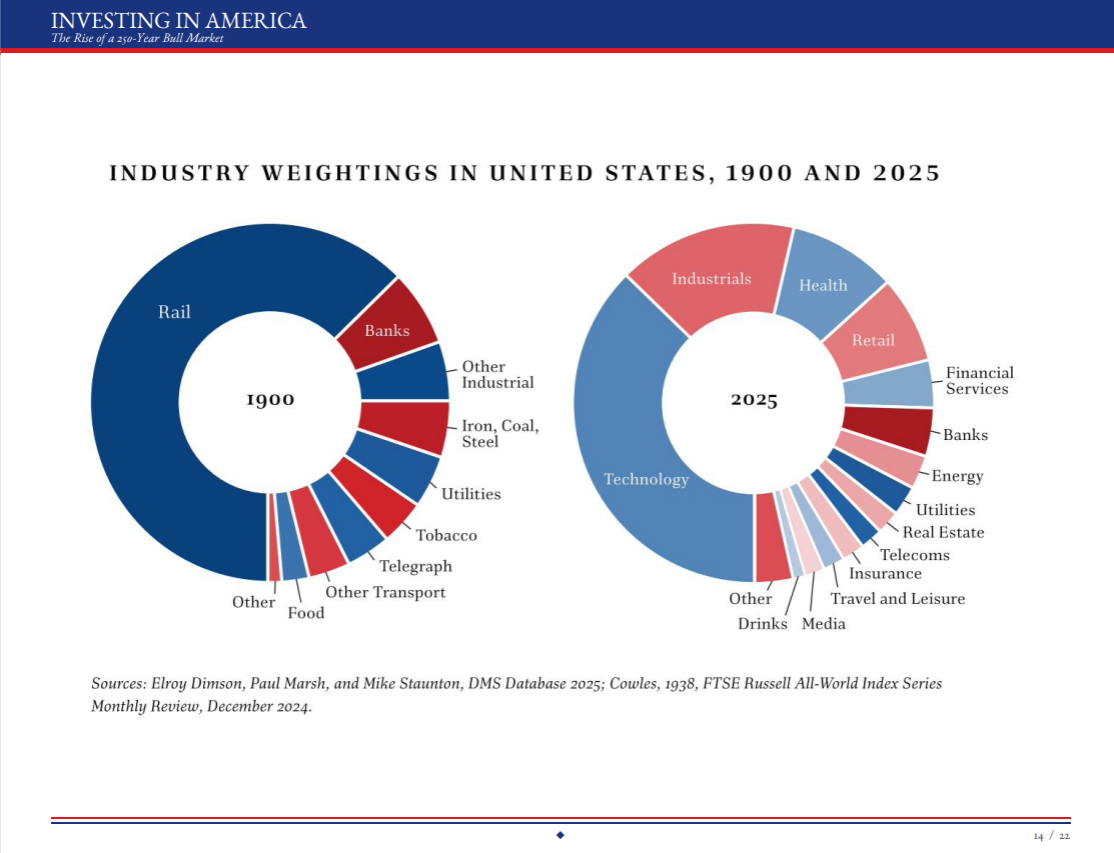
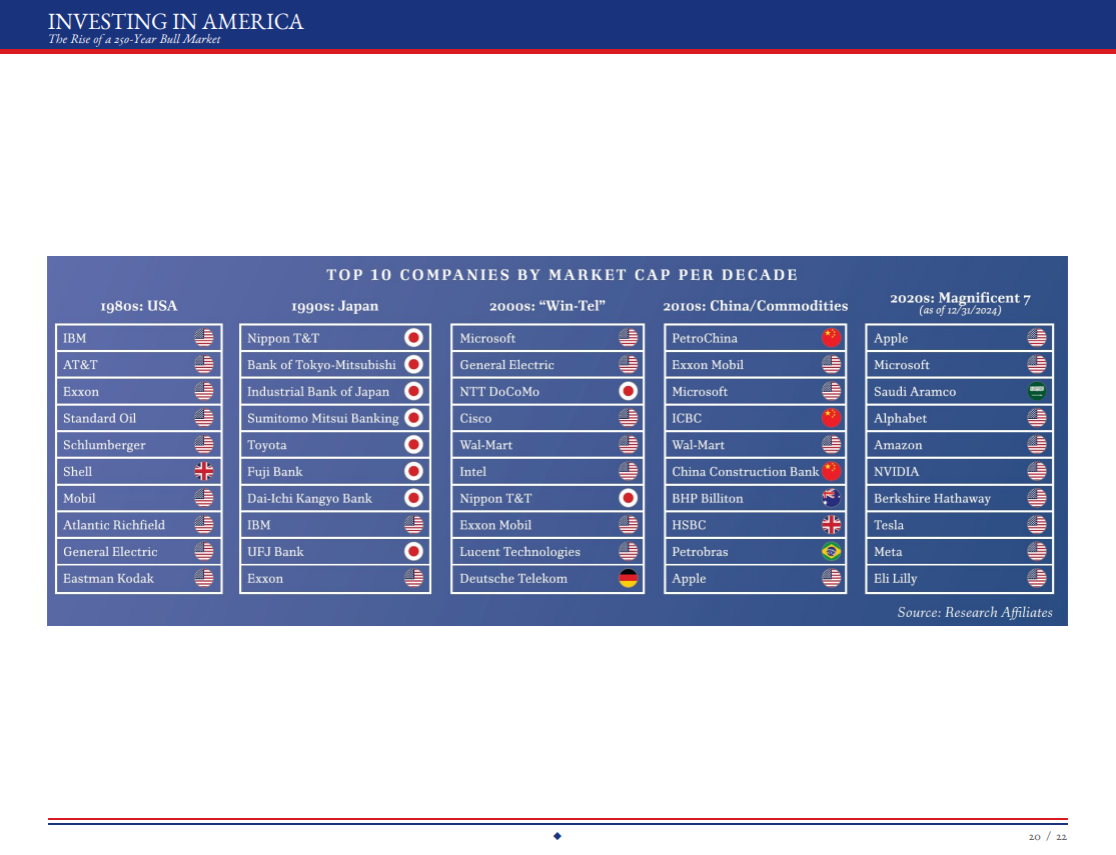
- U.S. market leadership has evolved dramatically over time, shifting from railroads and industrials in 1900 to technology, healthcare, and services today.
- This adaptability has been a key driver of America's long-term economic success.
- The largest companies by market capitalization have fluctuated by decade even on a global basis.
The Immaculate Track Record: Rolling 20-Year Period in Global Stocks
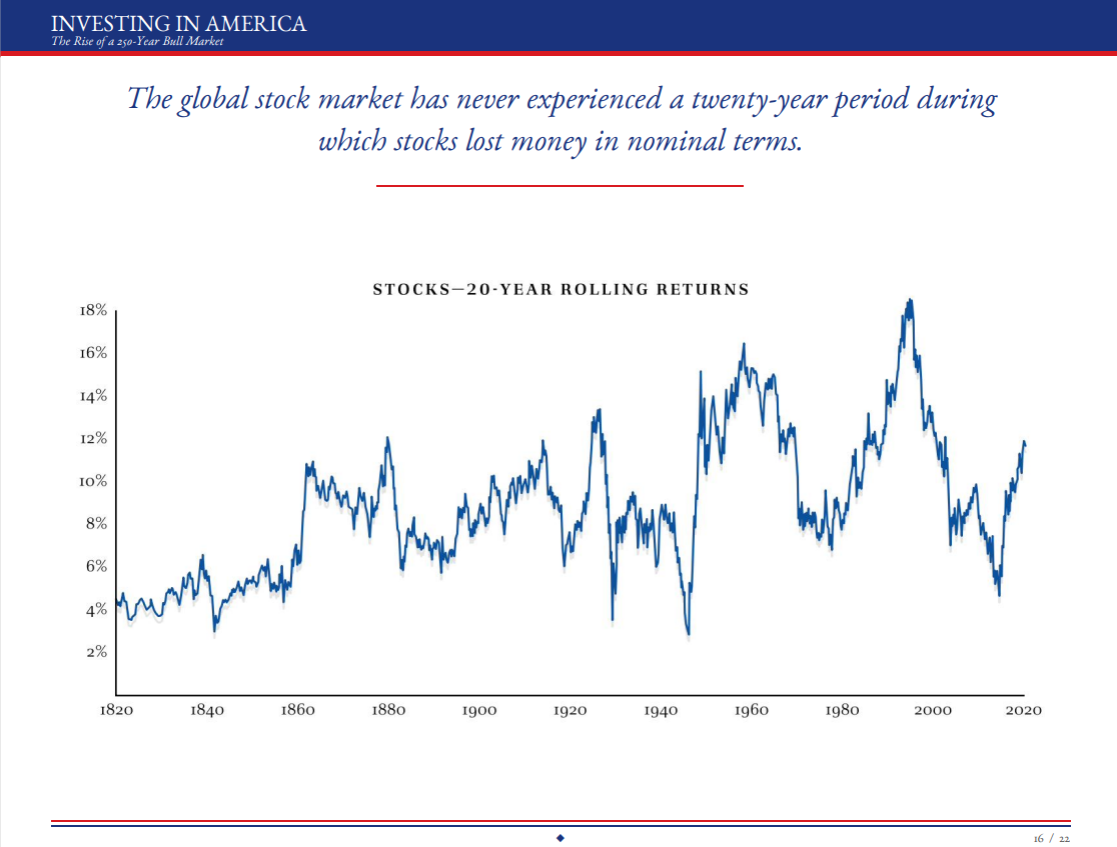
- Short-term uncertainty is unavoidable, but history shows that it has consistently rewarded patient investors willing to stay invested through full market cycles.
The history of investing is not a story of uninterrupted gains. It is a story of perseverance through wars, recessions, inflation, market crashes, technological revolutions, and shifting economic leadership.
Along the way, investors have experienced periods of uncertainty, volatility, and drawdowns, yet the long-term trajectory of innovation, productivity, and economic growth has consistently rewarded patience and discipline. From the power of compounding and dividend reinvestment to the benefits of starting early and staying invested, the lessons remain remarkably timeless.
In an environment where headlines frequently emphasize short-term risks, the past 225 years offer a compelling reminder that patience, discipline, and optimism have historically been among the most valuable assets an investor can own.
At SEM, we believe your time is best spent focused on what matters most to you, not on keeping up with the complexities, evolving regulations, and latest trends shaping the financial markets. With SEM as your trusted advisor, we take on that responsibility through a disciplined, research-driven investment process designed to identify opportunities, manage risks, and adapt to changing market conditions.
Thank you to all of the visitors who read last week's "Chart of the Week". I hope to continue sharing these talking points about markets, investing, etc., for you to share with family, friends, coworkers, or anyone along the way.
See you next time!
Market and Economic Data
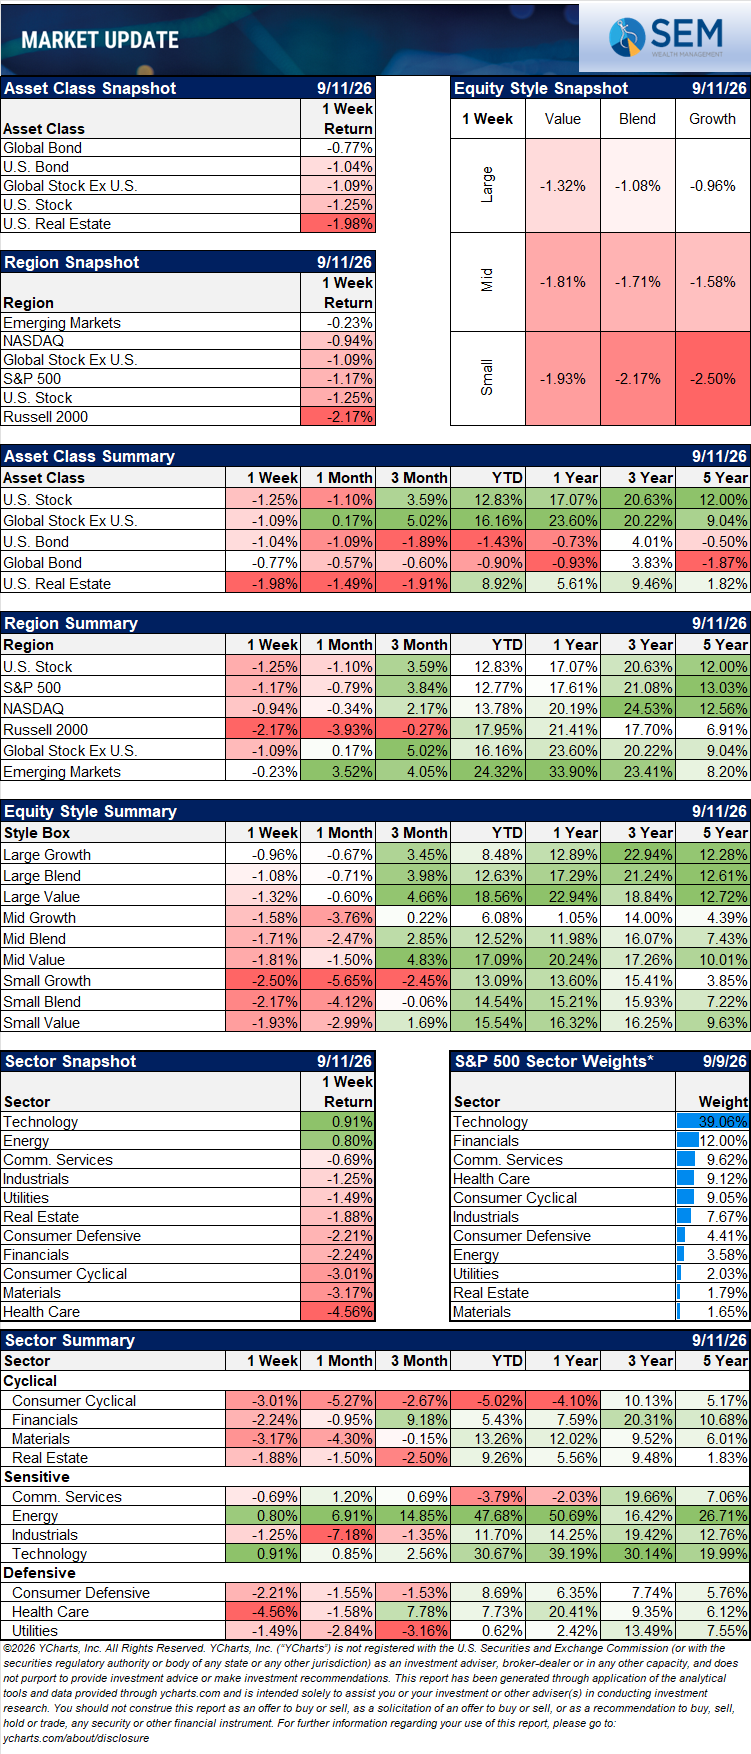
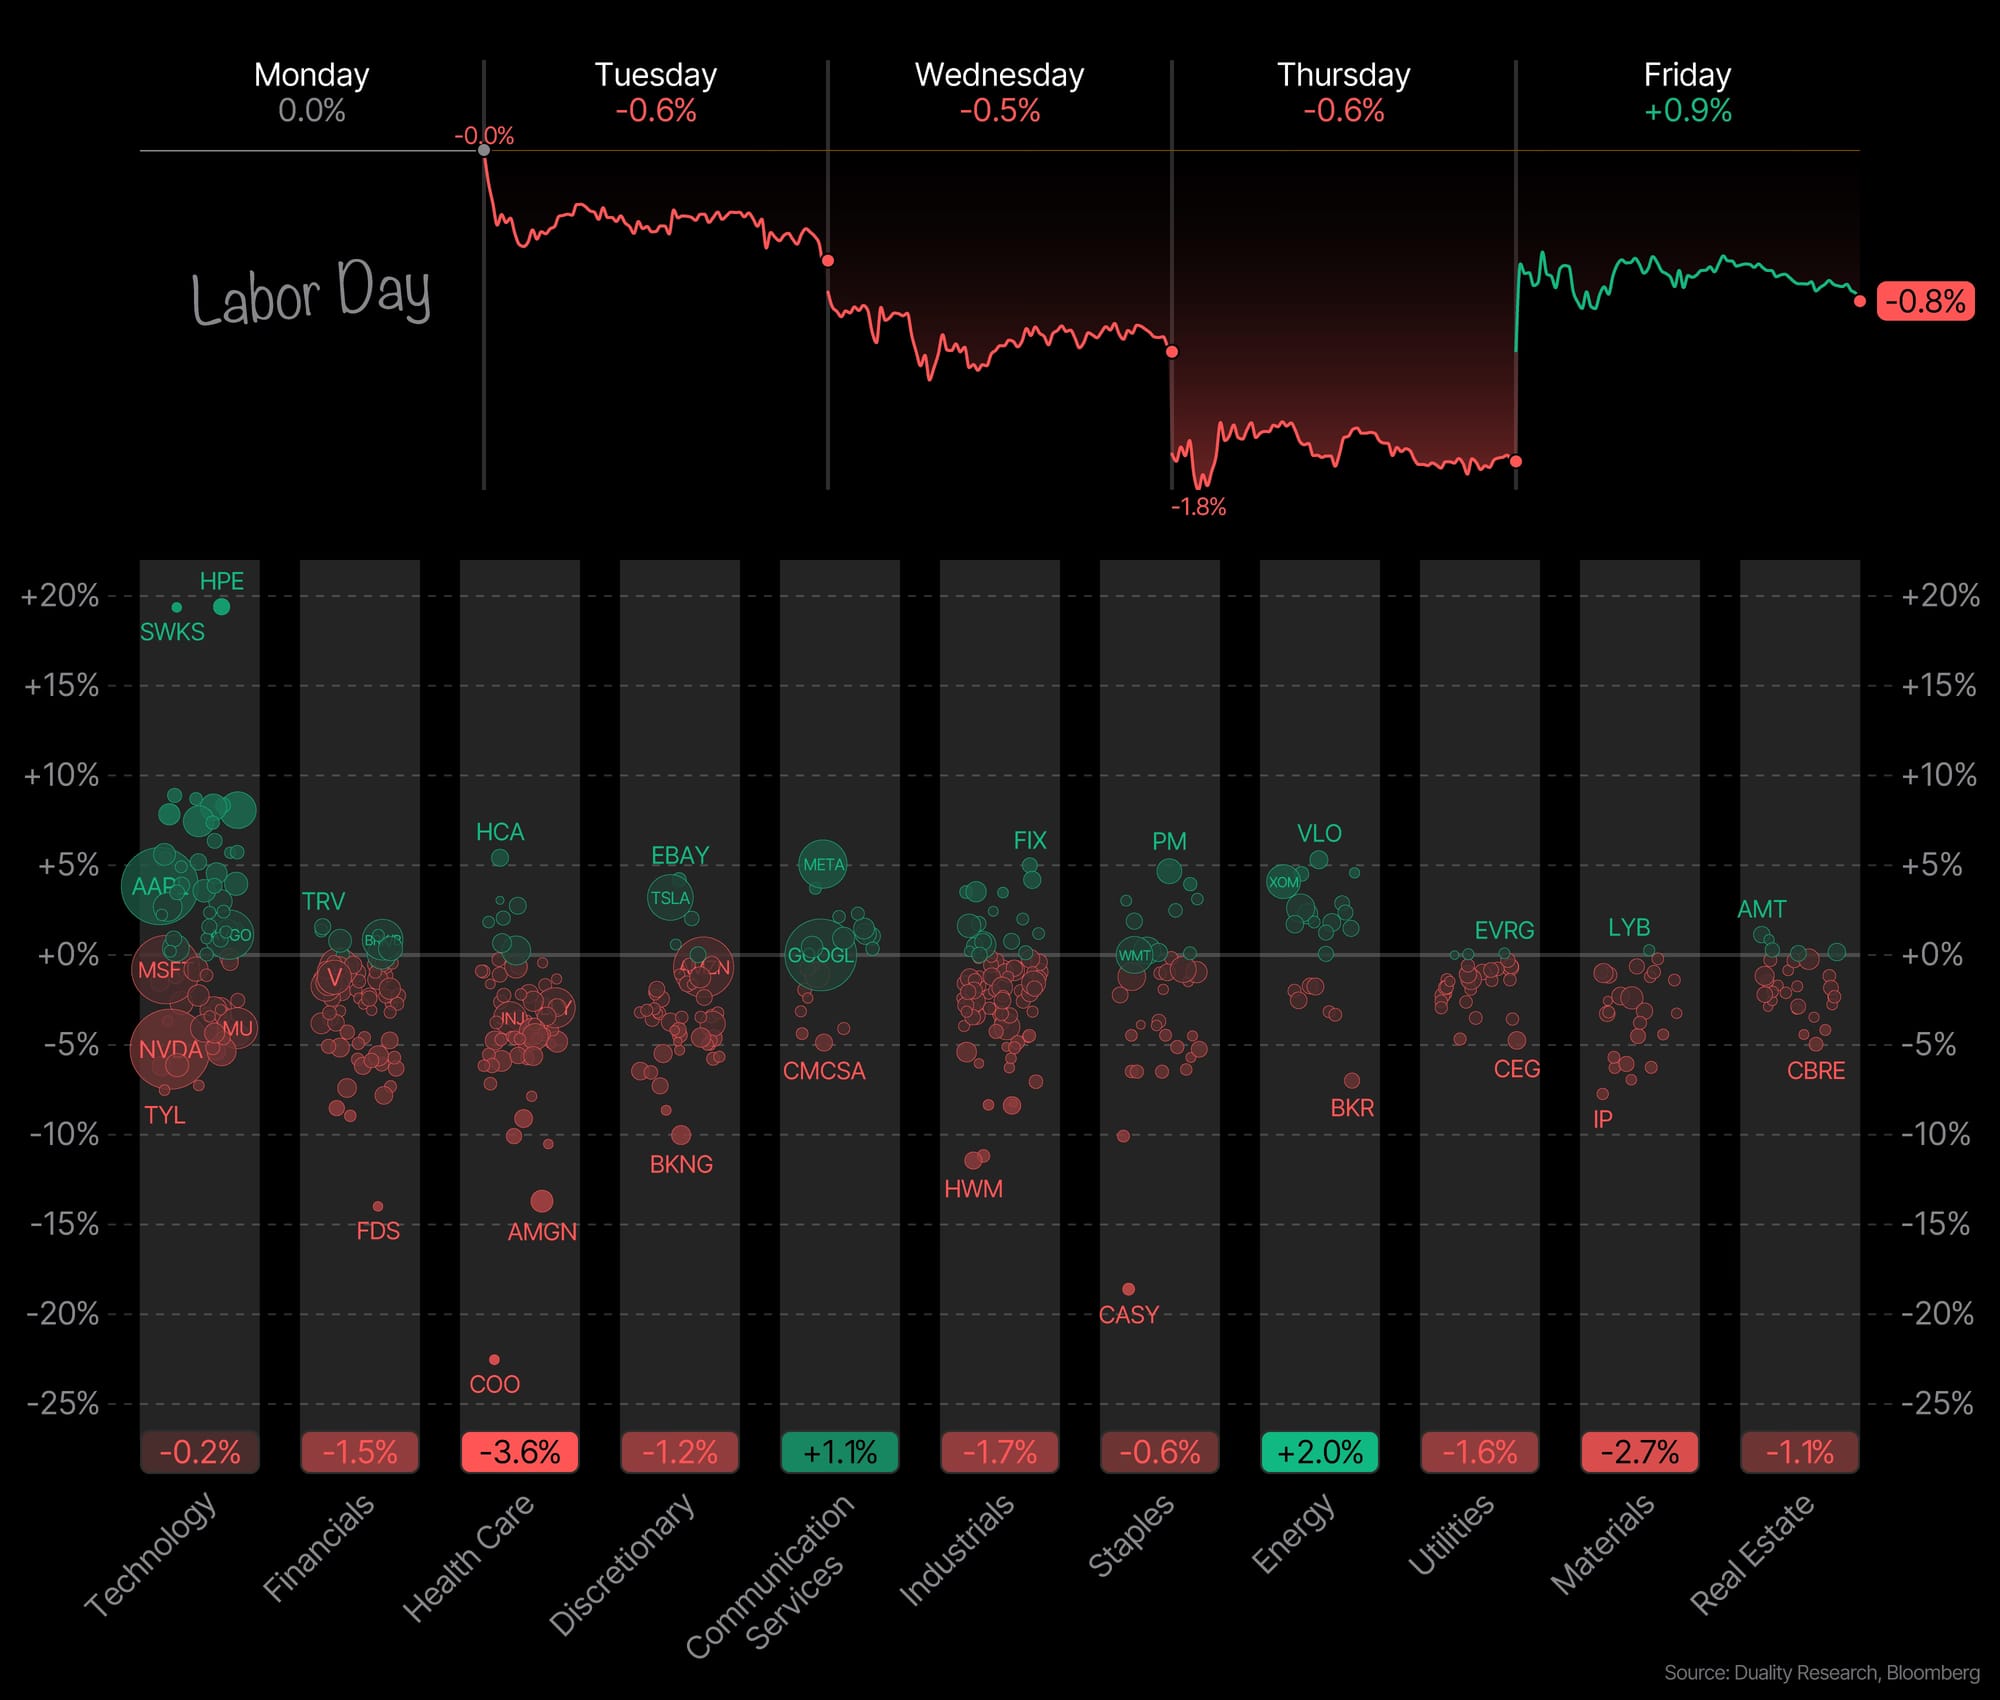
Stocks fell for four straight sessions as higher oil raised the specter of an energy-driven inflation shock, and the 10-year Treasury yield briefly pushed toward 5%, pressuring equity valuations. Market breadth deteriorated with only about a third of S&P 500 names holding above their 50-day moving average by week's end, and small caps and industrials leading the losses.
A Friday rebound tempered the damage: the Dow, S&P 500, and Nasdaq each rallied roughly 1% after the August CPI report matched headline expectations, even though core CPI ran a touch hot at +0.3% versus the 0.2% consensus.
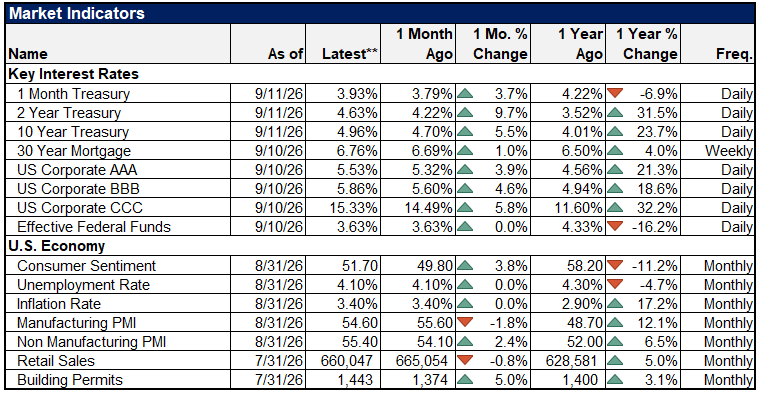
Trading in rate futures markets on Friday afternoon implied an 88% probability that the Fed would raise its benchmark rate by a quarter point, according to CME FedWatch. Just a week earlier, the probability of a September rate increase was 59%.
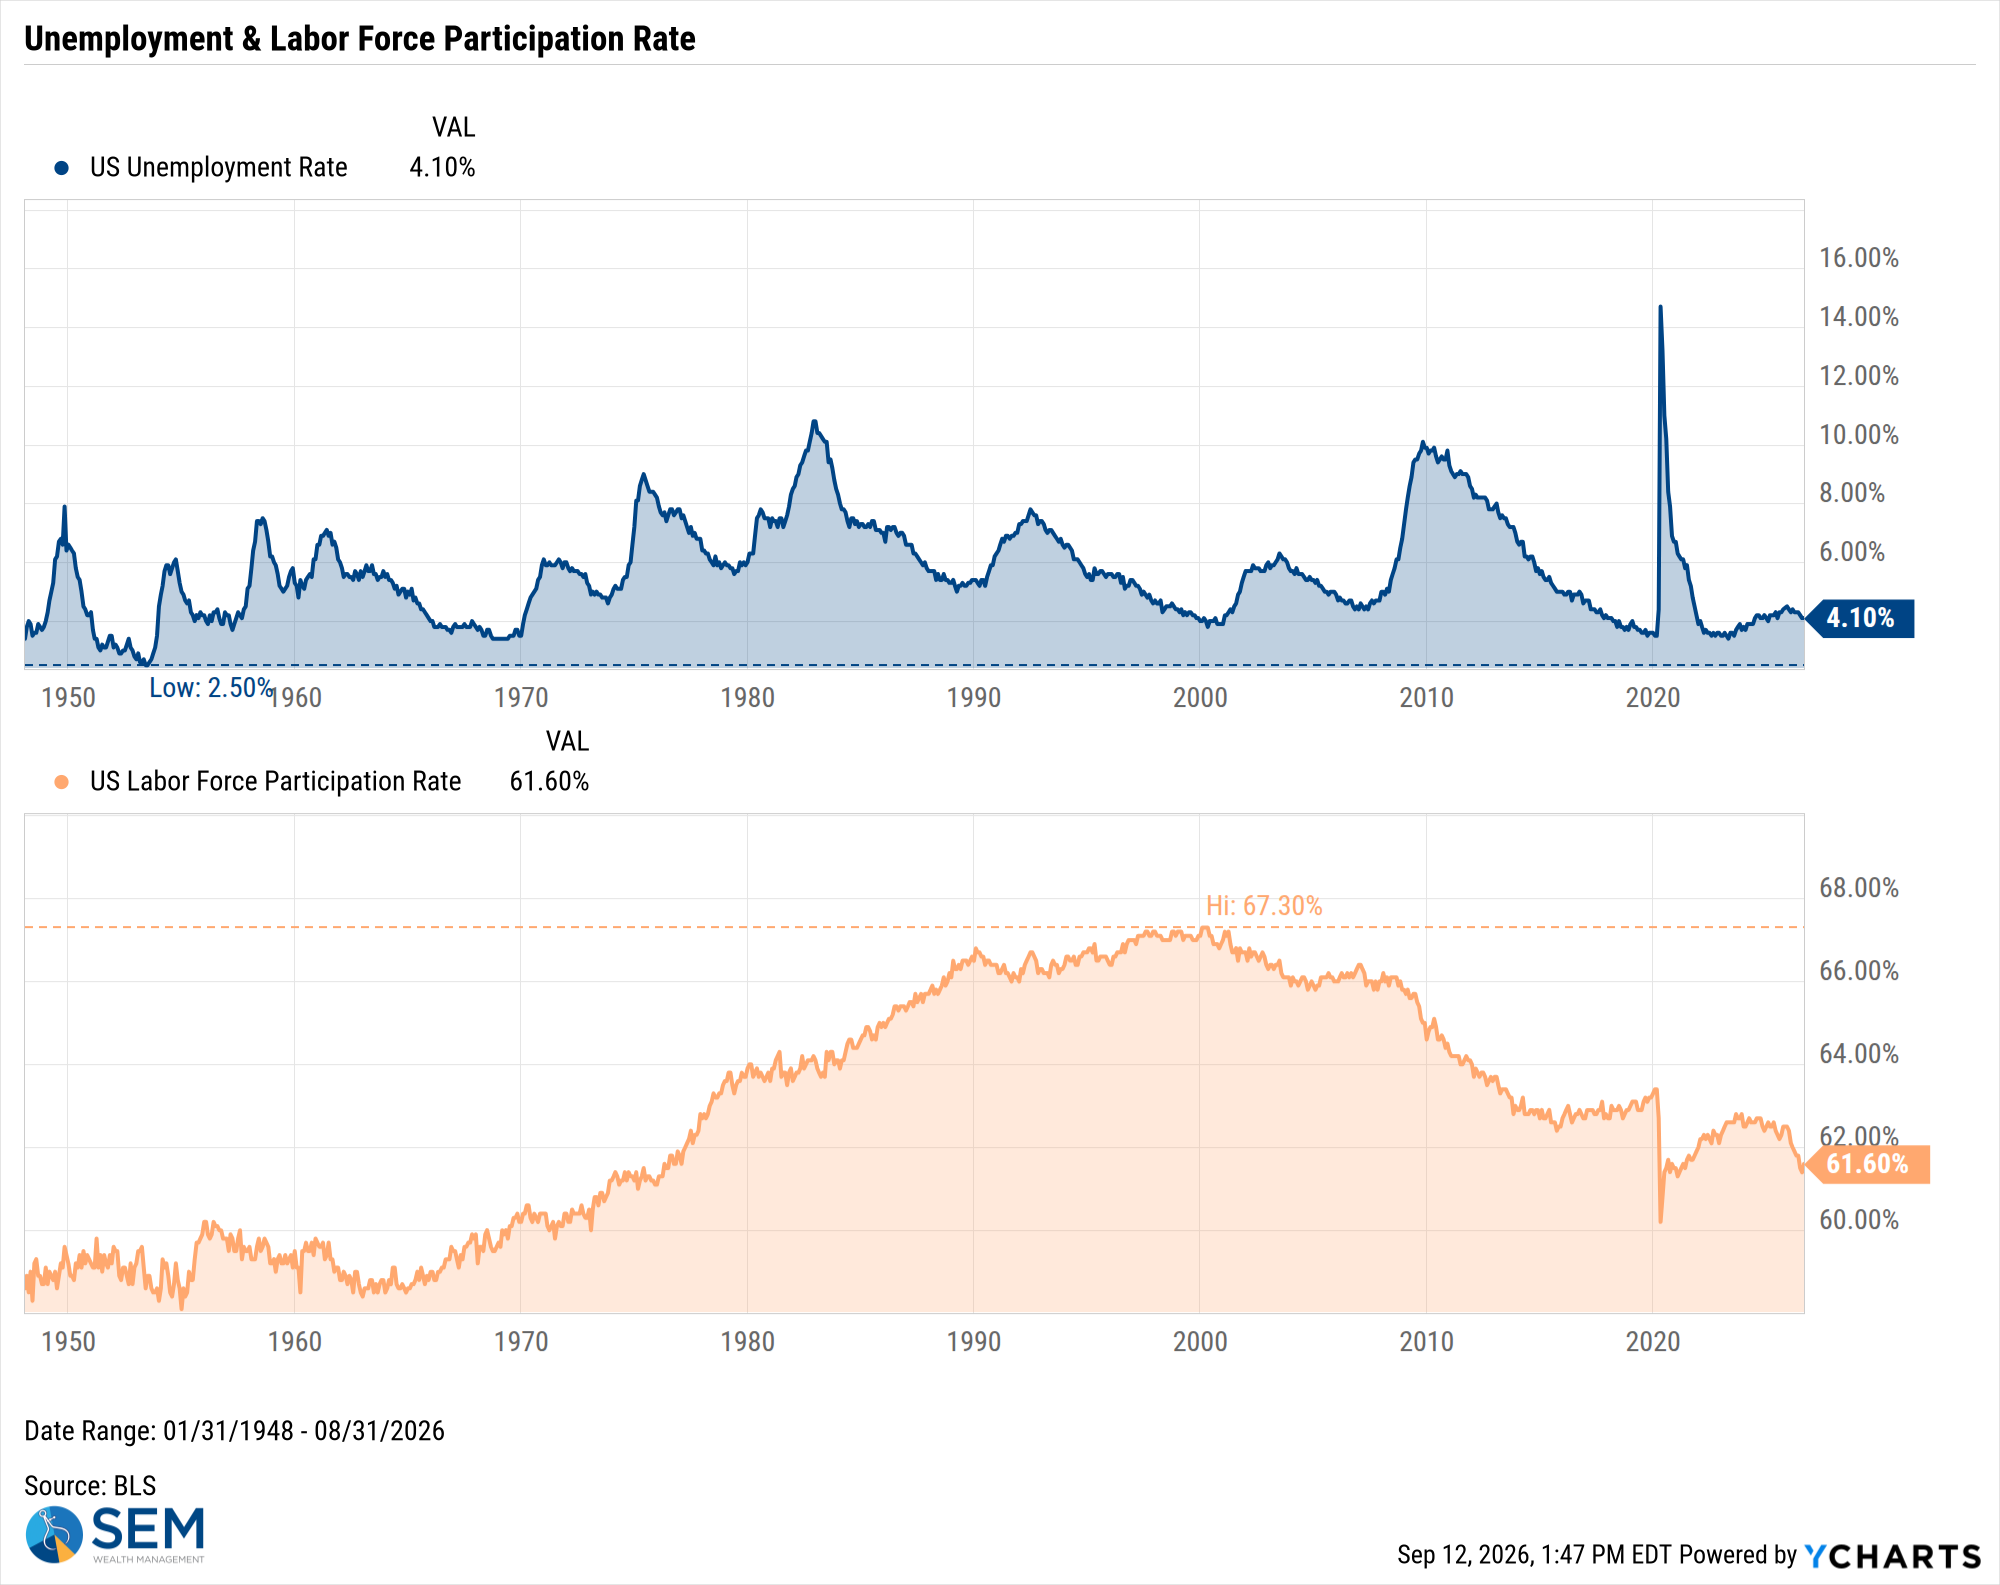
US Unemployment Rate data by YCharts
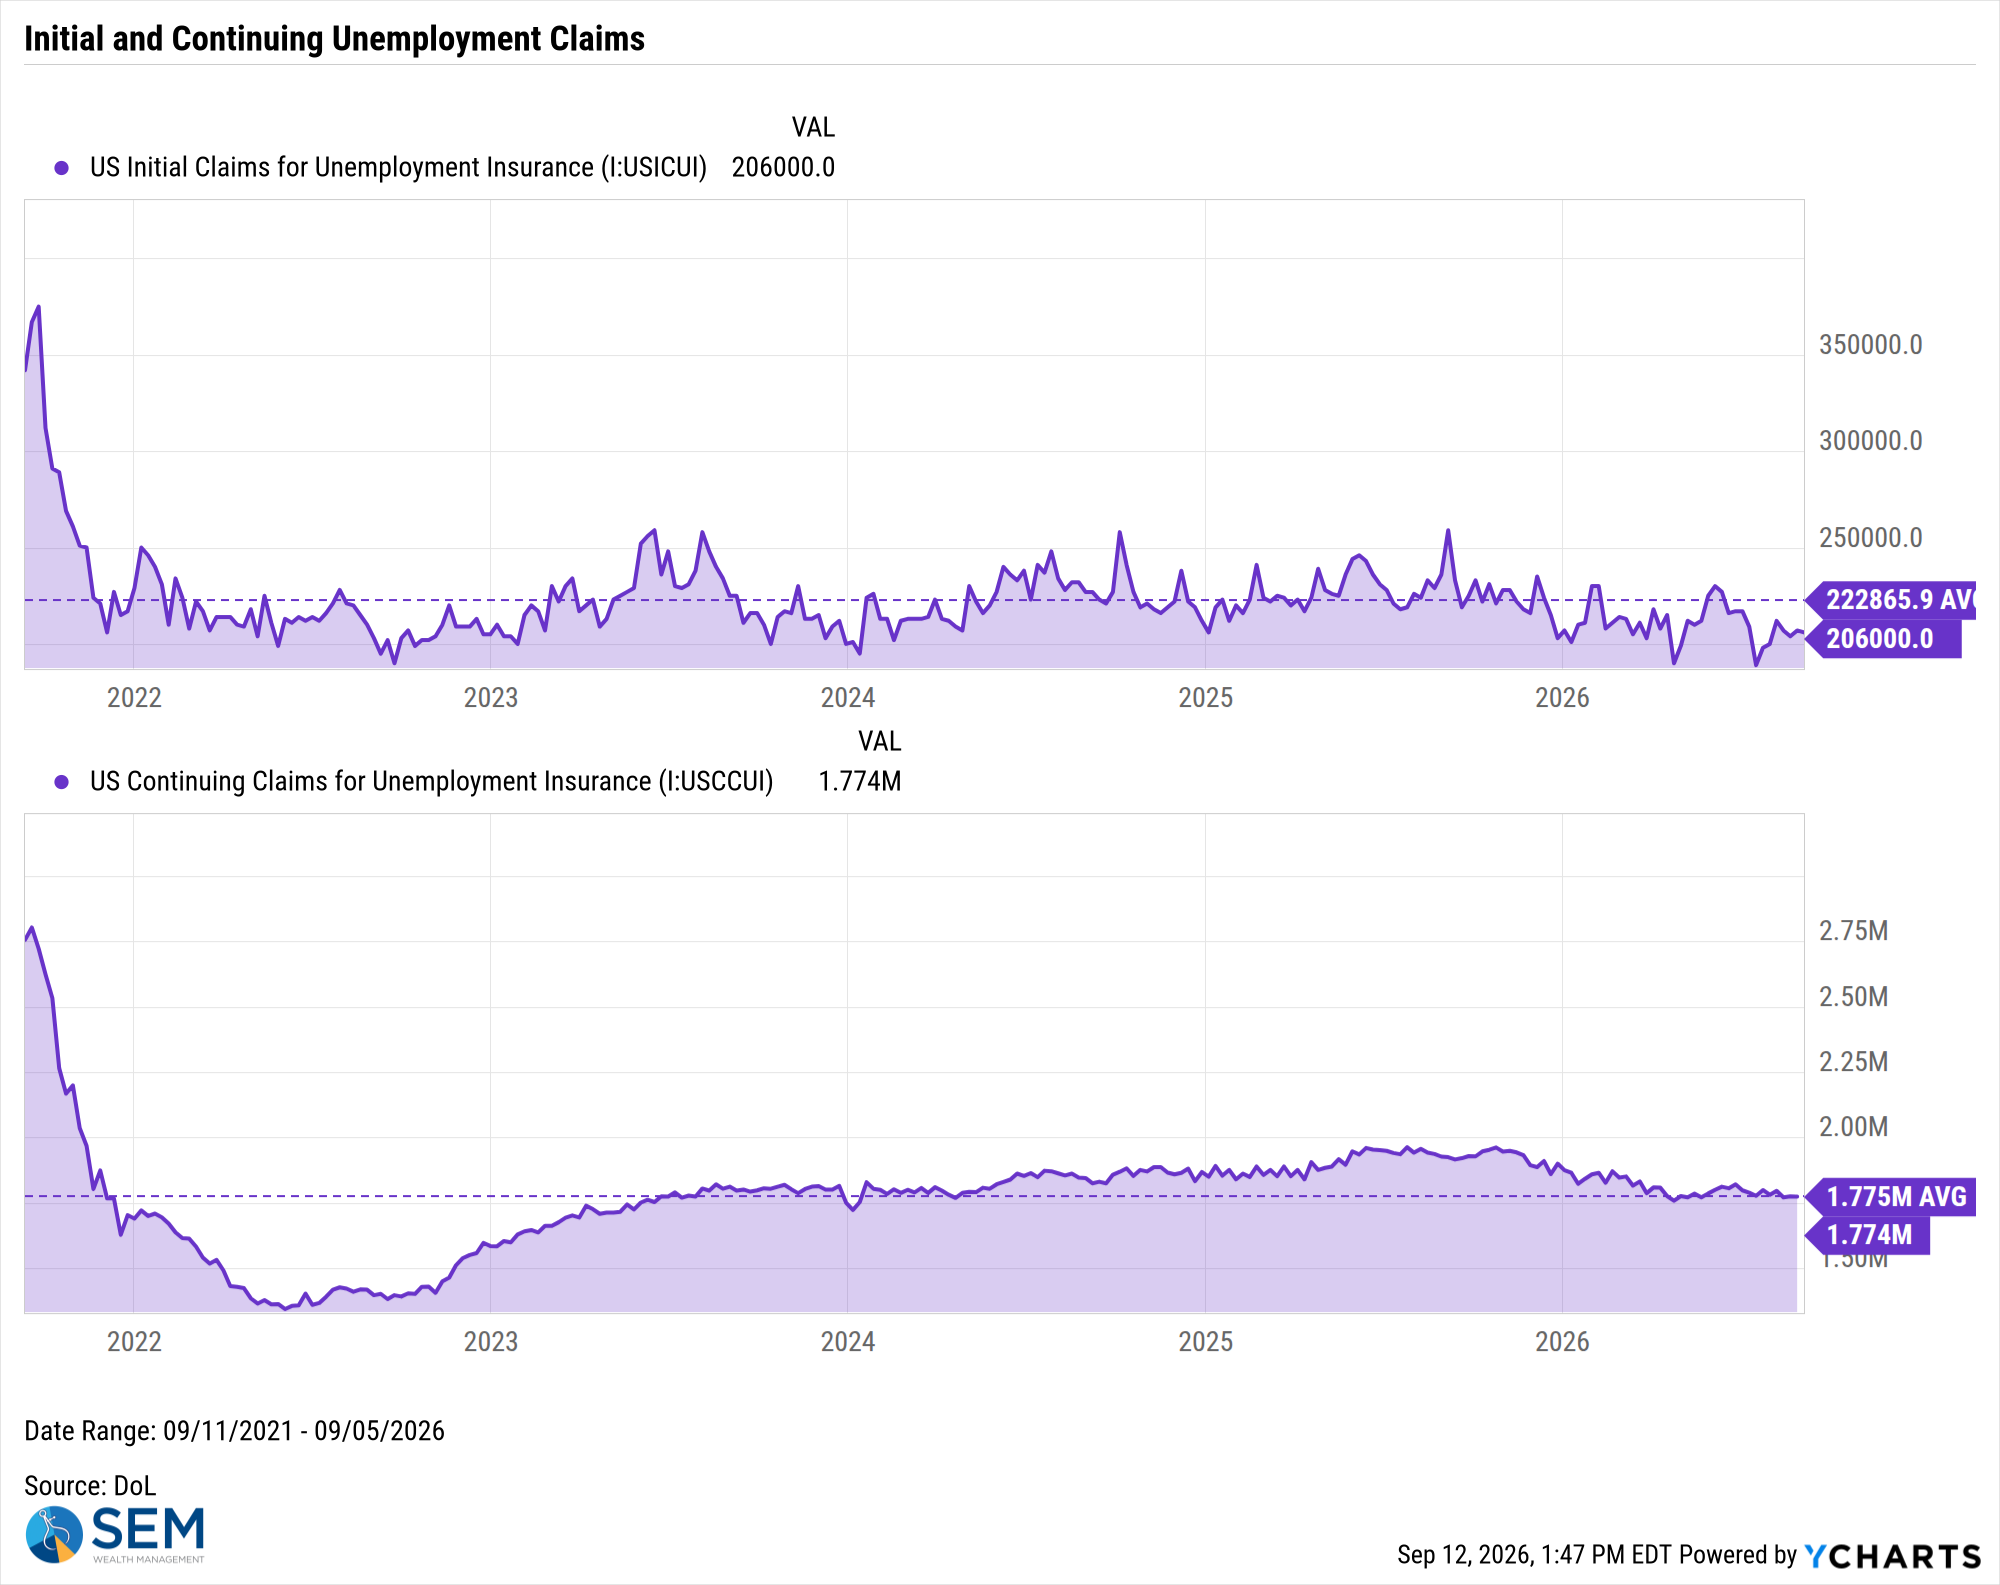
US Initial Claims for Unemployment Insurance data by YCharts
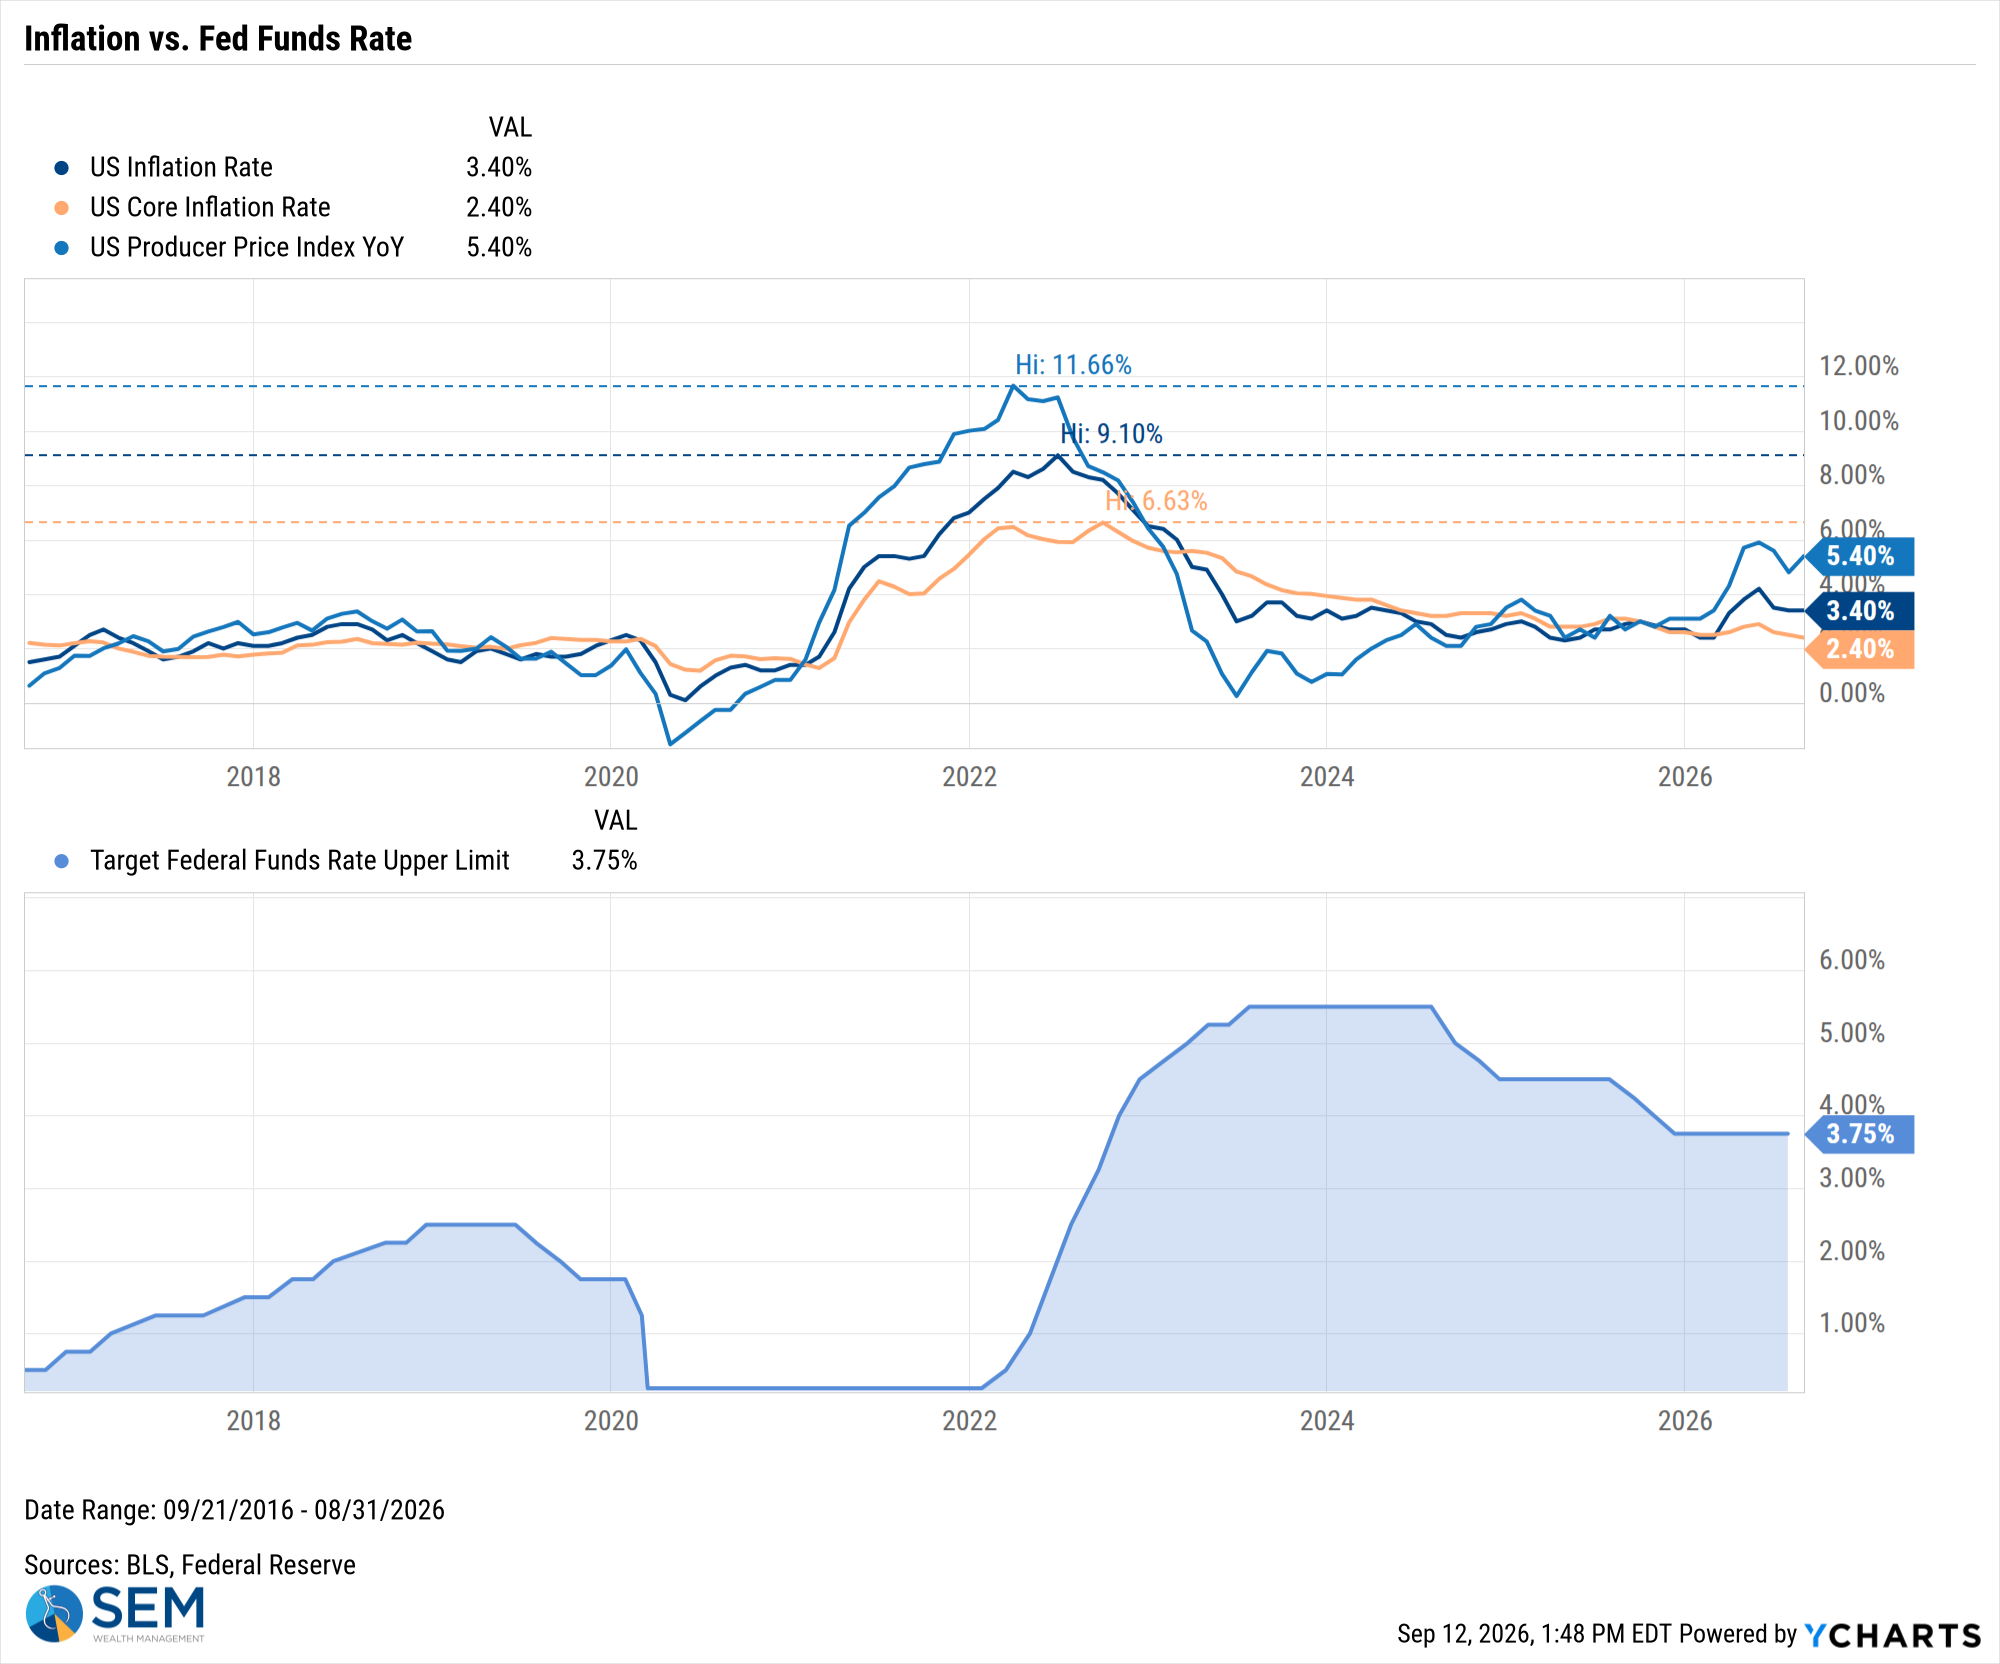
US Inflation Rate data by YCharts
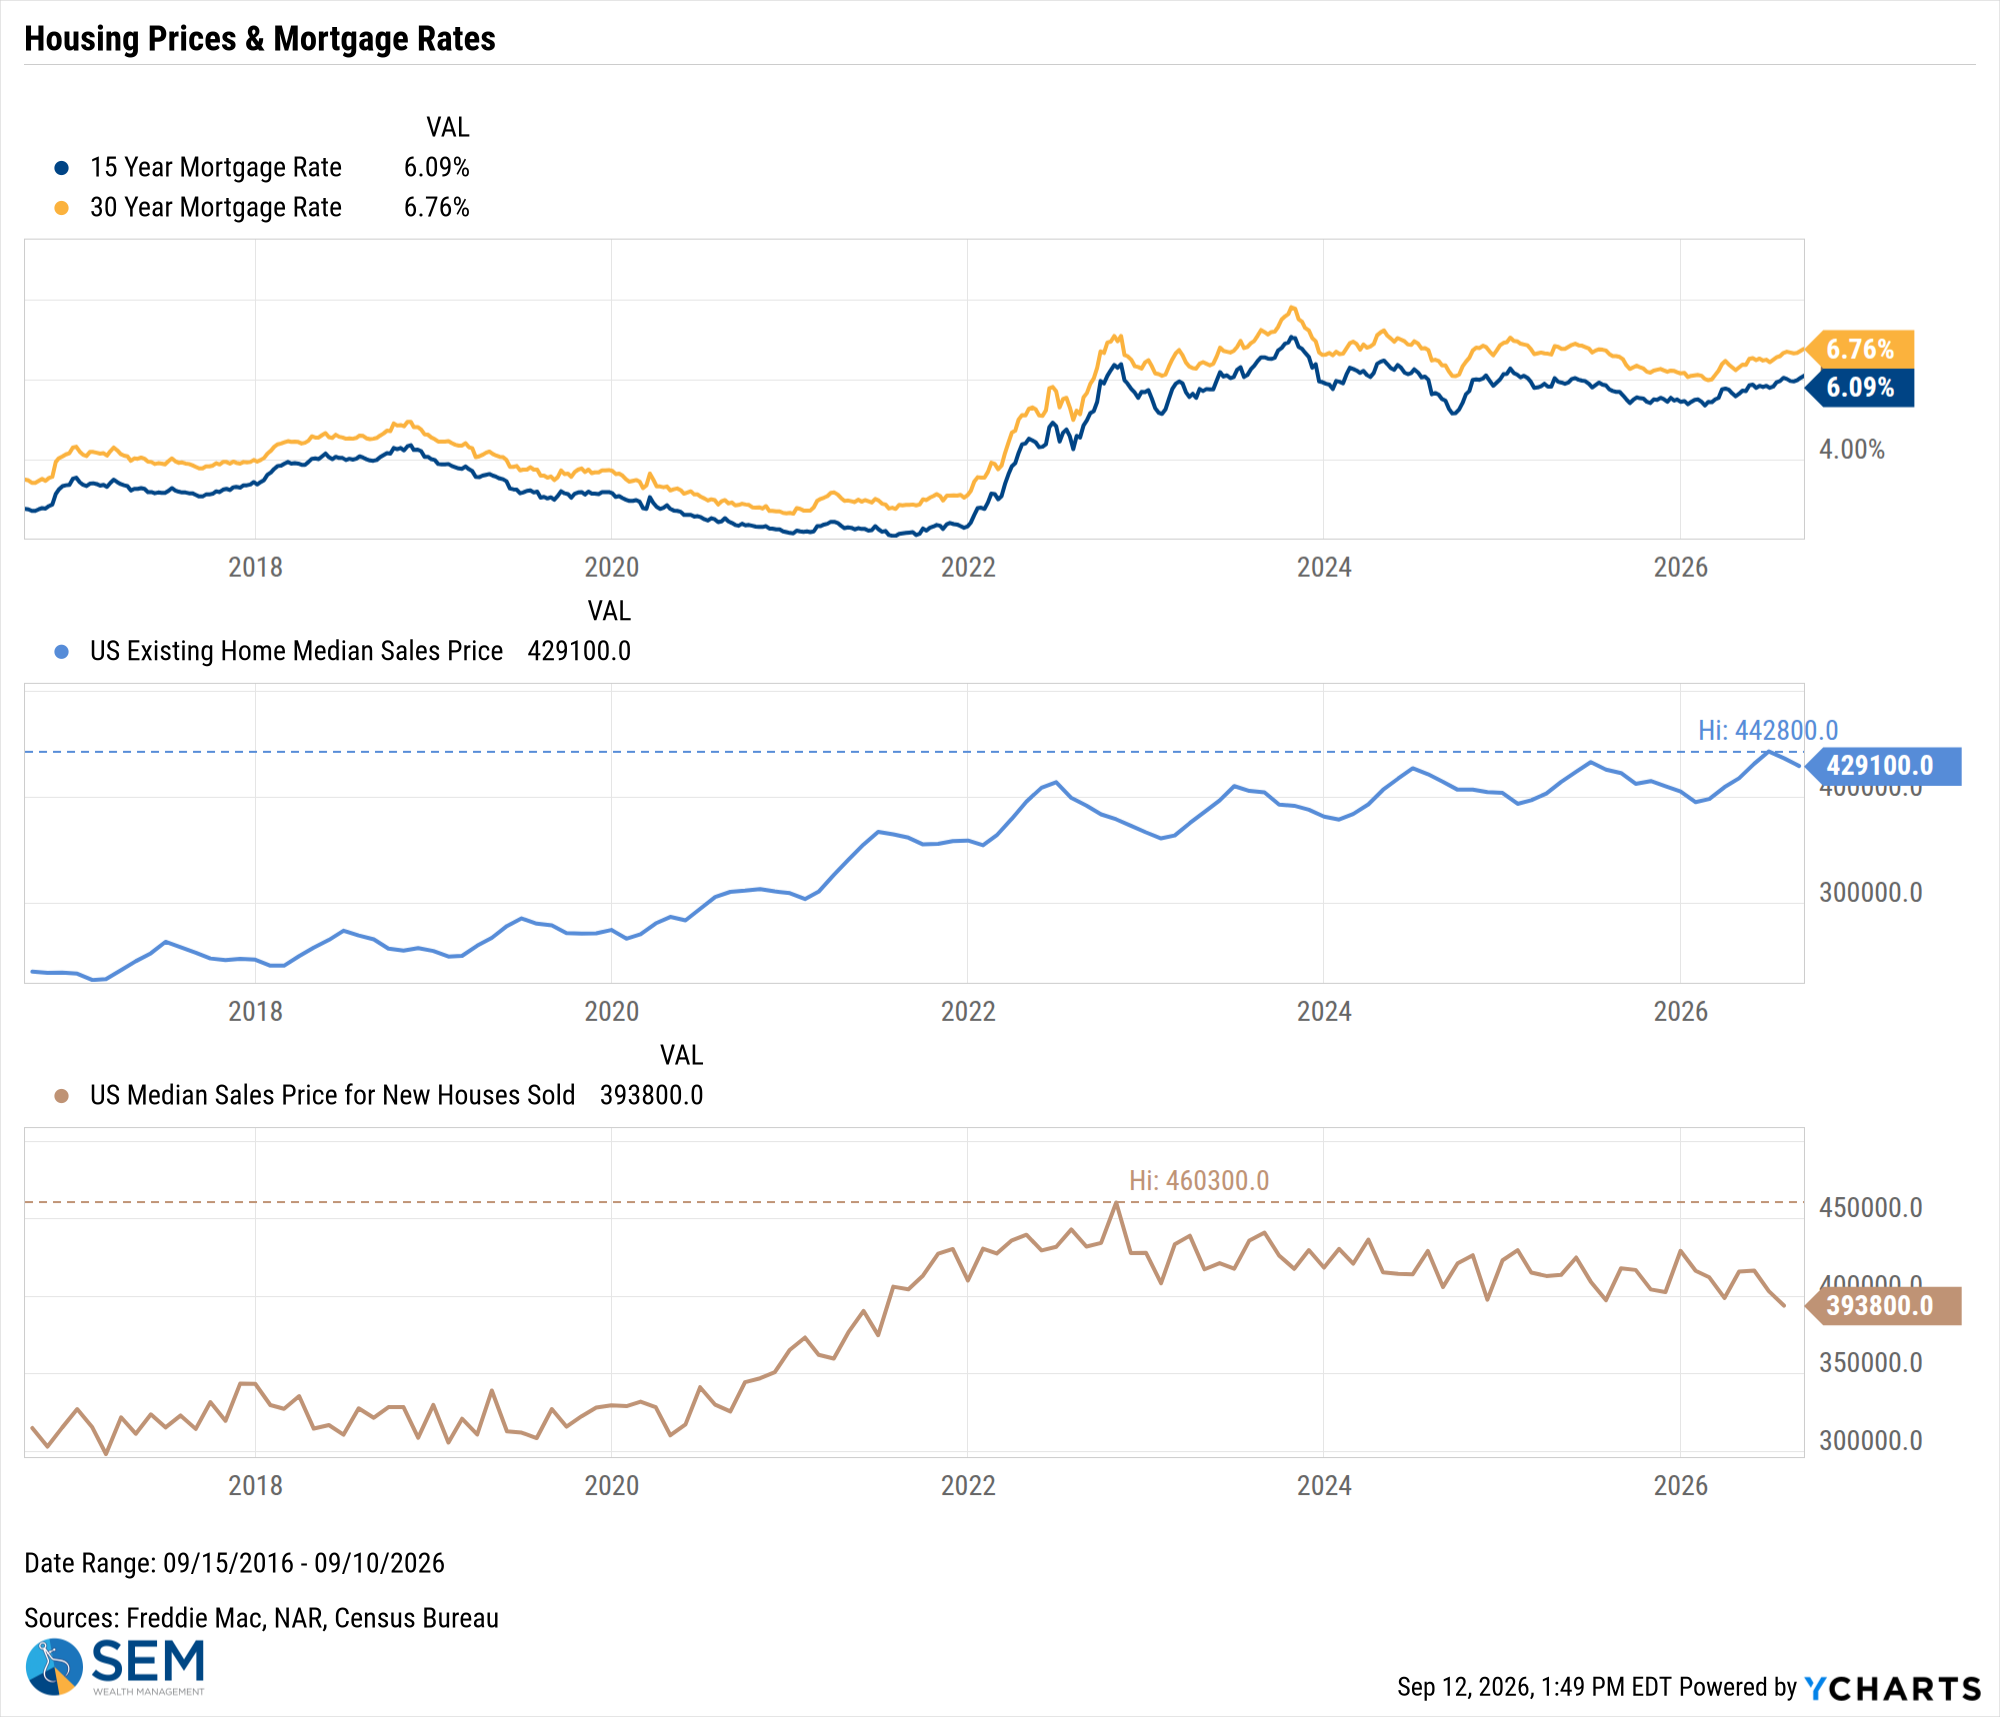
US Existing Home Median Sales Price data by YCharts
SEM Market Positioning
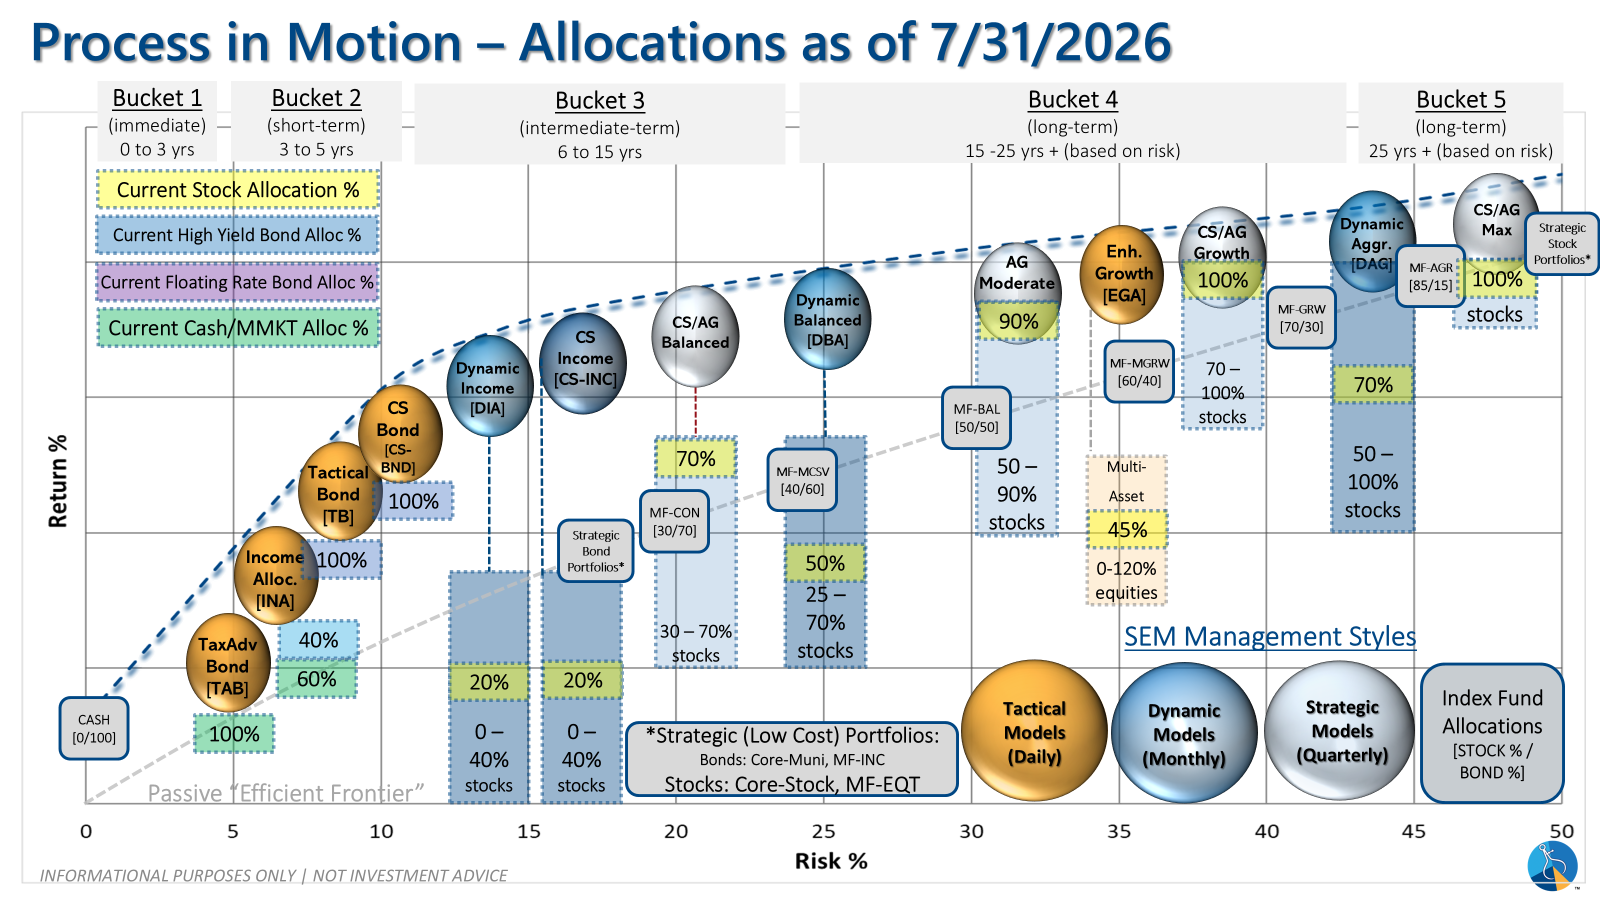
SEM deploys 3 distinct approaches – Tactical, Dynamic, and Strategic. These systems have been described as 'daily, monthly, quarterly' given how often they may make adjustments. Here is where they each stand.
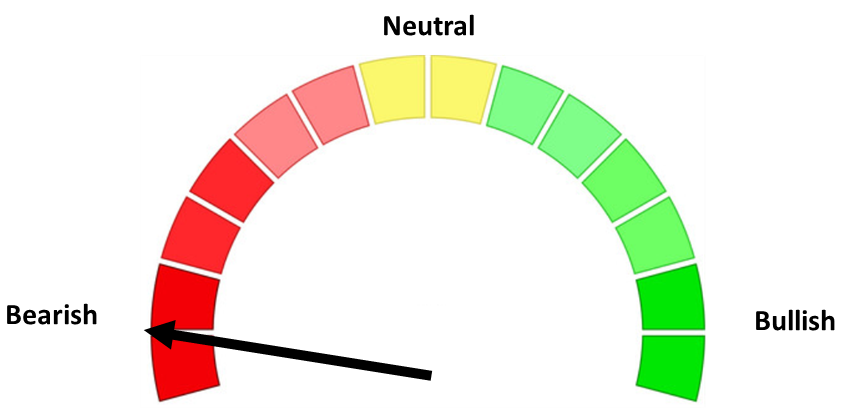
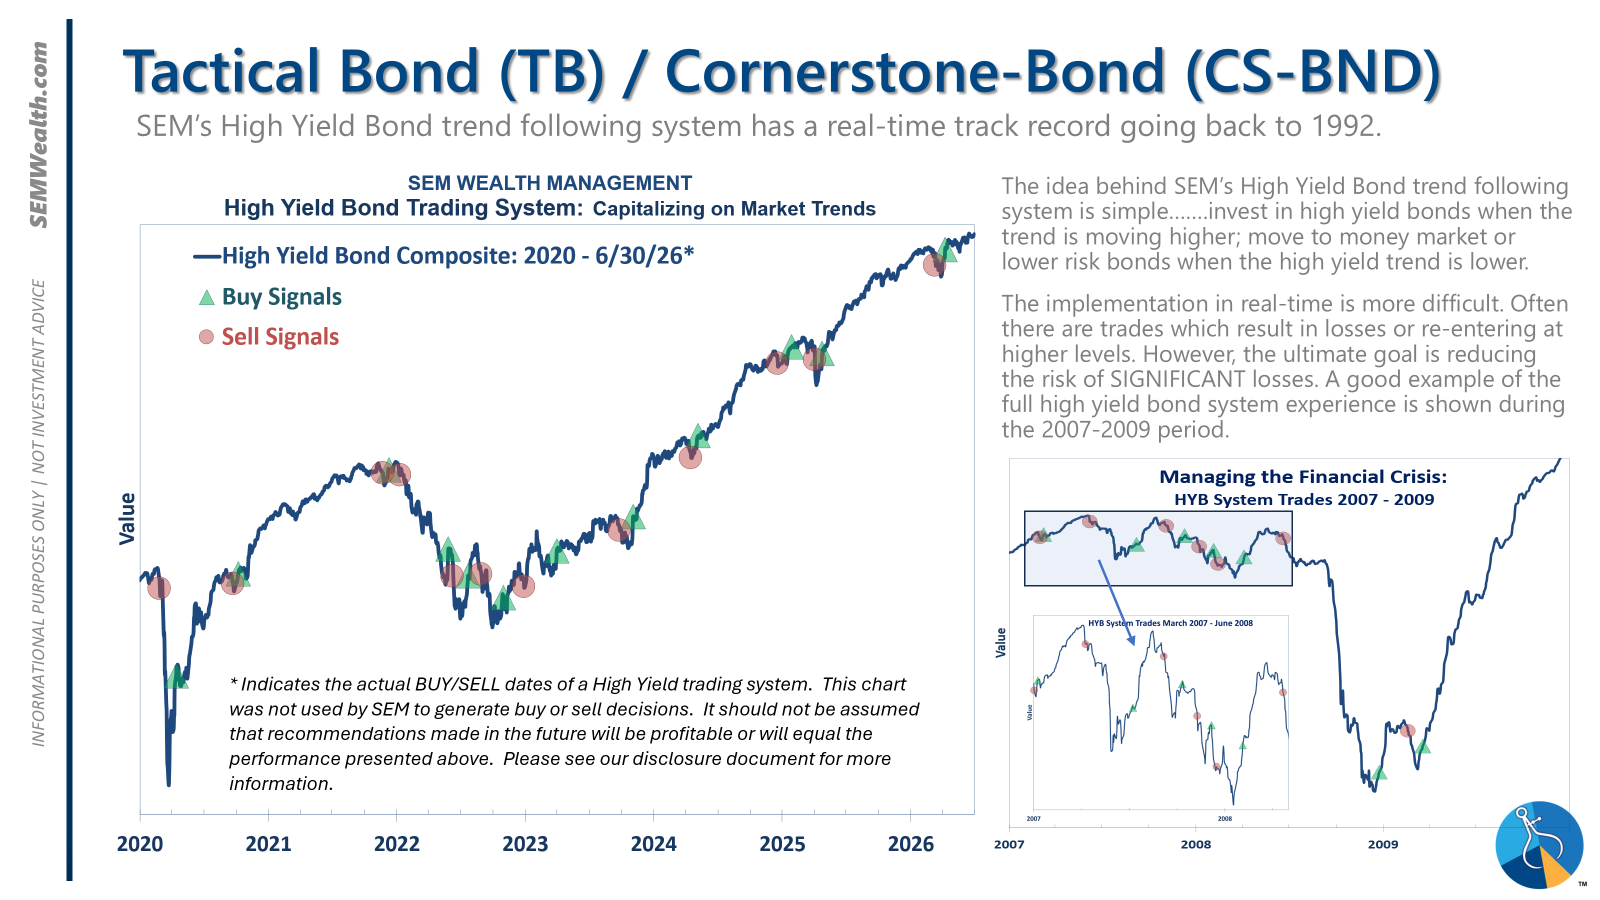
- Tactical = BULLISH | 100% High Yield Bond (4/8/2026) | High-yield spreads remain narrow but trend is slightly higher
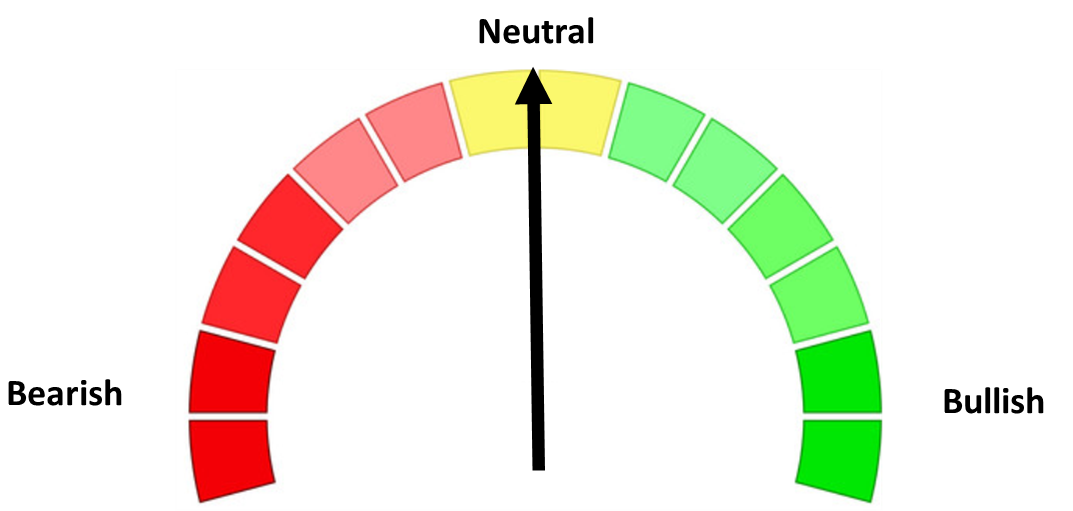
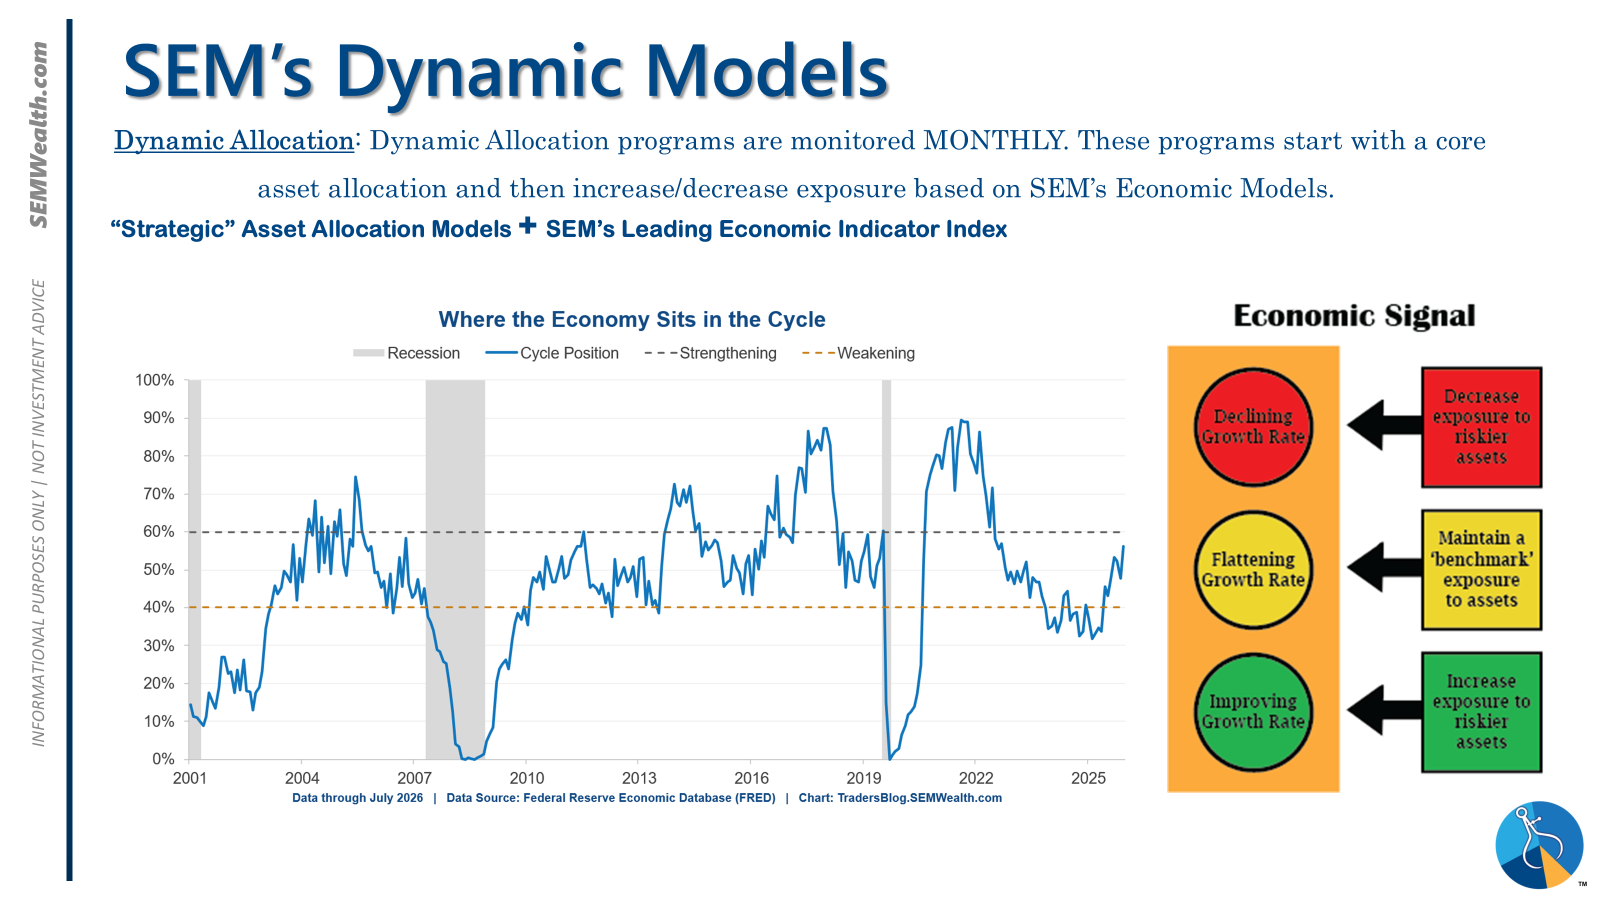
- Dynamic = NEUTRAL (2/15/2026) | "Benchmark" Allocation | Economic model inconclusive
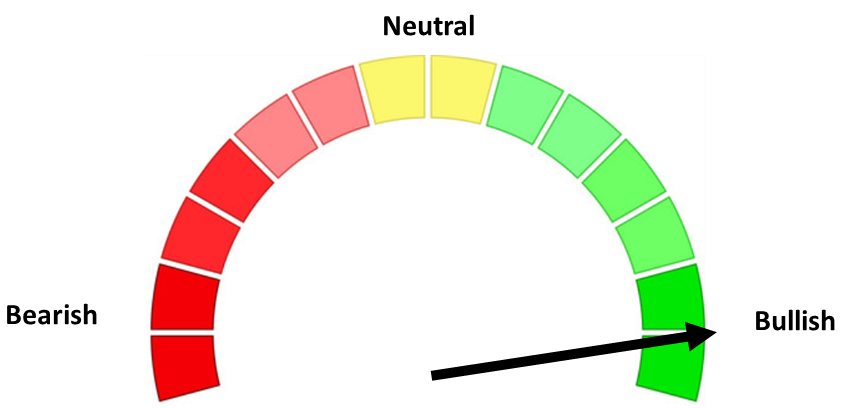
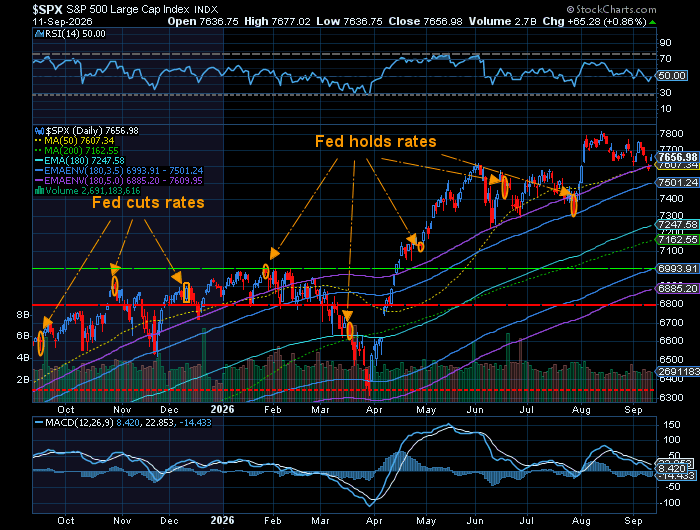
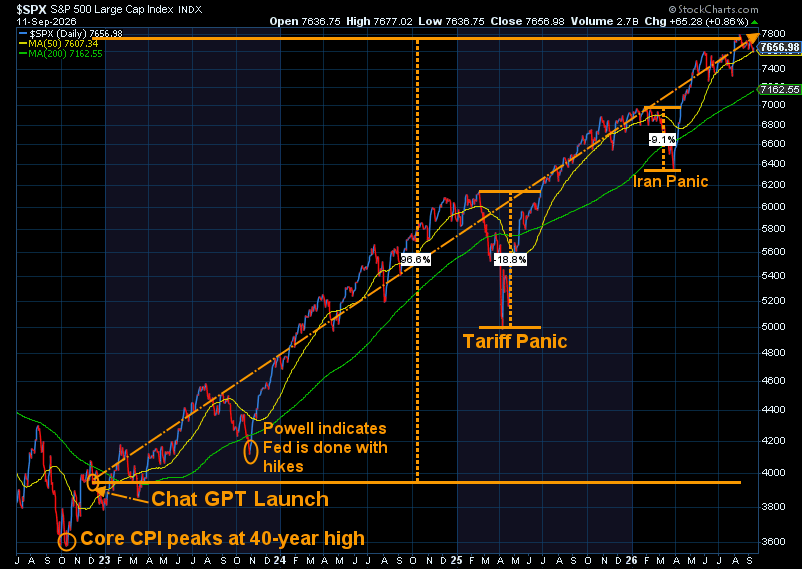
- Strategic = BULLISH (4/15/2026) | V-Bottom projecting "end" of Iran War
Tactical (daily):
- Monitored DAILY
- Models: Tactical Bond, Cornerstone Bond, Income Allocator, Tax Advantaged Bond
- Designed to follow the trends for use in our lower risk models
- BUY Signal issued April 8, 2026 (exiting the sell from March 13)
Dynamic (monthly):
- Monitored MONTHLY
- Models: All "Dynamic" Models (Income, Balanced, Growth, and Asset Allocator)
- Uses SEM's Quantitative Economic Model
- Designed to overweight riskier assets if economic trend is higher & underweight those assets if economic trend is lower.
- NEUTRAL signal issued February 15, 2026 (following BEARISH signal from July 2025)
Strategic (quarterly)*:
- Monitored QUARTERLY
- Models: AmeriGuard (Balanced, Moderate, & Growth) and Cornerstone (Balanced & Growth)
- Core Component: Quantitative Filter using 4 different time horizons across universe of asset classes
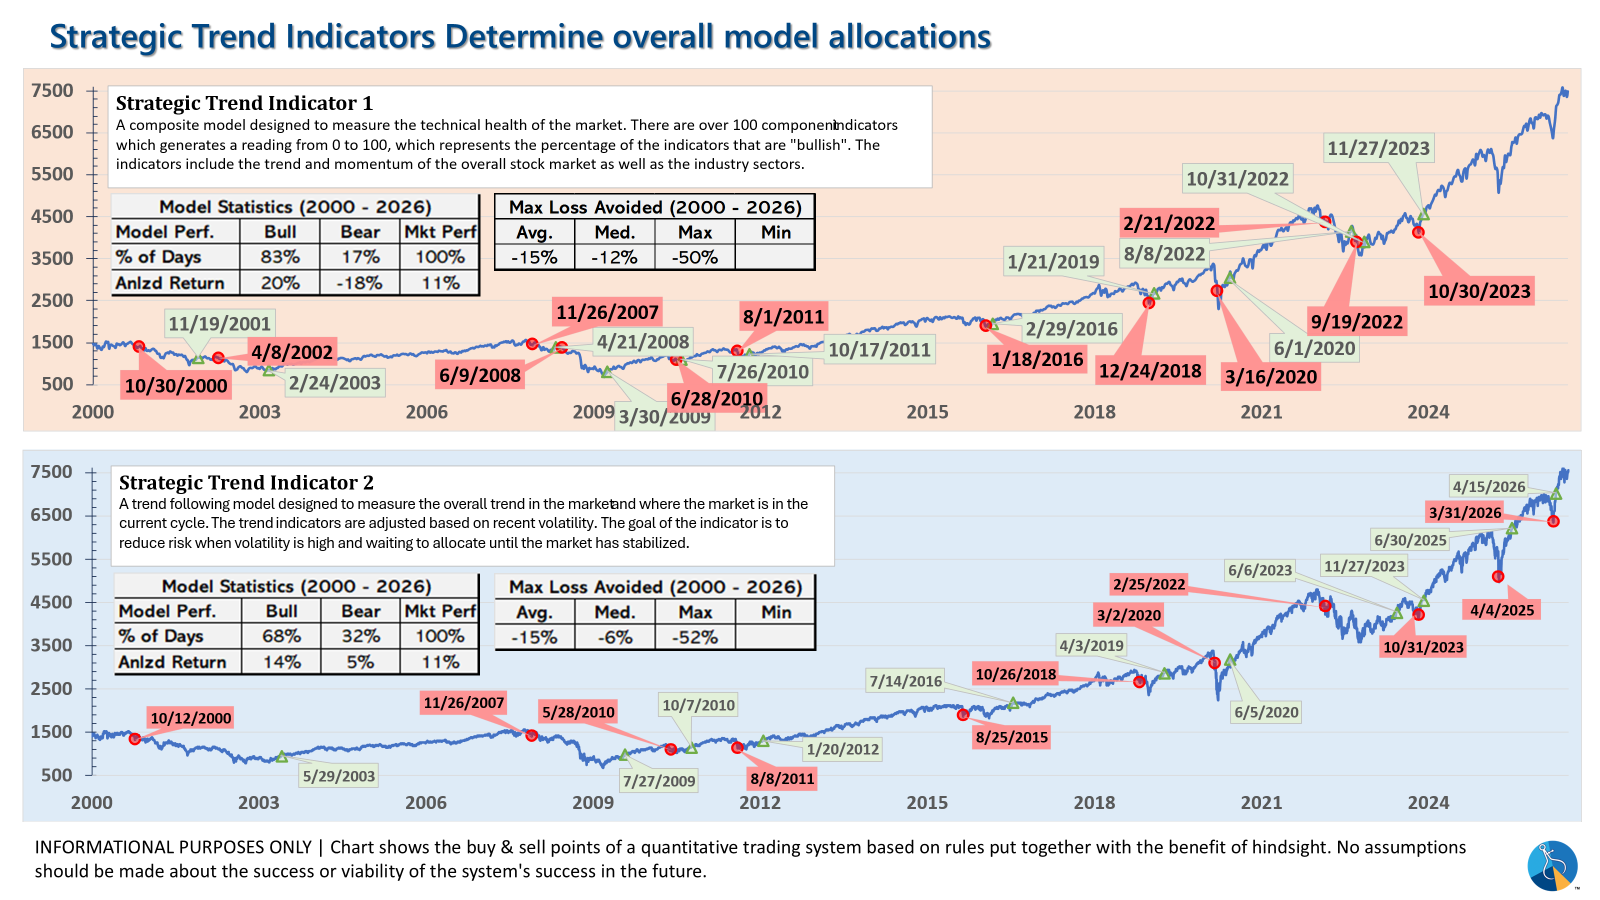
- Trend Indicator: Two different Quantitative Systems monitoring the intermediate-term trend, health of the market, and volatility
- CORE has been overweight small cap and international since October 2025 – overweight increased slightly in January
- Both TREND INDICATORS are BULLISH following 10% drop and "V-Bottom" reversal in early April
- AmeriGuard & Cornerstone Max DO NOT use the Trend indicator and are always 100% invested in stocks using our CORE rotation model.
The core rotation is adjusted quarterly. This quarter we saw half of our international positions reduced (we sold developed markets and kept our emerging markets exposure). We also saw the remaining share of mid-cap reduced in favor of more small cap exposure. We remain with a "barbell" core portfolio – about half in large cap and half in small cap as the models expect the market to "broaden".
The * in quarterly is for the trend models. These models are watched daily but they trade infrequently based on readings of where each believe we are in the cycle. The trend systems can be susceptible to "whipsaws" as we saw with the recent sell and buy signals at the end of October and November. The goal of the systems is to miss major downturns in the market. Risks are high when the market has been stampeding higher as it has for most of 2023. This means sometimes selling too soon. As we saw with the recent trade, the systems can quickly reverse if they are wrong.
Overall, this is how our various models stack up based on the last allocation change:
Curious if your current investment allocation aligns with your overall objectives and risk tolerance?