Since I started in the industry in the mid-90s, the jobs report has been the most important economic data point of the month. This means the first Friday of every month (sometimes the second if the first Friday is the 1st and sometimes 2nd) has the potential to be a big market moving day. Obviously where we are in the economic cycle and what the Fed has been saying about growth and interest rates plays a role in how important the number is. We are certainly in one of those times.
The jobs report is also the point which "closes" our economic model for the month since it is the last of the batch of reports which tells us how the economy was doing in the month just ended. The rest of our leading indicators for the prior month are not due out until the 3rd and 4th weeks of the month. We use this lull in data to update our economic model and share anything we've learned from the data.
This month we are also debuting our updated economic model and some refreshed charts and dashboards.
Understanding the AI EcoSystem
In case you missed it.......last week I took a very deep look into the OpenAI-Nvidia Ohio data center deal (which I had promised at the start of August). As you can see, it is (still) changing and involves A LOT of moving pieces. More importantly, it helps us understand both the opportunities and risks as we move through this exciting phase. Take some time to read it (or bookmark it) as it is important we all understand this ecosystem.
 Jeff Hybiak, CFA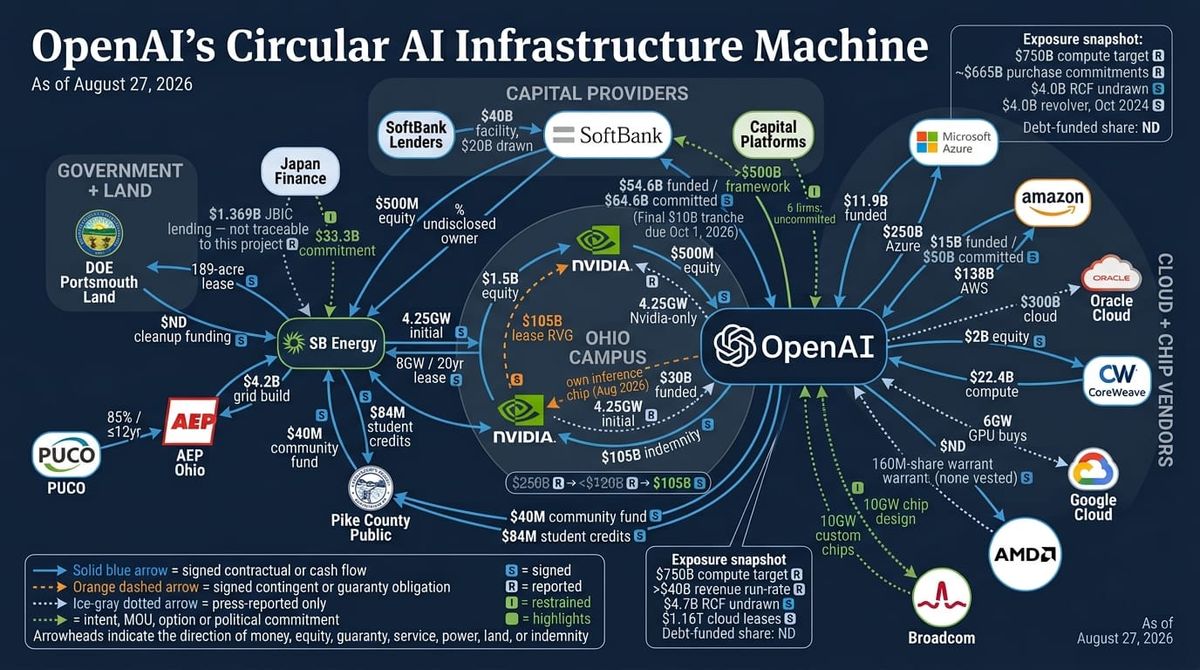
Changes to SEM's Economic Model
Before we get to the data, as I've always tried to do for the past 20+ years, I try to use the summer months for some deep research and projects. This summer I wanted to tackle our economic model, look at bigger picture cycles and study how our investment models are positioned for those cycles. If you've been following along this summer, that has meant some fairly long and heavy blog articles. When I get excited about something "new" or at least "different" I want to share that with our readers. You've already seen some previews, but we have a lot more to discuss as we move into the fall.
So before, we get to the employment data, I wanted to introduce some of those new tools as well as correcting how I've described one of our oldest ones. For years I've called SEM's economic model a forecast of GDP growth 12 months out. It isn't, and it never really was which I realized as I worked on updating the spreadsheets that drove the model. (Side note 1: I won't bore you with the details, but the original spreadsheet was built in Excel 95 and there were some hidden and deep coding things which were making it very difficult to update each month, so I decided to start from scratch.) What the SEM Economic Model actually tells us is what trailing 12-month GDP growth looks like RIGHT NOW, based on everything the data is saying today. That's a "nowcast", not a forecast, and it puts our model in the same family as the Atlanta Fed's GDPNow or other GDP readings you see often. You can see from the chart below how the model (the orange line) has done a fairly decent job at smoothing the noisy trend of actual GDP, which was the whole point of the model when I developed it.
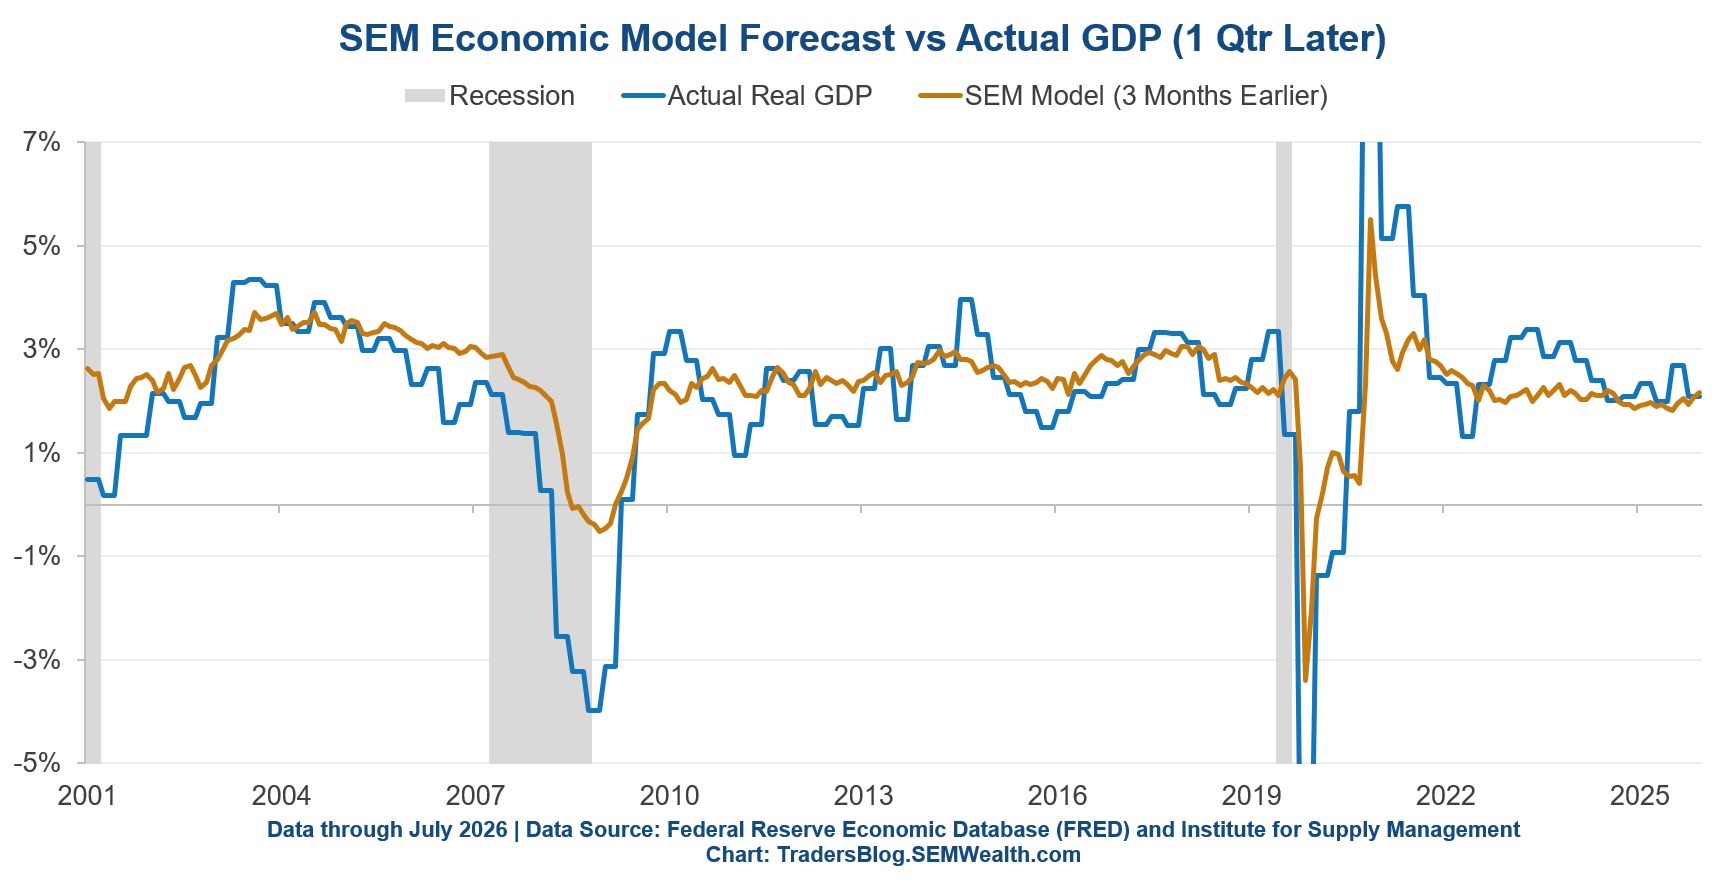
The model reading is 2.1% today against the long-term average of 3.1%. Pretty lackluster, which is roughly how the economy has felt all summer. The dashboard below is new, but the indicators inside it are nearly all the same. What changed is that we can finally see all of them in one place, easily update them (and without manual input from us). (Side note 2: a fair amount of the summer went into the plumbing rather than the picture. We now pull these series with Power Query and some Python (proving you can teach an old dog new tricks), from more than one source, because you can't just rely on the FRED database anymore (unfortunately)). When the government shut down last October and simply decided not to update or publish some of these numbers, we had to smooth over the hole. We also discovered during that time other data sources and things missing from the FRED database. Yes it's boring work, but it was fun (for me). The best part though is the dashboard updates itself every week, can pull outside sources, and is nearly automatic.)
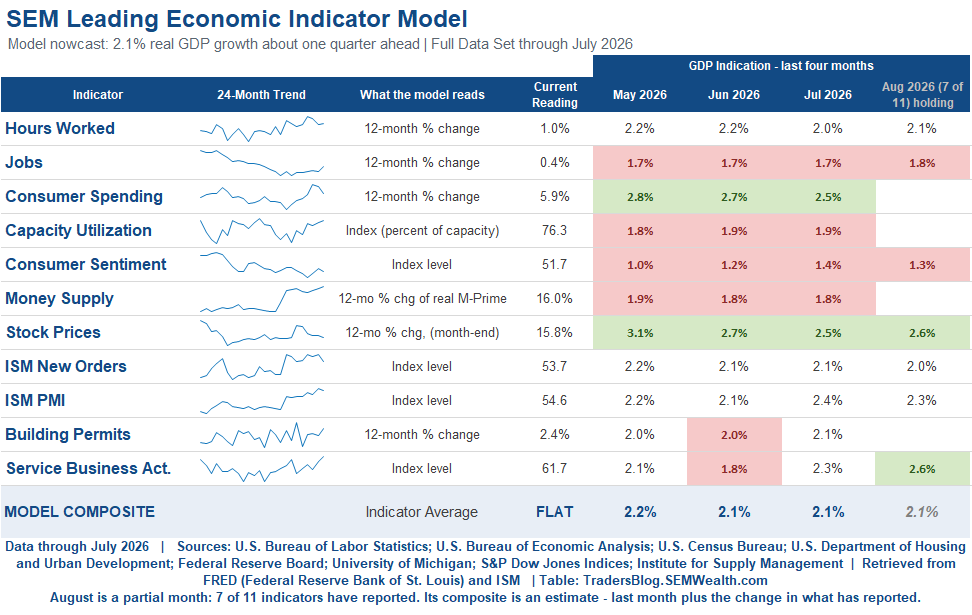
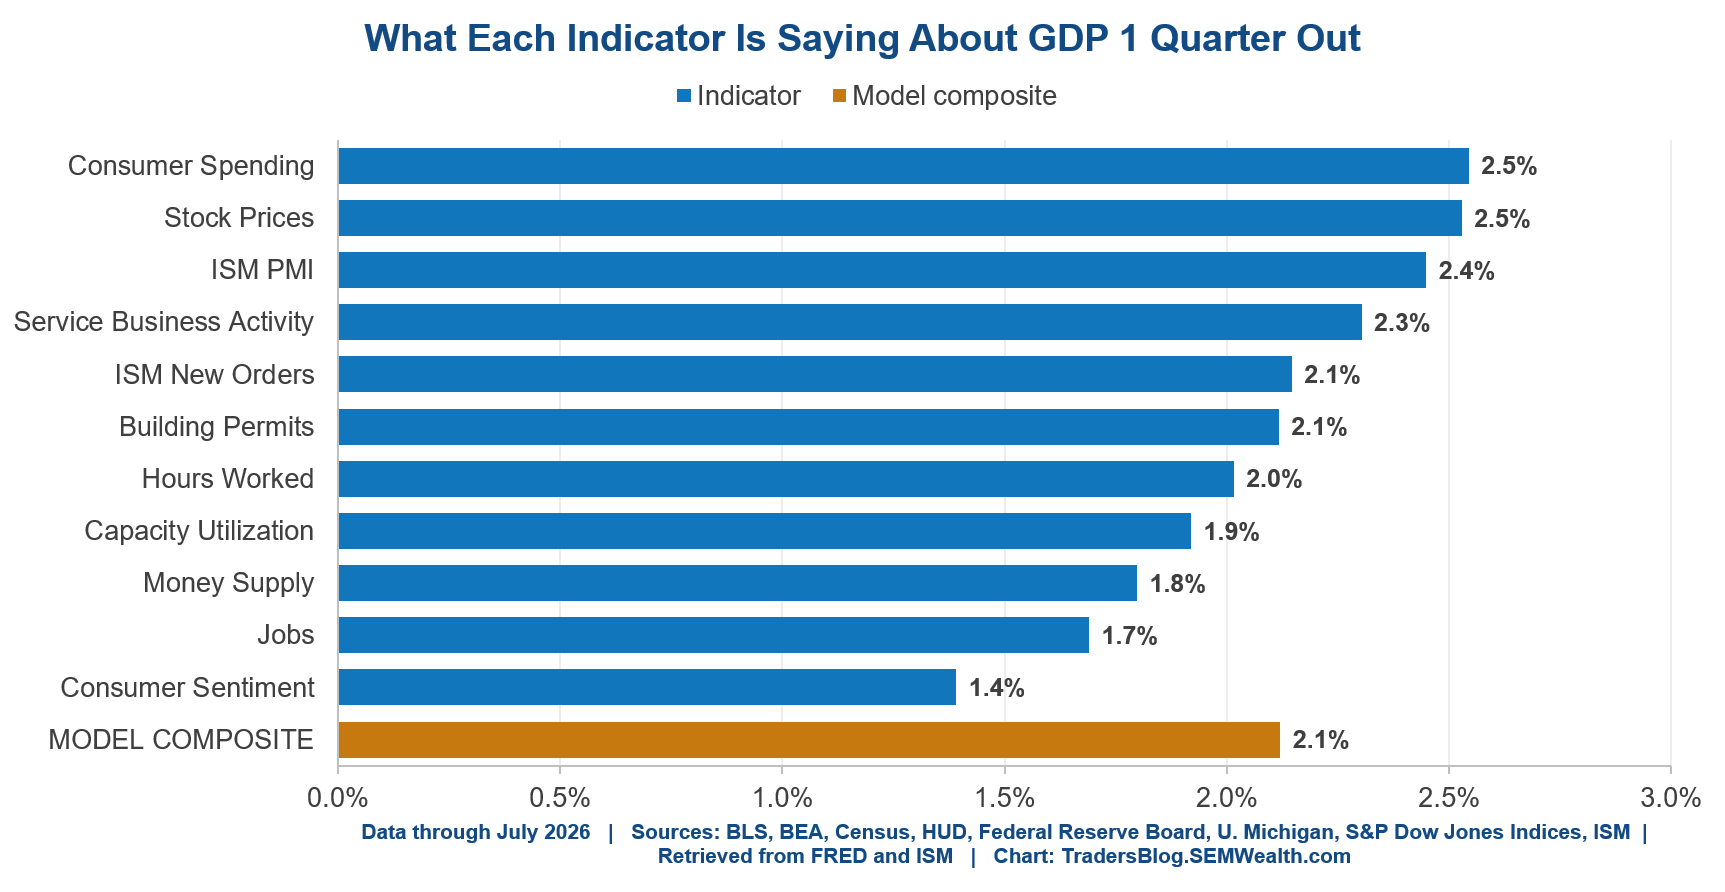
I'm more of a visual person so I like this new way of looking at the components of our dashboard.
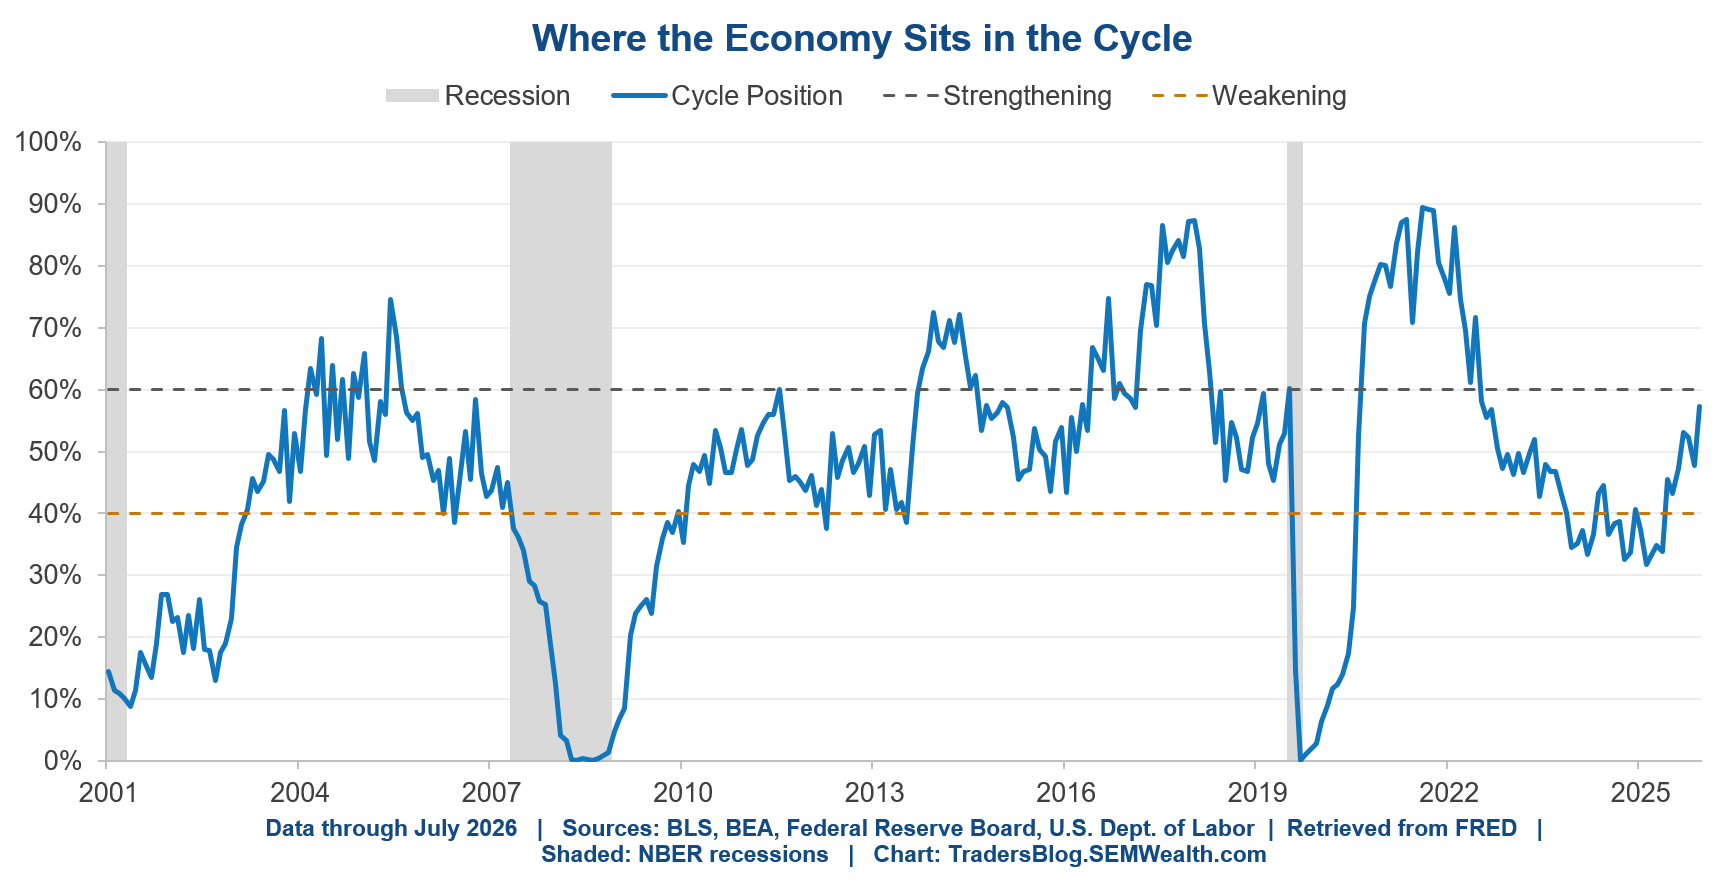
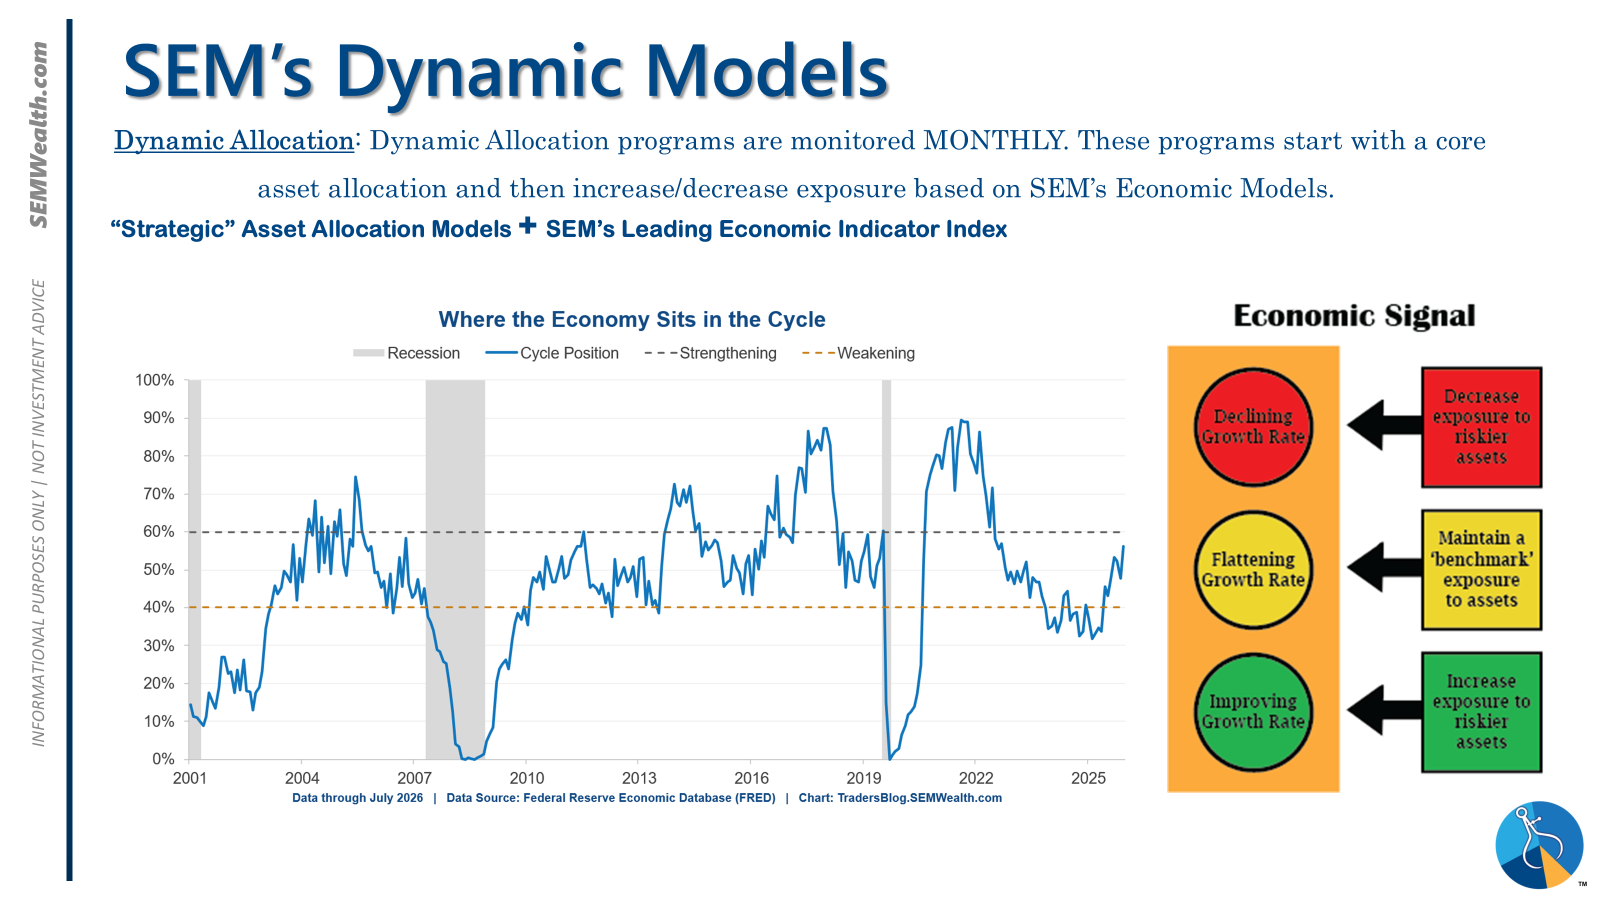
The third new chart is the one we'll be using from here on out. Our economic model gets the DIRECTION of the economy right, but the real economy is noisier than the model, so shocks like 2008 and COVID show up late. If all you're doing is describing the economy, a lag is fine. If you're using it to decide how much stock to own (like we do for Dynamic Aggressive Allocator), a lag is a problem. So we built an oscillator on top of it. This gives us a cycle position reading that runs on a 0 to 100 scale with a neutral band in the middle. Above the band the economy is strengthening, below it the economy is weakening, and the reading has to confirm itself before we act on it. We've been neutral for six months. Because it normalizes the trend rather than chasing it up and down, it sits in the middle more often and whipsaws a lot less. Just as before, a nowcast of the economy will de-risk partway down. It will never get us out at the top. That's not what it's for, and it's why we utilize outside tactical managers to assist us to do that job when the economic model can't.
Improvements to Dynamic Aggressive Growth
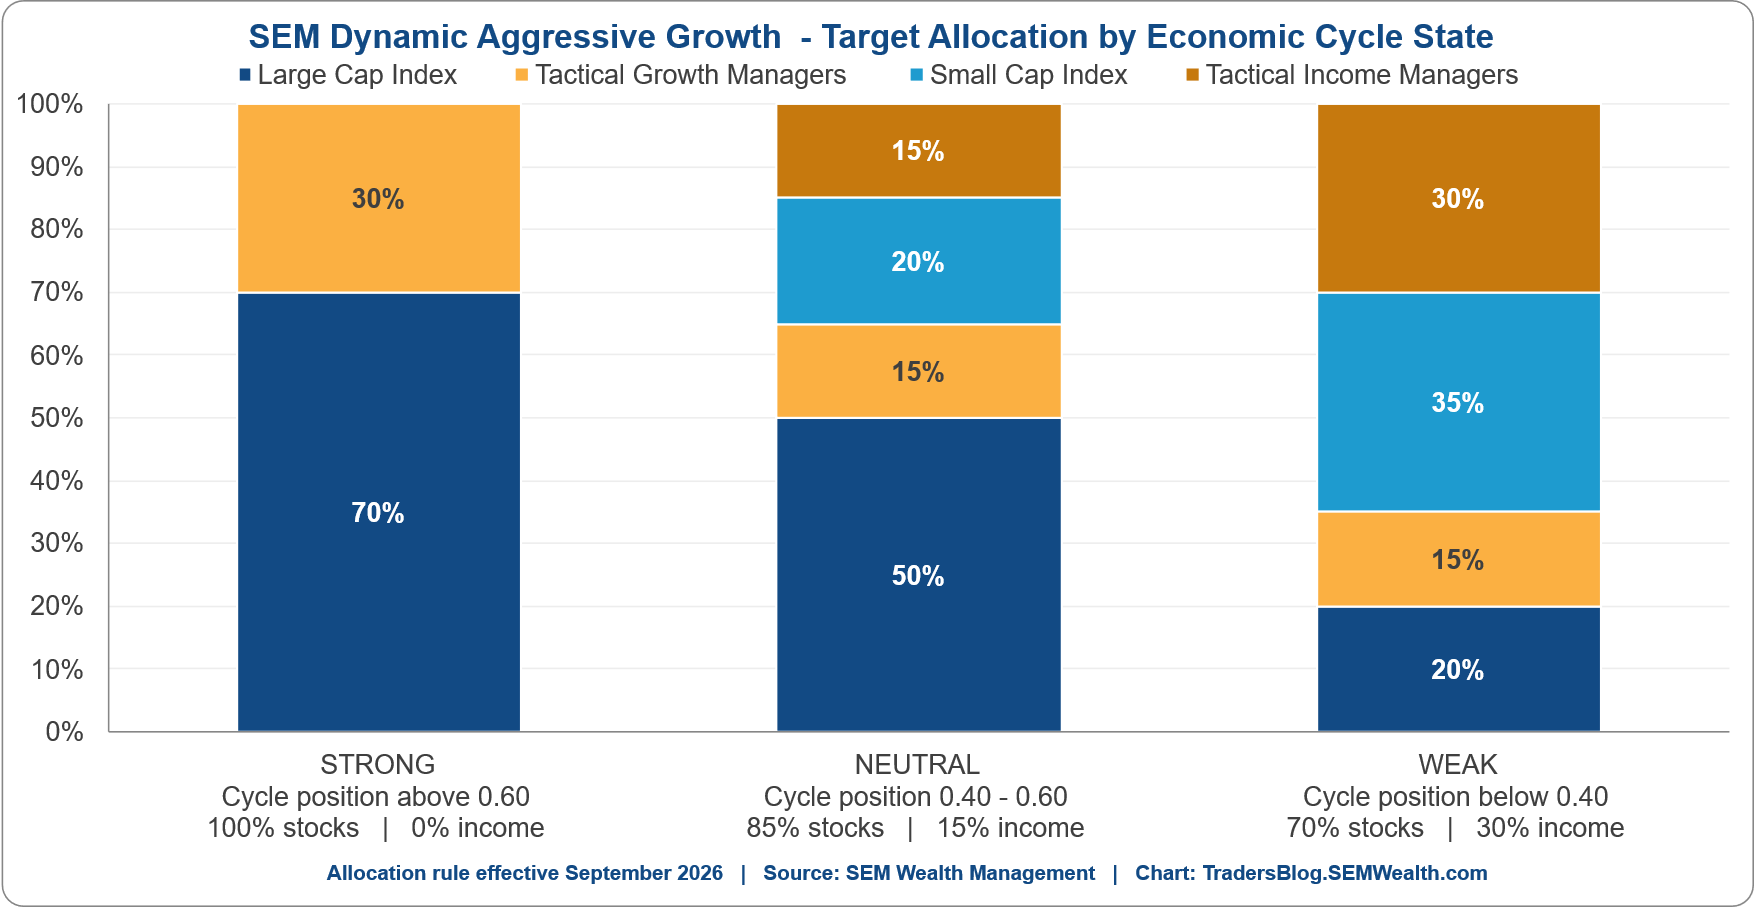
All of this brings me to the most important part – the part that actually moves money. Our old rule was built on data going back to 1986, and it assumed small caps outperform when the economy strengthens. Going back through it this summer, that's been backwards for this entire century. Since 2000, small caps have become far easier to trade and a much smaller slice of the market, and what happens when the economy strengthens is that the biggest companies take share, which is exactly the concentration everybody complains about (including me). Small caps play catch-up when the economy WEAKENS, because they're more nimble coming out the other side of the boom cycle (and/or they had much more attractive valuations because they didn't get sucked into the "euphoria" of the boom.)
So with this new research, Dynamic Aggressive will lean large cap when the cycle reading is strong, adds small caps and tactical fixed income when it's weak, and does what it has always done in the middle. Since we're sitting neutral, nothing in the model changes today. Put more simply, this is a better set of instructions for the next turn, not a call on this one.
There are two more things worth mentioning. The new rule would have helped LESS than the old one in a fast shock like 2020 or 2022, and more in a genuine recession like 2007-09. What it really buys is a faster recovery afterward, which is the whole spirit of the name Dynamic AGGRESSIVE GROWTH. We're not restating any track record over this. I hate it when managers look back three years and rewrite their history. This is an enhancement that adjusts to a different economy and market than what we had when it was developed.
The loudest non-event of the year
162,000 jobs were added in August. "Hot", "Blowout", "Impressive" were all used in the headlines. As noted above, our dashboard didn't move.
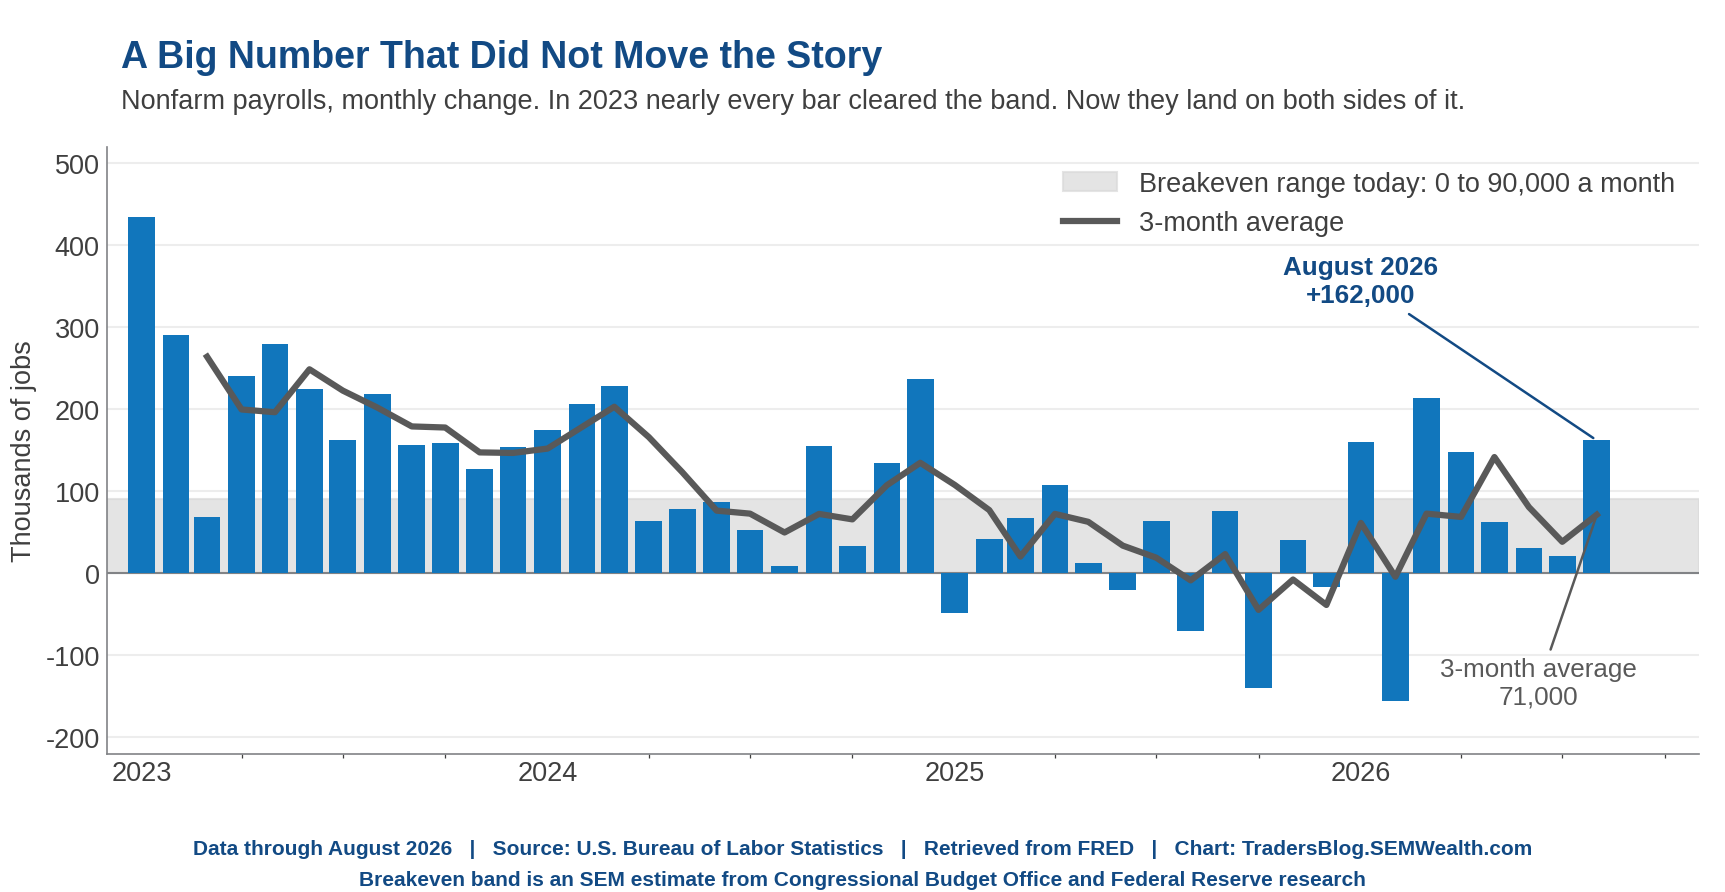
The last three months average about 70,000 a month. That sounds thin, but the breakeven rate (the number of jobs needed just to hold unemployment steady) now runs somewhere between zero and 90,000. We are inside that band, same as last month (The story didn't change from last month, so if you want to know where we stand, check out last month's economic update post).
 Jeff Hybiak, CFA
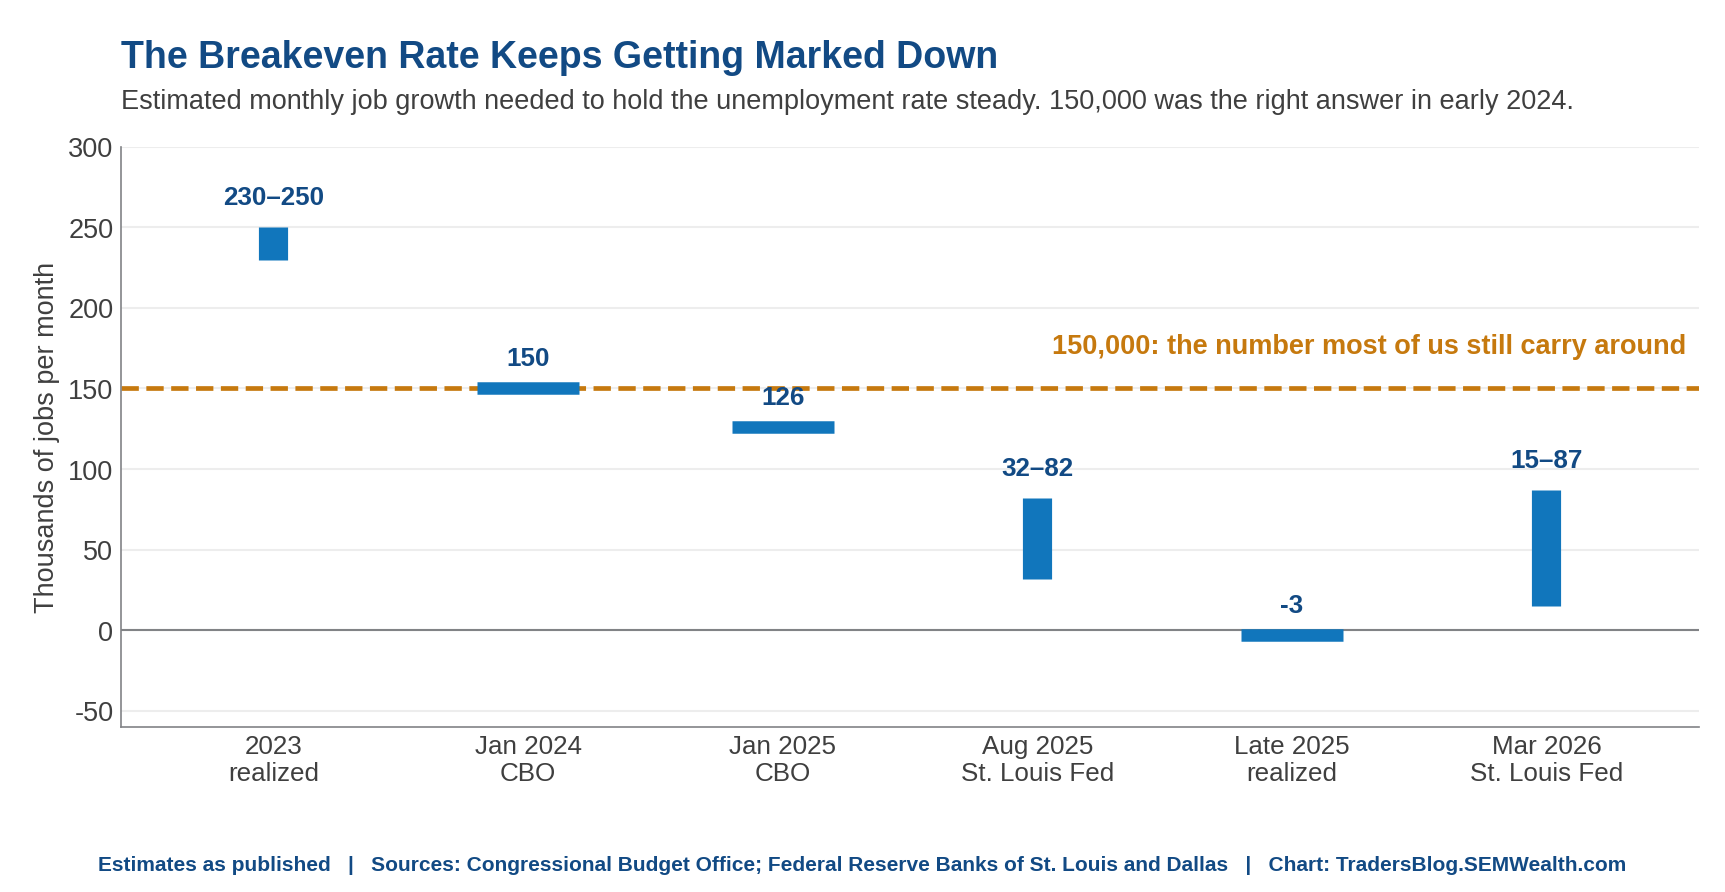
A quick clarification on breakeven employment......Last month I joked that the old guard at the Fed is still using 150,000. That was unfair to the Fed, since their own researchers are the ones who marked it down. The plainer point is this: 150,000 was the right number in early 2024. Those of us who learned this business before 2020 are still carrying it around inside our brains, and it has fallen by roughly two thirds since.
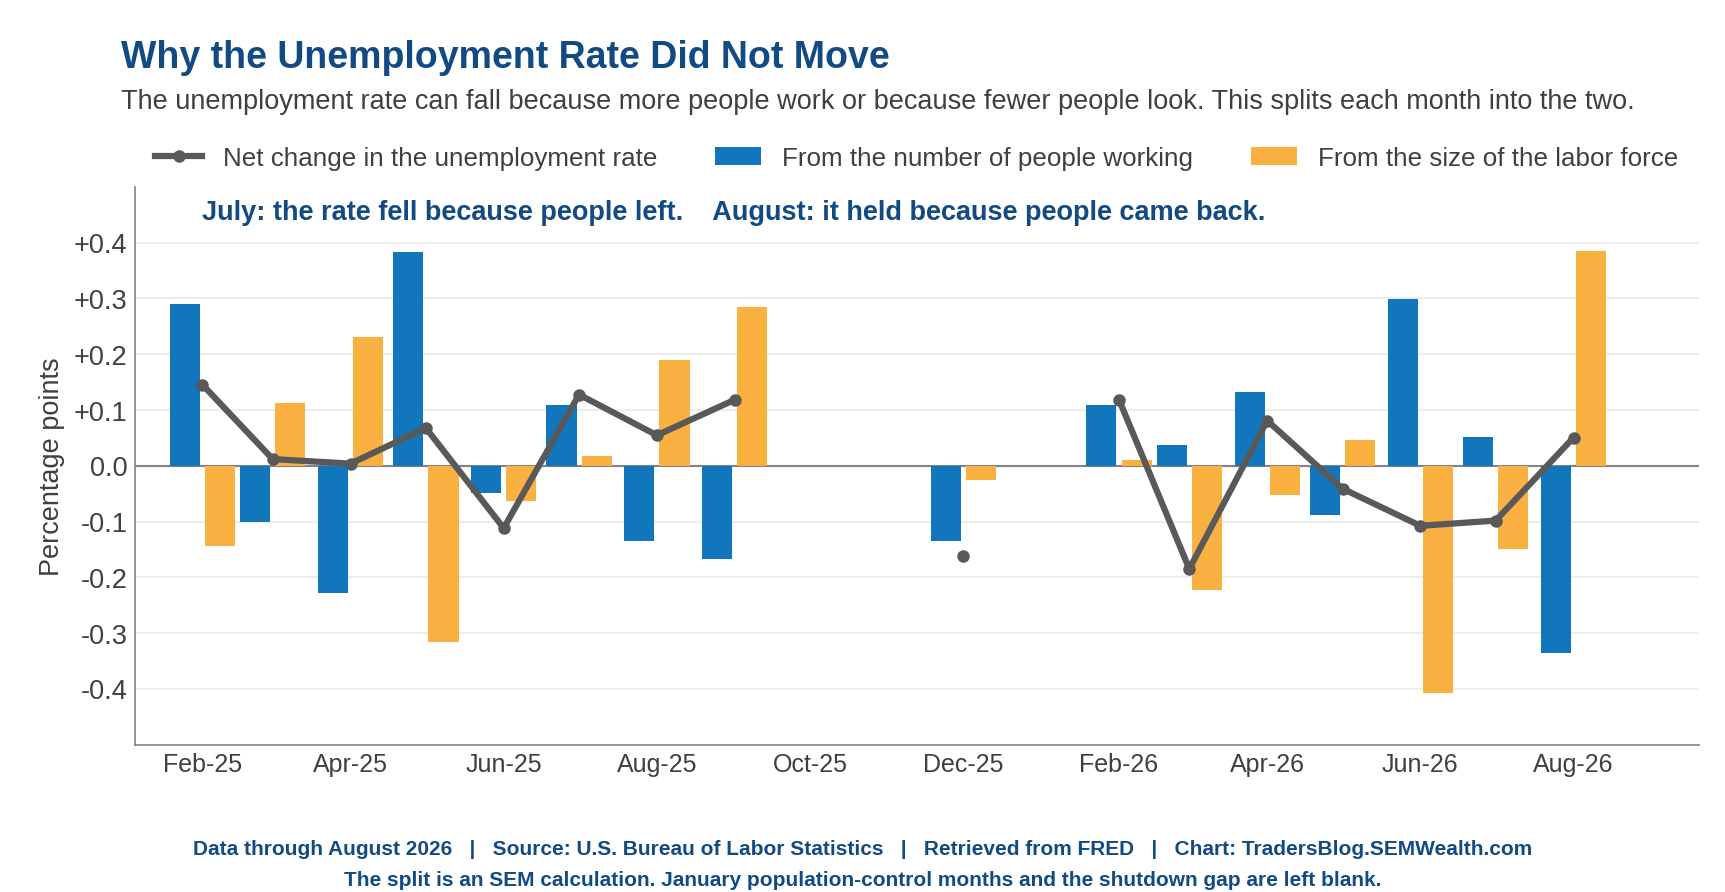
One thing did change, and for once in the right direction. The unemployment rate held at 4.1%, but unlike July it held because people came back and found work, not because they stopped looking.
Now the bullish case, because there is one. The last time I wrote about revisions they had taken 169,000 jobs off May and June. This month they put 55,000 back on, and July went from a job loss to a job gain. Hours worked ticked up too. That is the first month in a year where payrolls, revisions and hours all moved the same way. We will have to watch this closely, however since leisure & hospitality, local government, and education accounted for a bulk of the gains (all are subject to heavy revisions historically).
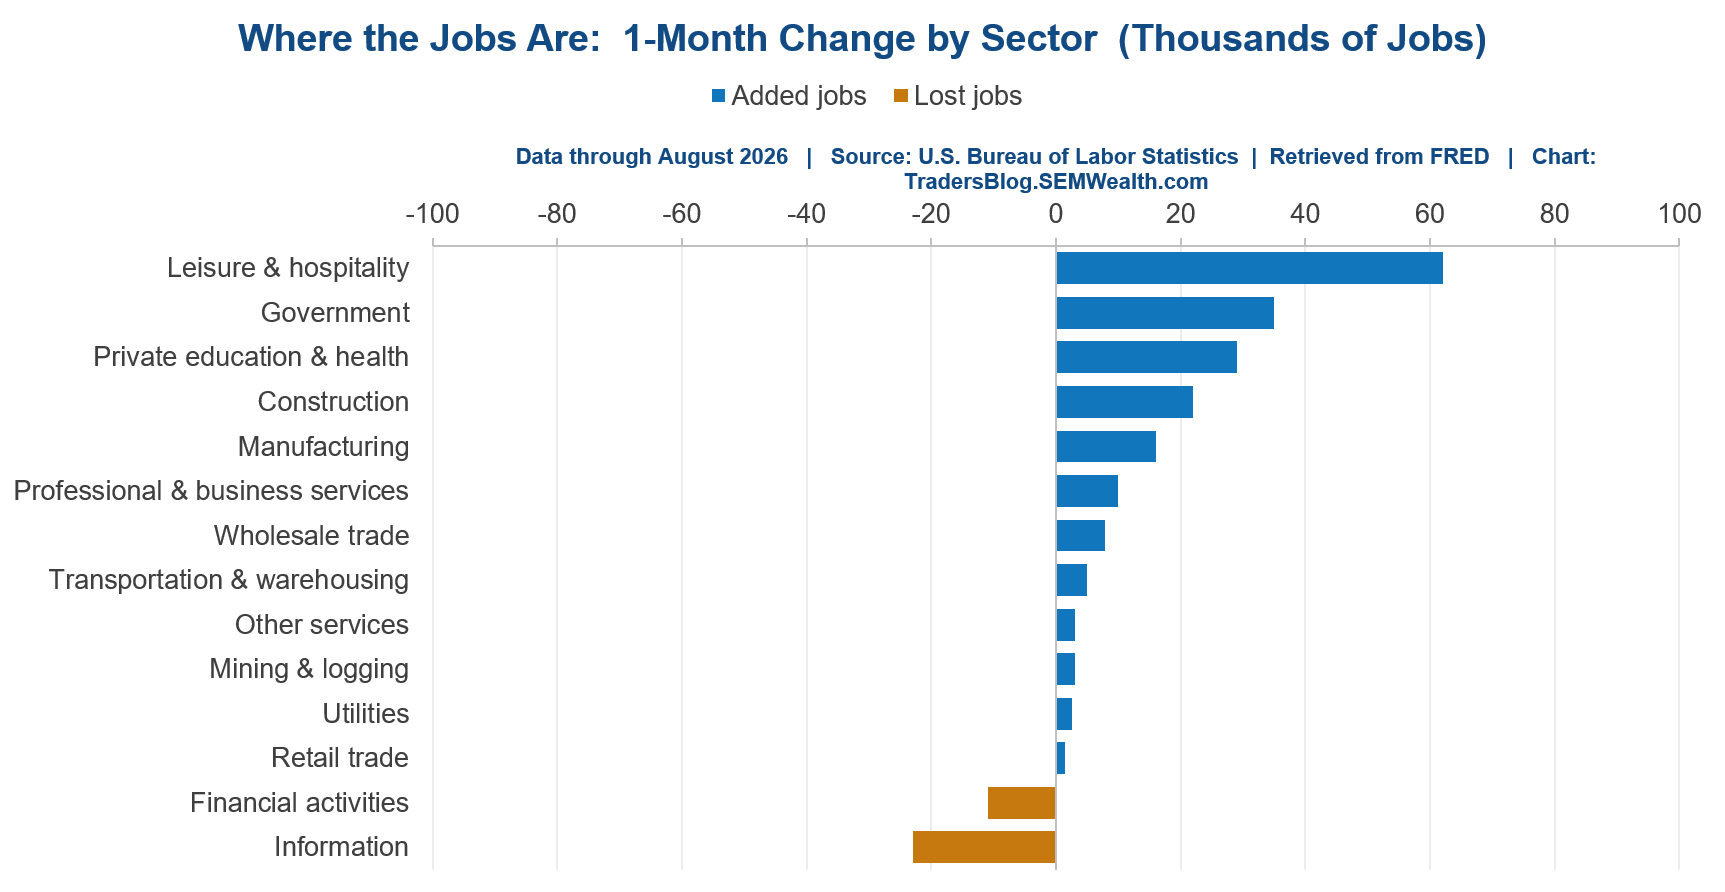
One month is not a trend. But if the next two look like this one, the "the economy is cooling so they can't raise rates" argument loses its evidence, and with inflation where it is we are back in the "bizarro" world of "good news" being "bad" for the markets.
Interest Rates Getting Interesting
On Friday, I had just finished writing the paragraph above when a news alert crossed my screen making the exact opposite argument (here is one of the articles and another one I read)......that a strong jobs number means rates should come DOWN, because a strong country is a better credit risk.
After taking time to consider this, let me first attempt to defend the economic logic behind this argument I've not seen any economists make. If the "neutral" rate (the THEORETICAL interest rate that is neither accommodative or restrictive – economists call it r*) is lower than the Fed thinks, policy is already tight and there's room to cut without stoking inflation. With breakeven employment near zero, one jobs report doesn't settle that either way. That's a legitimate case some people are trying to make because remember, "r*" is theoretical and part of the problems facing Fed Chair Warsh.
The "better credit" argument is where the argument starts to fall apart. This is the part worth understanding because it also lies at the heart of the "Debasement Trade" I detailed last week (click here for the refresher).
Credit quality determines the SPREAD a borrower pays over the risk-free rate. 3-month Treasury bonds are considered the risk-free rate. There's no spread there to squeeze. The rate the Fed actually sets is a different thing entirely. This is a policy decision weighed against inflation and employment. A stronger economy argues for HIGHER rates, not lower ones.
To repeat something I've said often: The Fed sets SHORT-TERM interest rates. The free market sets LONG-TERM interest rates. This also means the FREE market determines CREDIT QUALITY. Part of that is whether the FREE market believes a country is serious about reigning in its deficits.
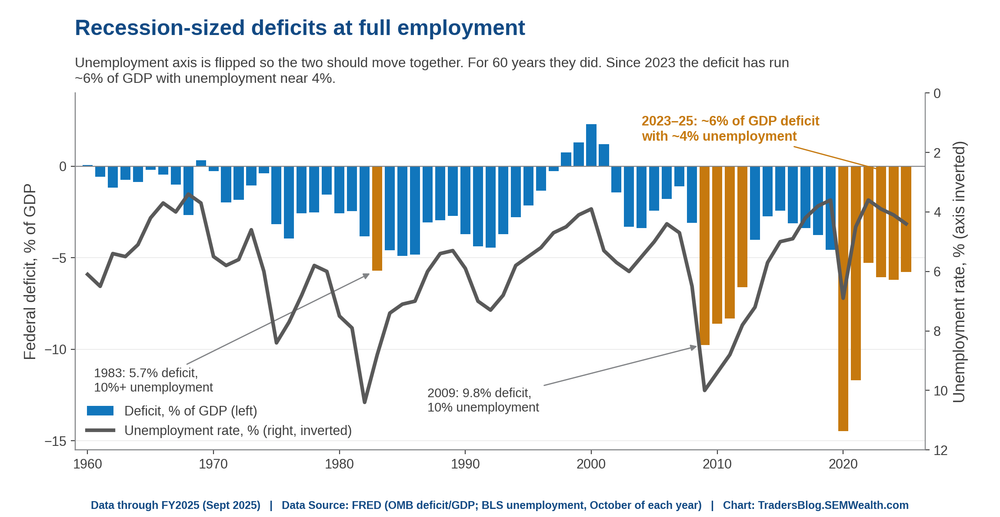
Some people seem to be forgetting that between September and December of 2024 the Fed cut a full percentage point. The 10-year Treasury went UP a full percentage point over those same months. Mortgage rates follow the 10-year, not the Fed. The FREE MARKET said long-term rates should be HIGHER (because cutting rates during an economic expansion almost always causes inflation and inflation erodes the value of your long-term bonds.)
So taking the less from the fall of 2024, if the Fed starts cutting into a stable economy with sticky inflation, lower Fed funds rates would lead to HIGHER long-term rates, including mortgages. That's the outcome nobody in this argument is asking for.
(There was also a threat to stop all trade with any country that runs a trade surplus, which would be a lot of them, including most of the suppliers of the materials needed for the AI buildout, which would counter the push from the same person to win the AI race at all costs. I don't think any one is taking that threat seriously.)
Please understand this is an ECONOMIC point, supported by data, research and three decades of experience, not a POLITICAL one. I blasted the Powell Fed's cutting in 2024, and I'd write this paragraph no matter who was making the argument if it was circulating as an idea in the mainstream.)
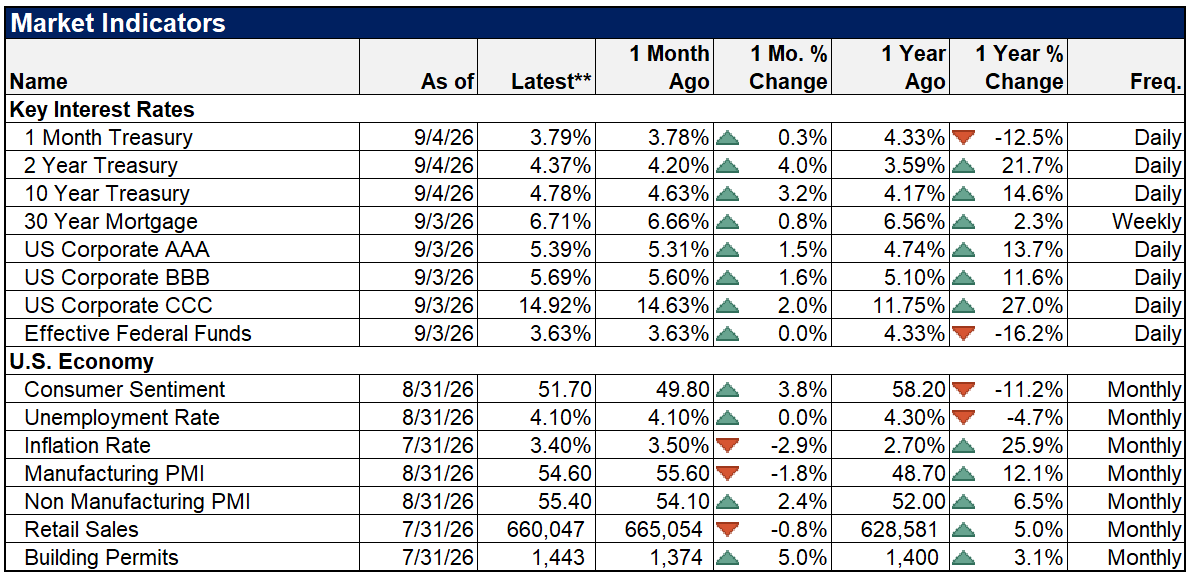
Back to the DATA and the yield curve, rates continued to move higher following the big jump in short-term rates the day of Fed Chair Warsh's Jackson Hole speech a week earlier rates. The jobs report (or demands to cut rates or end free trade) didn't really move things on the interest rate side.
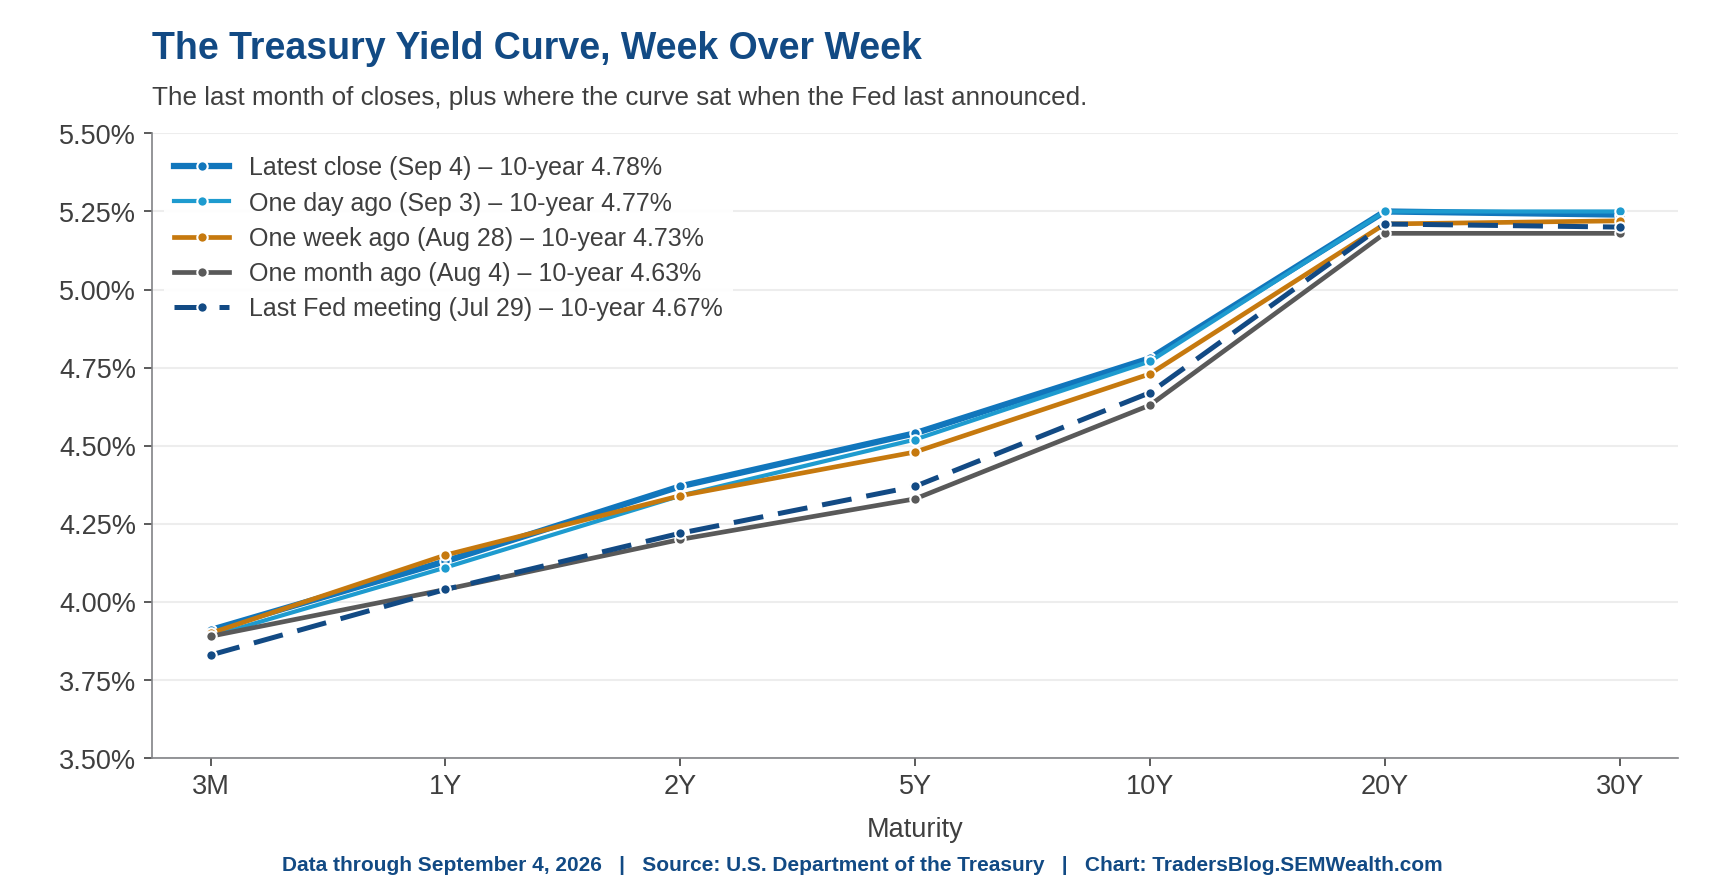
This will likely continue to be a story we will have to monitor as higher rates can have a big impact throughout all asset classes.

No Welcome Mat Yet: An Update on Housing Outlook

The U.S. housing market remains under pressure as elevated mortgage rates, affordability challenges, and limited supply continue to weigh on buyers. Against a backdrop of evolving Federal Reserve policy, geopolitical uncertainty, and rapid advances in artificial intelligence, it would be helpful to revisit the latest housing trends and assess what lies ahead for prospective homebuyers as school returns to session.
Housing Demand
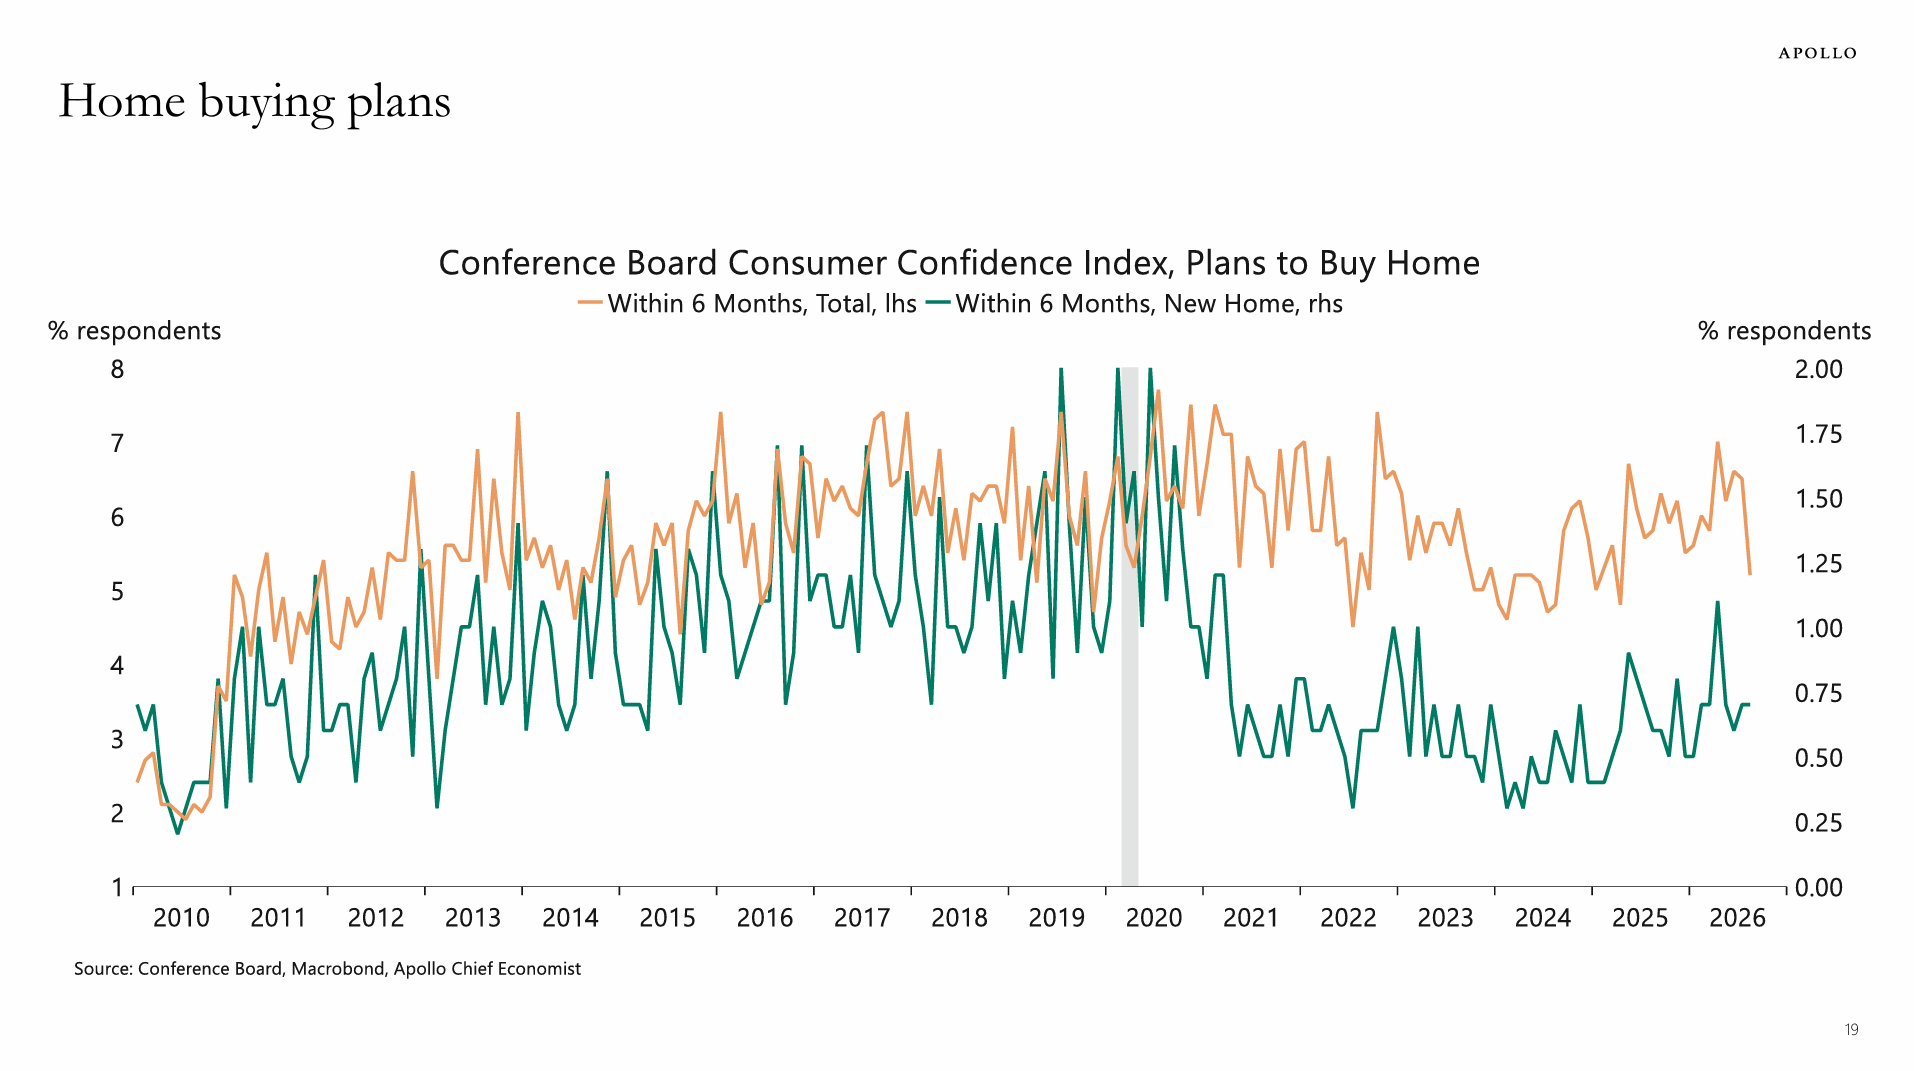
After the U.S. experienced two of the hottest months on record (not ideal house-hunting weather), and with monthly mortgage rates rising for the sixth consecutive month, consumer confidence isn't particularly high among first-time homebuyers or those looking to downsize.
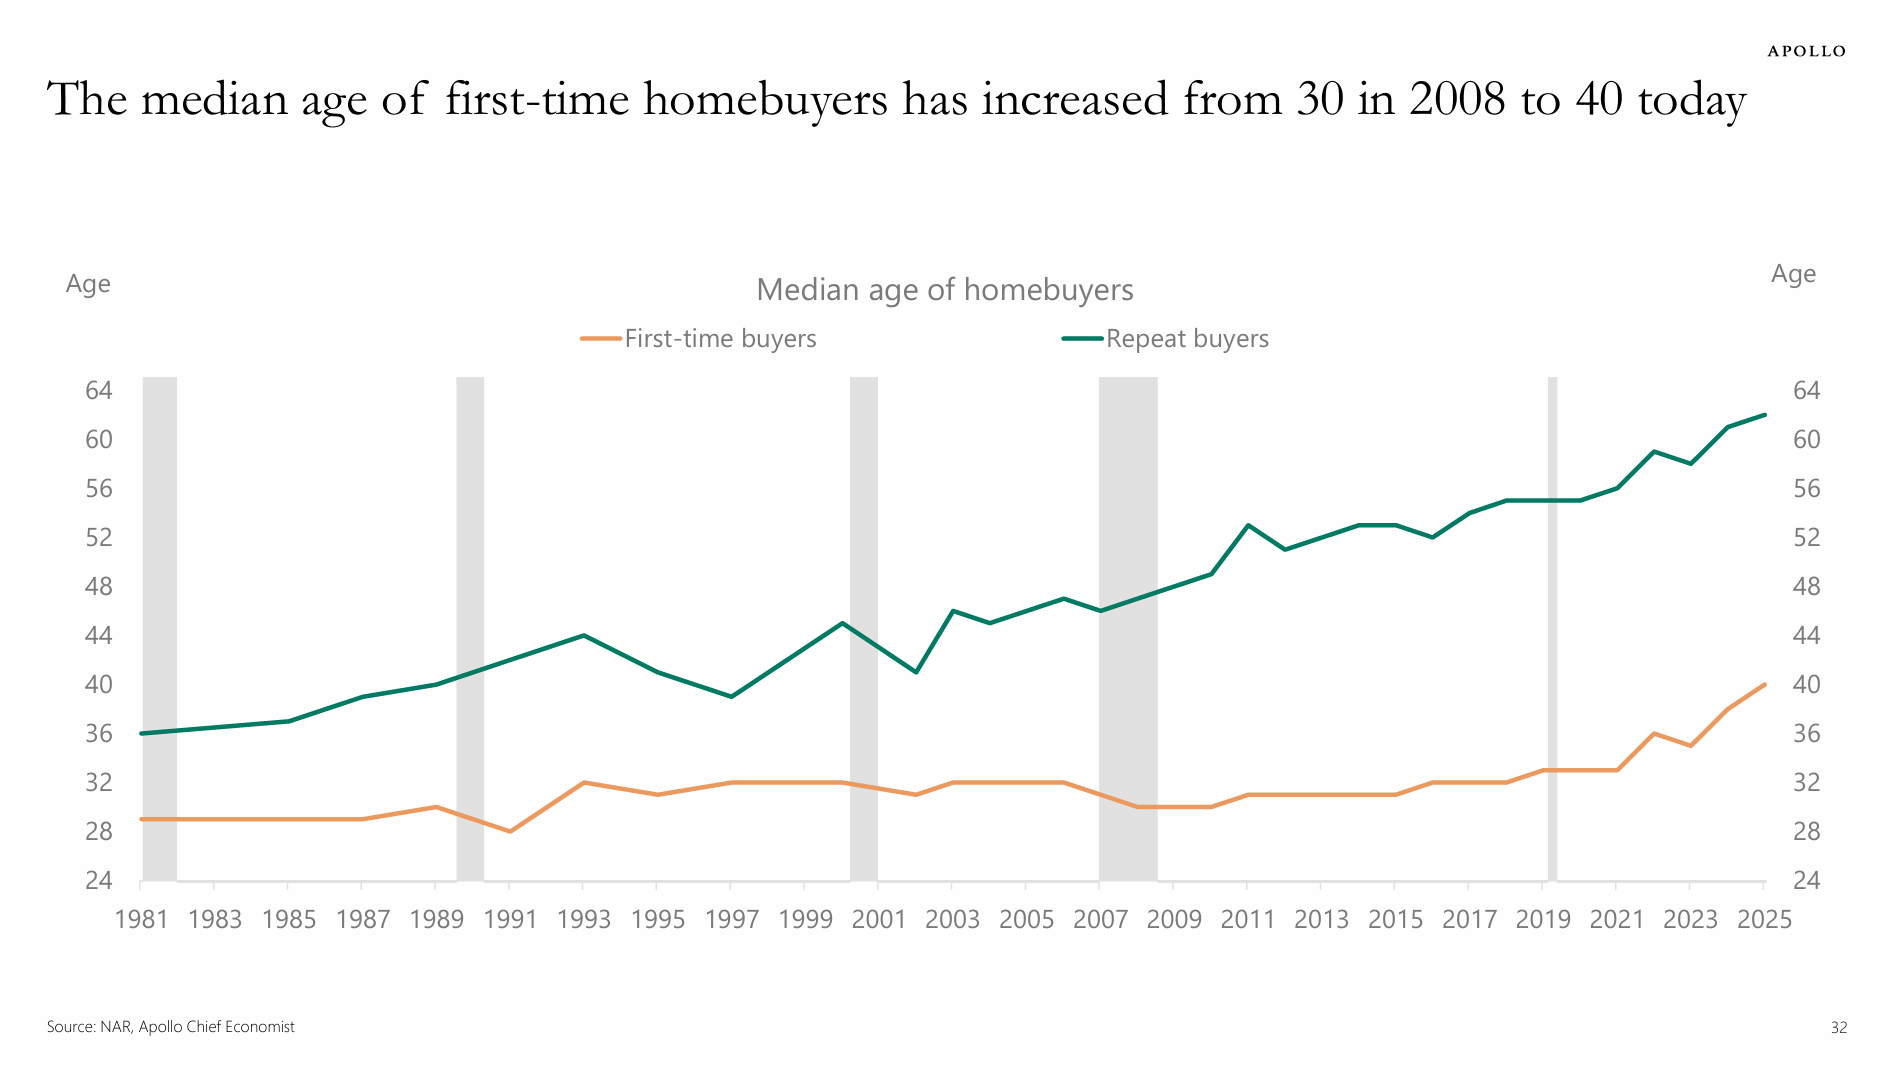
In fact, the median age of first-time home buyers has increased from 30 in 2008 to 40 (!) today.
Demographic trends show that the population aged 80 and older will grow dramatically over the next decade, driving demand for senior housing.
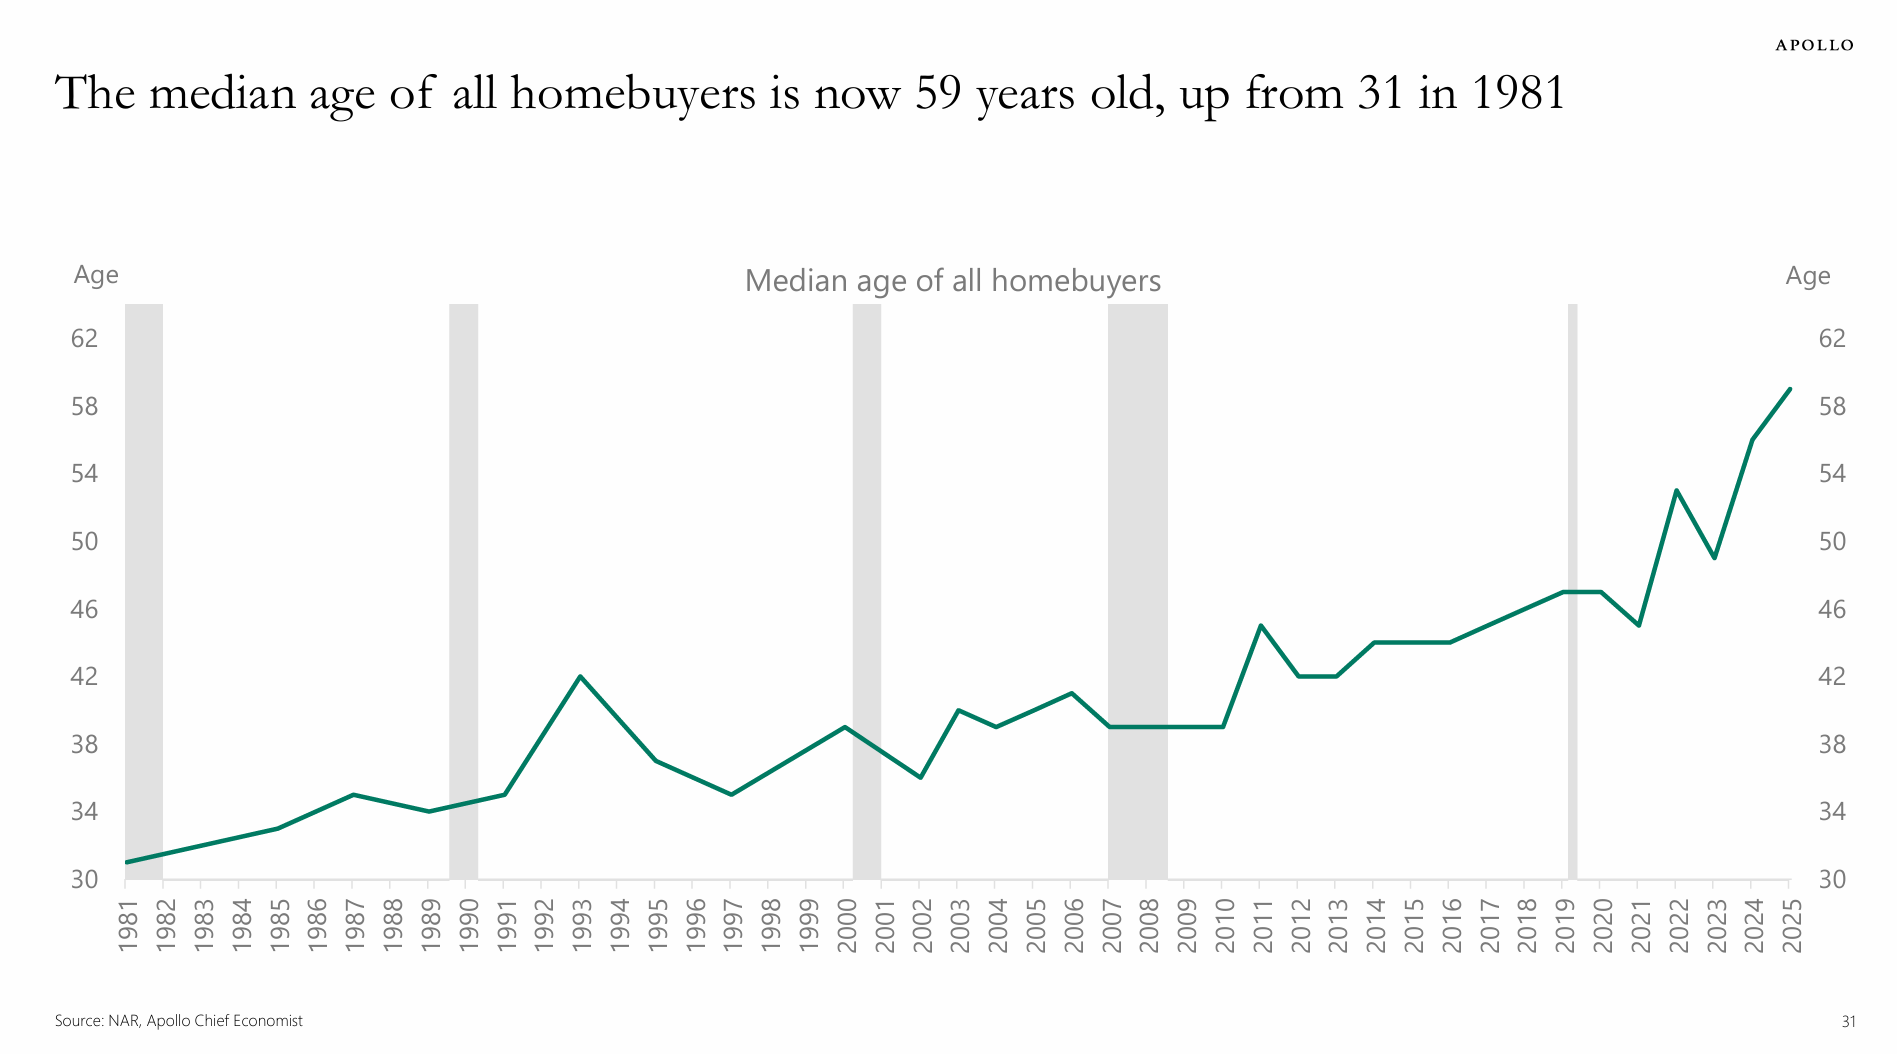
Overall, the median age of all homebuyers is now 59 years old - up from 31 in 1981.
Source: Apollo Daily Spark, September Housing Market
Here are some examples and data points to digest on the mortgage rate outlook, as housing affordability continues to near its record lows.
45% of consumers state that this is a bad time to buy a home because of high mortgage rates and tight credit.
33% of Americans say they would prefer to rent if there were going to move.
56% of US households can only afford homes below $300k.
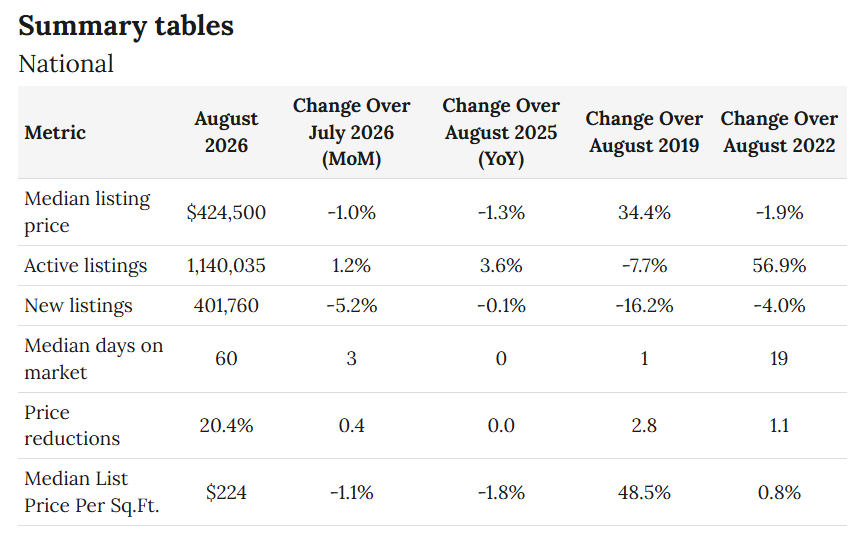
U.S. median listing price: $424,500 (August 2026).
Average monthly mortgage payment on a new 30-year mortgage: $2,918.
Not ideal, right? Timing the mortgage rate market hasn't been so easy either.
Take a look at the distribution of interest rates on the outstanding mortgages within the U.S. housing market, particularly the Below 3% and Greater than 6% sections.
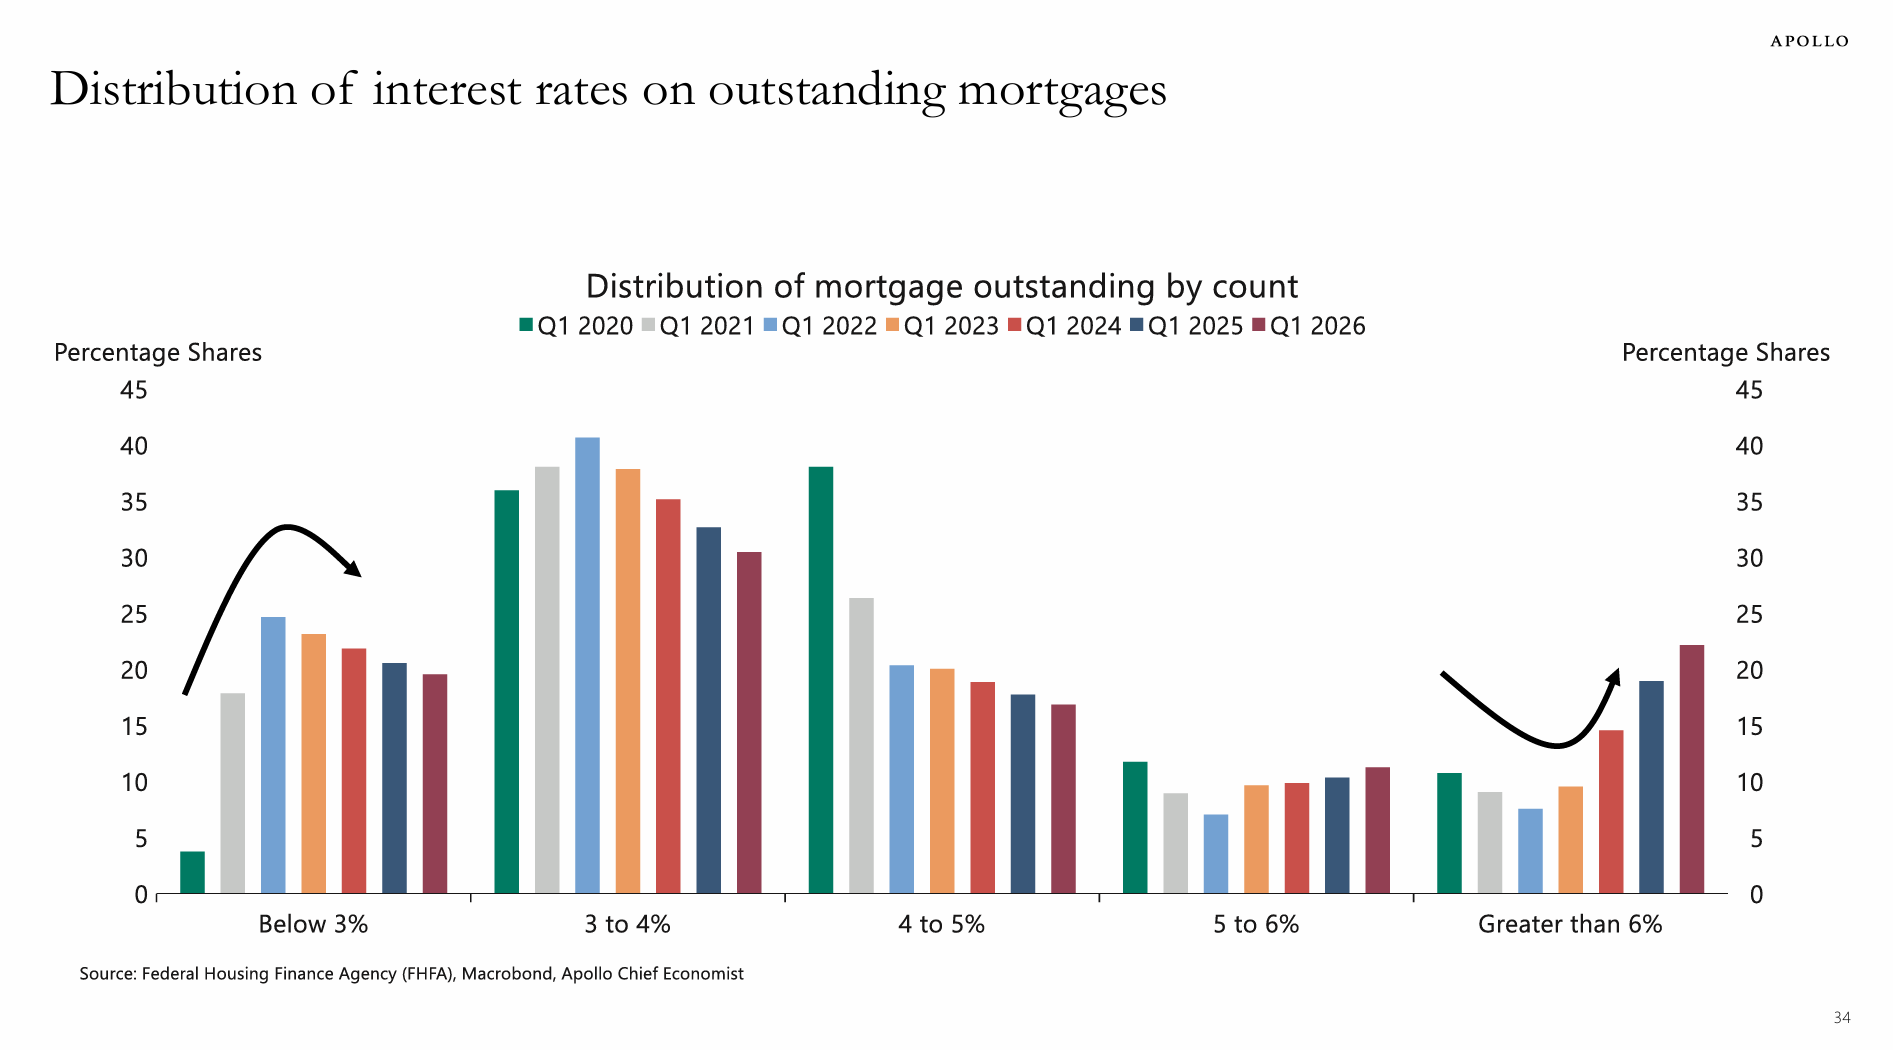
30.4% of mortgages outstanding have an interest rate of 3 to 4%.
22.1% of mortgages outstanding have an interest rate greater than 6%.
19.5% of mortgages outstanding have an interest rate below 3%.
16.8% of mortgages outstanding have an interest rate of 4 to 5%.
11.2% of mortgages outstanding have an interest rate of 5 to 6%.
Housing Supply
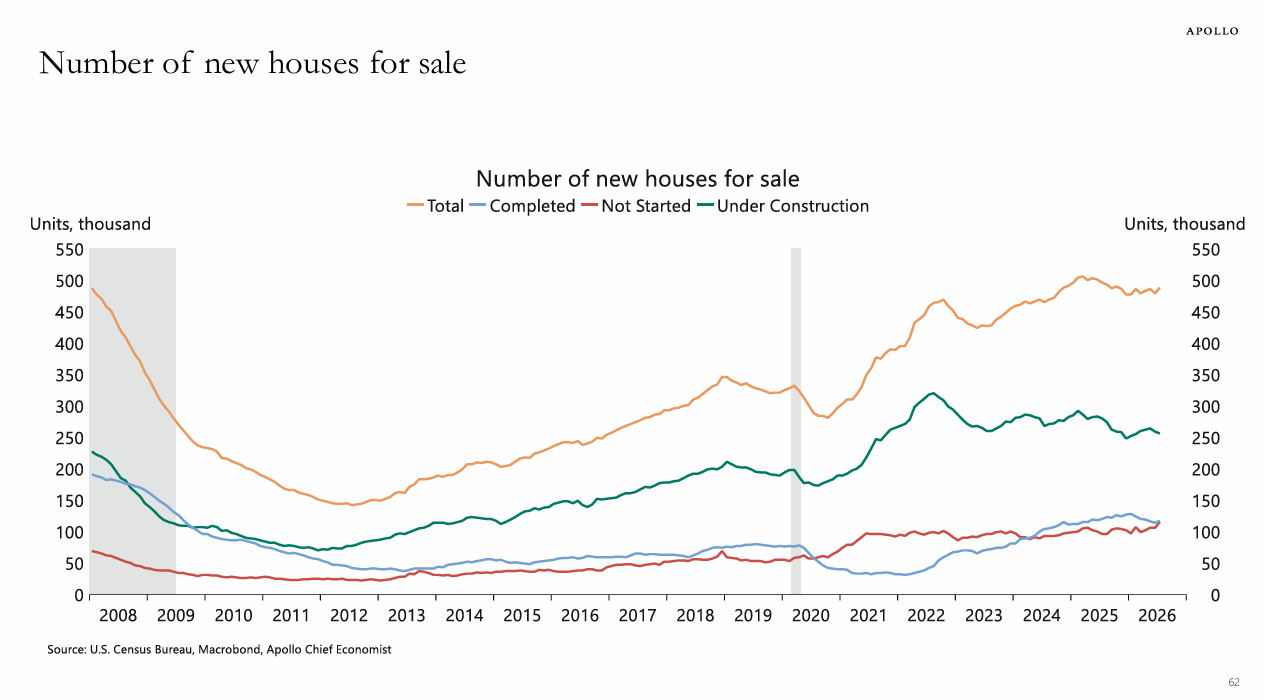
Despite the average family size in the U.S. declining from 3.3 (1960) to 2.5 (2025) and the median size of a new single-family home declining, the U.S. housing supply narrative isn't appealing either.
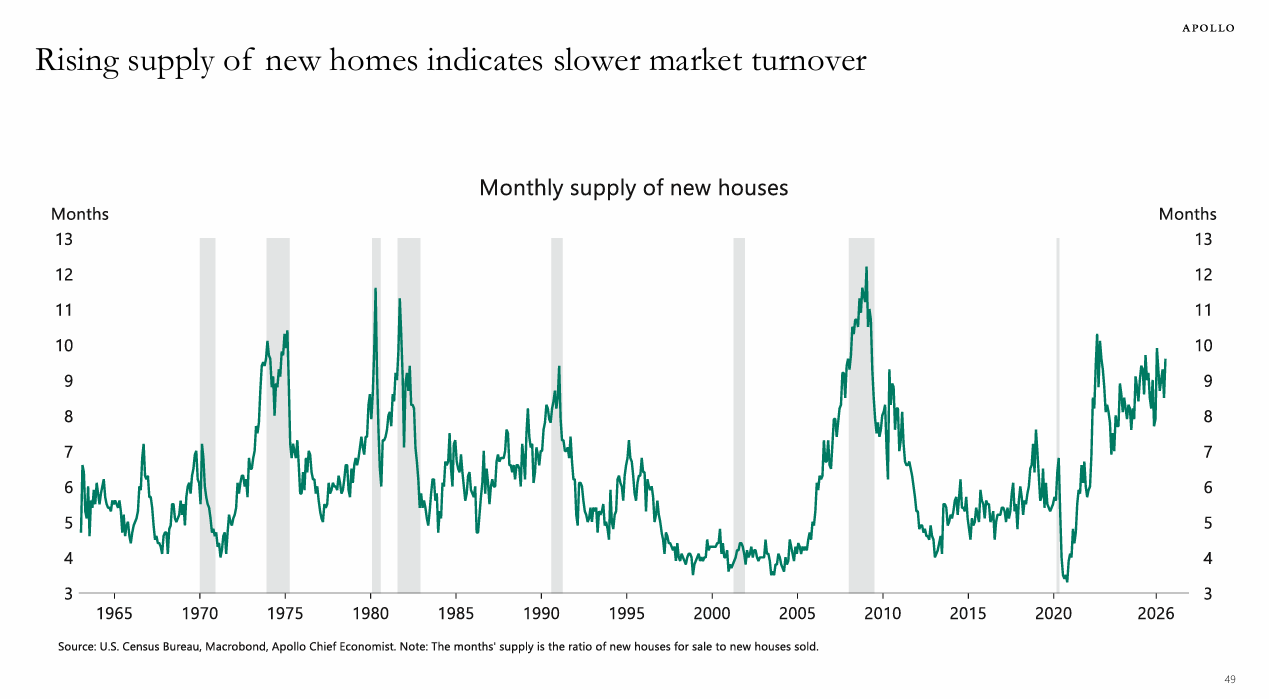
Across every price spectrum, the inventory of existing homes for sale remains low.
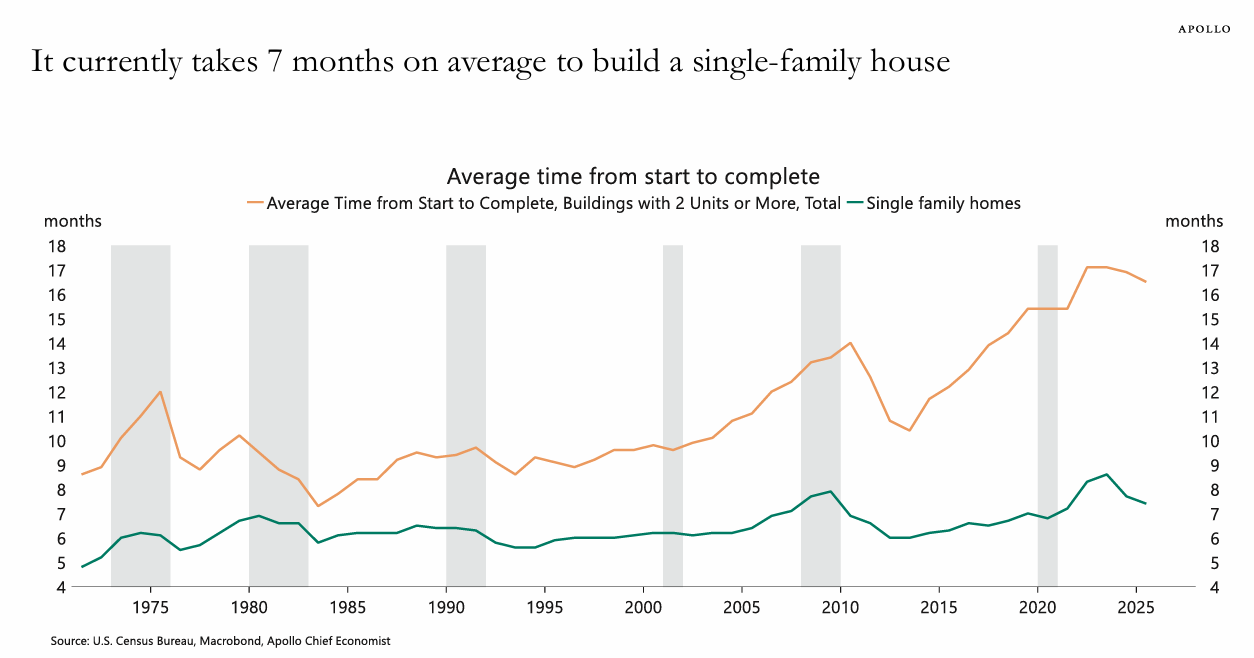
According to Apollo, it currently takes 7 months, on average, to build a single family house, with an estimated deficit of 1 million homes overall in the U.S.
Housing Prices
August has traditionally shown signs of slowing when looking at previous trends in the broader U.S. housing market, with summer ending and school back in session for most.
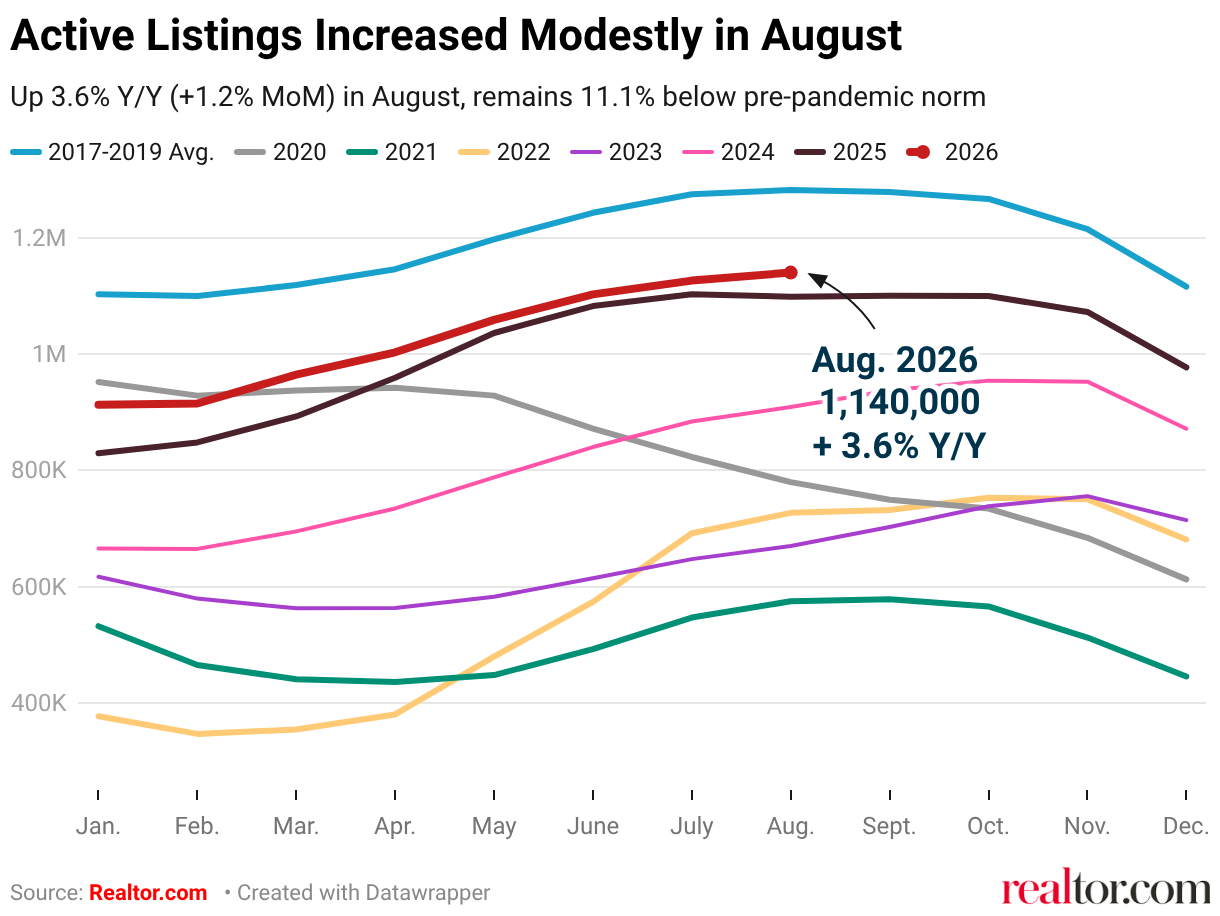
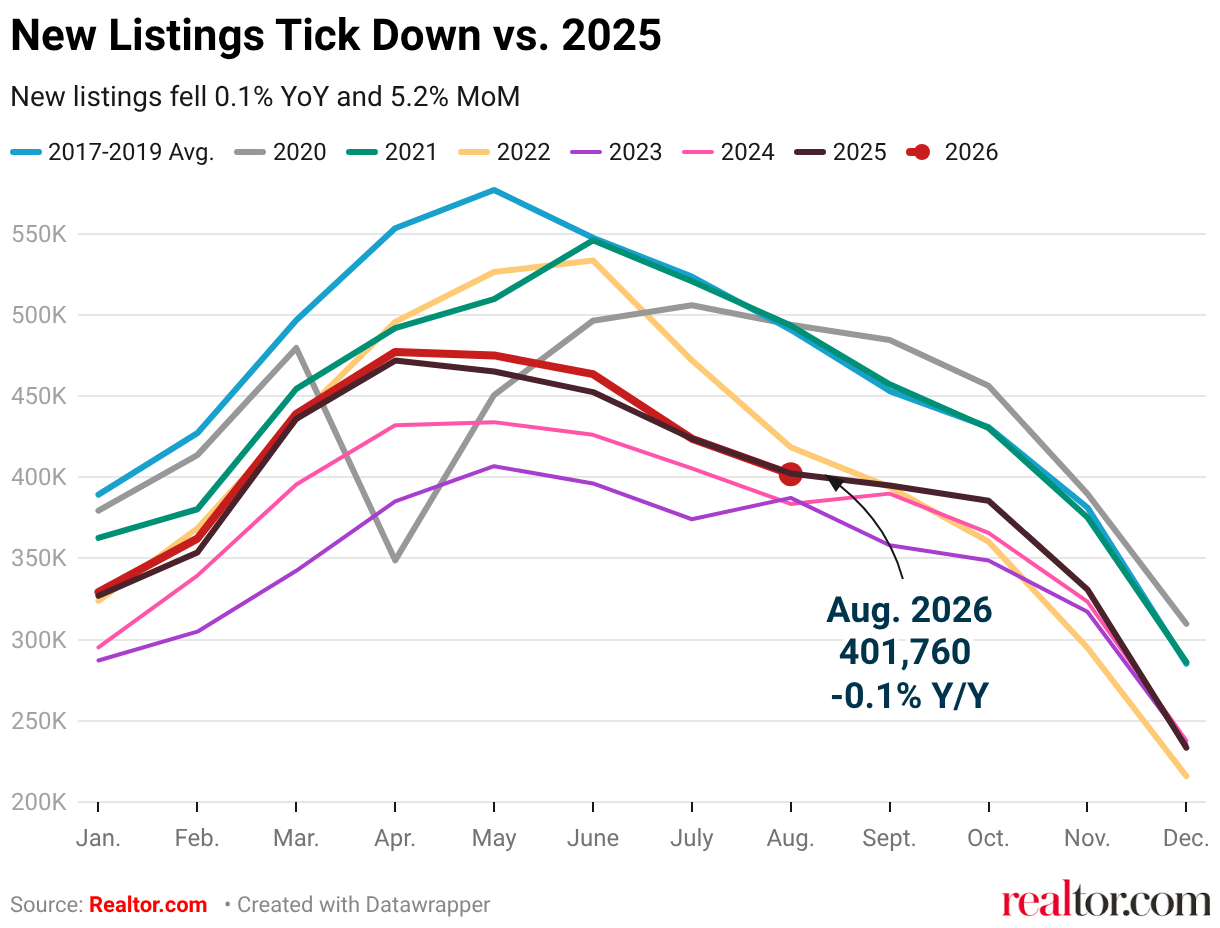
This August delivered mixed results: active listings (1,140,000) hit their highest level since August 2022 (great news for house hunters), while the median listing price fell to $424,500, down 1.3% from the previous year.
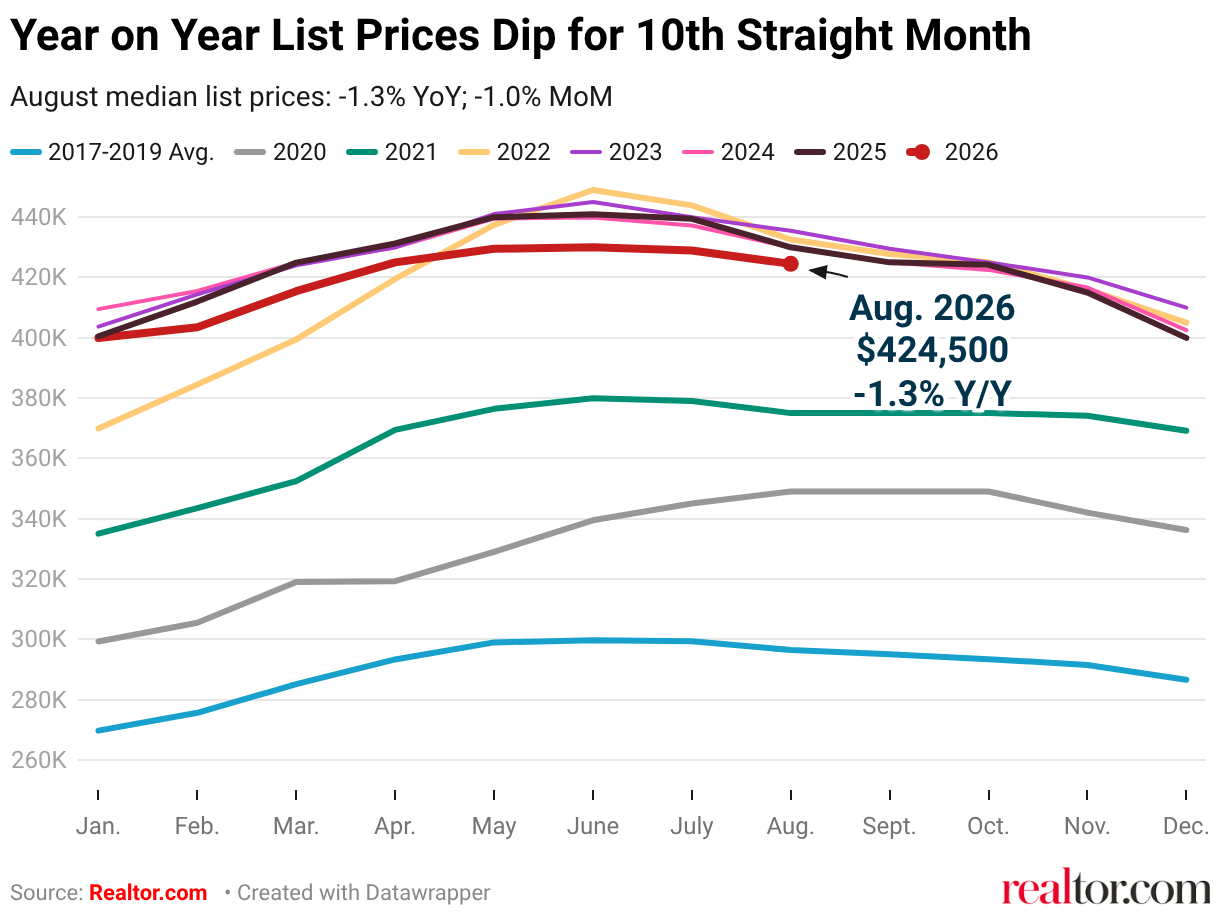
Source: Realtor.com, August 2026 data
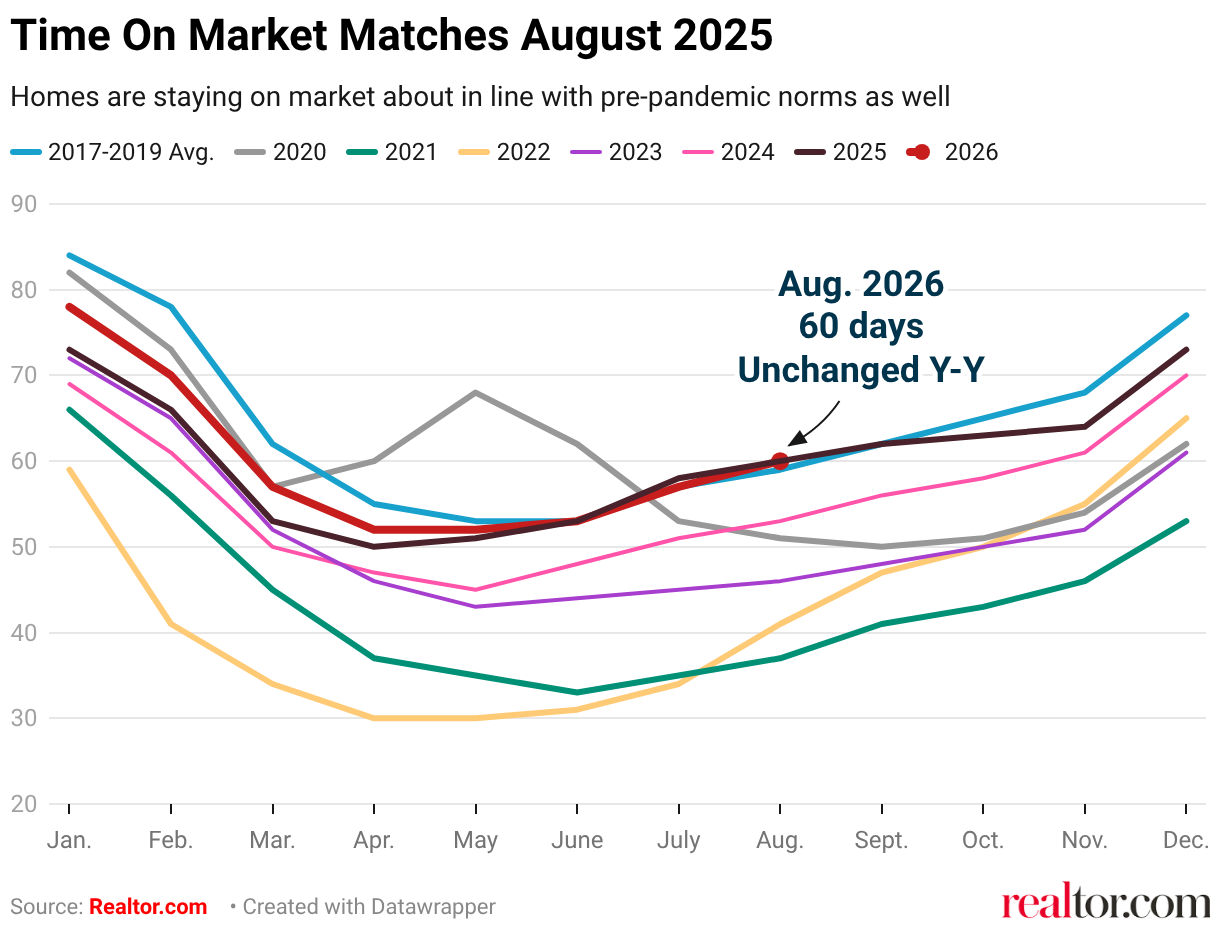
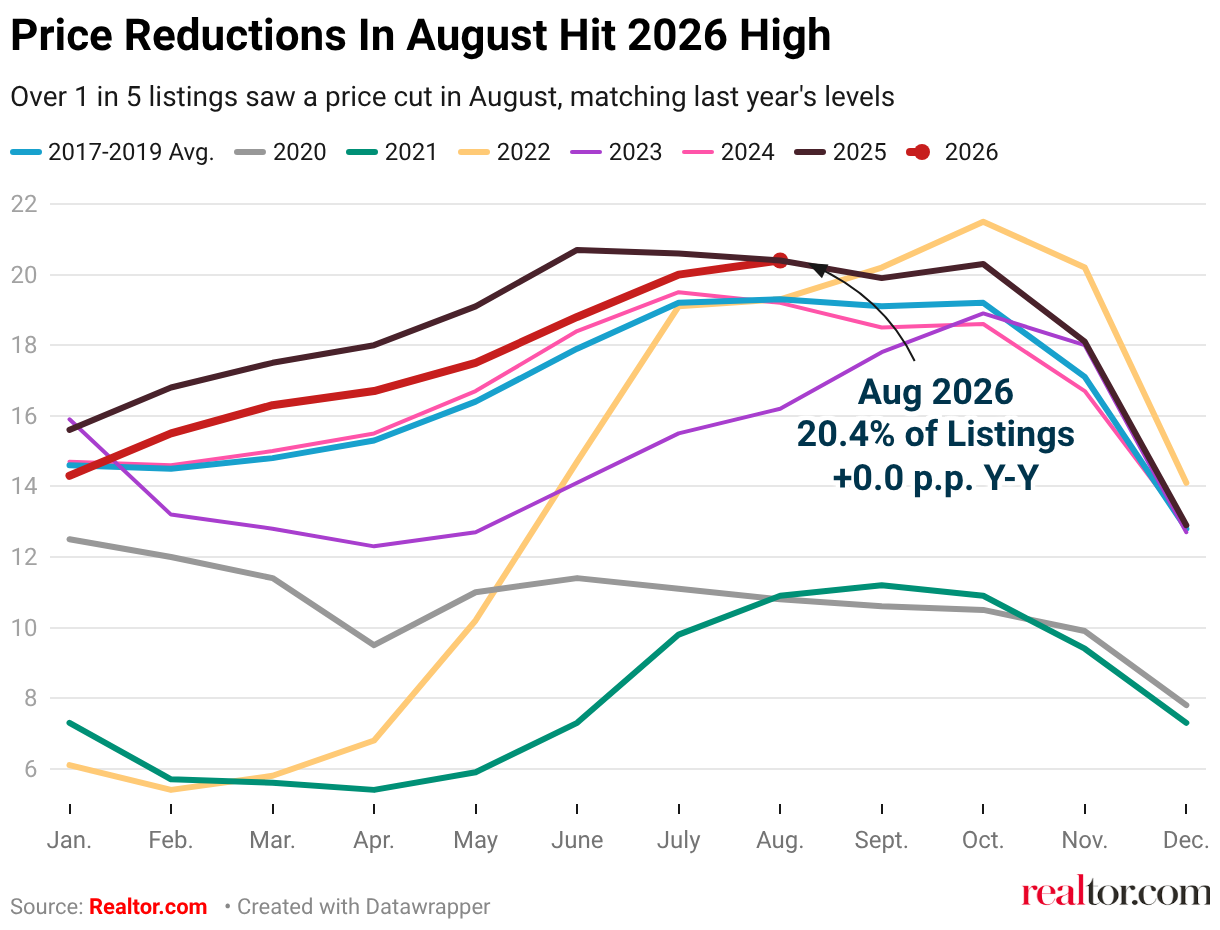
Another key aspect to monitor is price-cut behavior and strategy. Typically, there's a seasonal drift into late summer for homes that remain active on the market.
Homes that are staying on the market are in line with pre-pandemic levels.
Sellers have cut less often and less deeply, with repeat cuts (3+ reductions) nearly halved from last July and overall discounts at their smallest since 2022.
For the first time this year, the national cut rate has matched last year's level.
Certainly, the U.S. housing market signals a gloomy outlook while also contributing significantly to our gross domestic product and our personal livelihoods. We will continue to monitor this development throughout the calendar year and beyond.
At SEM, we believe your time is best spent focused on what matters most to you, not on keeping up with the complexities, evolving regulations, and latest trends shaping the financial markets. With SEM as your trusted advisor, we take on that responsibility through a disciplined, research-driven investment process designed to identify opportunities, manage risks, and adapt to changing market conditions.
Thank you to all of the visitors who read last week's "Chart of the Week". I hope to continue sharing these talking points about markets, investing, etc., for you to share with family, friends, coworkers, or anyone along the way.
See you next time!
Market and Economic Data
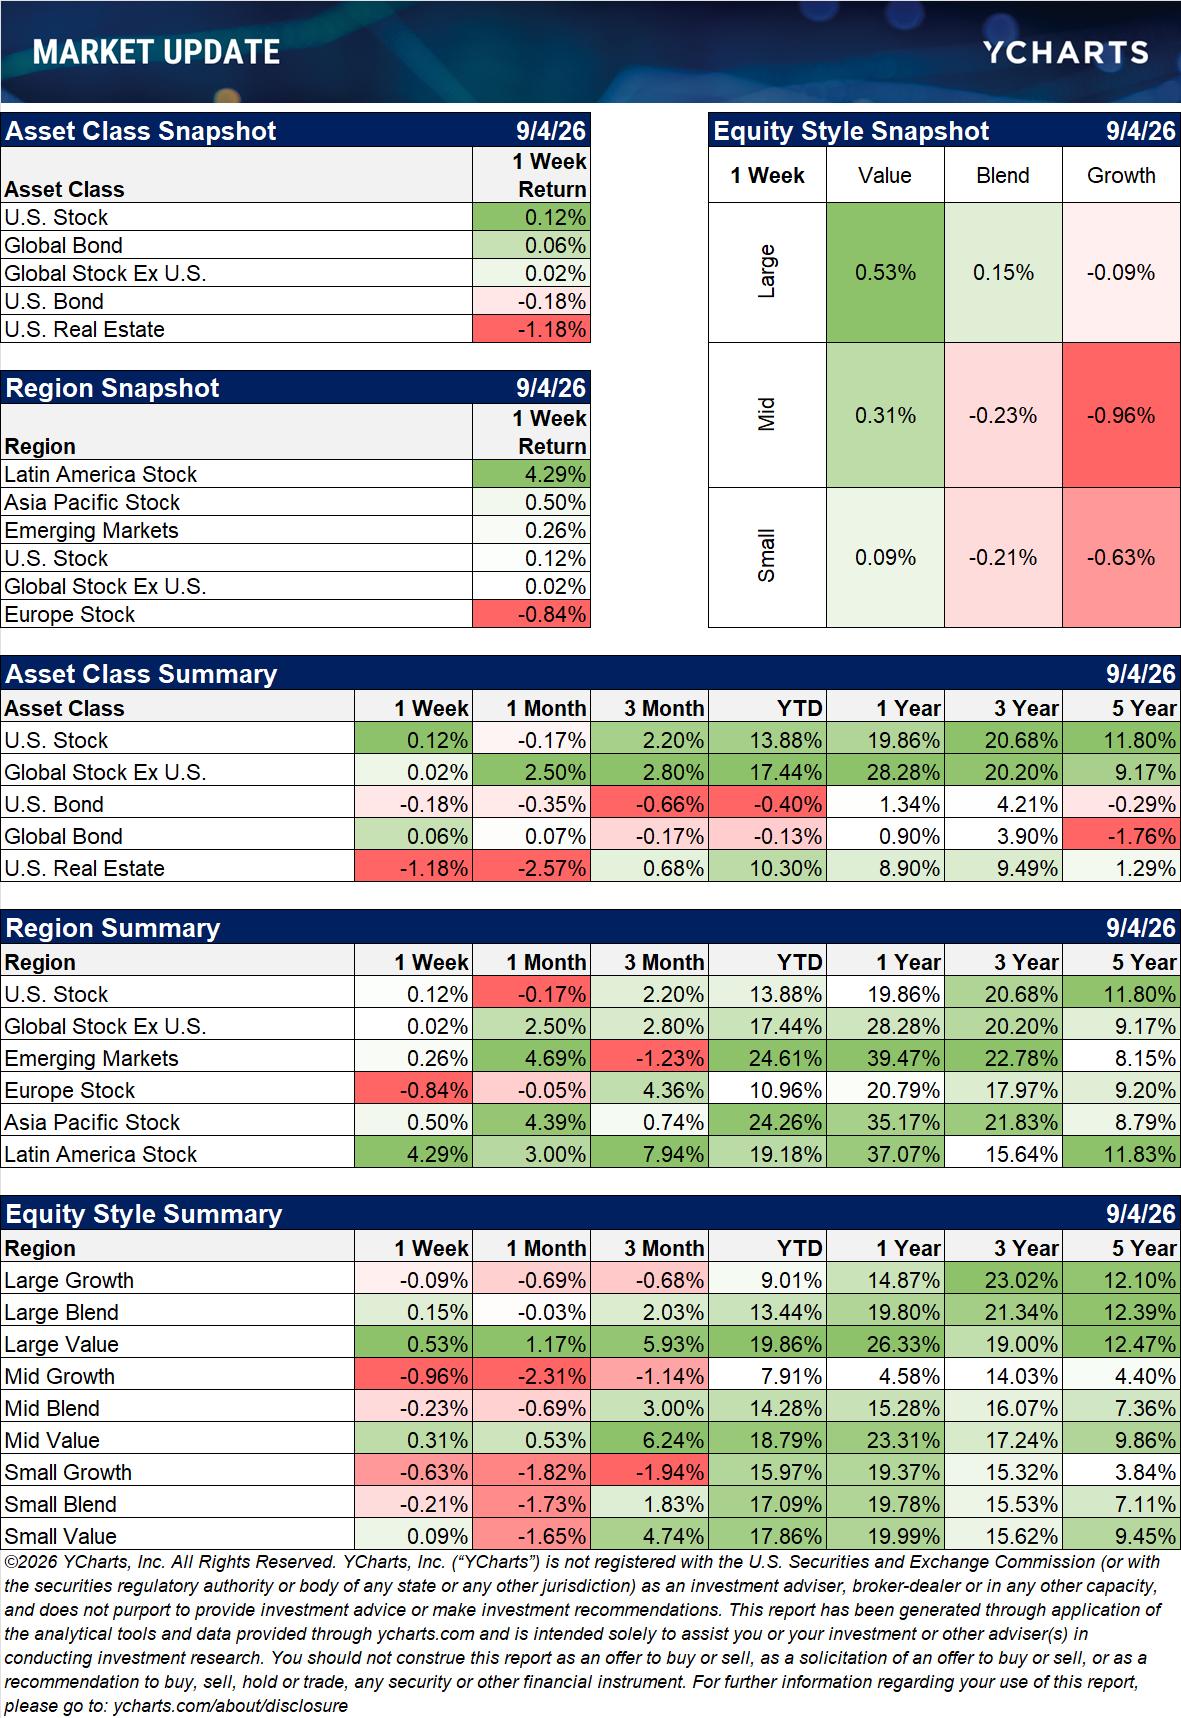
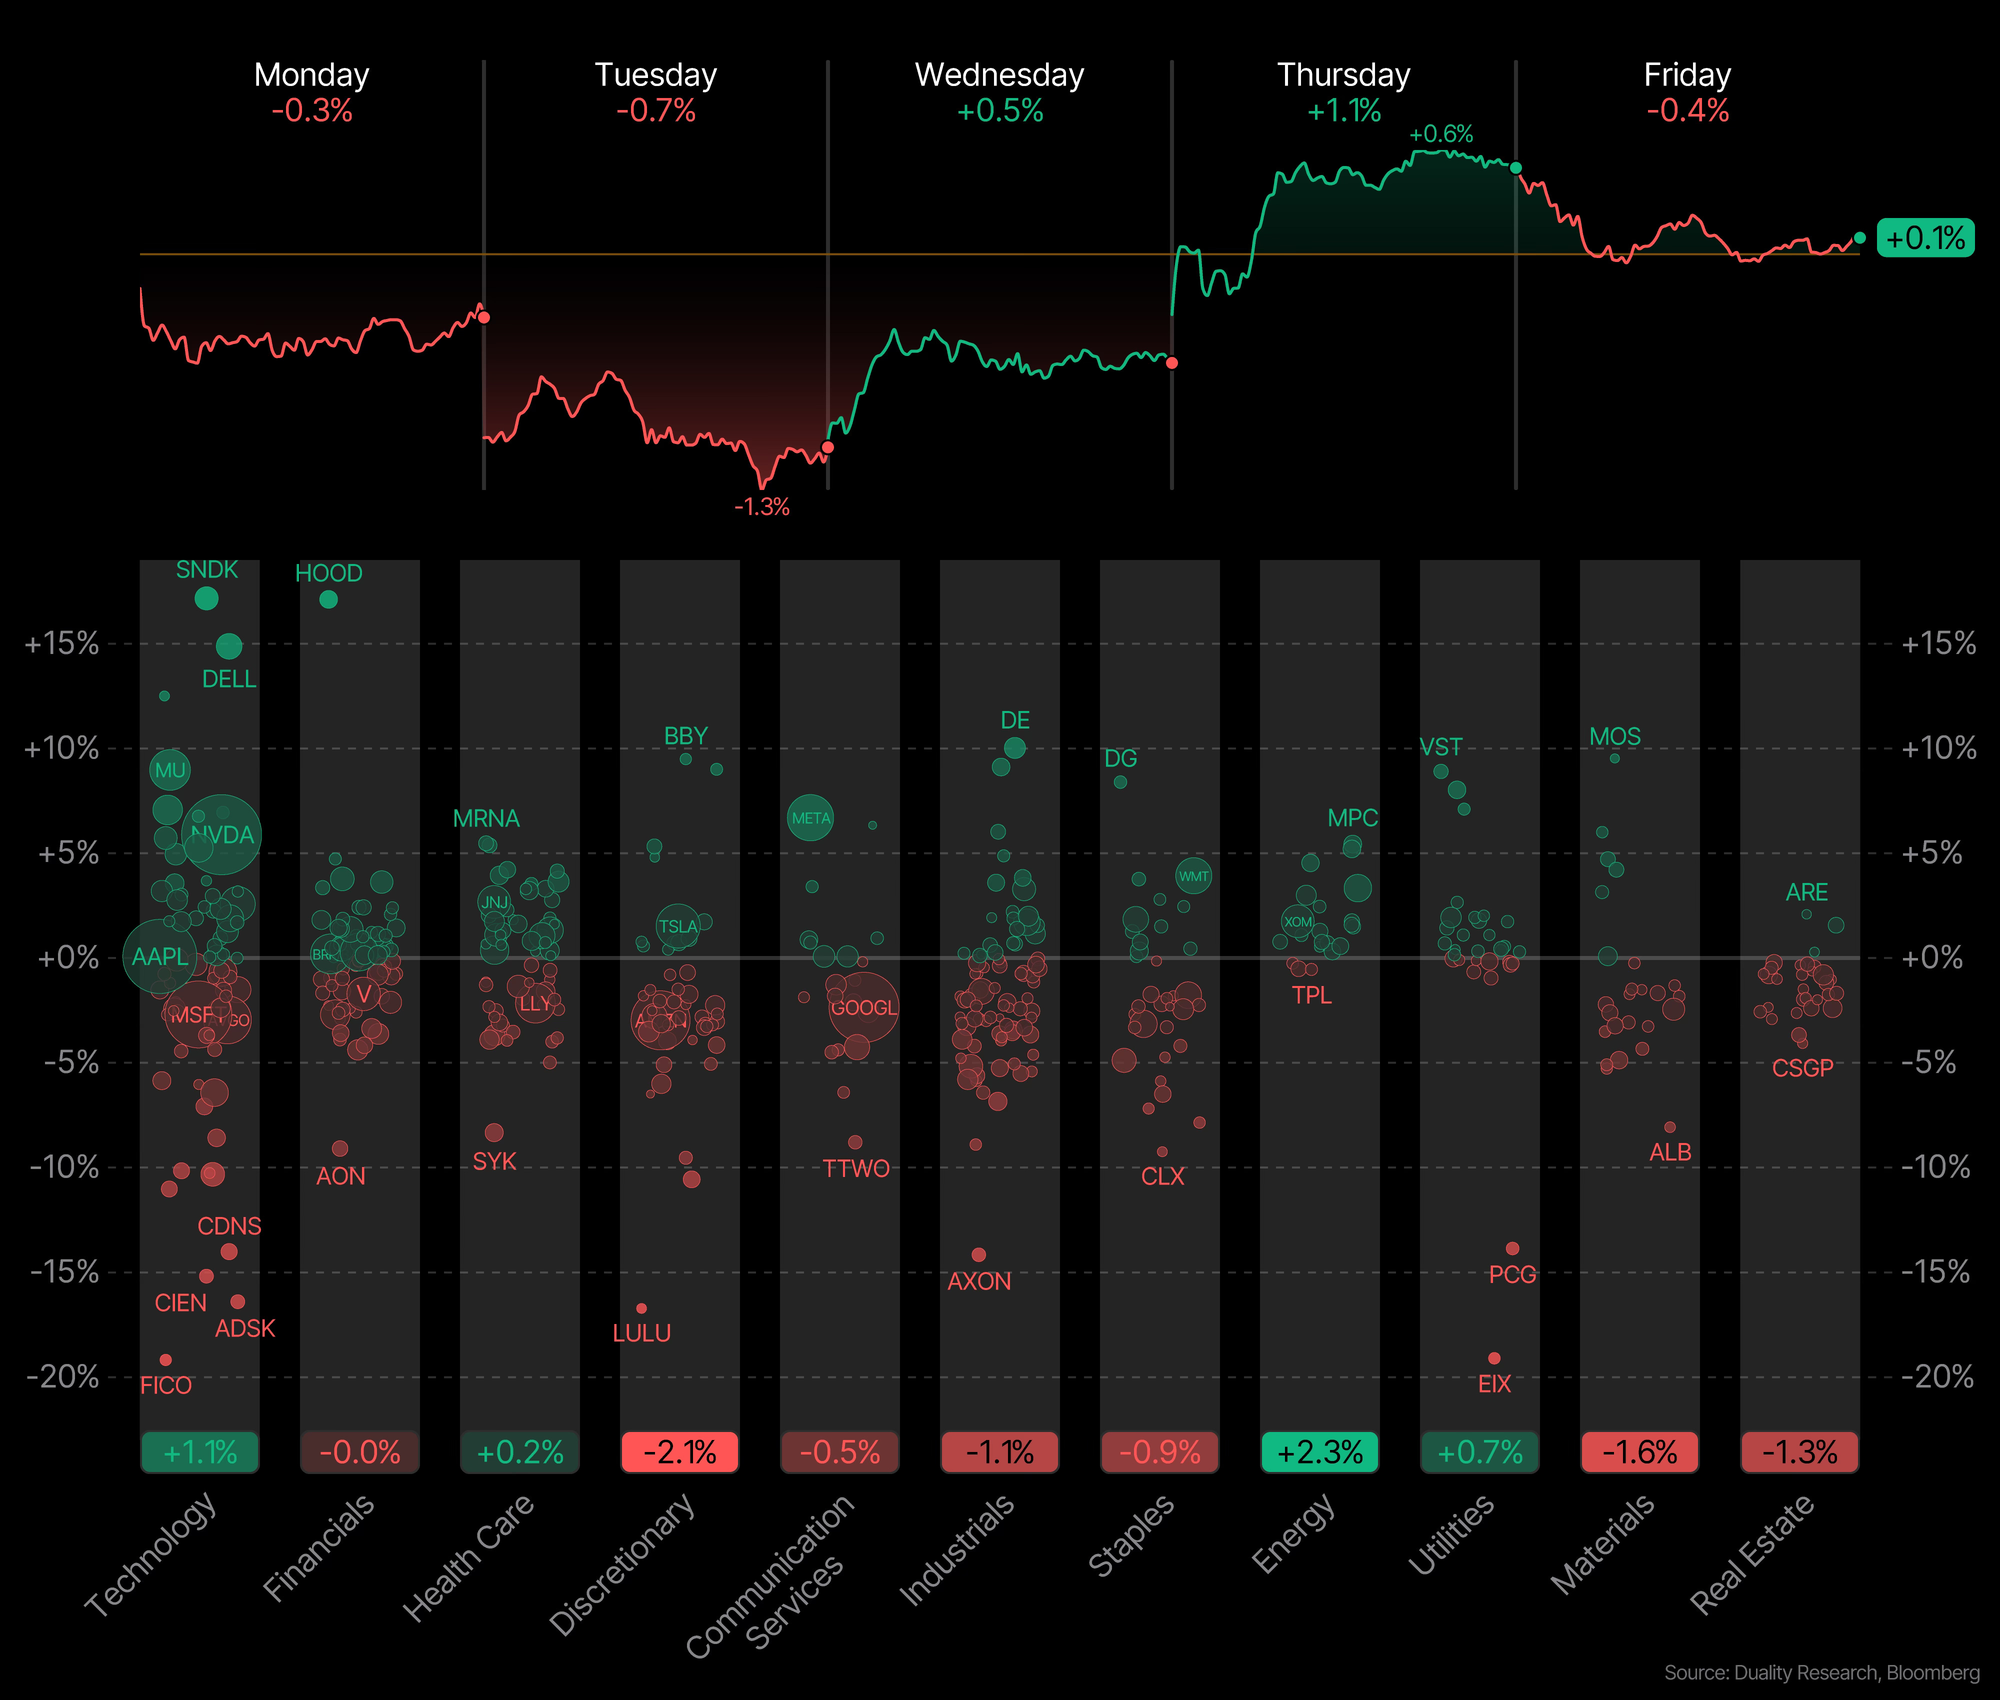
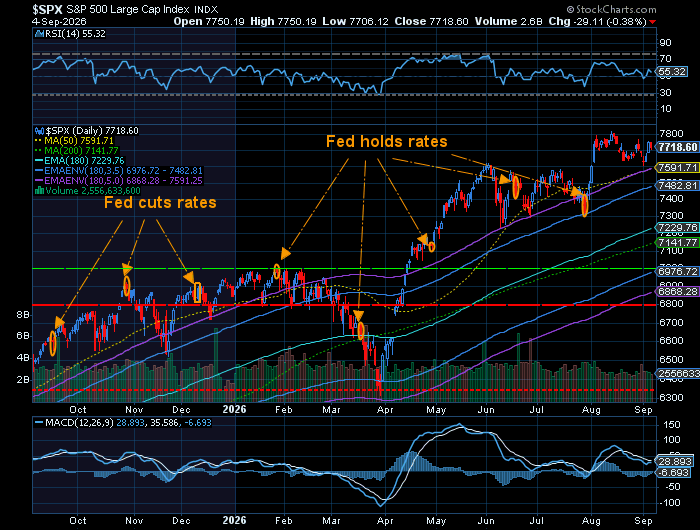
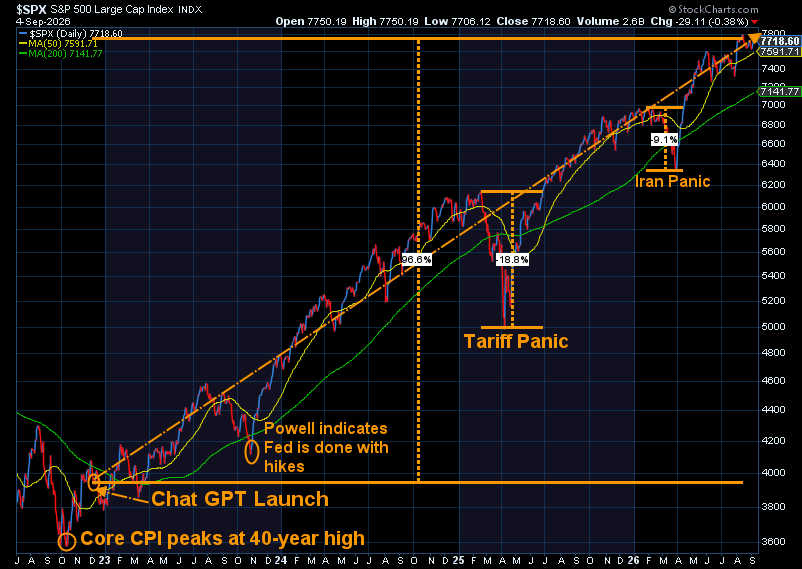
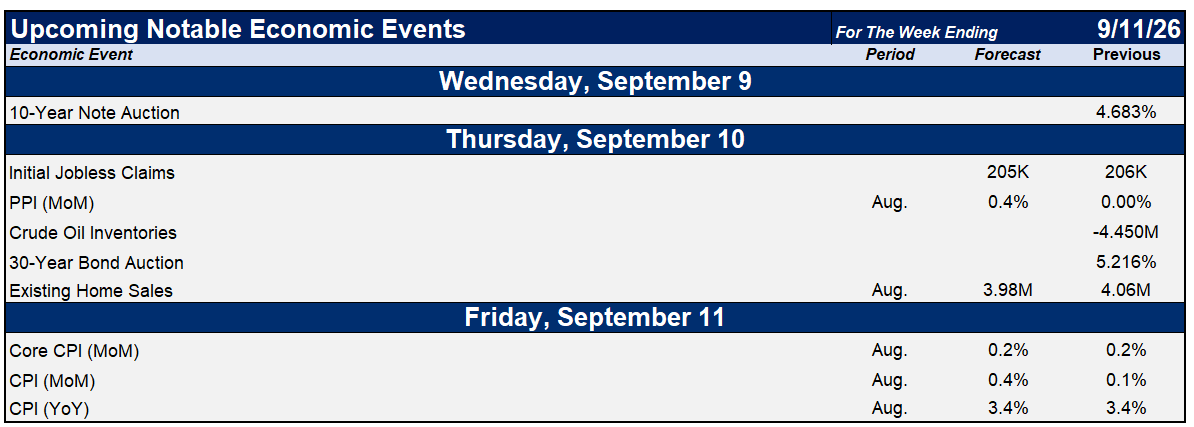
The market was mixed last week as participants continue to decipher what the earnings, economic data, and Fed chatter means for interest rates and future growth.
SEM Market Positioning
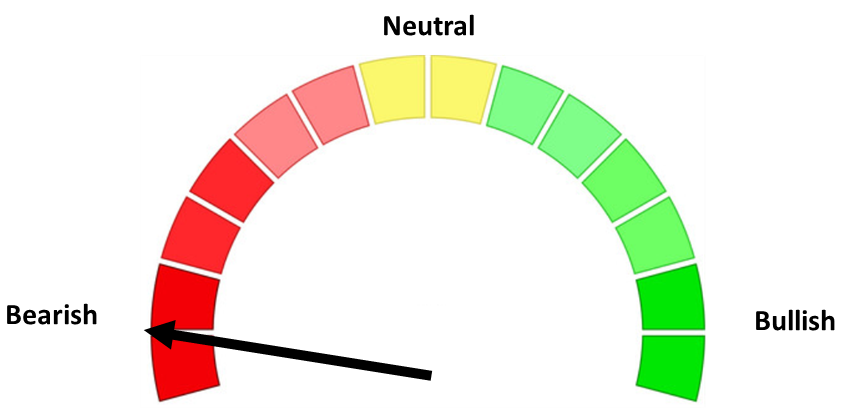
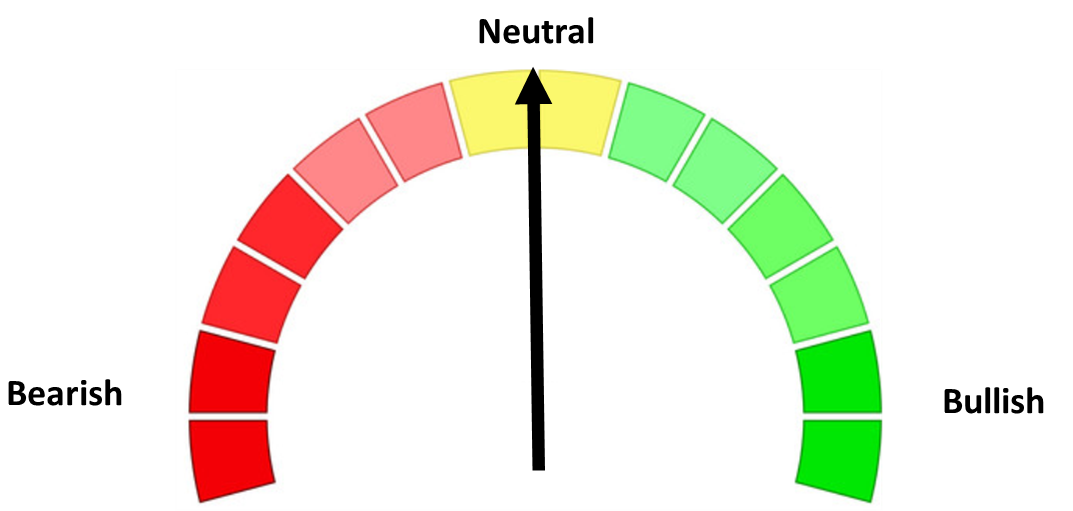
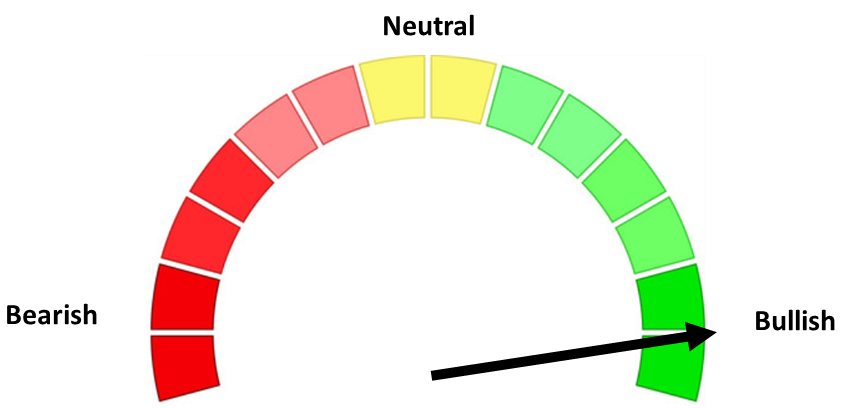
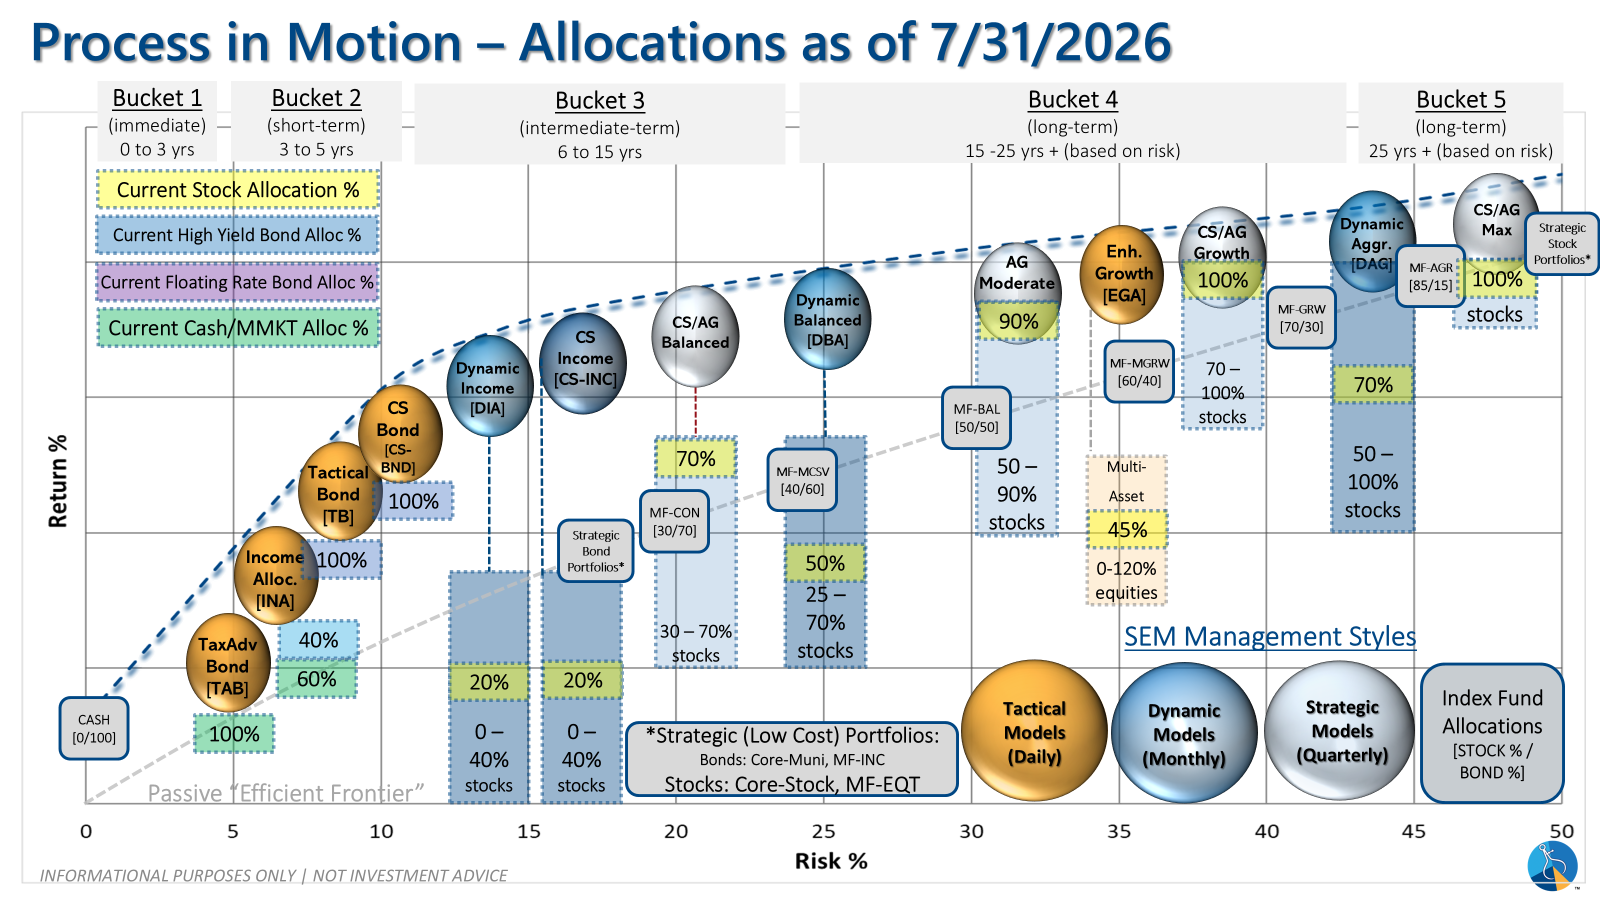
SEM deploys 3 distinct approaches – Tactical, Dynamic, and Strategic. These systems have been described as 'daily, monthly, quarterly' given how often they may make adjustments. Here is where they each stand.
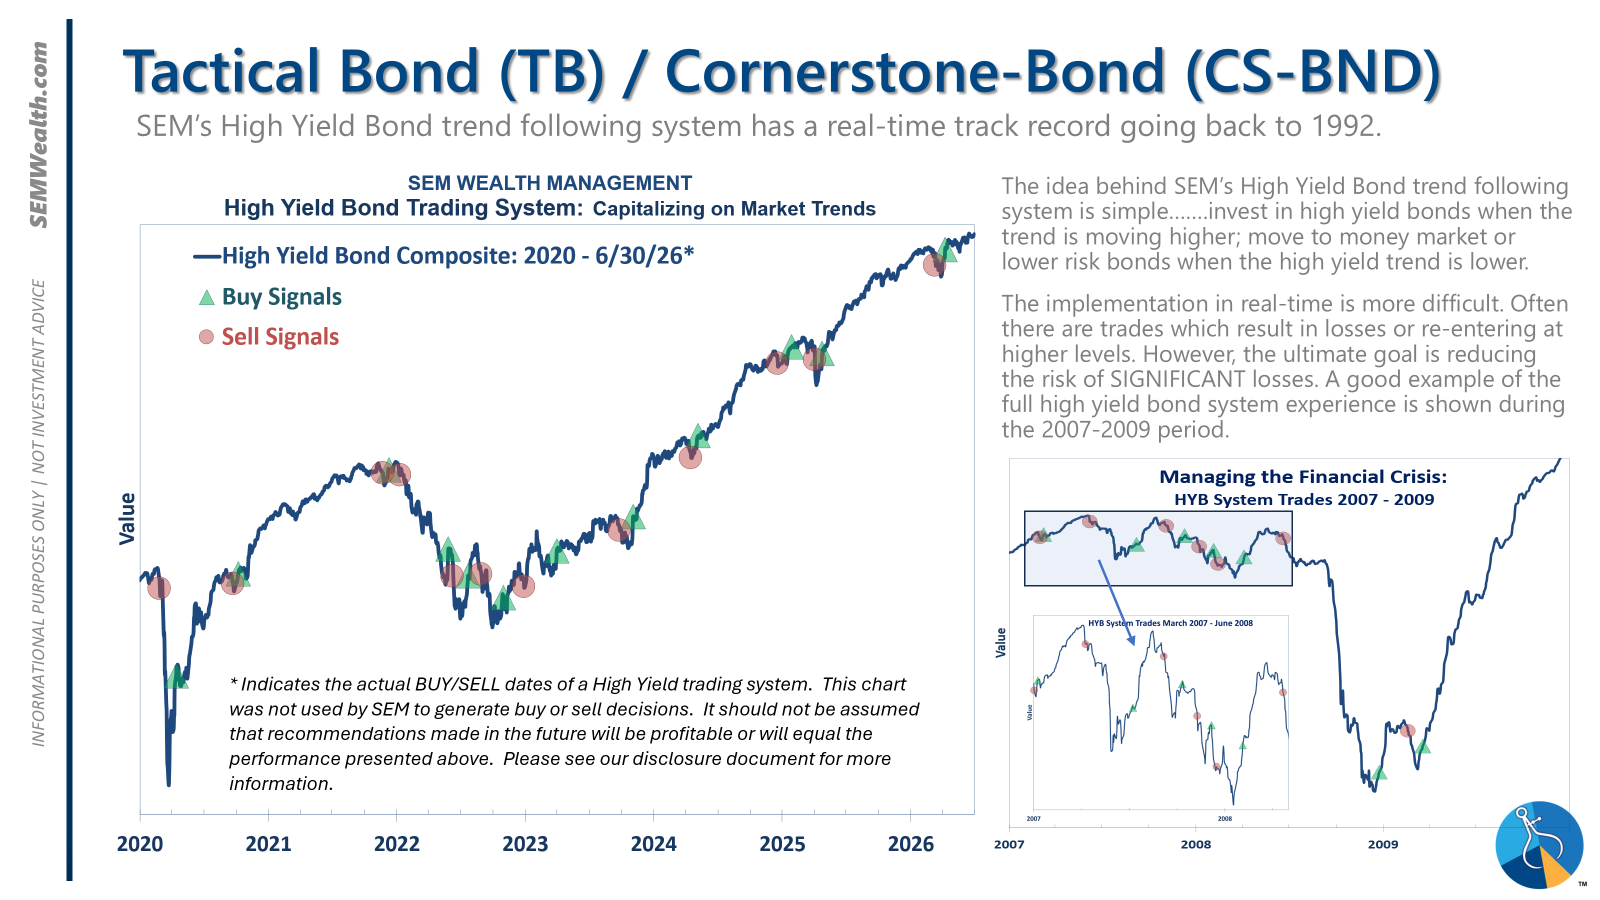
- Tactical = BULLISH | 100% High Yield Bond (4/8/2026) | High-yield spreads remain narrow but trend is slightly higher
- Dynamic = NEUTRAL (2/15/2026) | "Benchmark" Allocation | Economic model inconclusive
- Strategic = BULLISH (4/15/2026) | V-Bottom projecting "end" of Iran War
Tactical (daily):
- Monitored DAILY
- Models: Tactical Bond, Cornerstone Bond, Income Allocator, Tax Advantaged Bond
- Designed to follow the trends for use in our lower risk models
- BUY Signal issued April 8, 2026 (exiting the sell from March 13)
Dynamic (monthly):
- Monitored MONTHLY
- Models: All "Dynamic" Models (Income, Balanced, Growth, and Asset Allocator)
- Uses SEM's Quantitative Economic Model
- Designed to overweight riskier assets if economic trend is higher & underweight those assets if economic trend is lower.
- NEUTRAL signal issued February 15, 2026 (following BEARISH signal from July 2025)
Strategic (quarterly)*:
- Monitored QUARTERLY
- Models: AmeriGuard (Balanced, Moderate, & Growth) and Cornerstone (Balanced & Growth)
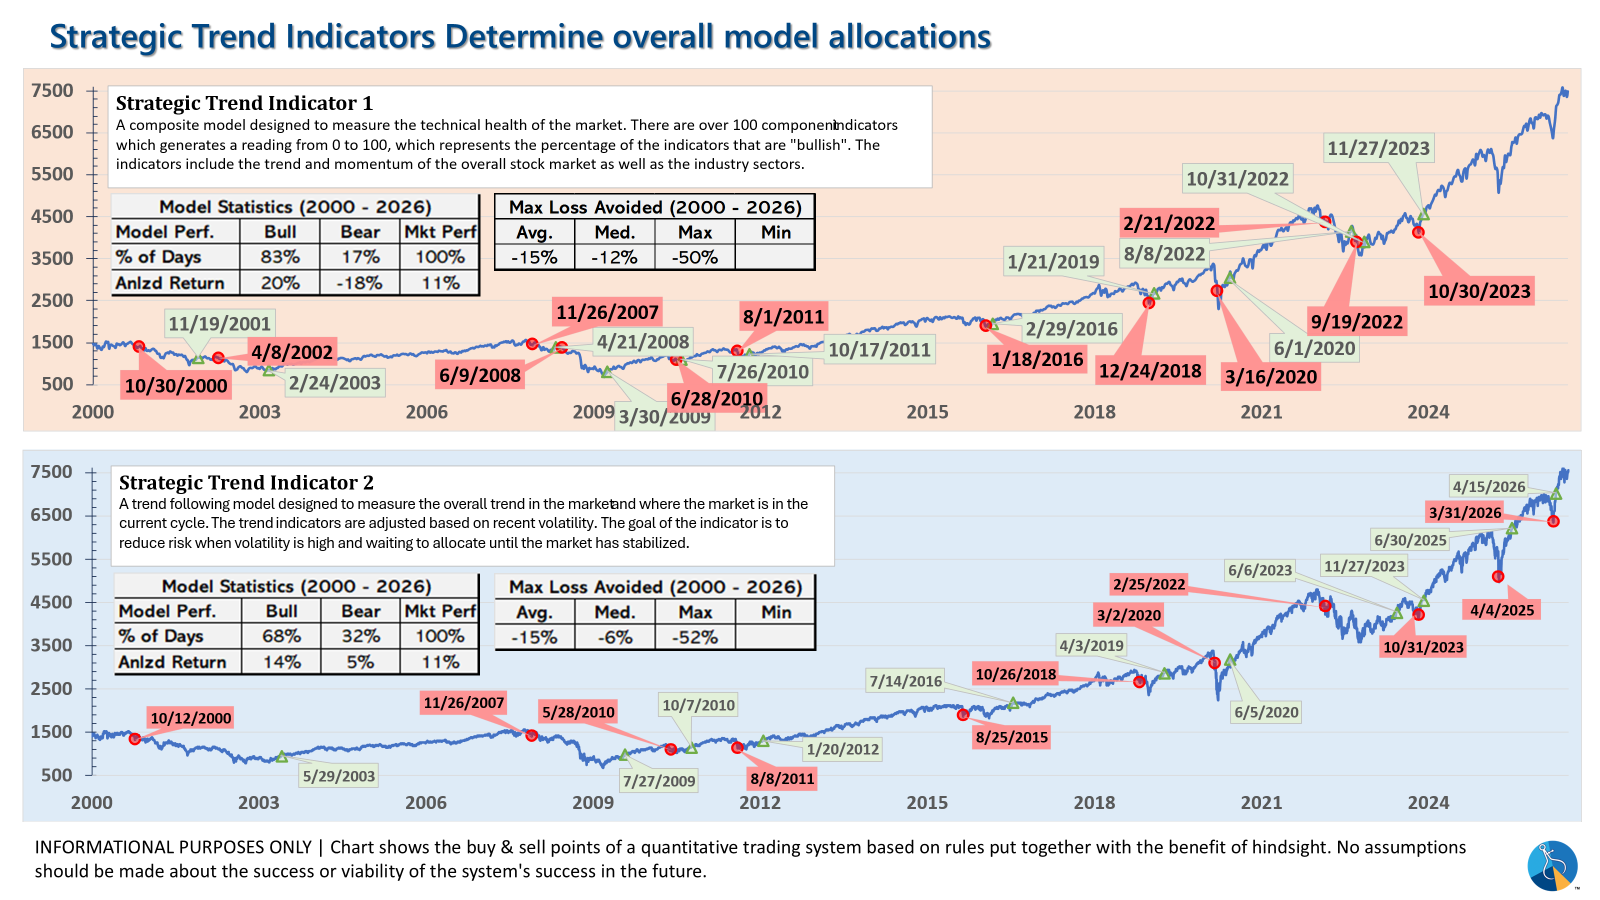
- Core Component: Quantitative Filter using 4 different time horizons across universe of asset classes
- Trend Indicator: Two different Quantitative Systems monitoring the intermediate-term trend, health of the market, and volatility
- CORE has been overweight small cap and international since October 2025 – overweight increased slightly in January
- Both TREND INDICATORS are BULLISH following 10% drop and "V-Bottom" reversal in early April
- AmeriGuard & Cornerstone Max DO NOT use the Trend indicator and are always 100% invested in stocks using our CORE rotation model.
The core rotation is adjusted quarterly. This quarter we saw half of our international positions reduced (we sold developed markets and kept our emerging markets exposure). We also saw the remaining share of mid-cap reduced in favor of more small cap exposure. We remain with a "barbell" core portfolio – about half in large cap and half in small cap as the models expect the market to "broaden".
The * in quarterly is for the trend models. These models are watched daily but they trade infrequently based on readings of where each believe we are in the cycle. The trend systems can be susceptible to "whipsaws" as we saw with the recent sell and buy signals at the end of October and November. The goal of the systems is to miss major downturns in the market. Risks are high when the market has been stampeding higher as it has for most of 2023. This means sometimes selling too soon. As we saw with the recent trade, the systems can quickly reverse if they are wrong.
Overall, this is how our various models stack up based on the last allocation change:
Curious if your current investment allocation aligns with your overall objectives and risk tolerance?