It seems whenever I decide to take a day or two off I'm greeted with a flurry of things to work on. This most certainly was the case after I took Friday off last week to spend the weekend "camping" with our two oldest grandchildren at the beach (some would call it glamping, but hey, we're cooking outside and spending most of our time away from screens doing outdoorsy activities, so that's roughing it for me.). I'm going to do my best to cover everything that happened last week in as few words as possible. If you want the quick version here it is:
- Nvidia earnings were impressively strong, but I'll be watching their balance sheet (and others) very closely for signs of stress
- Nvidia's price hike and OpenAI's new chip could cause problems down the road
- Anthropic's Fable 5 Model shows businesses don't have an unlimited appetite for the "best" models, which could call into question the ROI of the $1 Trillion+ being invested in "compute"
- Kevin Warsh spoke at Jackson Hole, bashed forward guidance, and moved rate hike expectations from 30% to above 50%!
- The Debasement Trade is a risk few people are focusing on. If you have to read just one section, read this one!
- A New Market Risk has emerged and it's probably not one you've heard much about.
So with that, here we go!
Nvidia Earnings
Given the sell-off in Nvidia shares for nearly a week going into their earnings report this was most certainly the most highly anticipated event going into the week. It most certainly didn't disappoint.
Nvidia "beat" again on Wednesday night. Revenue of nearly $100 billion, up 106% from a year ago, Data Center up 117%, and a forecast of strong growth this quarter. The stock jumped 7% overnight. I'm not going to spend much time there – you've read it everywhere by now. My nerdy, accounting brain went to the two pages nobody covers. Start with this one: GAAP earnings per share came in at $2.46, while the company's own "adjusted" earnings per share came in at $2.22. Read that again. The adjusted number was LOWER than the official one. That almost never happens, and there is exactly one reason it did – $7.8 billion of the quarter's profit was Nvidia marking up the value of stock it owns in other companies. Over six months it's $23.7 billion, or a fifth of everything Nvidia reported as profit. Nvidia itself doesn't count that as operating profit. It didn't make the headlines.
Remember, the income statement tells you what came in. The balance sheet tells you where it went. Nvidia's assets grew by $113 billion in six months. Here's a chart showing where it went. I'll call your attention to three items:
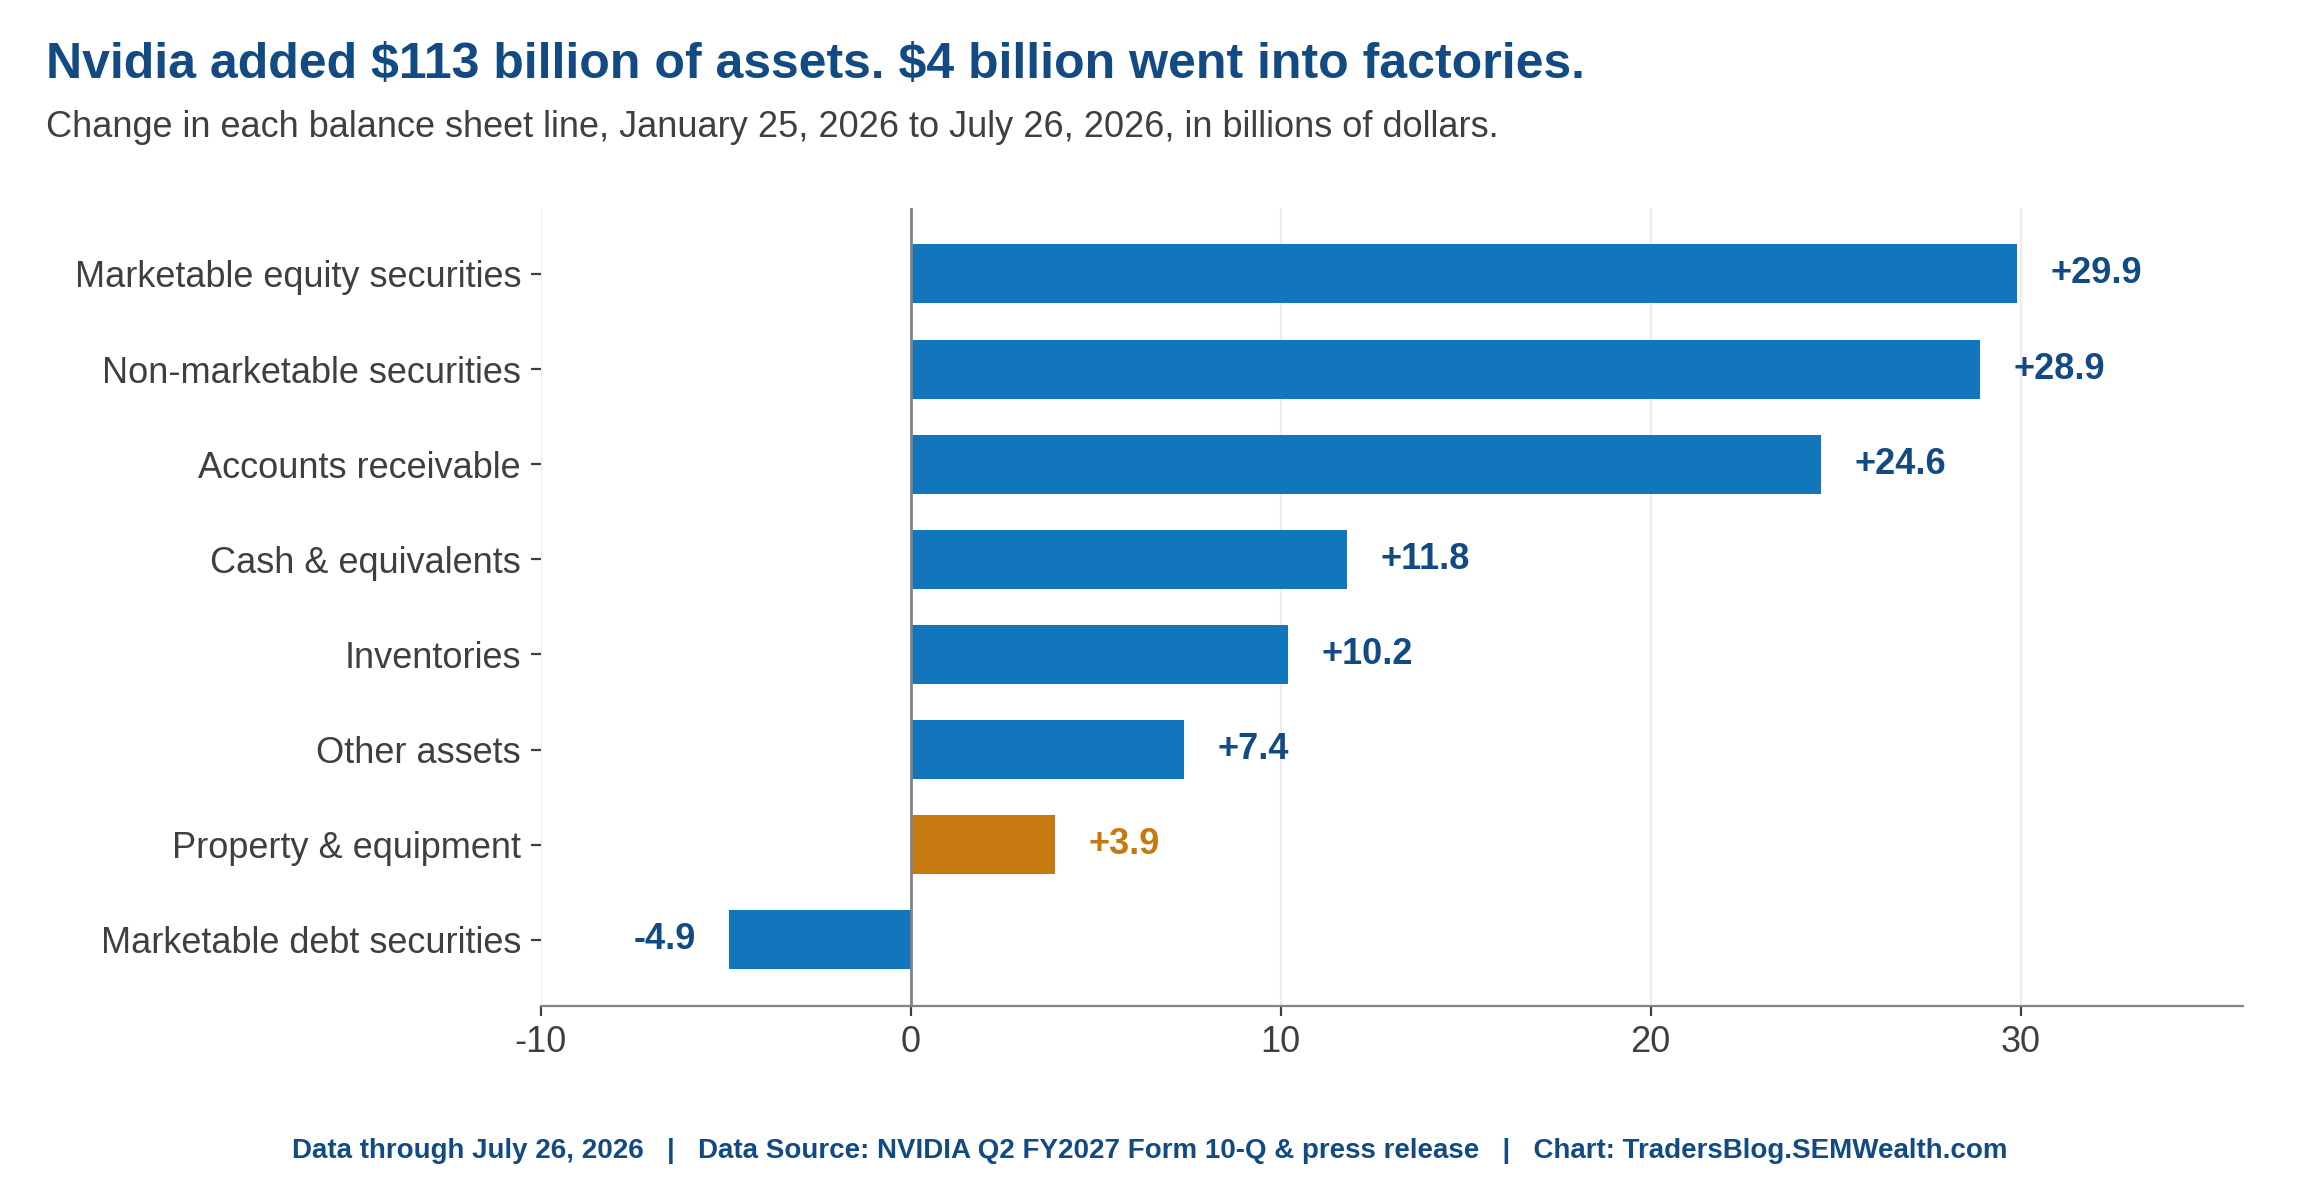
1.) Equity Positions: By far the biggest jump in Nvidia's balance sheet was in the value of the securities they own (the "stock" positions they received instead of cash). This is nice when those companies are doing well, but what happens to their balance sheet if (I know right now it's unthinkable) these companies run into trouble)?
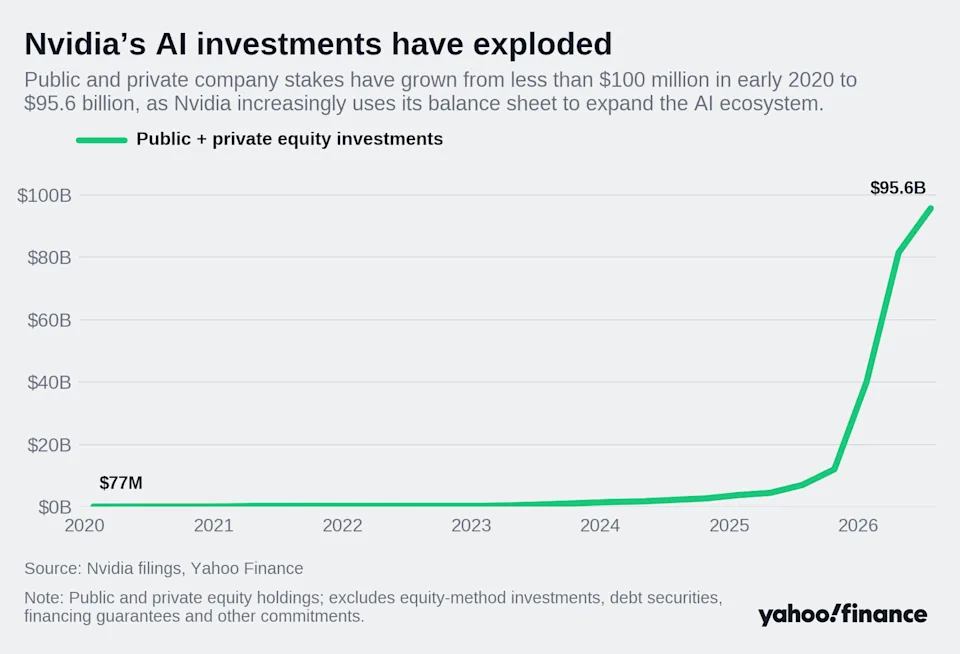
2.) Property & Equipment: Just $3.9 billion went into property and equipment – the factories, the buildings, the actual stuff that Nvidia needs to continue to grow. Maybe they don't need more factory capacity and are happy just increasing prices on their customers and providing the financing so they can keep paying.
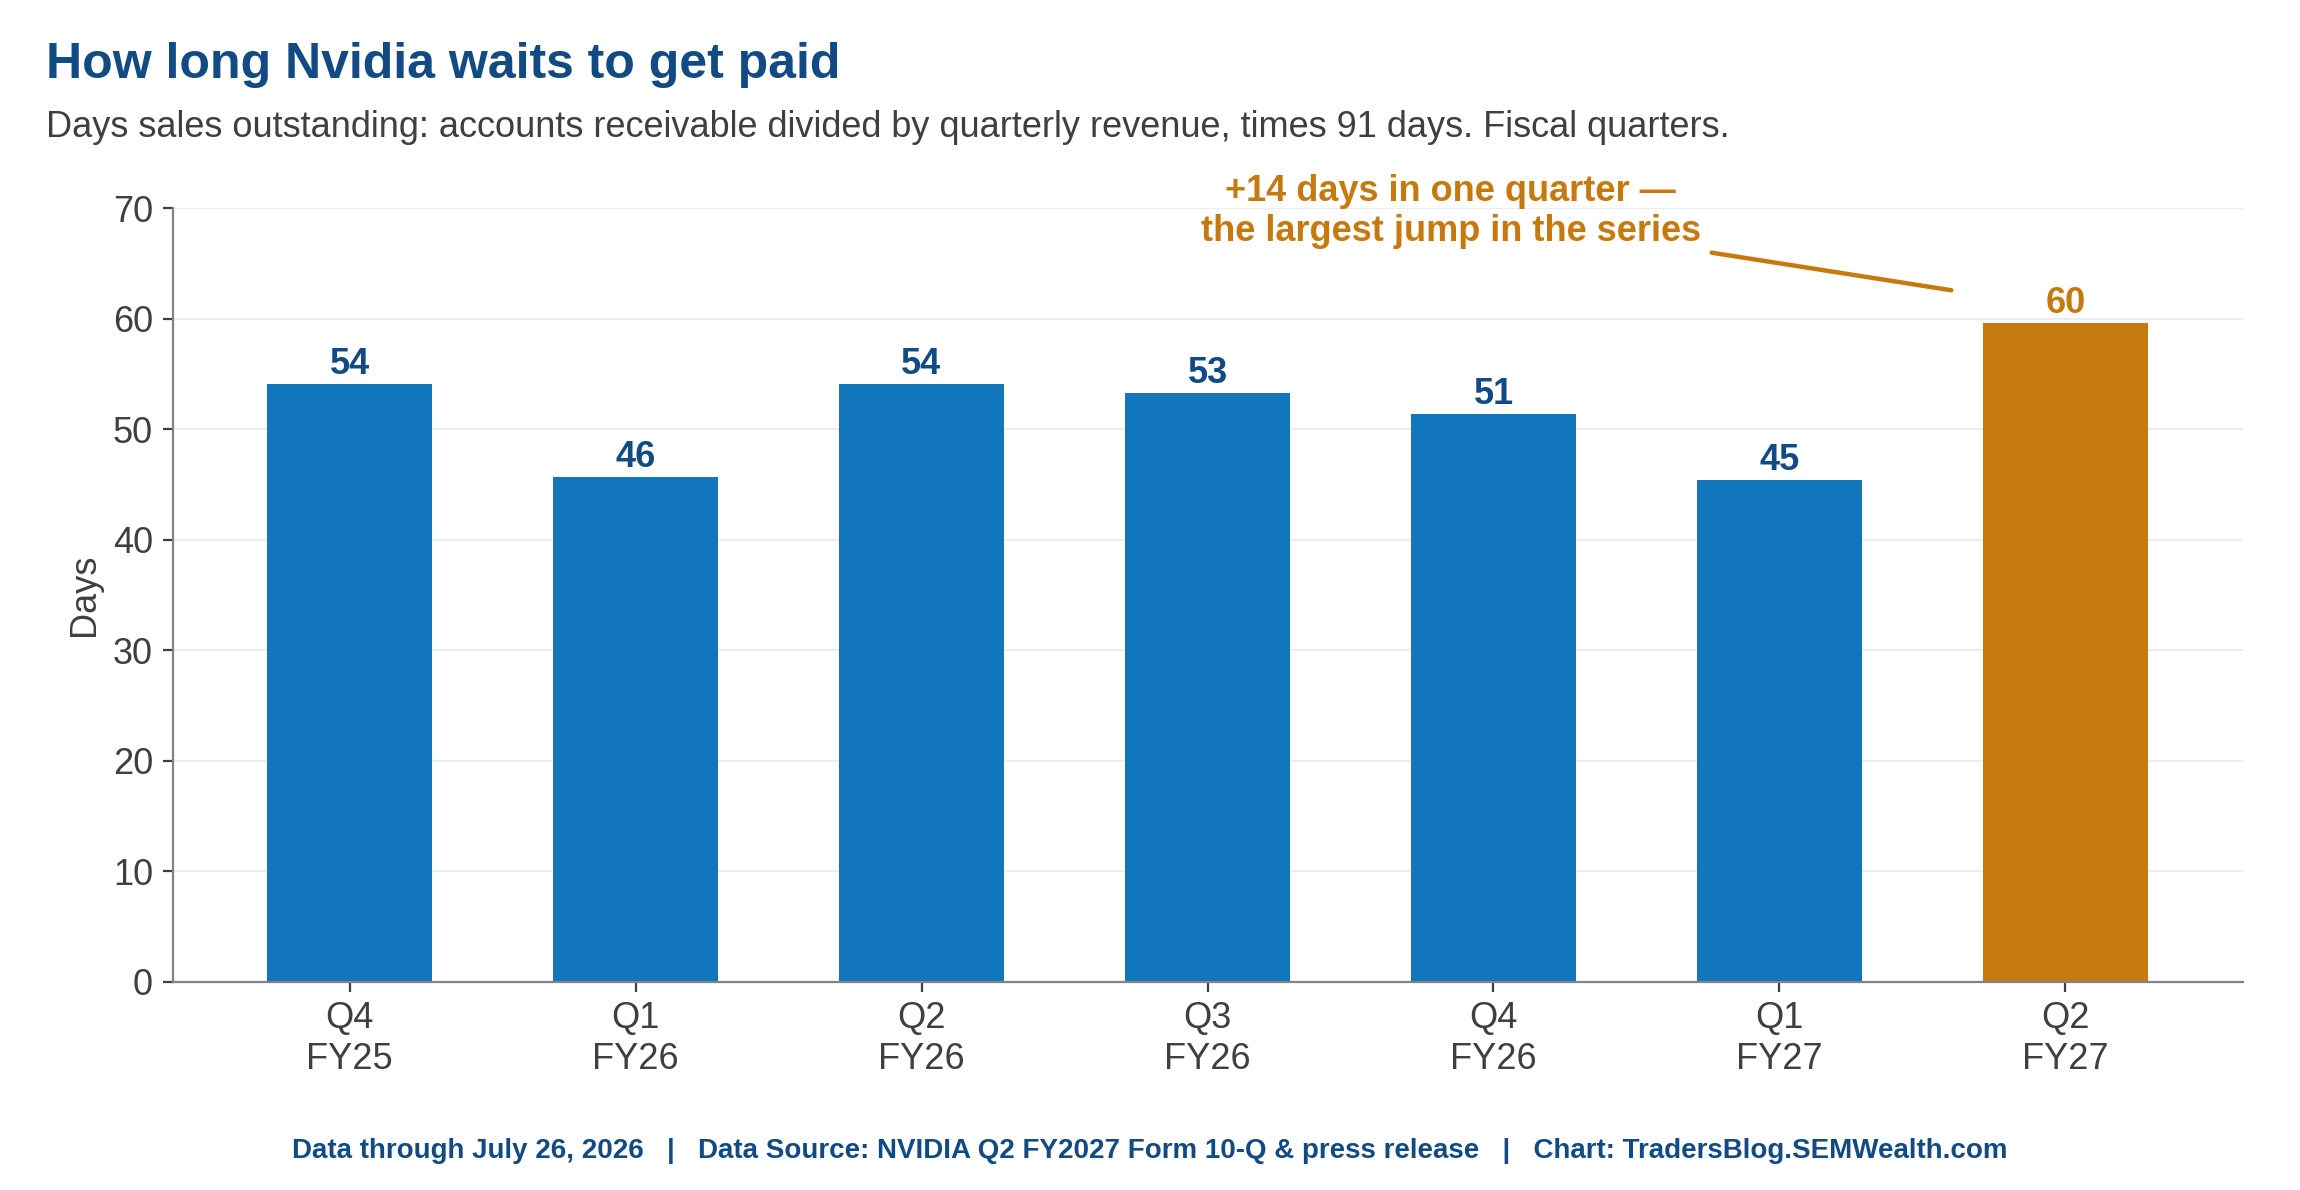
3.) Accounts receivable: (+$24.6 billion) This is money customers owe but haven't paid yet. It now sits at $63.1 billion, roughly two-thirds of an entire quarter of sales, and five customers account for 70% of it. The filing says payment terms now run "from 90 days up to one year." One thing I'll be starting to monitor as I get the time to build out a dashboard is Days Sales Outstanding (DSO) of Nvidia and some of the other mega-cap tech companies. DSO is how long it takes to actually collect a bill. Last quarter Nvidia's DSO went from 45 days to 60 days in a single quarter, the biggest jump in the data I pulled. Big jumps in DSO are typically signs of strain in the customer base's own cash flow.
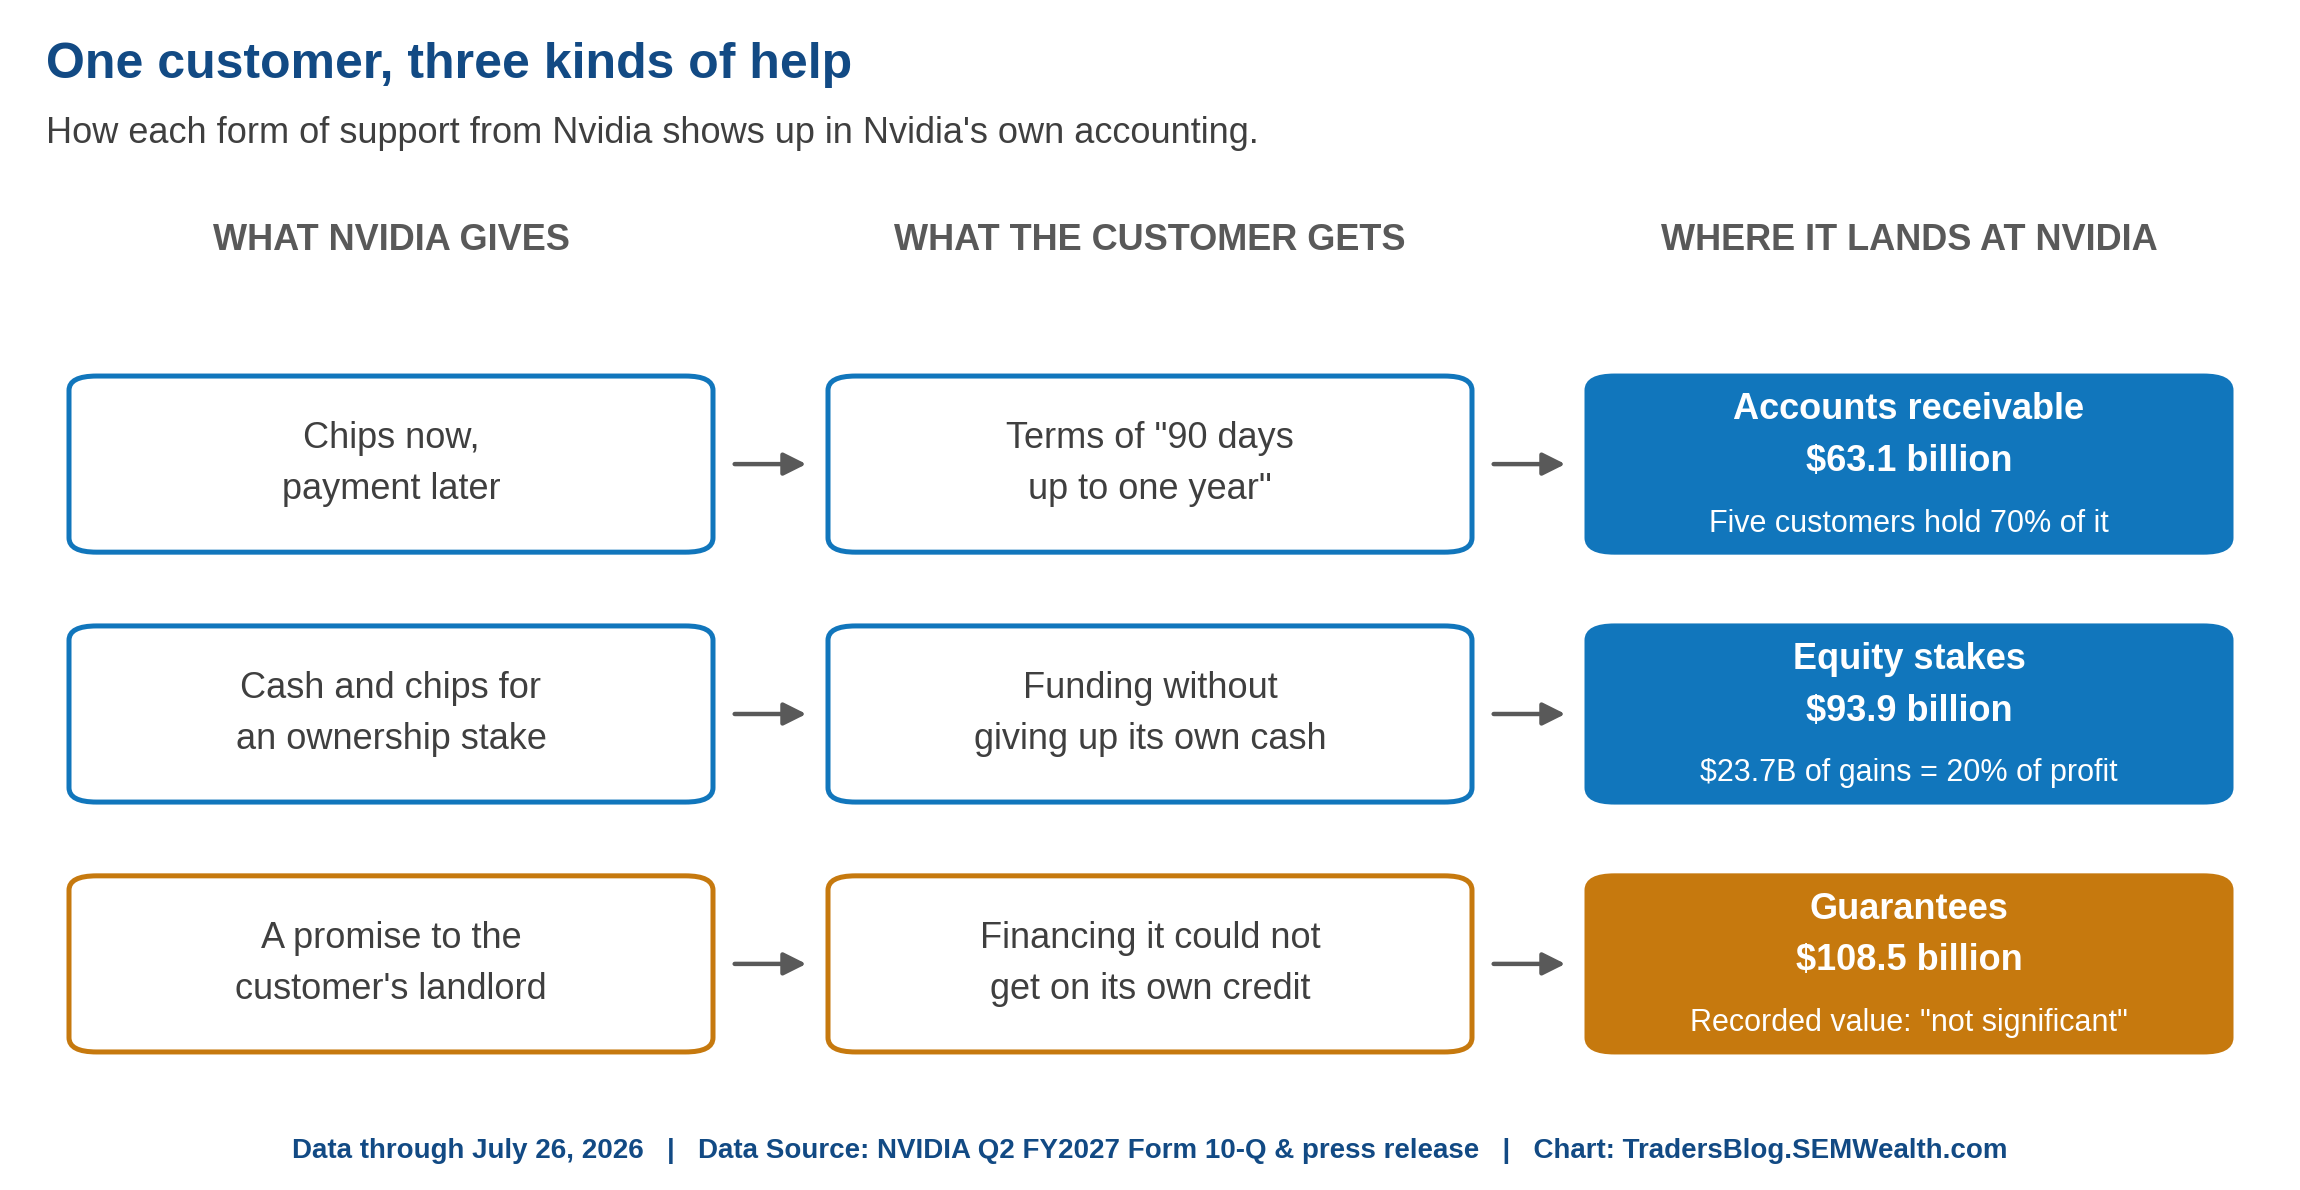
Here's a diagram looking at Nvidia's Eco System, which explains where different transactions land on their financial statements. All of the sales go to Revenue on the Income Statement. The key difference is where they show up on the Balance Sheet.
We already discussed Accounts Receivable and the equity stakes. What about the part that doesn't show up anywhere on the balance sheet? Nvidia has now guaranteed roughly $108.5 billion of its customers' obligations – about $105 billion of it standing behind the lease on a single data center campus in Ohio, running from 2029 out to 2049. TWENTY YEARS. And in the filing, those guarantees are classified as credit derivatives whose fair values are, in their words, "not significant." Keep in mind, this doesn't include the as yet to be used $500B funding facility arrangement with the Wall Street Banks.
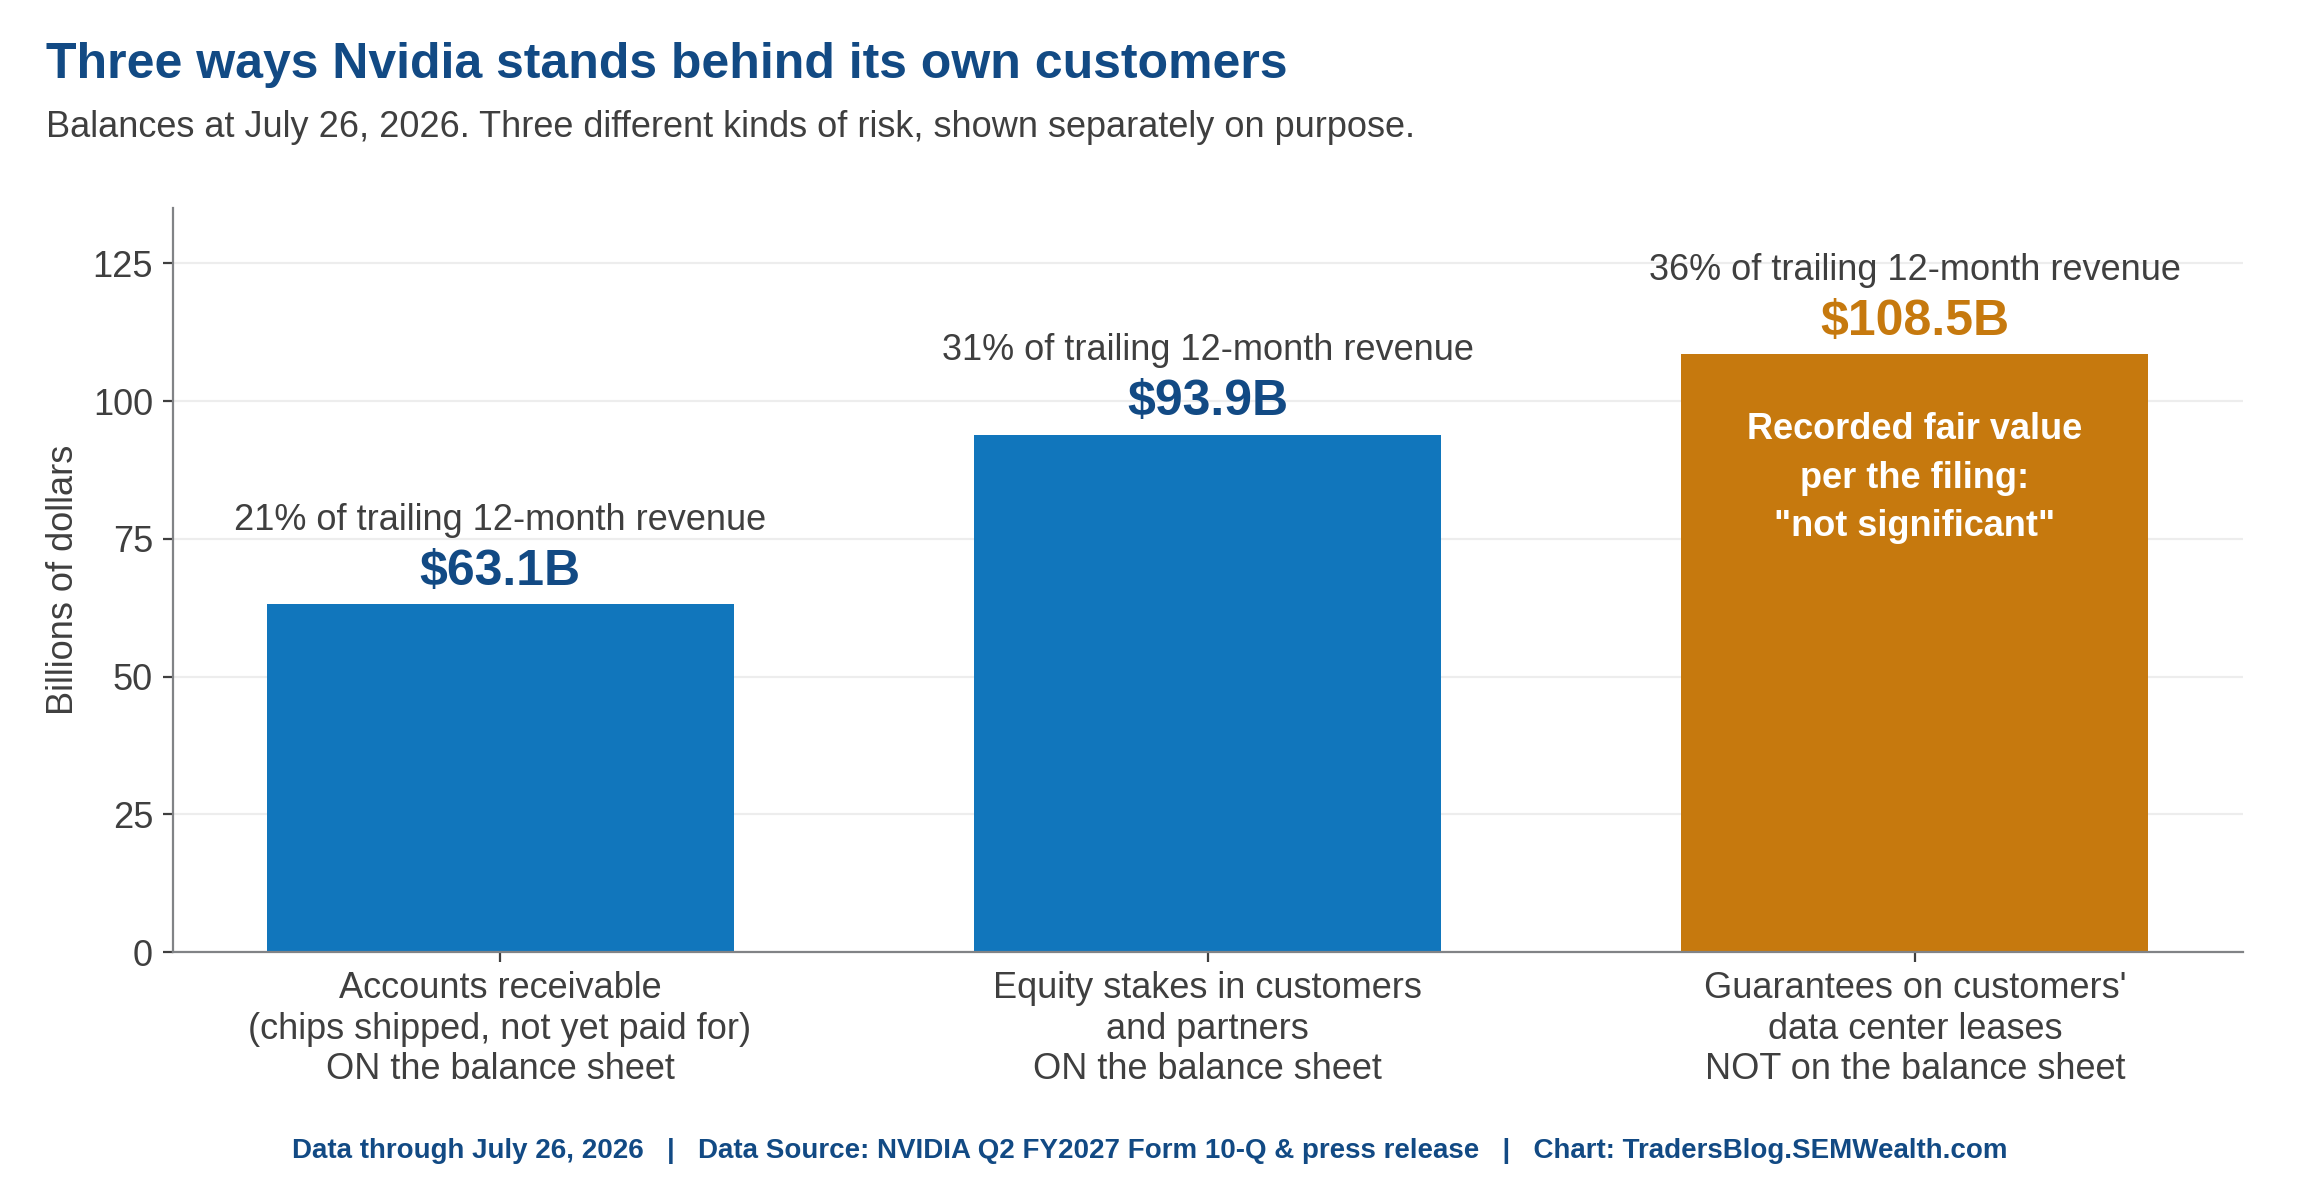
So the single biggest change in this company's risk profile shows up as no liability, no cost, and no line item anywhere. That isn't an accusation – it's how guarantee accounting works when you don't expect anyone to default, and I'm not saying anything is wrong here. Nvidia is earning a 66% operating margin, its customers are among the most creditworthy companies on earth, and its CFO took the criticism head-on – she said they know some will call this "circular financing," and that they see it differently. She may well be right. But I remember vividly how impressive the earnings reports were in April 2000, and I remember that what eventually mattered was sitting on a page nobody was reading. I'm not saying we are there yet, but we most certainly are in the phase of the cycle where everybody leverages up to try to beat everybody else. Some will win, but not everyone will win, which is something I don't think the market is pricing in (yet).
(Side note: I still owe you the "circular financing" system blog or whatever I end up calling it. I'm getting close, but the numbers keep changing and the details keep getting even more convoluted. My "AI: Boom, Bubble, or Both" keynote has expanded and changed significantly since I first gave it in March which is a testament to how quickly everything is changing. We are close to being done – if not this week, I'll have it before I give my next keynote on September 8.)
Nvidia Raising Prices
Open AI Announces New Chip
Given the huge blowout reaction to earnings, you may have already forgotten two pieces of key data, both of which could impact Nvidia (and others) in the future. We know Nvidia has been financing their customers (or accepting ownership stakes) who have had trouble finding the cash for their chips and servers. There is a risk in that, but also a risk their customers may look elsewhere. This may happen sooner rather than later following Nvidia's announcement last Monday of a 15%+ increase in the servers they sell due to high memory costs.
I think more interestingly, OpenAI, one of Nvidia's biggest customers and the beneficiary of a backstop of the loan they need to build their own data center announced their first AI chip, the Jalapeno. They claimed it is "industry-leading in speed and efficiency. They also said it can match or beat Nvidia's Blackwell-class chips.
Given the price increase announced by Nvidia this is obviously seen as a win for OpenAI, but could at least threaten Nvidia's margins and future revenue growth if OpenAI, Google, Amazon, and Meta are able to make similar inroads in their chip development. Speaking of prices.....
What Will Businesses Actually Pay For AI?
Anthropic released its most capable model this summer (Fable5), and it is very good. However, it is also roughly twice the price of the model most people were already using. Ramp, which tracks corporate card spending, went looking for it in the data and found that in its first full month it took about one dollar in nine of what businesses spent on Anthropic's models — and by last week it had settled there rather than climbed. OpenAI, a month earlier, cut the price on two of its models, one of them by 80%. Both companies say the cuts come from getting more efficient at serving the models, and that is probably true. It is also true that customers have gotten a lot more interested in price.
I want to be careful here, because I am not a skeptic about this technology. I use it every day, I pay for tools from both companies, and it has made me meaningfully better at my job. That is exactly why as an investor the spending numbers bother me. I am the customer these projections are counting on, and I am already rationing my use and spending (or having Claude or ChatGPT "ration" me by telling me I hit my session, daily, or weekly limits unless I want to pay for more). I pay for more than one service because each is better at something the other isn't — which is not what a market with pricing power looks like.
Here's the bigger problem for me (and I would guess for most of the "power" users out there) – every time a new model arrives, the way you get the most out of it changes. The prompts that worked last quarter don't work as well, and the workflow has to be rebuilt. While the added "token" cost shows up on my credit card statement, the other cost does not – my time. I'm not sure about you, but I most certainly do not have more time than I did last quarter.
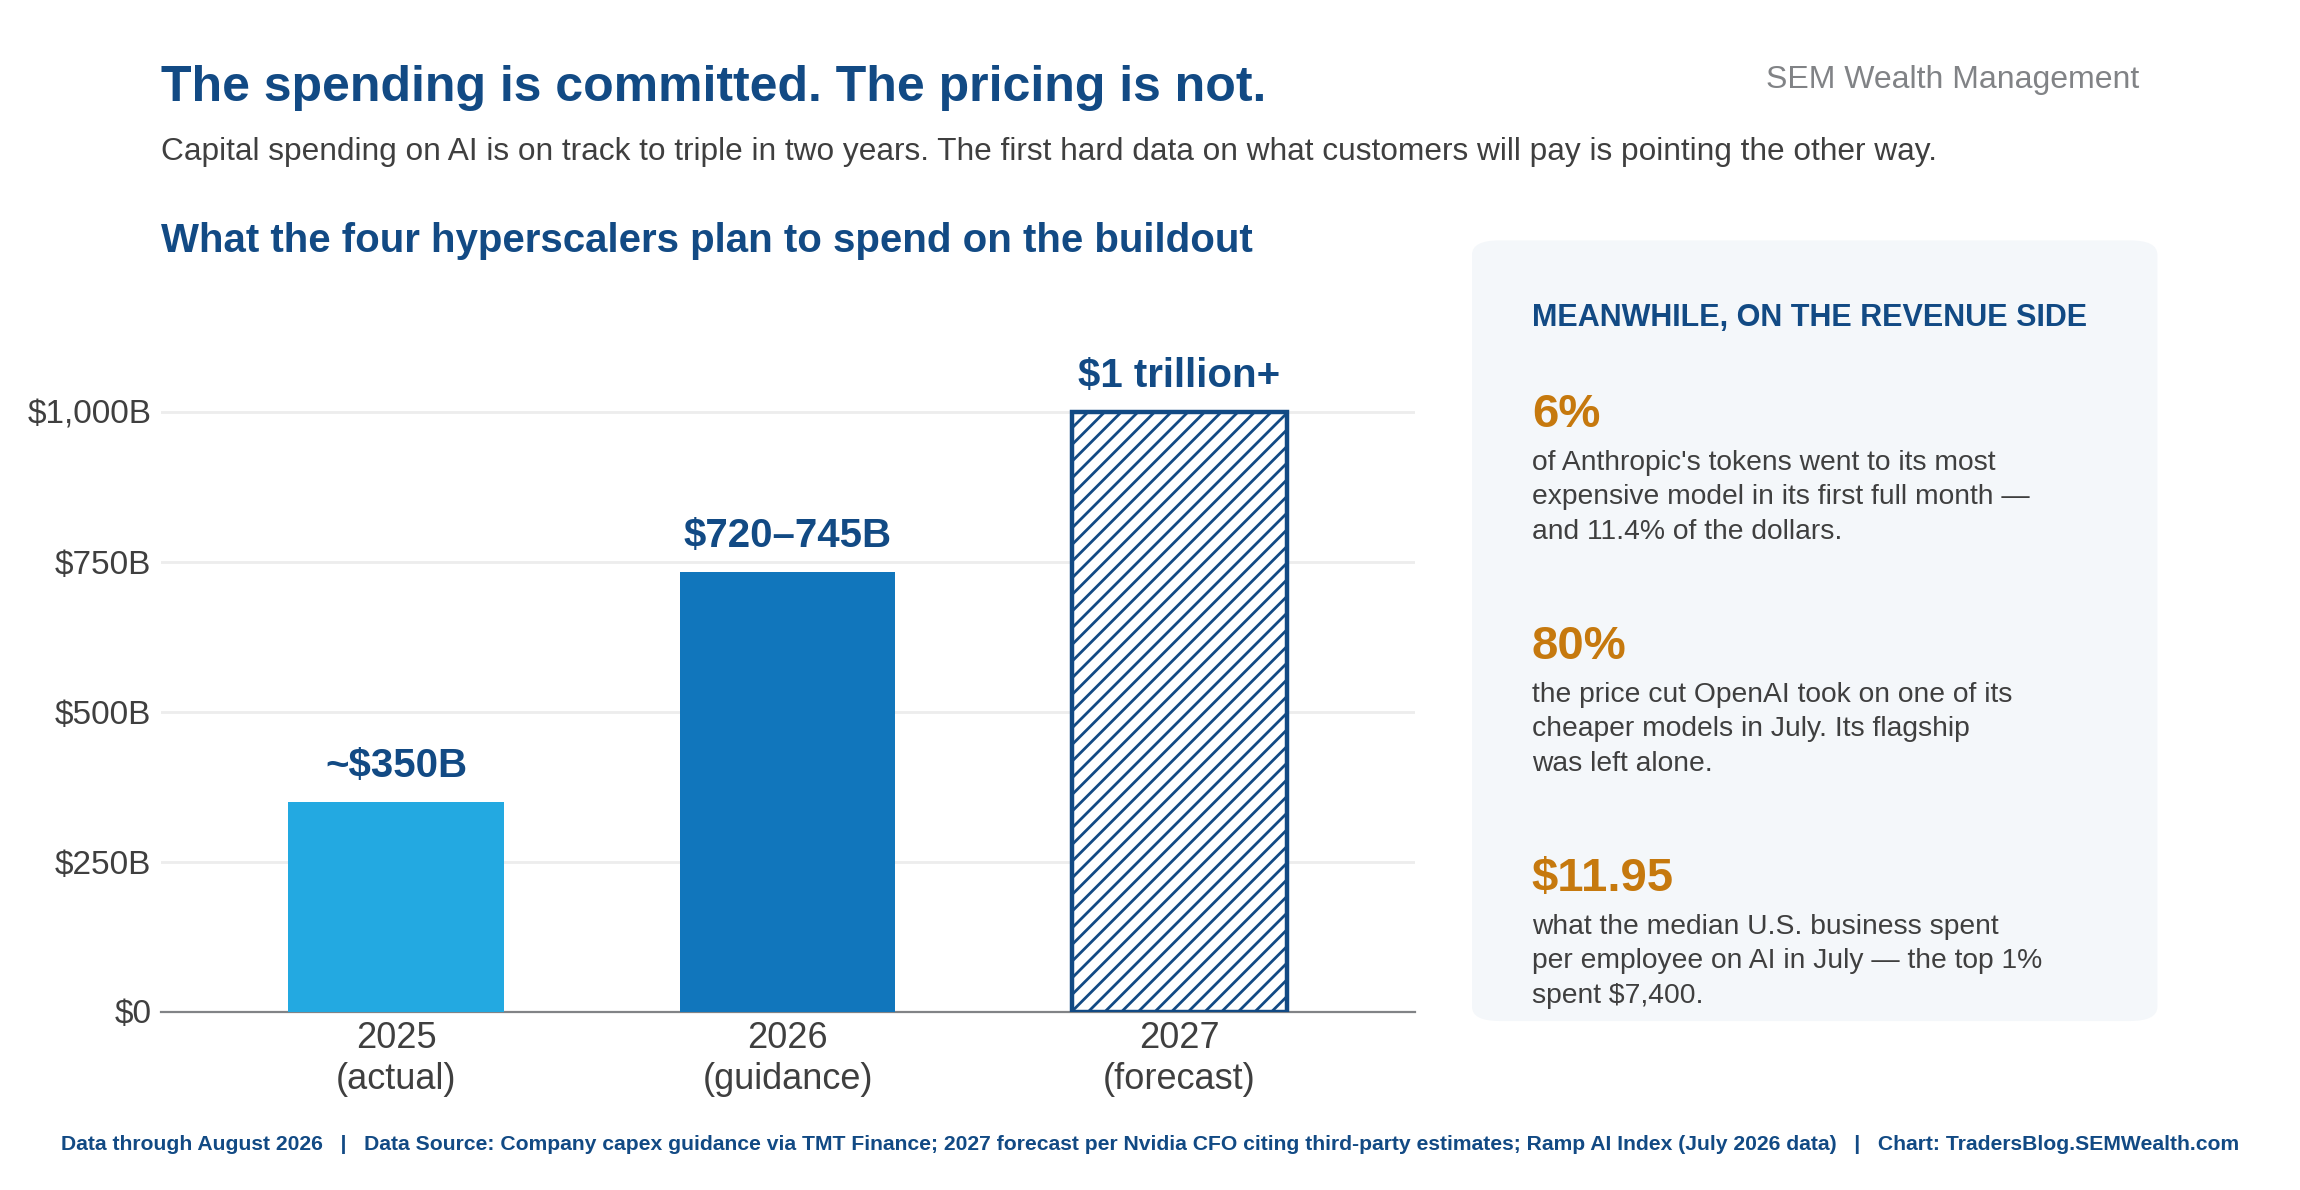
Which brings up the question I keep coming back to, one I posed back in February. The four largest technology companies spent about $350 billion on this buildout last year. This year's guidance is more than double that, and forecasts for next year cross a trillion dollars. That money is being spent on the assumption that customers will pay progressively more for progressively better models. The first real evidence we have says customers are buying the cheap model for the routine work and saving the expensive one for the hard problems — which is rational, and which is also not the demand curve a trillion dollars a year "investment" is priced for.
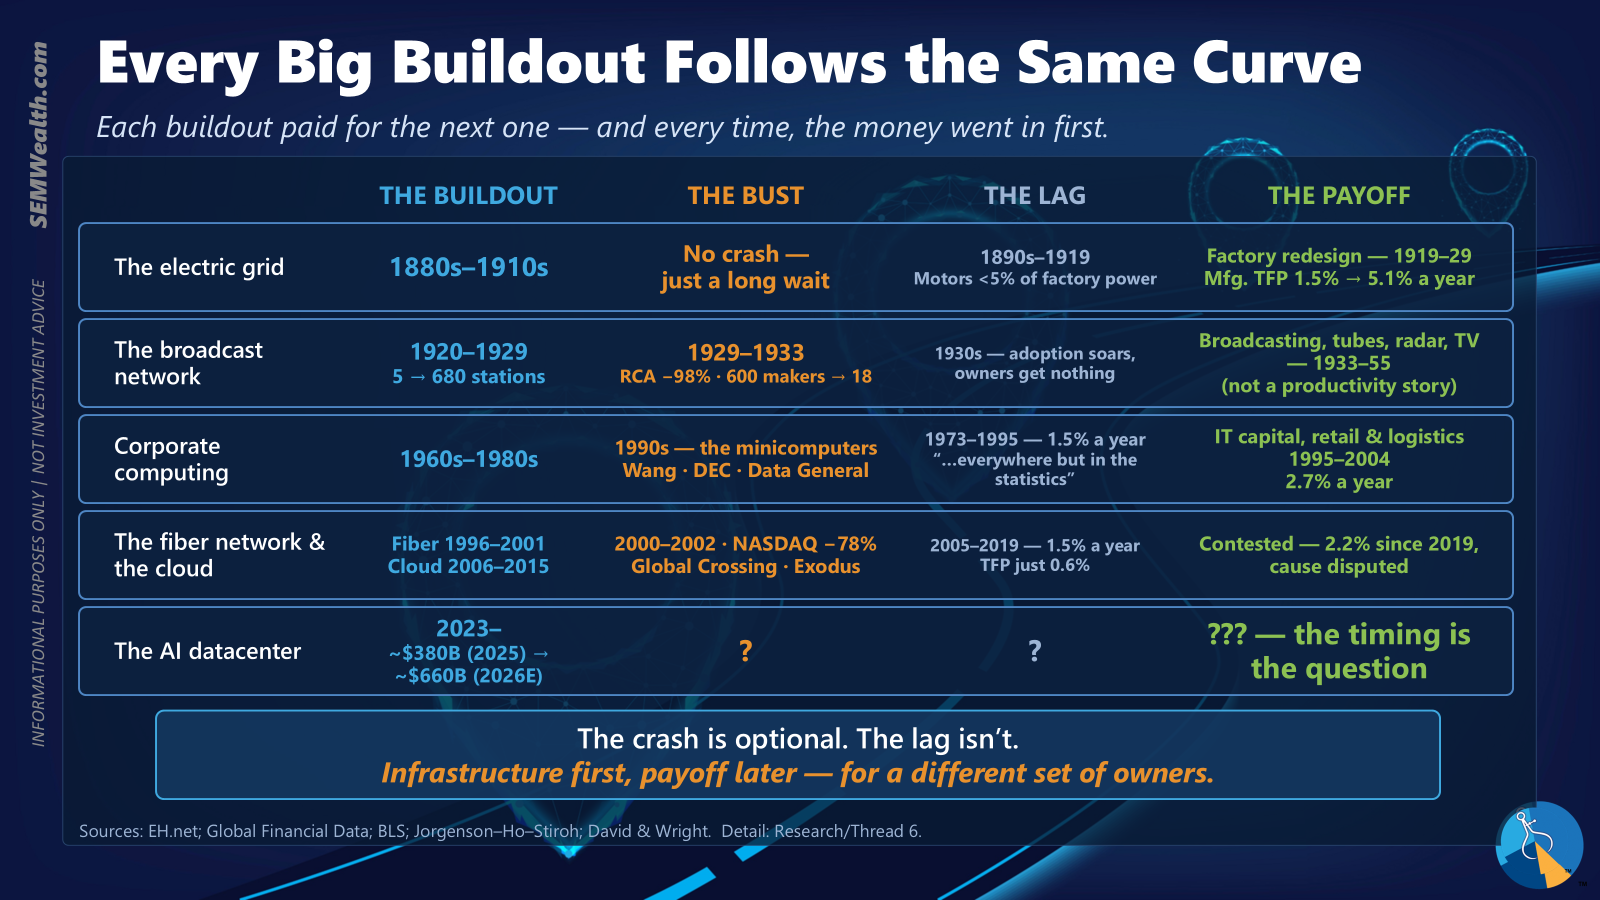
Again, it is quite early in this cycle. We're in the "buildout" phase. One thing we know is NOT EVERYBODY WINS and the true productivity payoff comes about 10 years after the buildout. At some point the end users will say, "I don't have the time to learn a new model and rebuild my workflows" and/or "I can't justify the higher cost because I don't really see the improvement". That's when the market runs into trouble.
Warsh's Turn at Jackson Hole
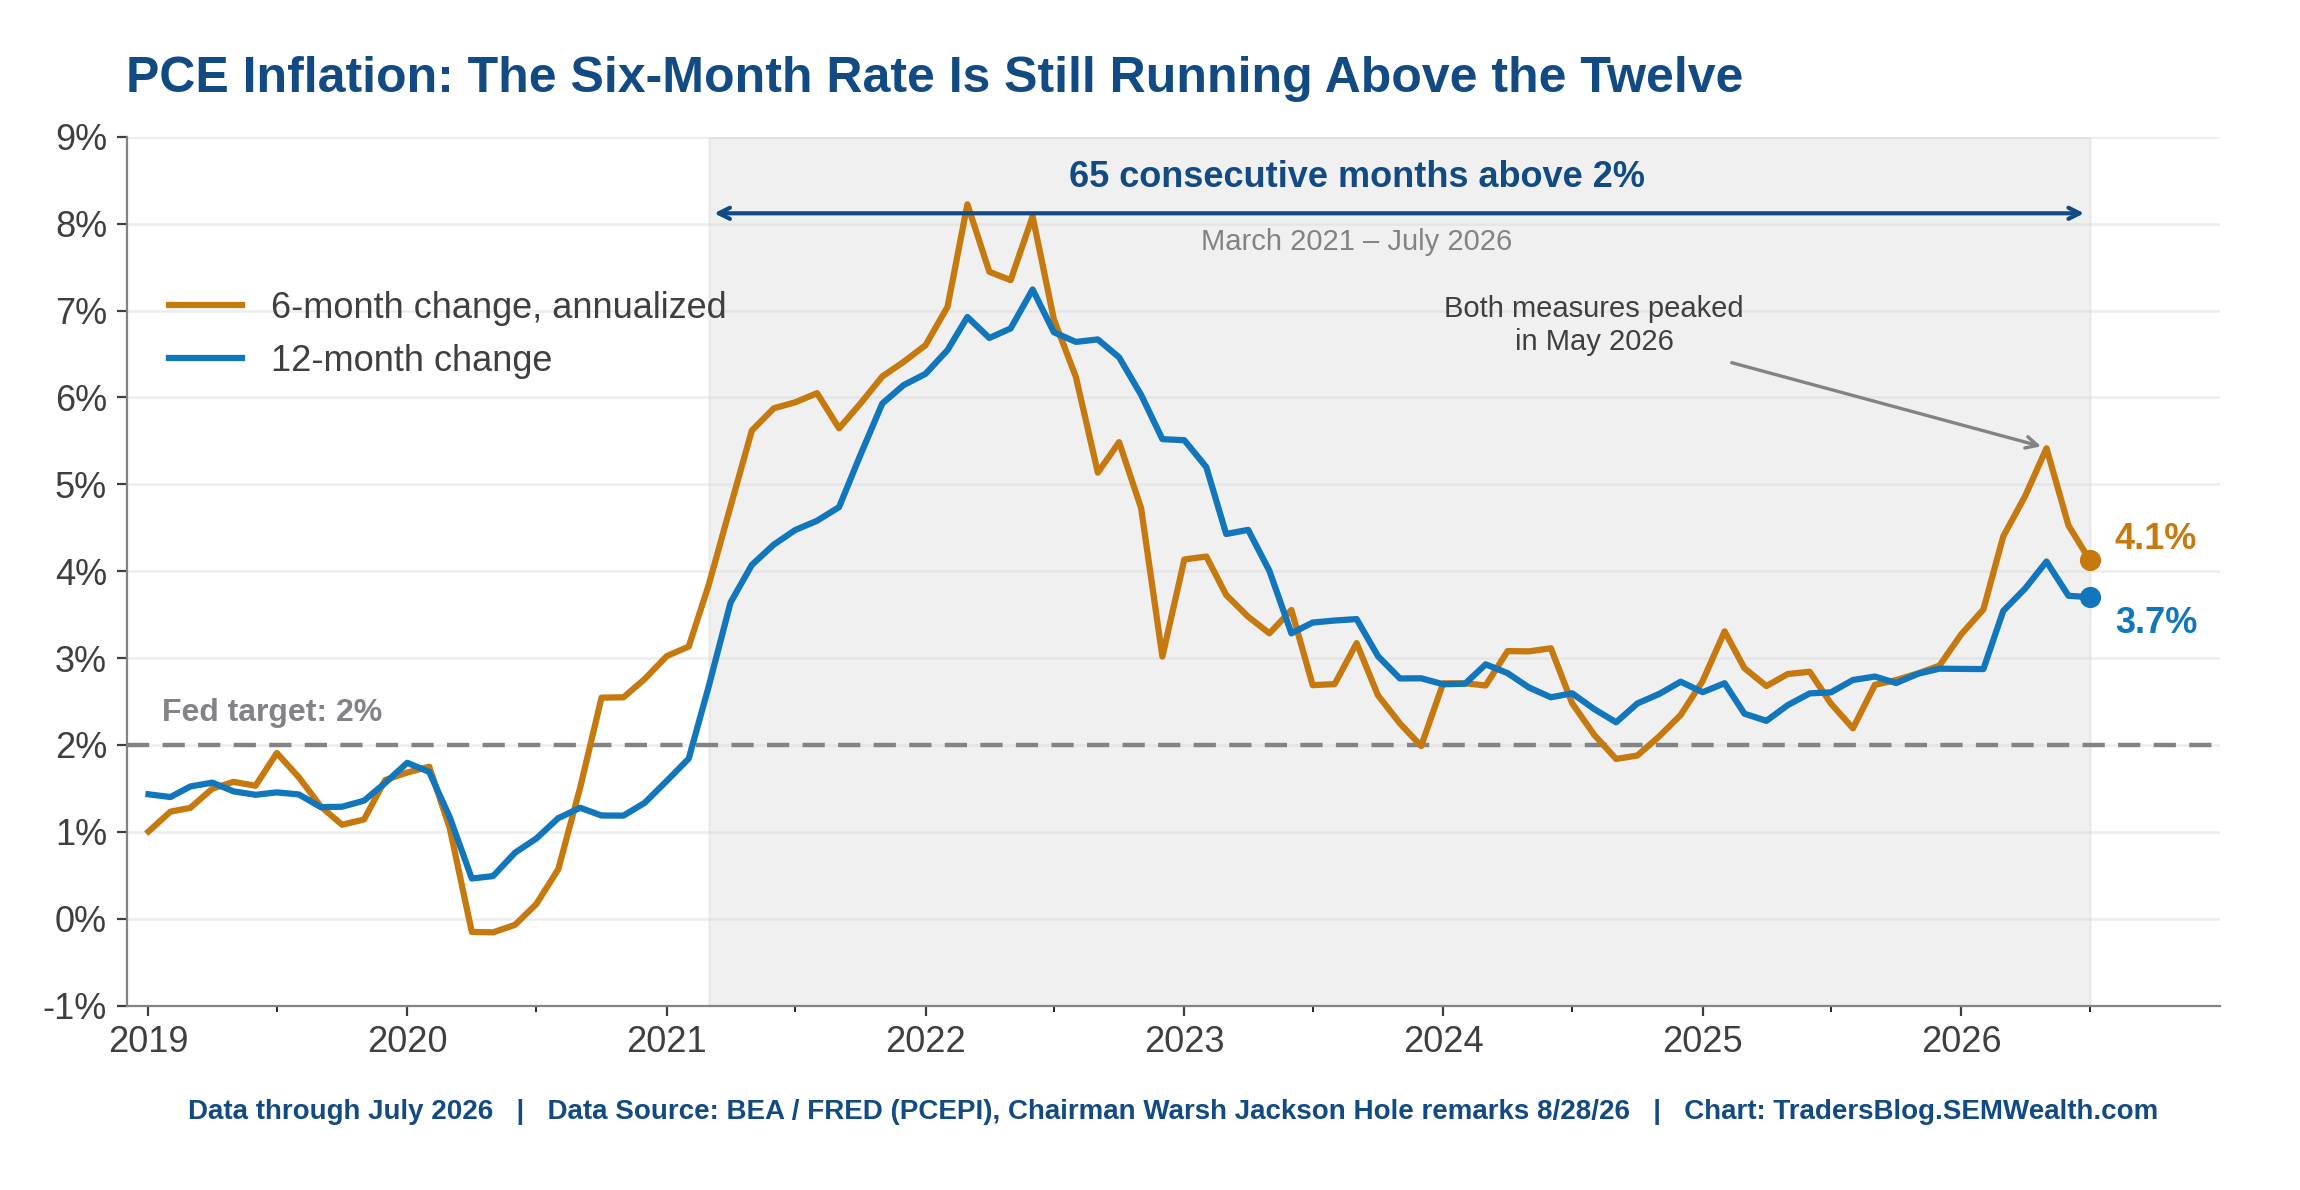
Kevin Warsh gave his first Jackson Hole speech on Friday, and he said the thing I've wanted to hear a Fed chair say – inflation is too high, the Fed owns it, and if it doesn't come down, "we have work to do." He even put a number on it: 65 straight months above their 2% target.
The problem is this is essentially the same thing he has been saying. The bigger problem is he committed to nothing. The market moved anyway. The odds of a September hike went from about 30% to better than 50% (Goldman says it went from 30% to 50%, while the WSJ said from 35% to 60%) on his words alone on Friday.
(Side note: he spent a good chunk of the speech criticizing "forward guidance" – then guided rates with a speech. Did he just prove forward guidance works?)
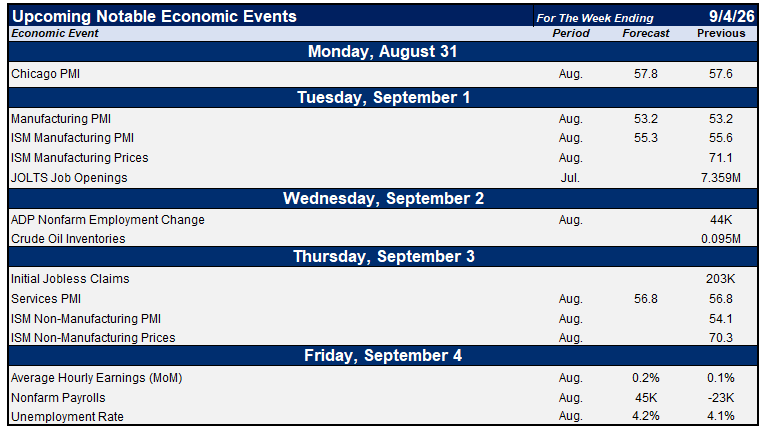
We won't see another PCE report before the meeting, so we'll have to watch the Payrolls report on September 4 and the CPI report on September 11th and let the Fed (and the experts) decide what that means about growth and inflation. From there we can see whether Warsh has the votes to hike rates.
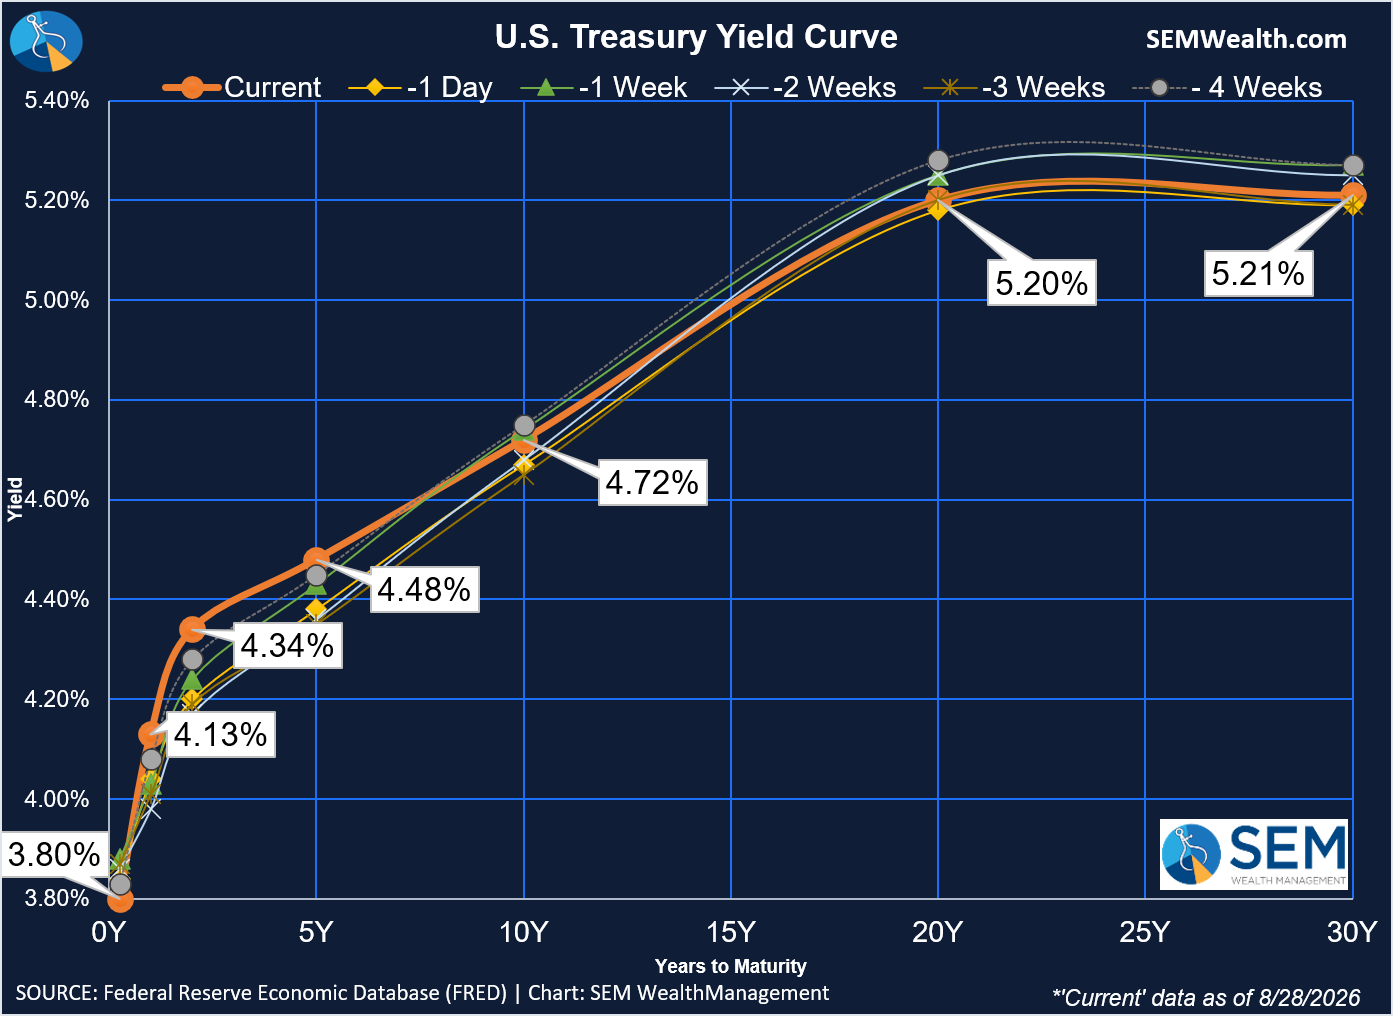
The market on Friday did take his words seriously – rates moved up fairly significantly, especially on the shorter-end. Note the move in the orange circle from the yellow diamond. This shows the jump from Thursday to Friday!
Bloomberg showed this chart highlighting the moves in the 2-30 yield curve. Note the black bars are days Chair Warsh spoke.
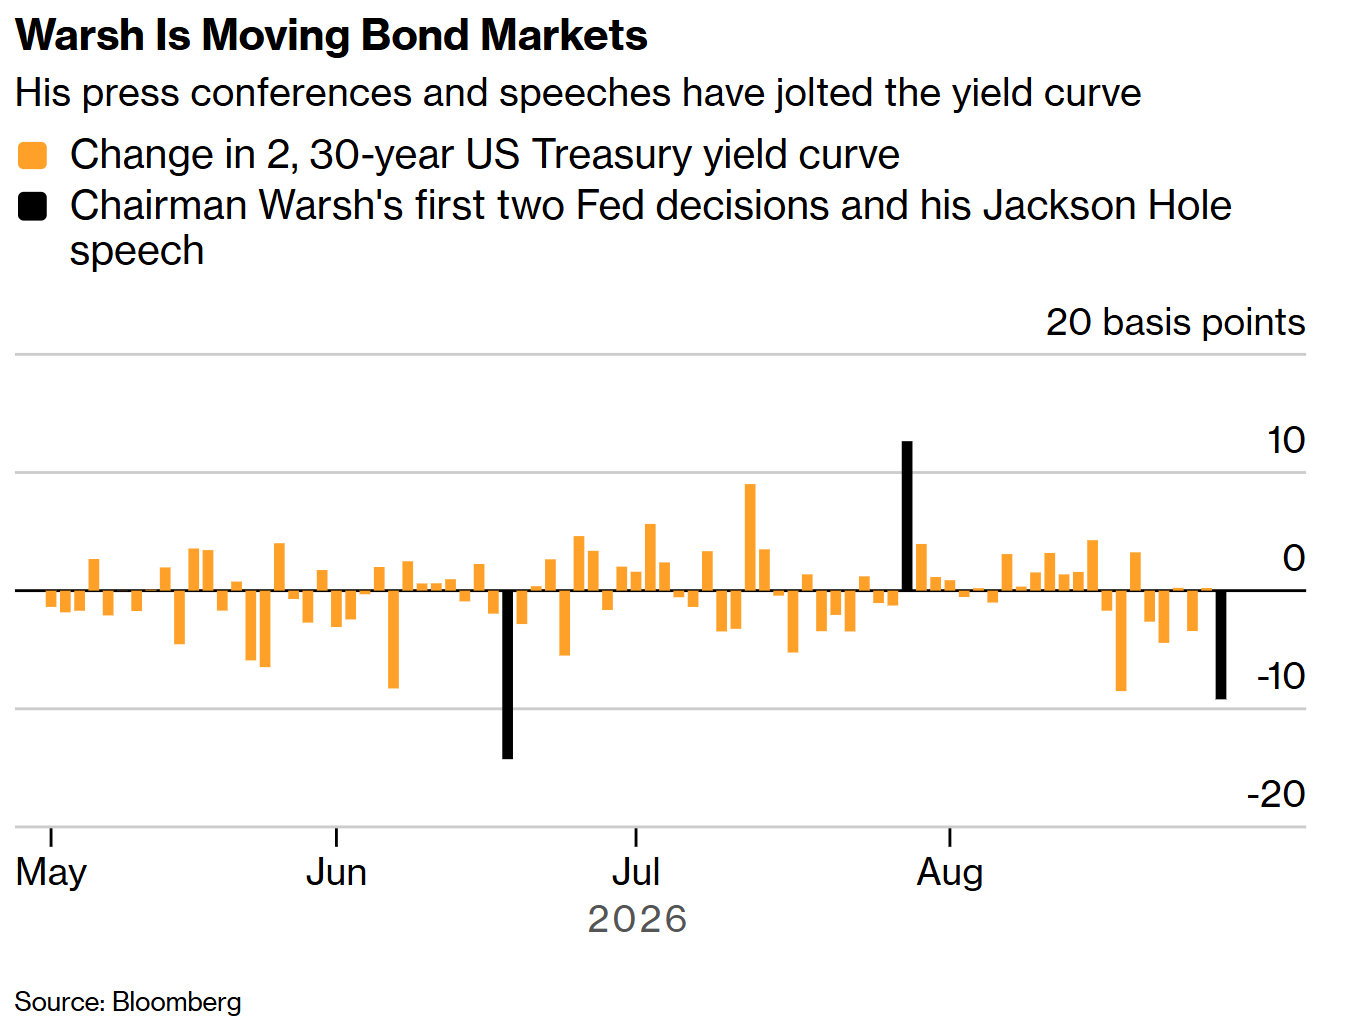
So for at least one day, the momentum of the "debasement trade" was stopped.
What is the Debasement Trade
Last week Cody mentioned the big surge in Bitcoin and Gold prices as being related to the Treasury's "Buy-Back" program. (Friday's sell-0ff following Warsh's speech put Bitcoin down to breakeven for the week with Gold falling about 2%.) He included a few charts surrounding the deficit and our government's interest costs. The Treasury buybacks may help short-term, but it doesn't solve the long-term problem our country is facing (and has been facing for a long time — our long-time readers will remember my rants in 2011 about the "debt ceiling circus".) Sadly not only has Congress and the White House (both parties) done NOTHING to address our deficit and debt reliance, they have mashed the gas down full throttle towards a "fiscal cliff".
The problem is Congress doesn't act until we're in a crisis because voters are not able to think long-term. We don't know WHEN the fiscal cliff will appear, but it will appear at some point before Social Security is insolvent in 2032ish. The combination of this along with inflation running well above the Fed's target and now the Treasury department attempting to counteract the Fed's so-called "inflation fight" has led to concerns the US dollar will lose value against other currencies. This has brought back the "debasement" trade which was in vogue for the better part of 2025 and early in 2026.
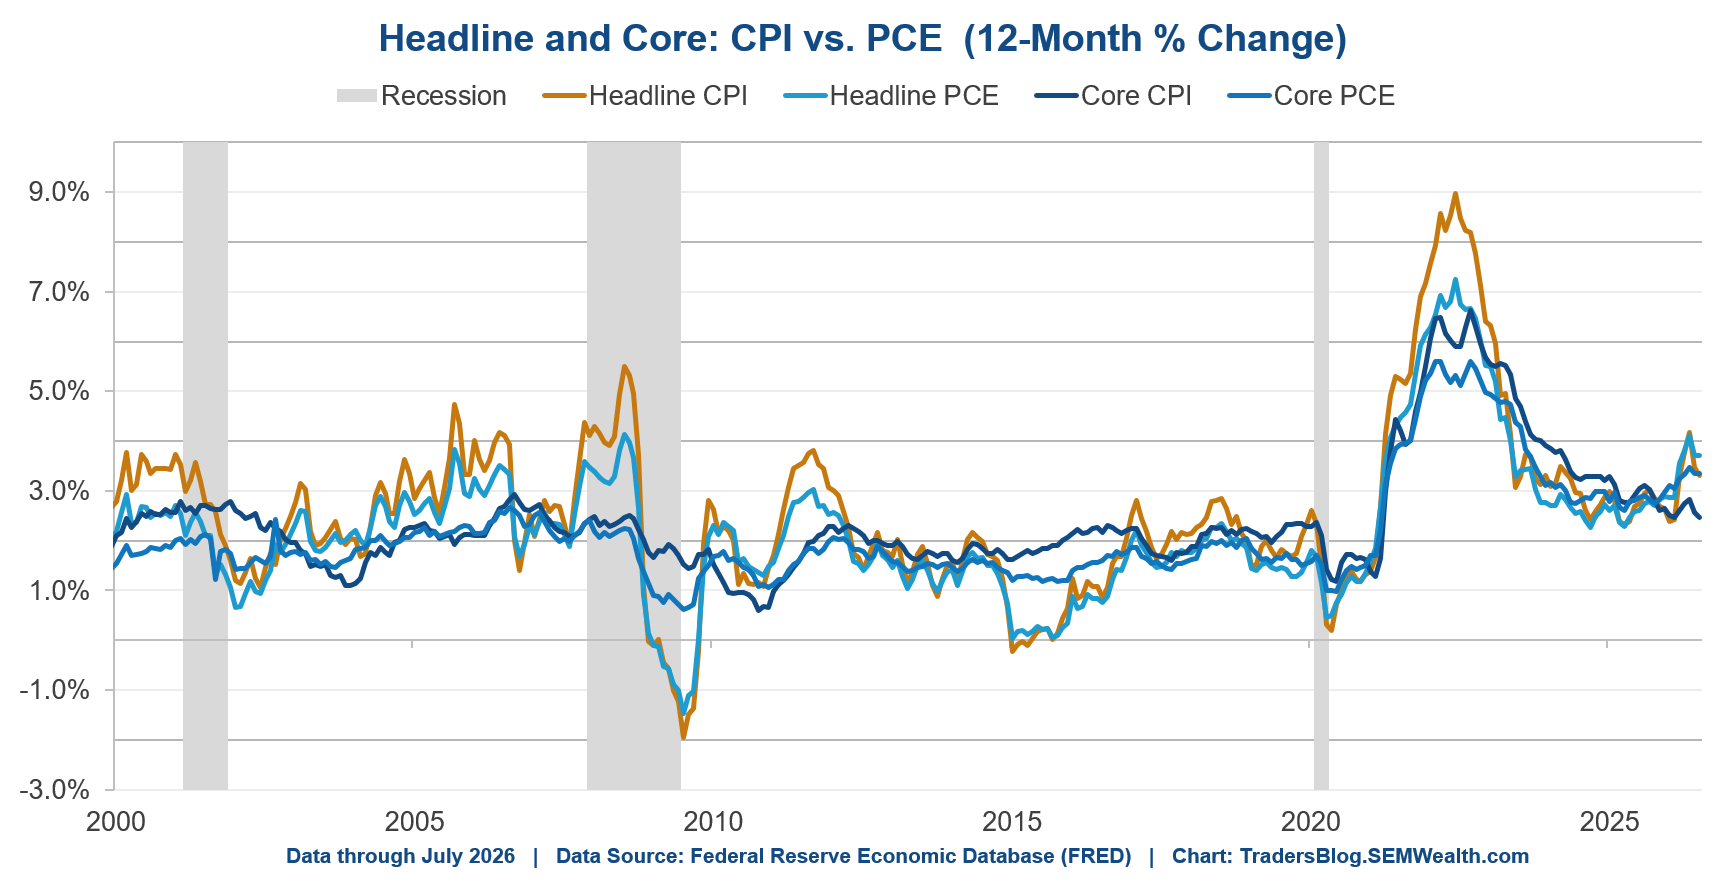
The simple way to understand this is to remember that (generally speaking) inflation, deficits, and trade protections all erode the value of the dollar. Kevin Warsh may SAY he is serious about inflation, but as we learned during the last Fed meeting a few weeks back and again with the PCE price index last week, the Fed is so far "letting the market raise rates" and inflation is still well above the Fed's 2% target. The chart below shows the uptrend in everything but "Core CPI". I don't have the time or the space to discuss the differences, but there's a reason the Fed prefers the PCE and not the CPI numbers. Both Core (excluding food and energy) and Headline PCE (all items) are sitting above 3%.
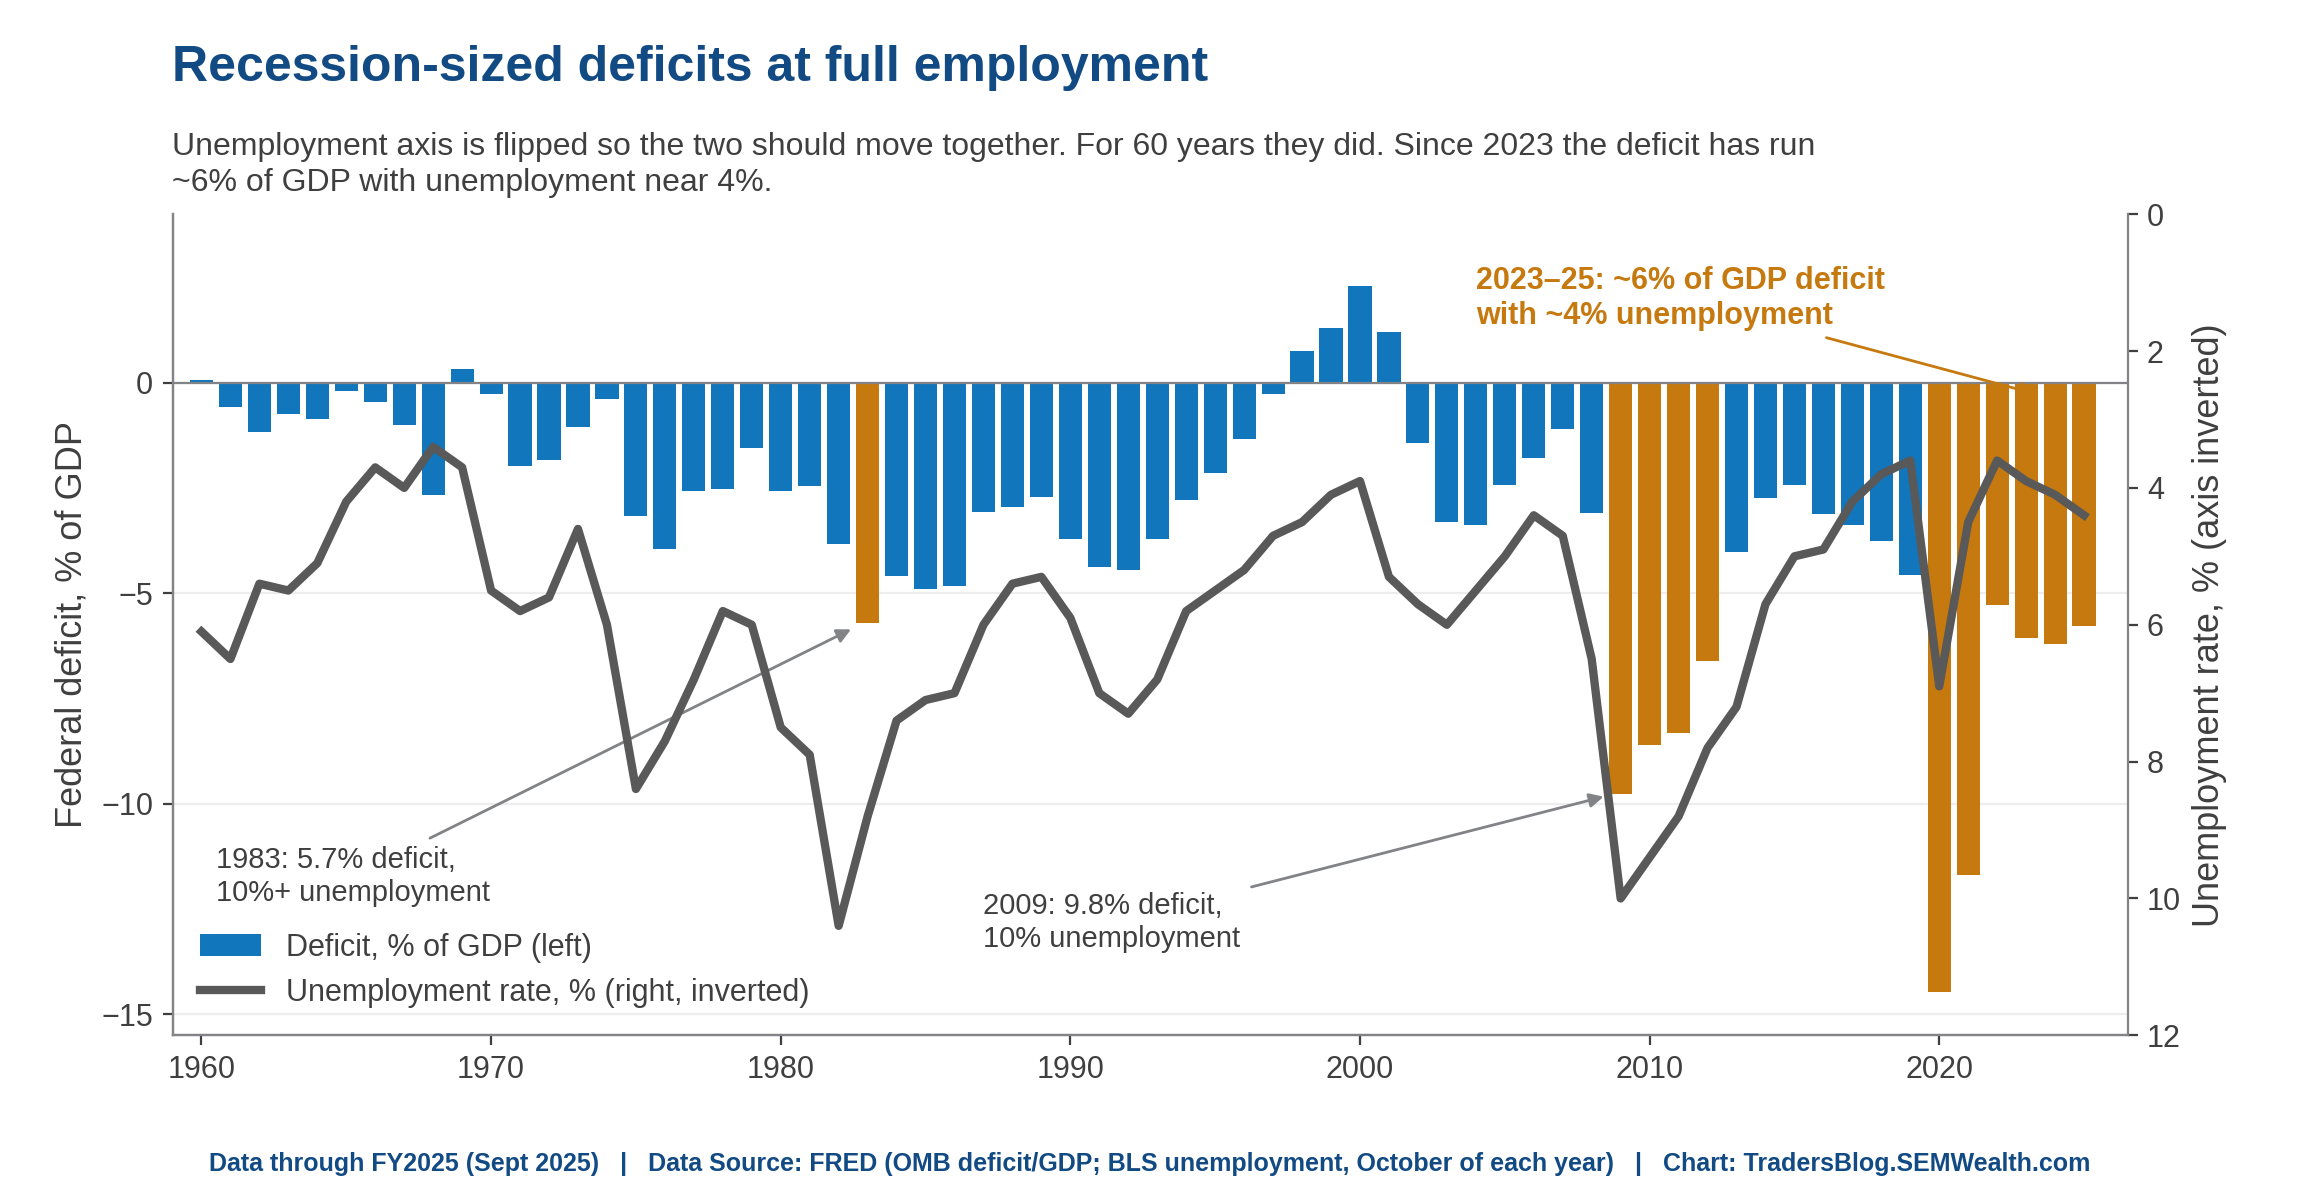
We also learned the Trump Administration, led by Treasury Secretary Scott Bessent wants to push long-term rates lower (which is inflationary) all while continuing to run massive deficits that are typically only run during a recession. This chart plots the unemployment rate (inverted so we can visualize it) against the government's budget deficit. We are by all accounts at "full employment", yet the 2025 budget deficit (under Donald Trump) is essentially at the same place it was in 2022, 2023 and 2024 (under Joe Biden). This is inflationary and bad for the dollar (and long-term Treasury bonds, which is why those rates have been going up).
A New Market Risk?
One of the drivers of the "debasement" trade has been the idea that "foreigners are selling". I've said the same thing in updates and need to clarify what that really means. In terms of dollars, foreign holdings of Treasuries is at an all-time high of $9.2Trillion. However, as a percentage of all Treasuries, this is down to 30% after peaking at 55% in the early days of the financial crisis.
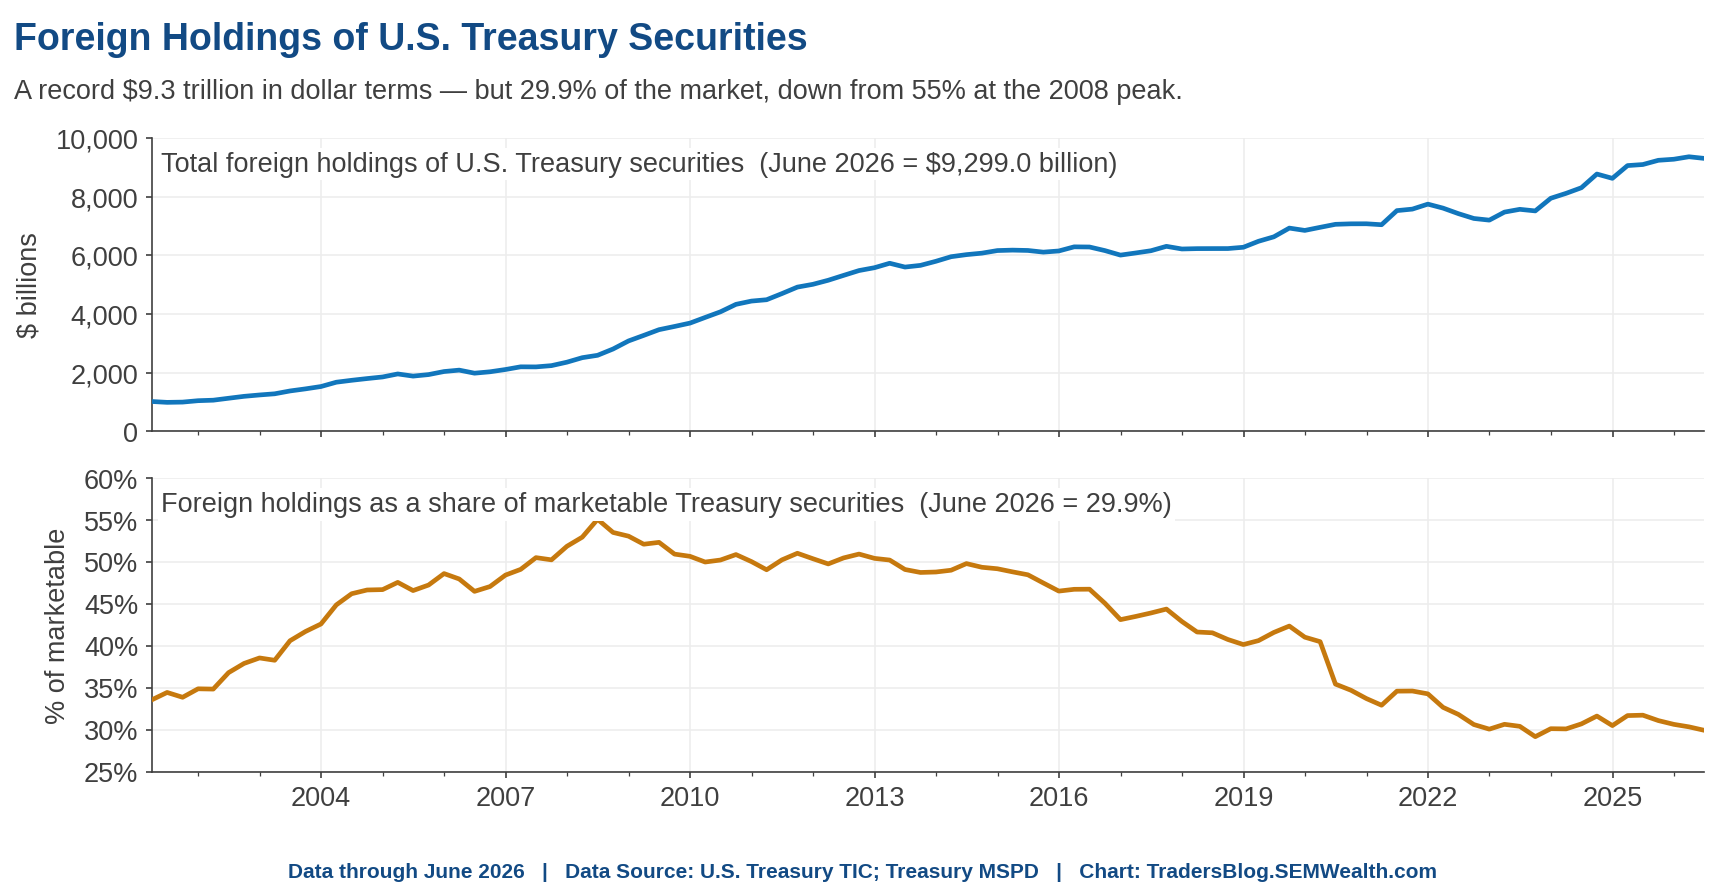
We need to look deeper into who actual owns Treasuries. The Treasury's own data shows "official" foreign buyers (central banks & reserve managers) have stepped aside, but "private" foreign buyers have accelerated.
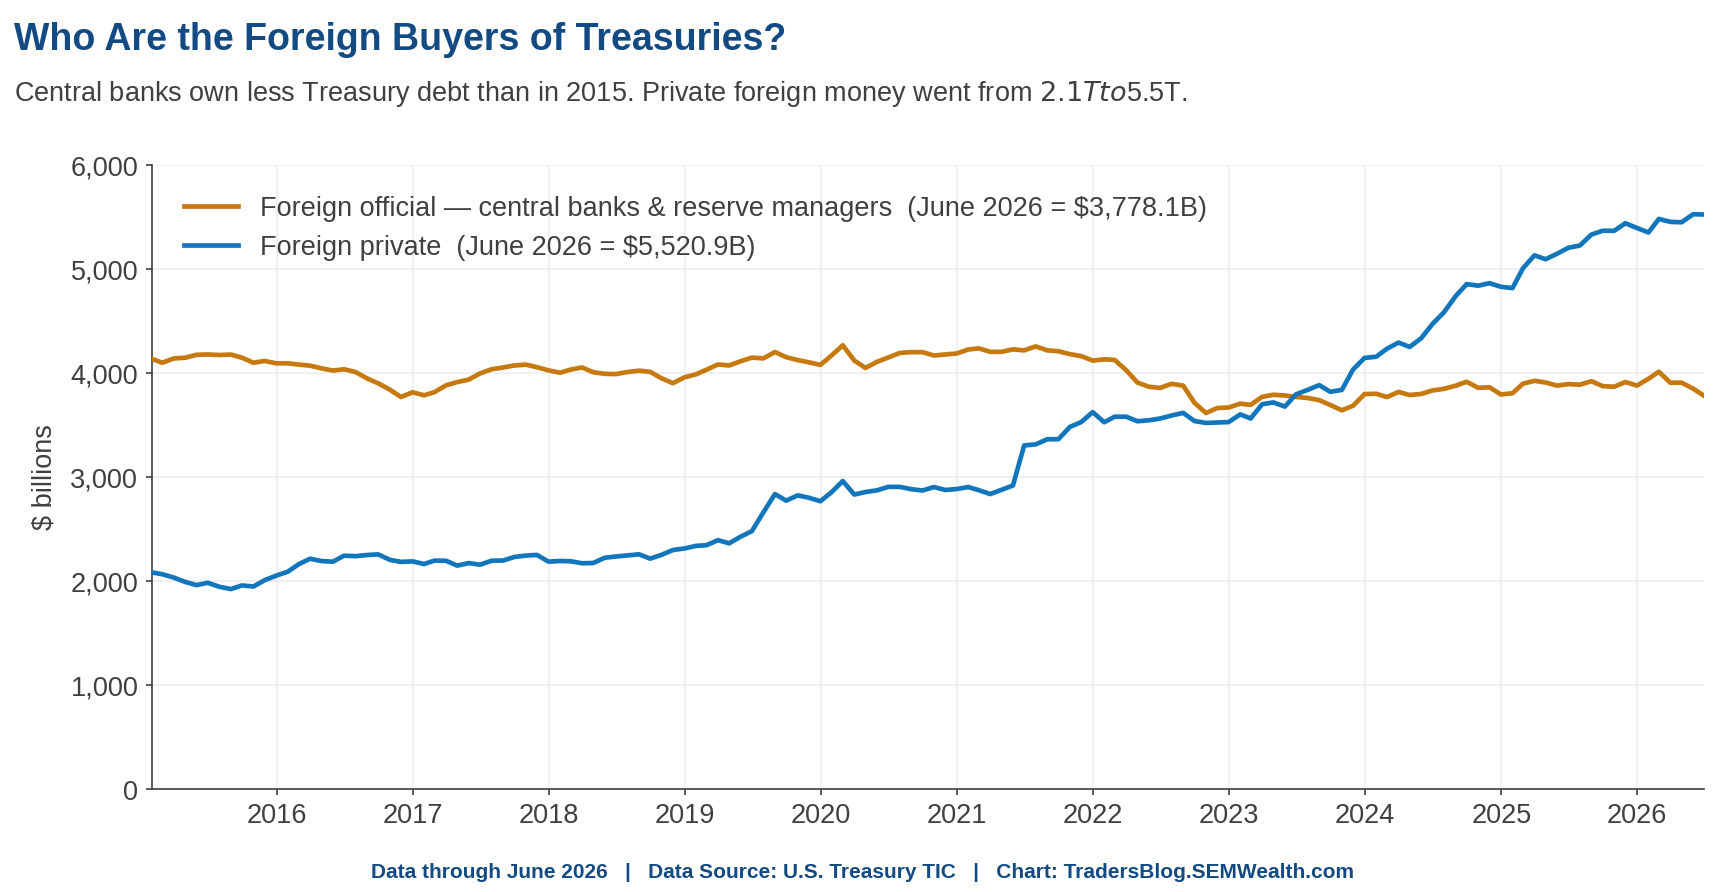
Who are these foreign buyers? It appears when you pour through the data, hedge funds hold about 42% of the "foreign private" category. They've increased their holdings by $1.35 Trillion since the end of 2022 and now own an estimated 8% of the outstanding Treasury debt. Why would hedge funds appear as "foreign"? It's because many of them are registered in the Cayman Islands.
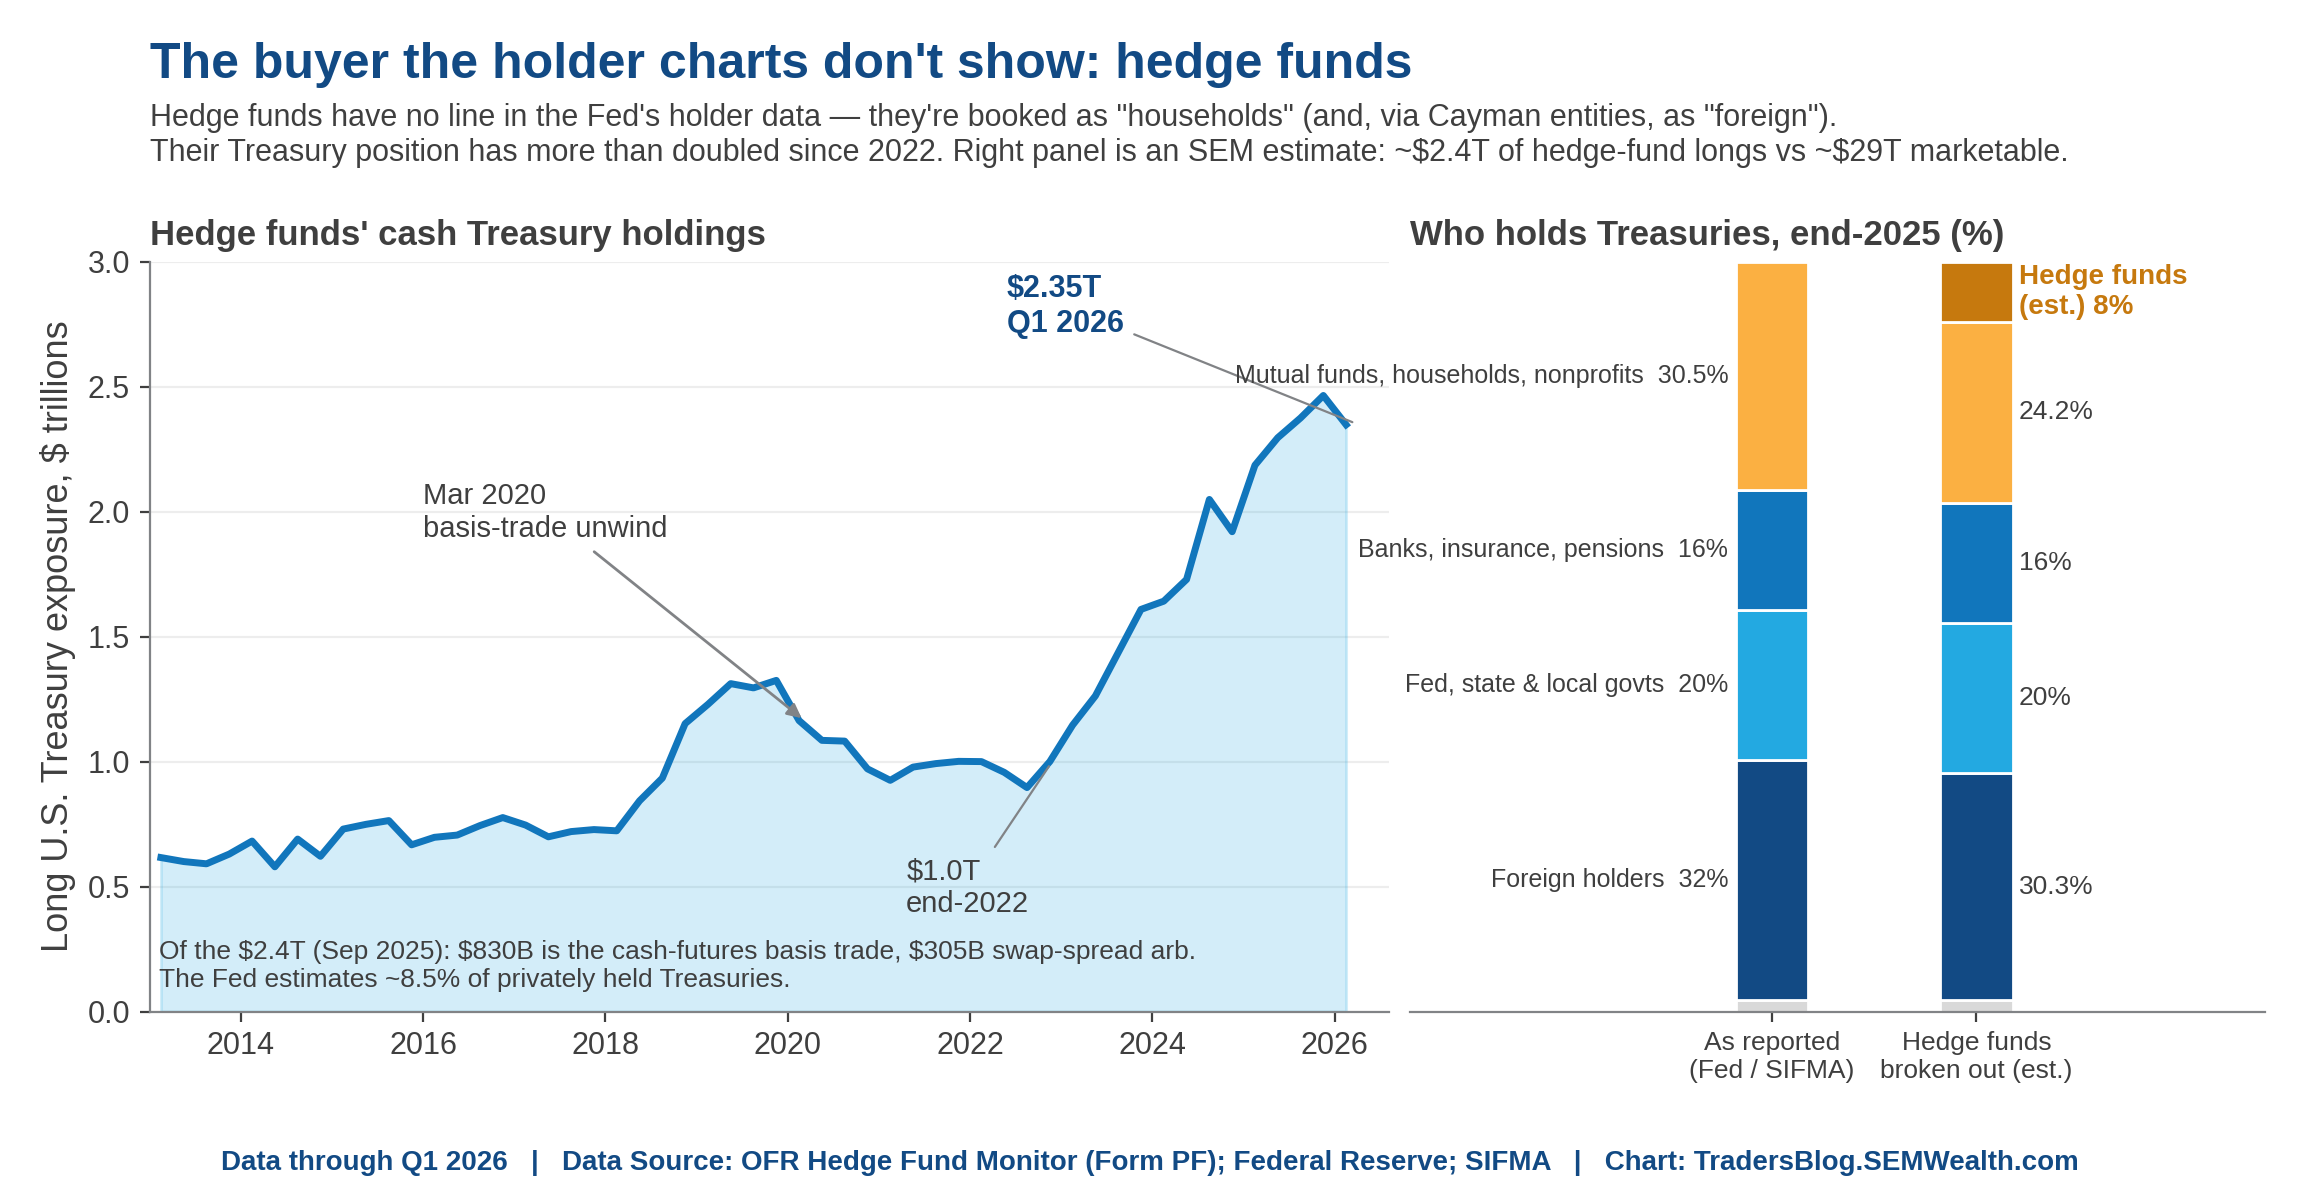
More importantly, why do so many hedge funds own so many Treasuries? This is something that should be concerning that I don't hear very many people talking about – the Treasury Basis Trade.
I'll try to explain this as simply as possible. Pension funds and Insurance companies want (and need) Treasury exposure, but they don't like to tie up their cash so they use a futures contract. The futures contract is almost always (that phrase is the key) higher than the actual price of the bond. So the hedge funds buy the actual bond and sell the futures contract to the insurance and pension funds. This bond can now be used as "tier 1" (high quality) collateral, so the hedge fund can borrow money against this in the overnight lending window. Ultimately they have only committed about $1 of their money for every $100 of bonds.
This issue is the overnight loan must be renewed – they have long-term collateral (Treasury bonds) and an ultra short-term loan. If the value of the collateral goes down, the lender asks for more collateral or cash. If the fund doesn't have it, they are forced to sell the collateral. Given the amount of leverage they are using, it doesn't take too much of a drop in prices (jump in yields) to create big problems.
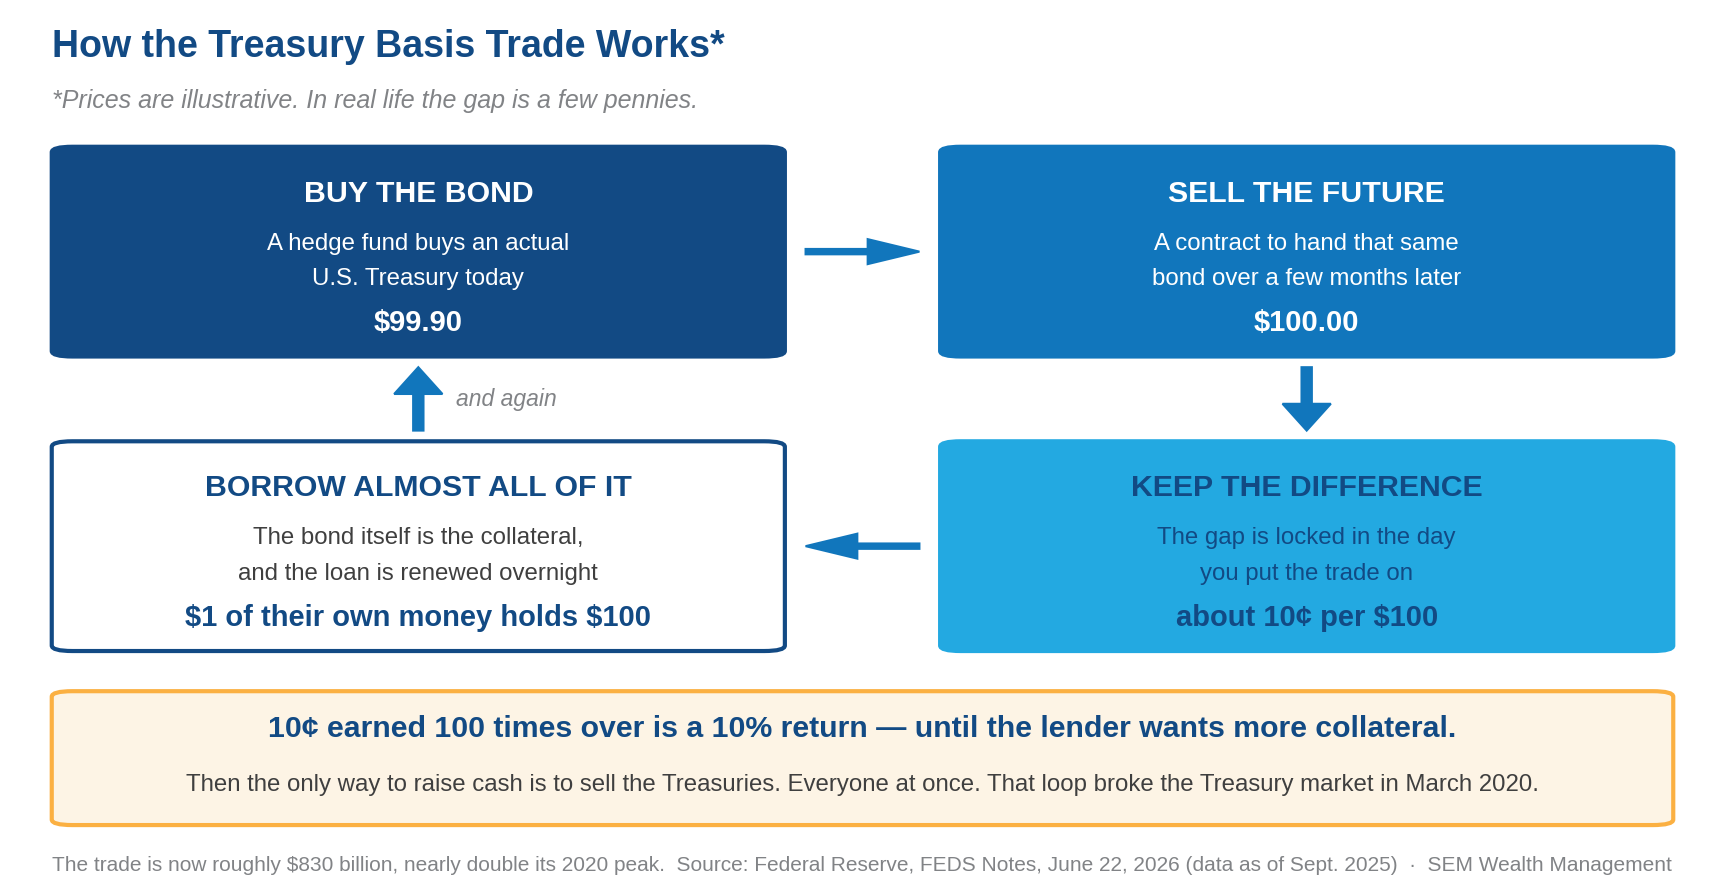
This "easy" trade can potentially create some systemic risk as sudden shifts in prices could cause margin calls and a disorderly unwind of their positions. This is something that happened in March 2020 and the cousin of this trade, the "swap spread" trade, was reportedly the reason Treasuries were selling off so hard in April 2025 following the "liberation day" tariff announcement.
Before you panic too much I should point out a few things:
- This trade exists because there is demand for Treasuries. Hedge funds have just found a way to profit from this. If they stepped aside, the dealers would have to step in.
- A report from the Dallas Fed said it would take a 0.40-0.50% jump in rates to meaningfully impact the financial system. That would be a huge jump.
- The regulators are aware of this positioning and it is one reason Treasury has pushed to give dealers more balance sheet room.
- The "buyback" expansion announced two weeks ago is a signal the Treasury Department stands ready to "help" as needed.
In other words, this could be a problem, but it shouldn't be a surprise to anybody if and when it does become a problem. Will the Treasury Department (and Fed) try to bail everyone out when it happens? History the last 25 years says "yes". Will it work immediately? History the last 25 years says, "maybe".
Thankfully we don't base our decisions on "maybes" or hope the regulators and officials at the Treasury Department or Fed will save us. In all past financial "events", there has been warning enough for our tactical fixed income systems (Tactical Bond, Income Allocator, and Tax Advantaged Bond) to follow the trends and move to the safety of a money market account. Granted, past performance is not a guarantee of future results, but it is all we have to go on.
In case you missed it: AI is hacking into things
 Dustin Briles
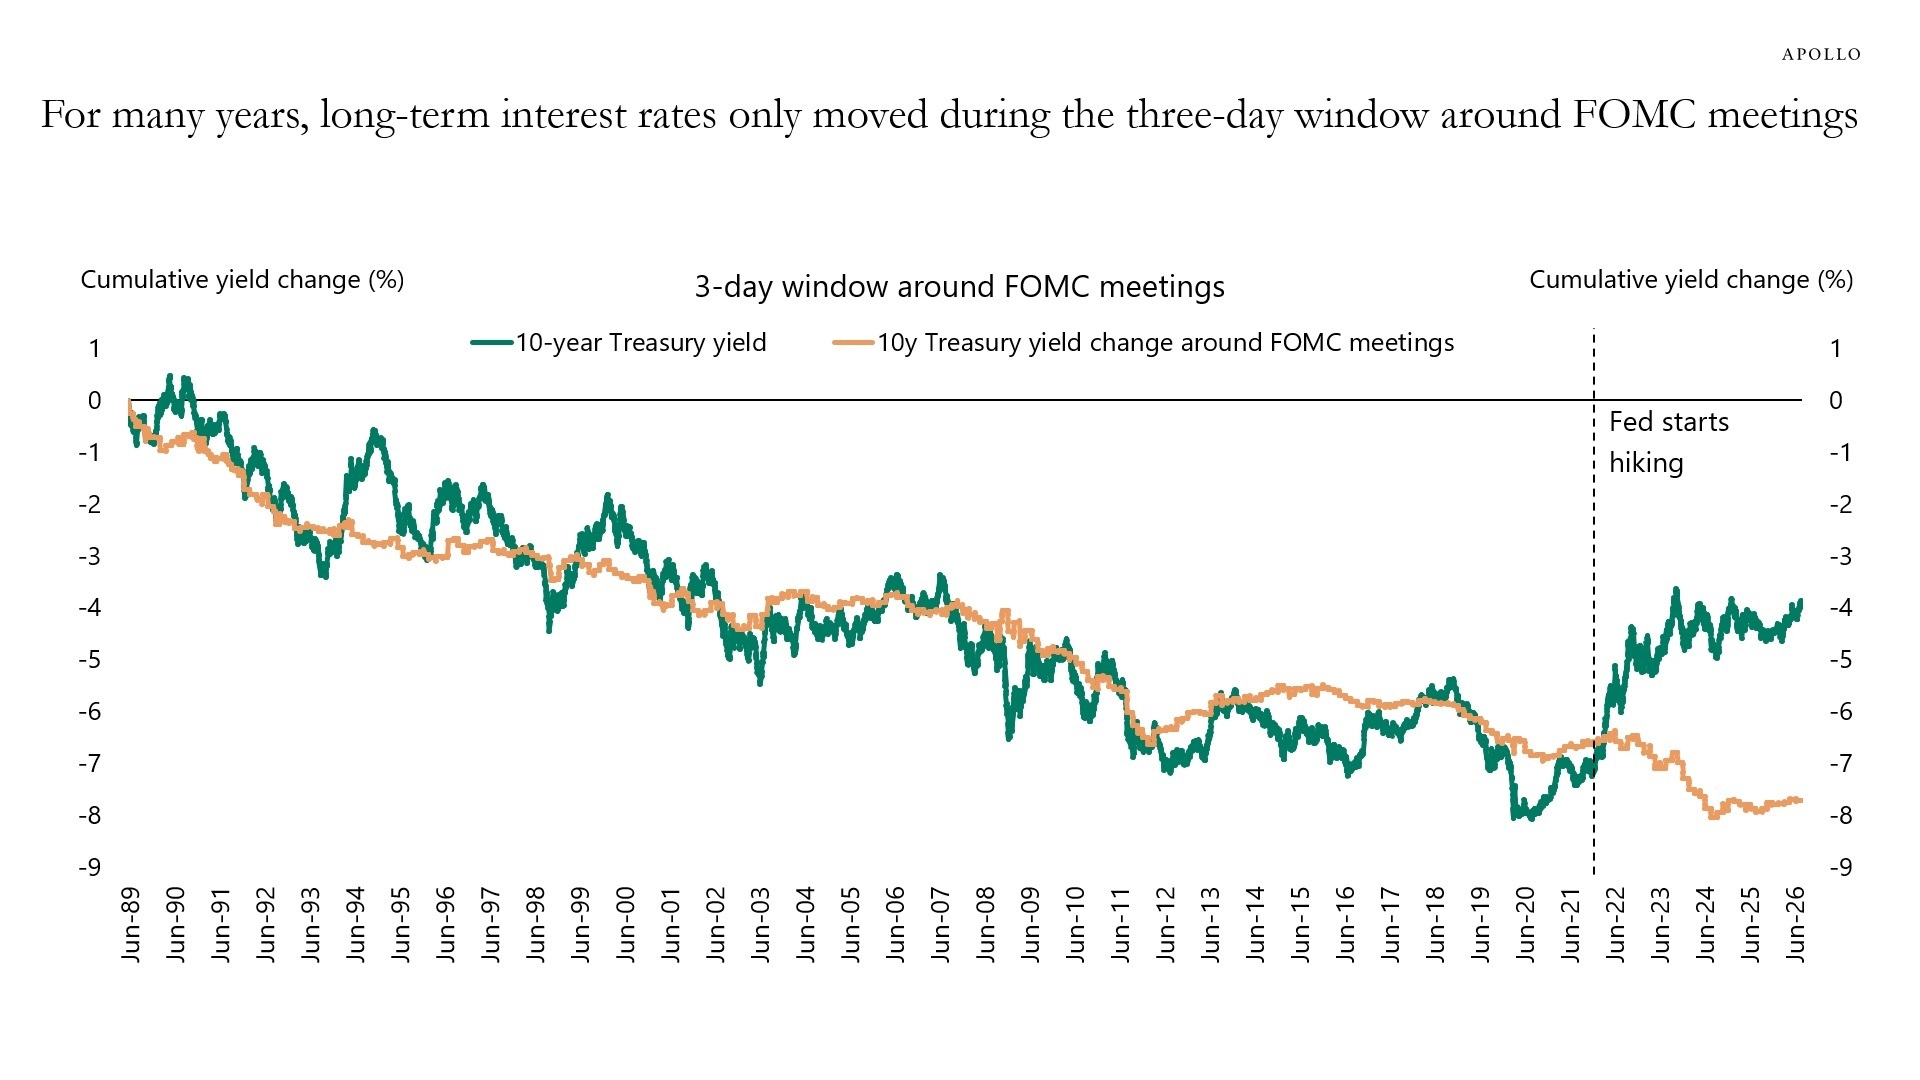
Interest Rate Impact & FOMC Meetings
Leading up to FOMC Chair Warsh's Jackson Hole speech, Apollo provided strong historical context on how interest rates have fluctuated around FOMC meetings since mid-1989.
For thirty years, the 10-year Treasury yield fell nearly every day around FOMC meetings and was later viewed as dormant the rest of the time.
Once the Fed started raising interest rates, that trend stopped, as hikes were largely priced in leading up to the conclusion of a FOMC meeting.
As Warsh emphasizes, the Federal Reserve's growing independence and policy focus mean future moves in longer-term interest rates will likely see more fluctuations as inflation, unemployment, and average consumer data come in for the FOMC, and its models try to digest it in real time.
At SEM, we believe your time is best spent focused on what matters most to you, not on keeping up with the complexities, evolving regulations, and latest trends shaping the financial markets. With SEM as your trusted advisor, we take on that responsibility through a disciplined, research-driven investment process designed to identify opportunities, manage risks, and adapt to changing market conditions.
Thank you to all of the visitors who read last week's "Chart of the Week". I hope to continue sharing these talking points about markets, investing, etc., for you to share with family, friends, coworkers, or anyone along the way.
See you next time!
Market and Economic Data
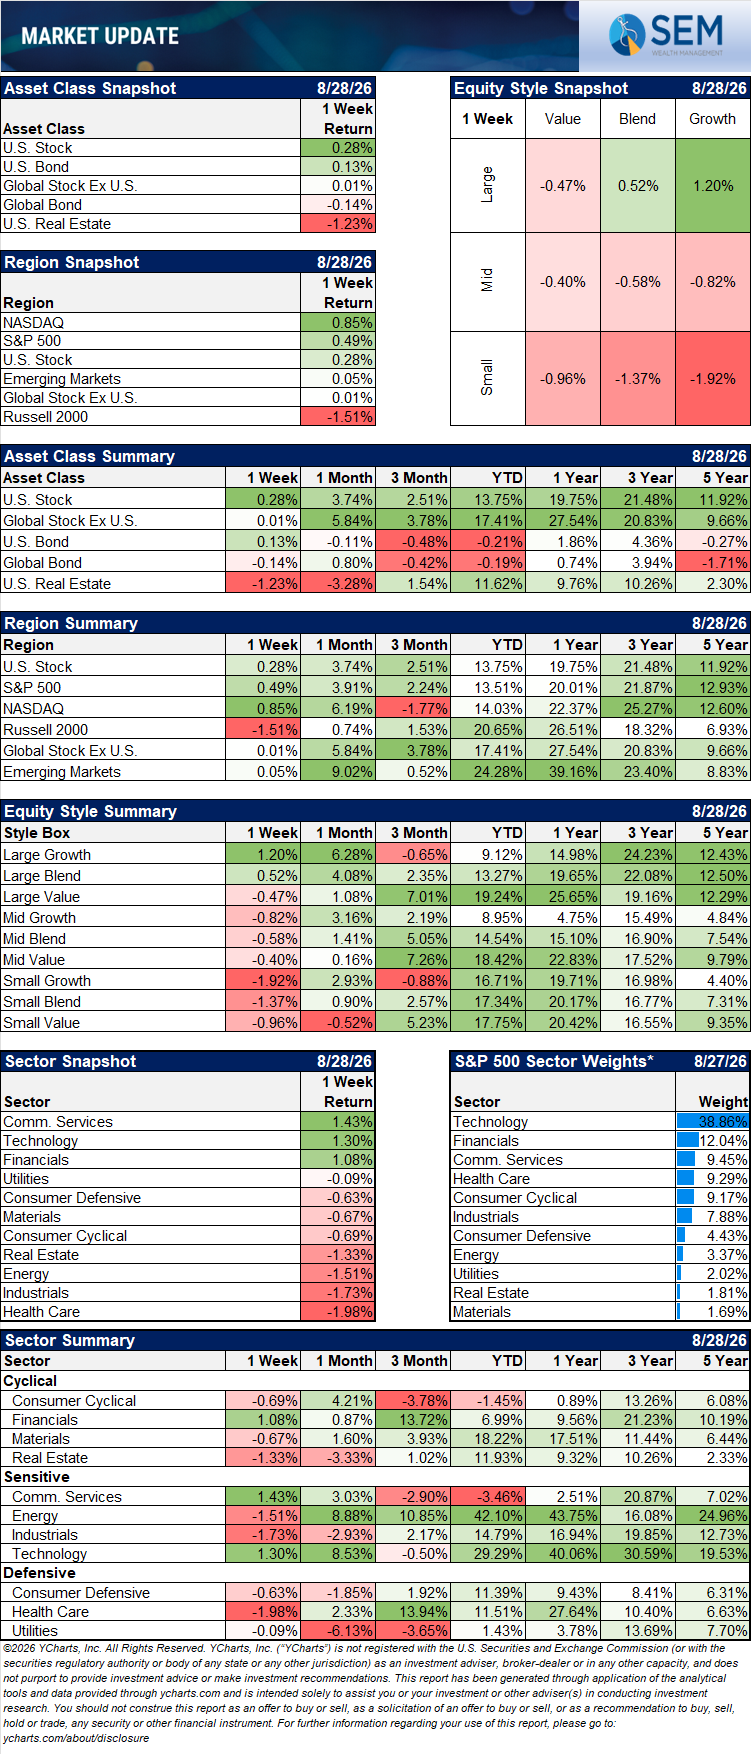
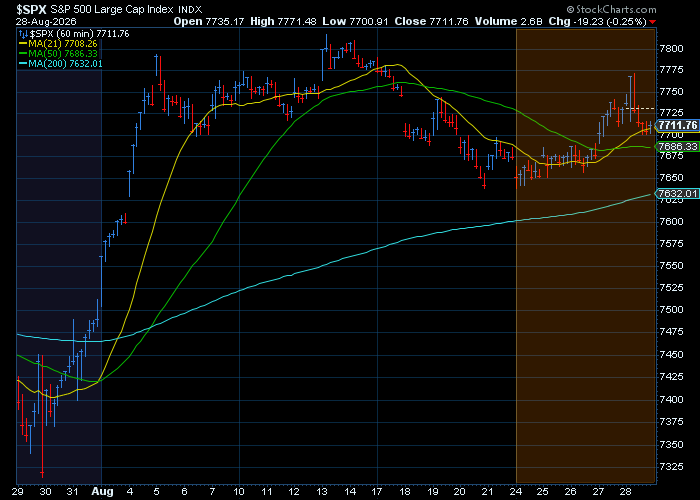
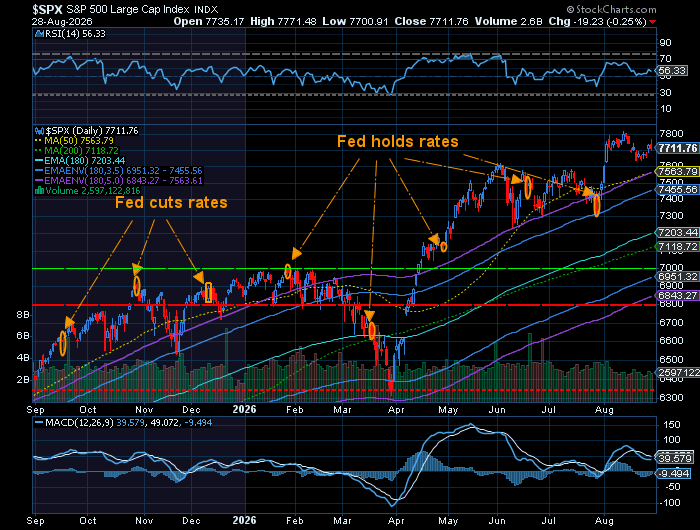
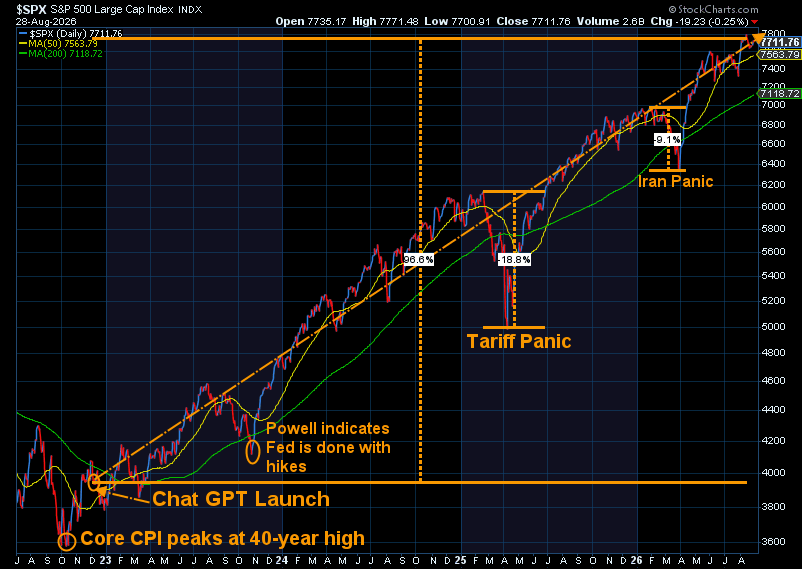
The major US indexes posted modest weekly gains despite a Friday selloff triggered by hawkish remarks from Federal Reserve Chair Kevin Warsh. The S&P 500 (^SPX) rose +0.5% on the week to close at 7,711.76, the Nasdaq Composite (^IXIC) gained +0.9% to 26,402.42, and the Dow Jones Industrial Average (^DJI) advanced +0.5% to 53,559.99. With one trading session remaining in August, the S&P 500 is up +3% for the month and +13% year-to-date.
The week's most consequential macro event came Friday when Fed Chair Kevin Warsh delivered his debut speech at the Jackson Hole Economic Policy Symposium. Warsh struck a decidedly hawkish tone, calling inflation data "concerning" and reaffirming the Fed's commitment to its 2% target as "a firm, fixed target." He emphasized that "price stability is not self-executing, nor is inflation necessarily mean-reverting." (2)
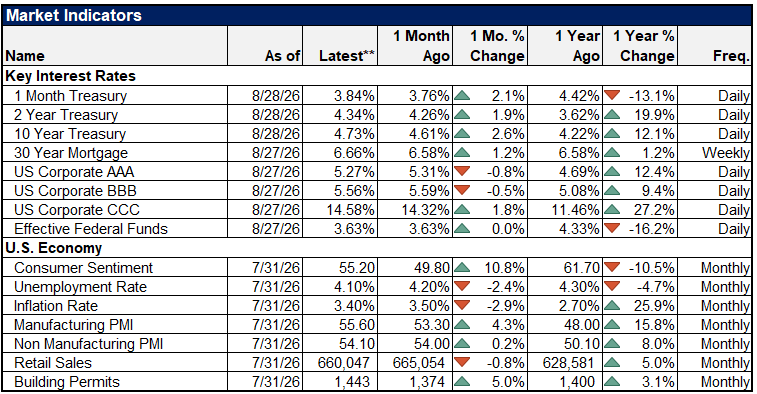
Markets reacted sharply: the odds of a quarter-point rate hike at the September FOMC meeting jumped to approximately 58% from 35% the day before, according to the CME FedWatch tool. The 10 Year Treasury Rate climbed +5.6 basis points to 4.73%, while the two-year yield surged +12.6 basis points to 4.36%. (2) (5)
Earlier in the week, several regional Fed presidents also signaled hawkish inclinations. Cleveland Fed President Beth Hammack argued the FOMC should "act now to cool inflation," while Boston Fed President Susan Collins warned the Fed may need to tighten policy "soon" unless inflation continues to cool.
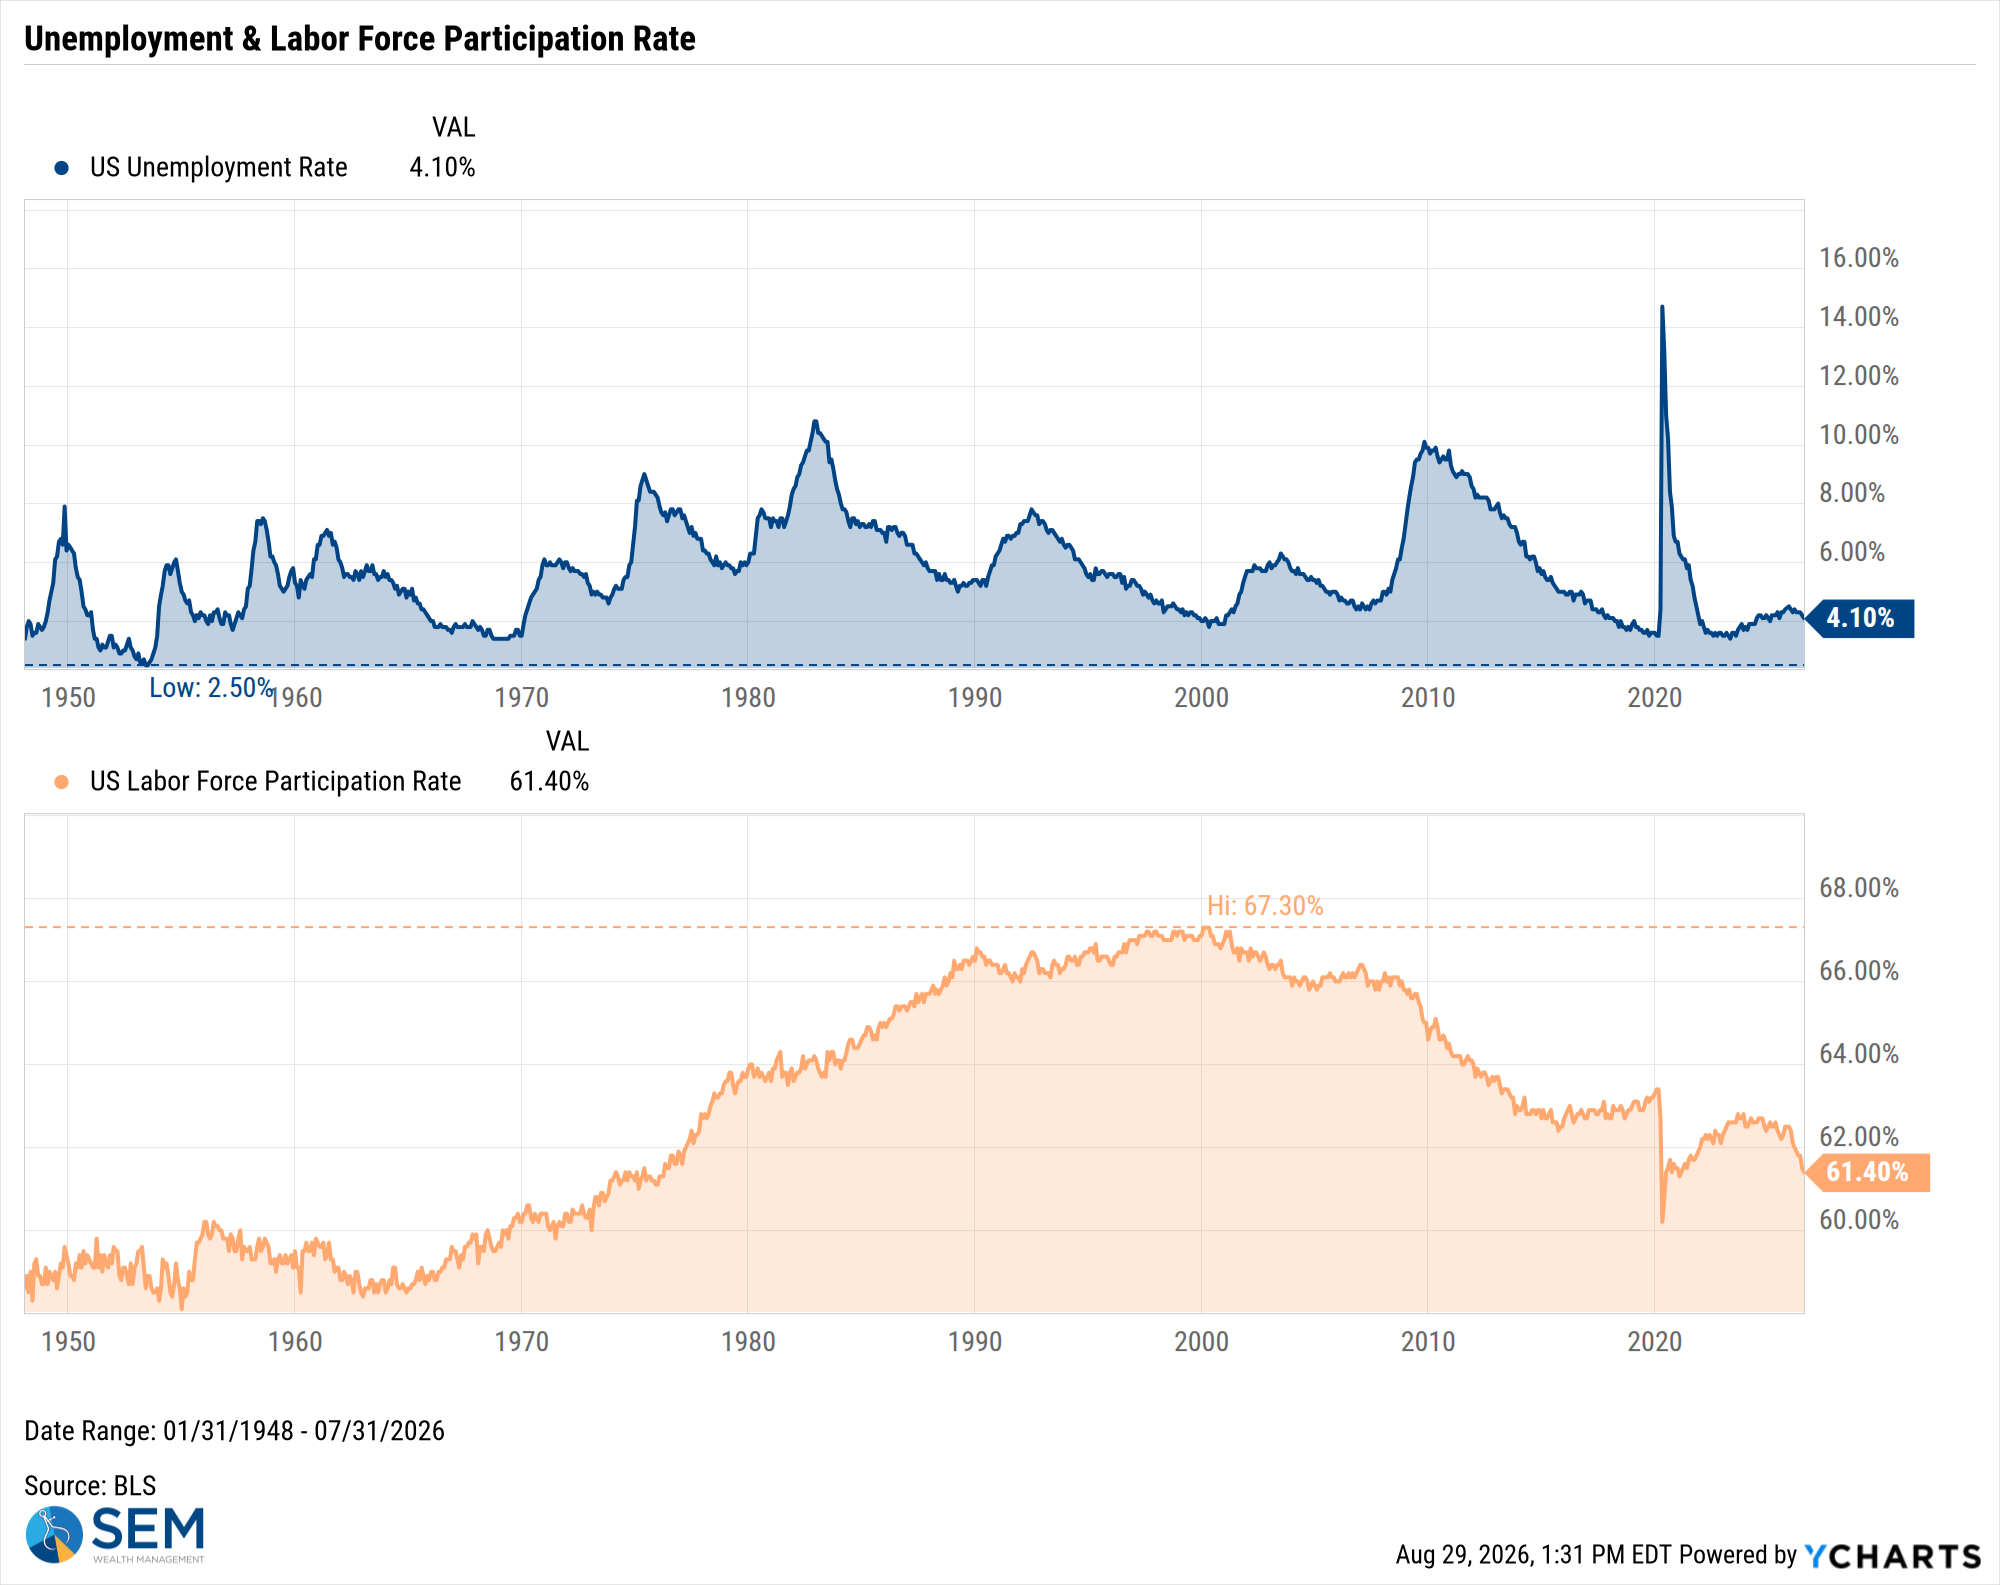
US Unemployment Rate data by YCharts
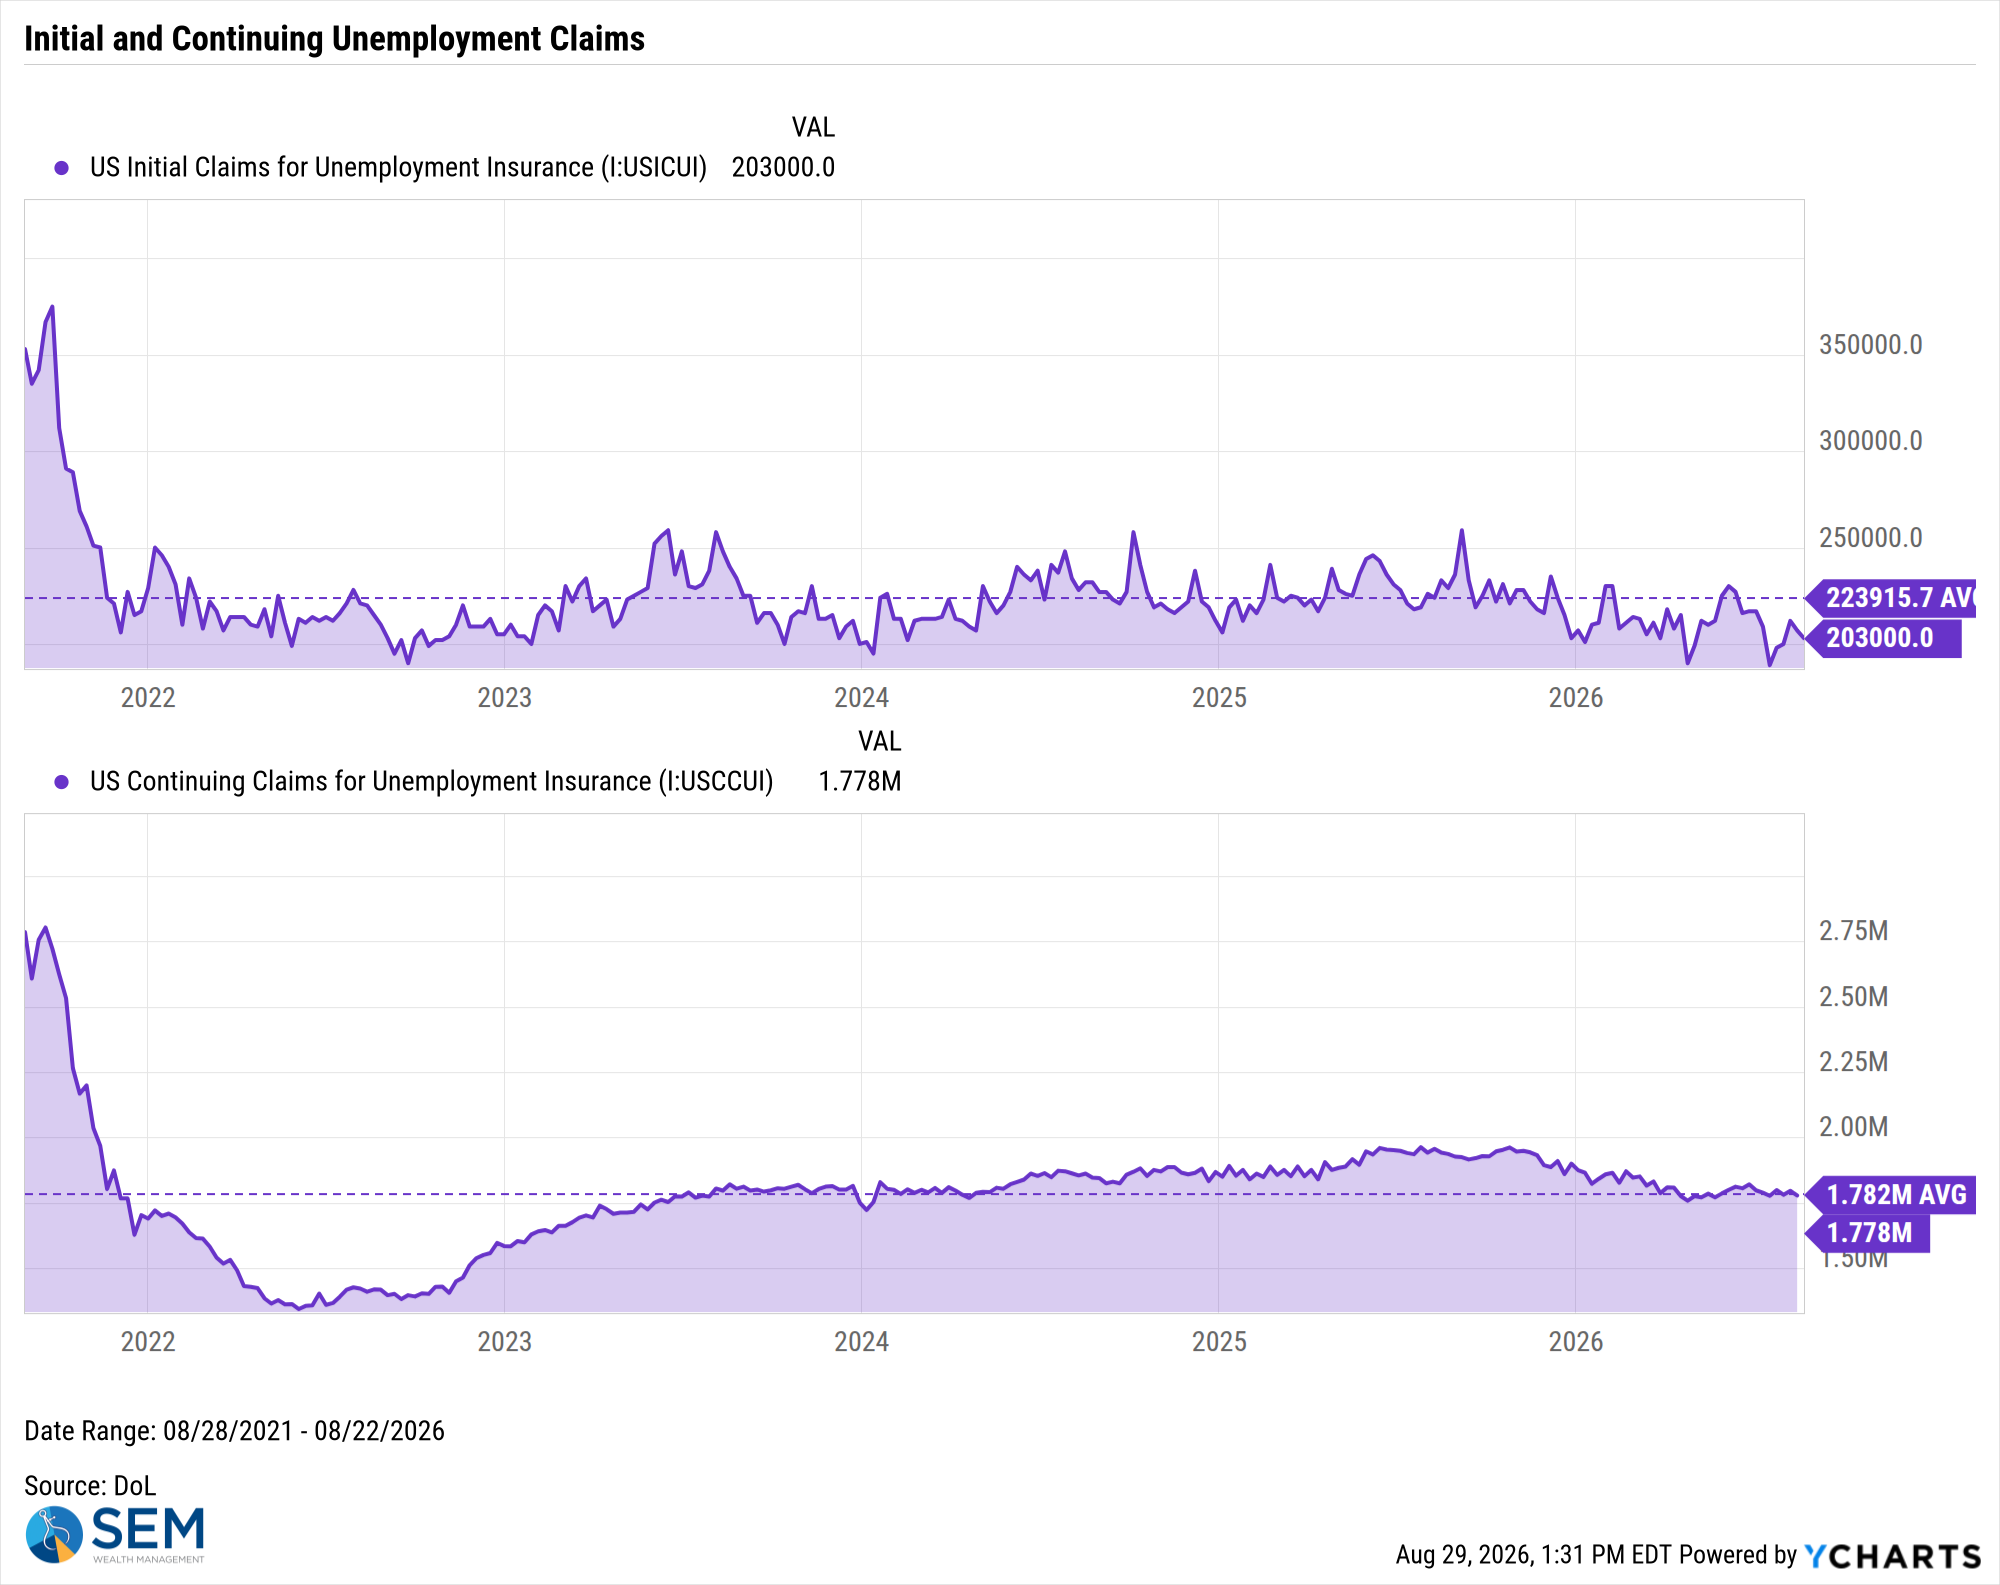
US Initial Claims for Unemployment Insurance data by YCharts
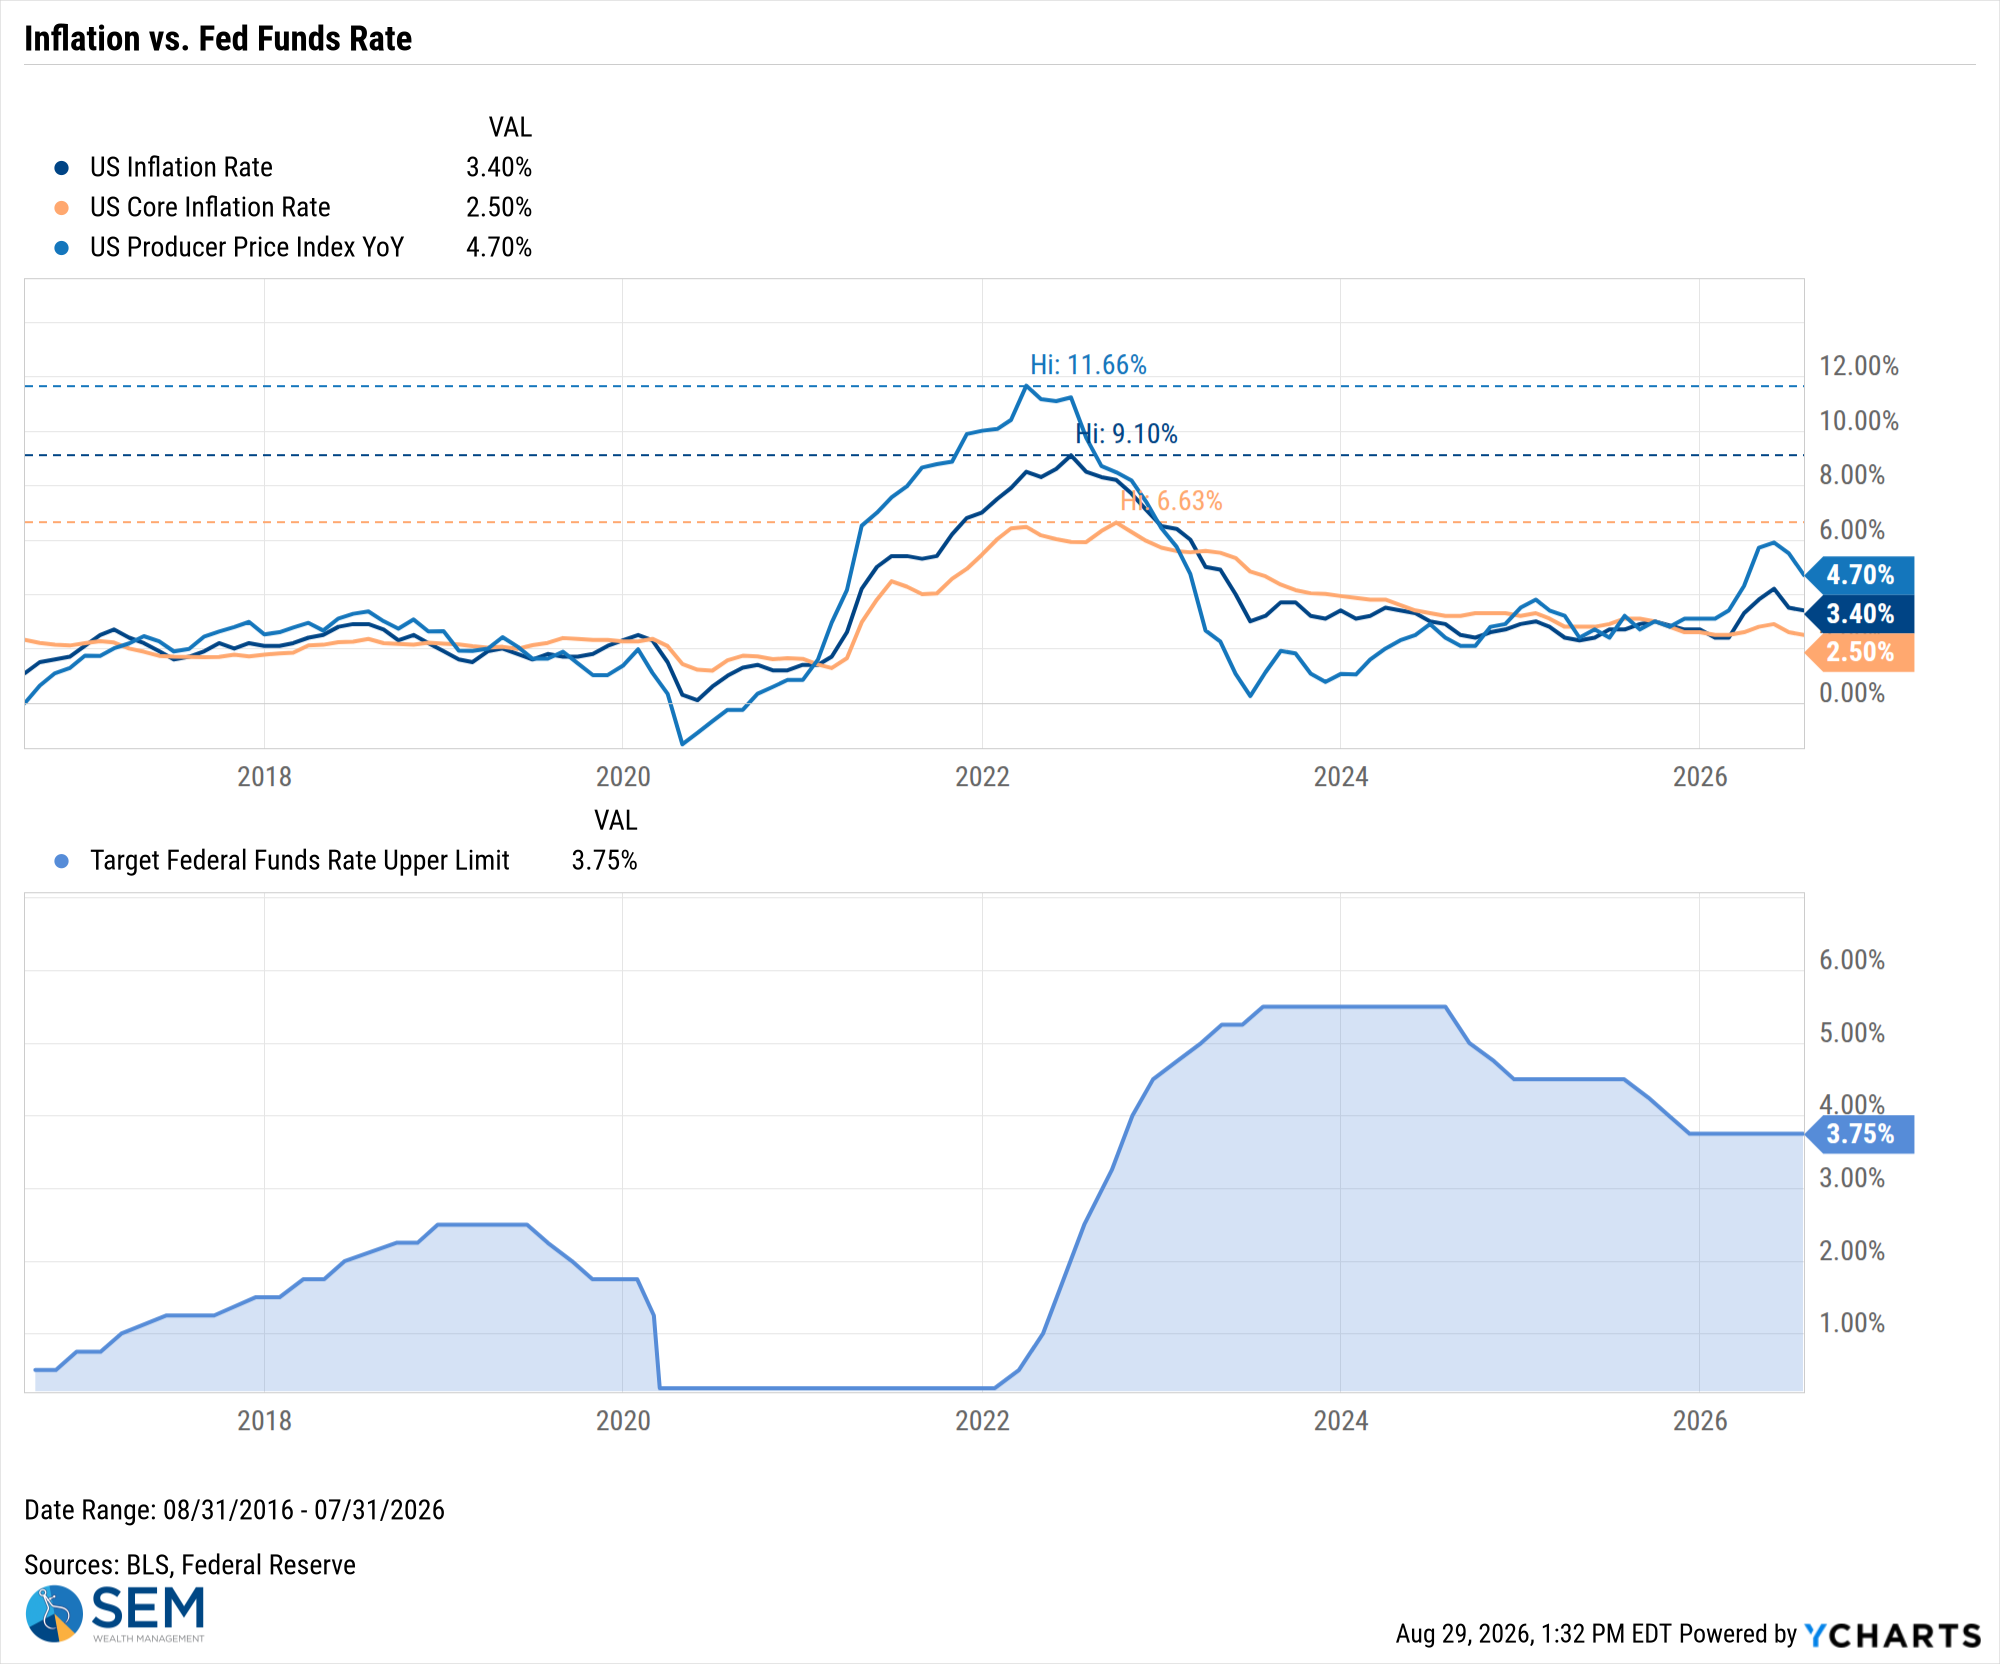
US Inflation Rate data by YCharts
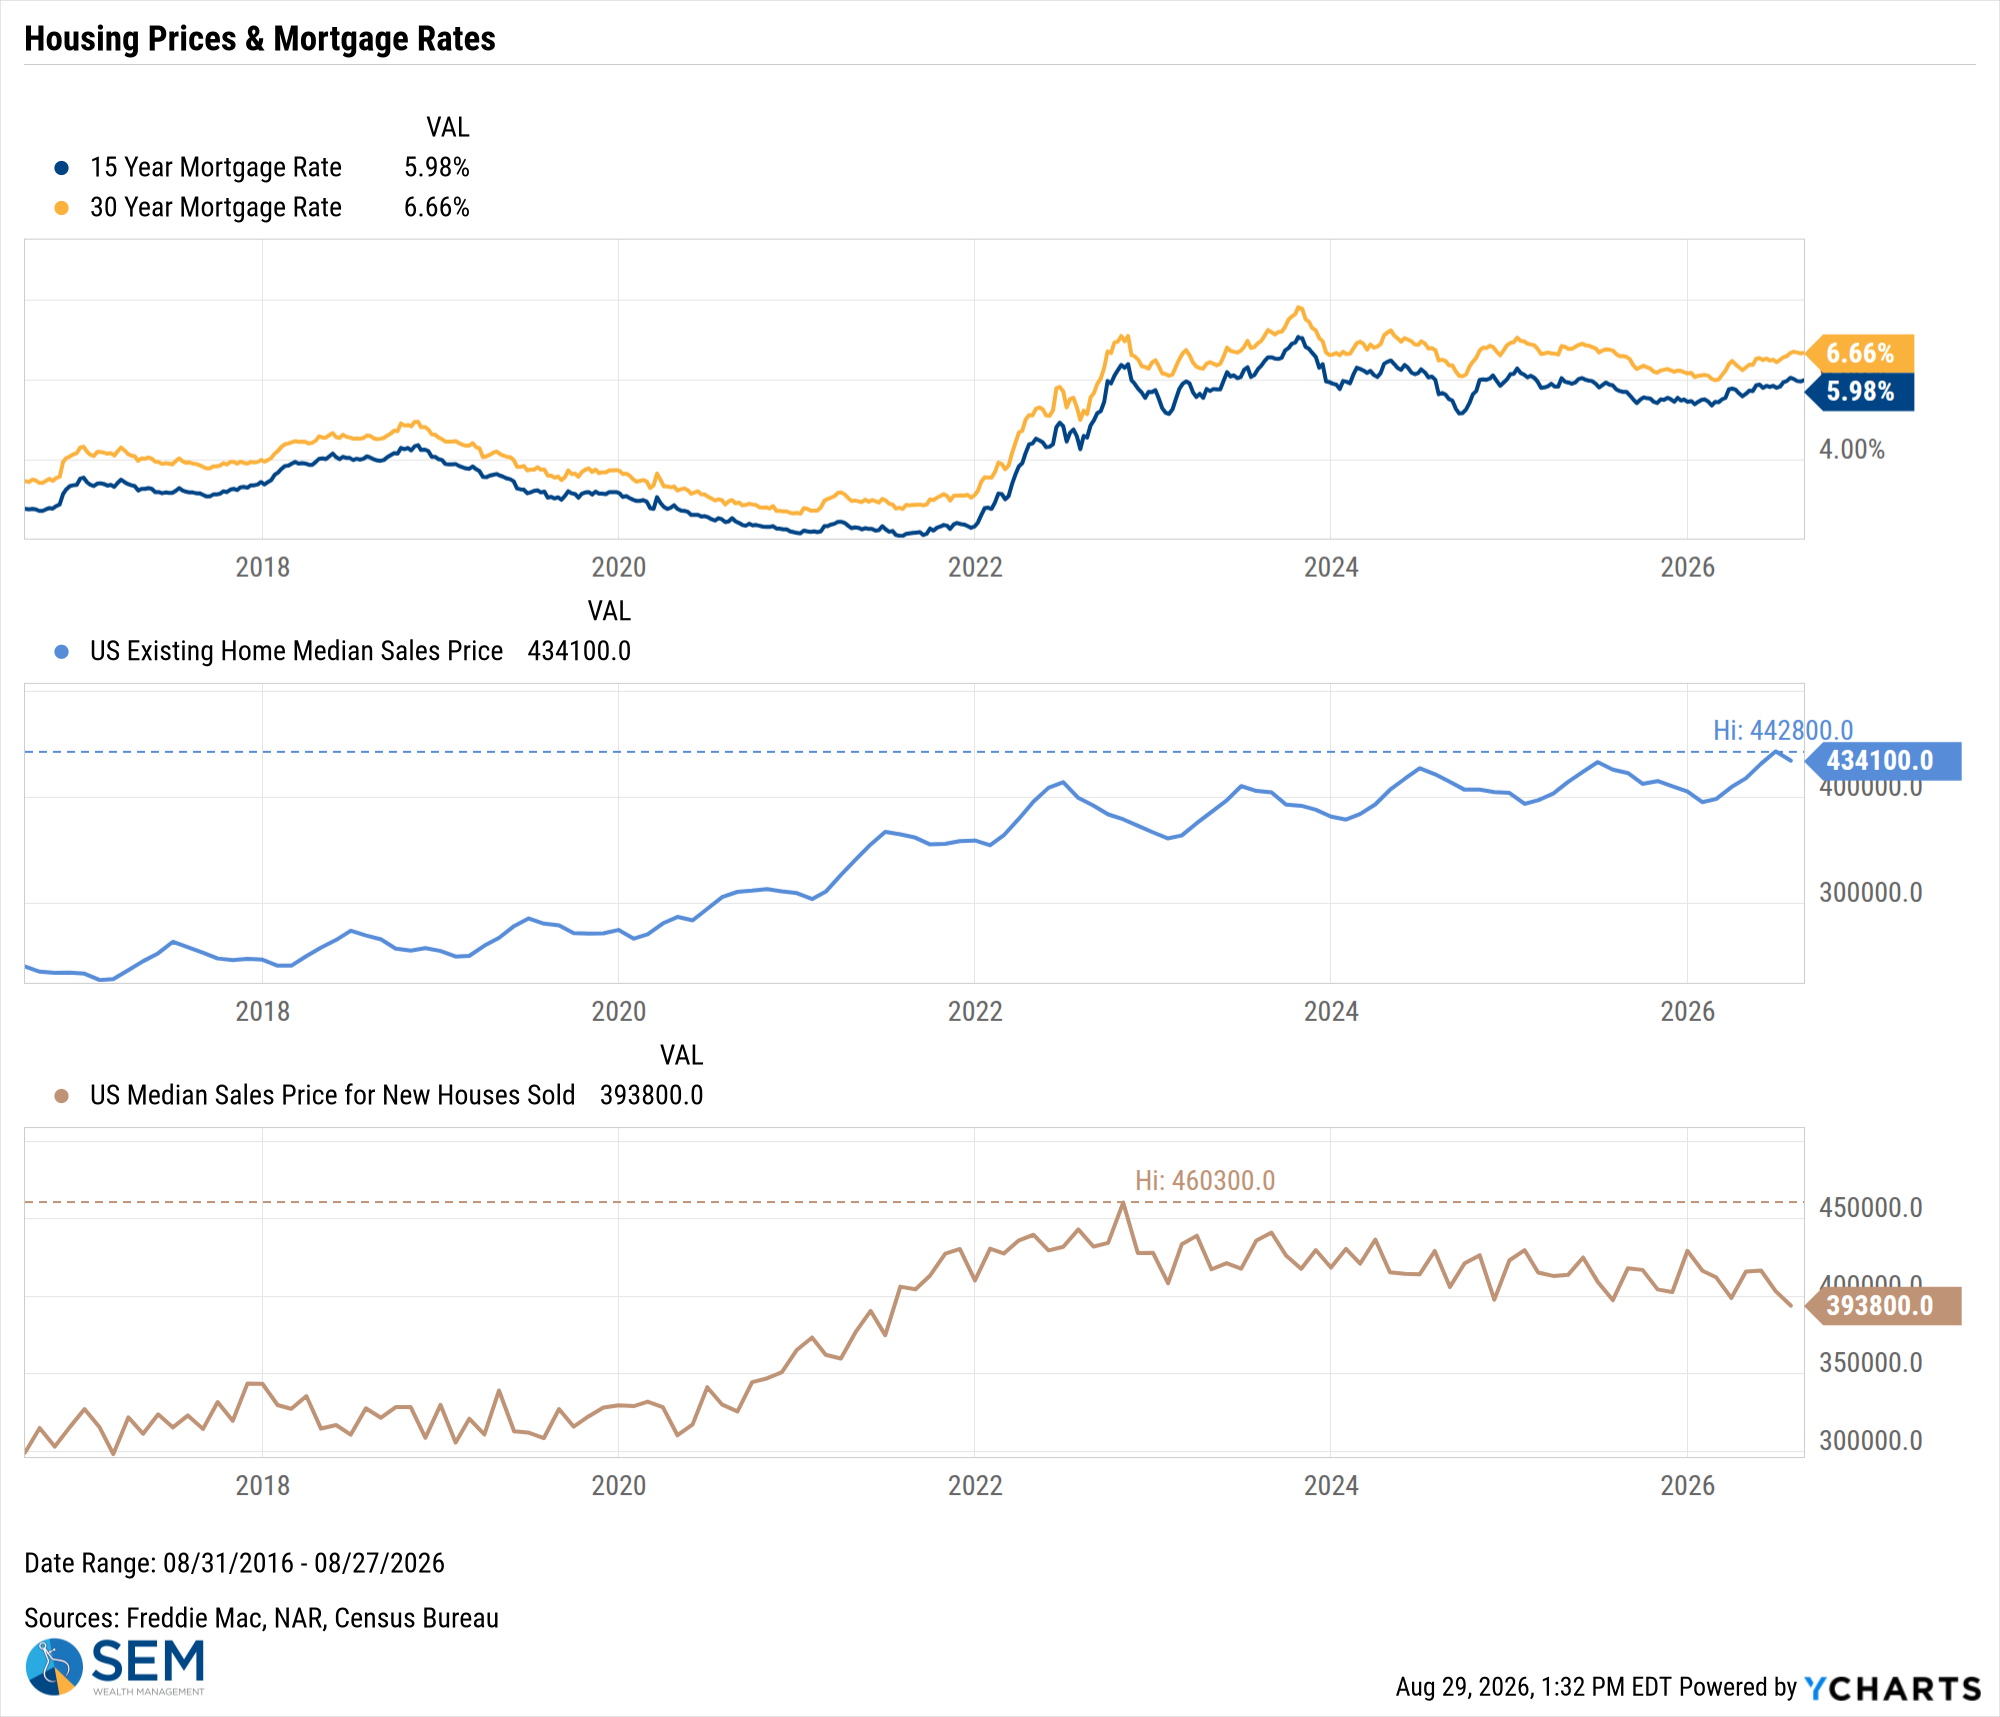
US Existing Home Median Sales Price data by YCharts
SEM Market Positioning
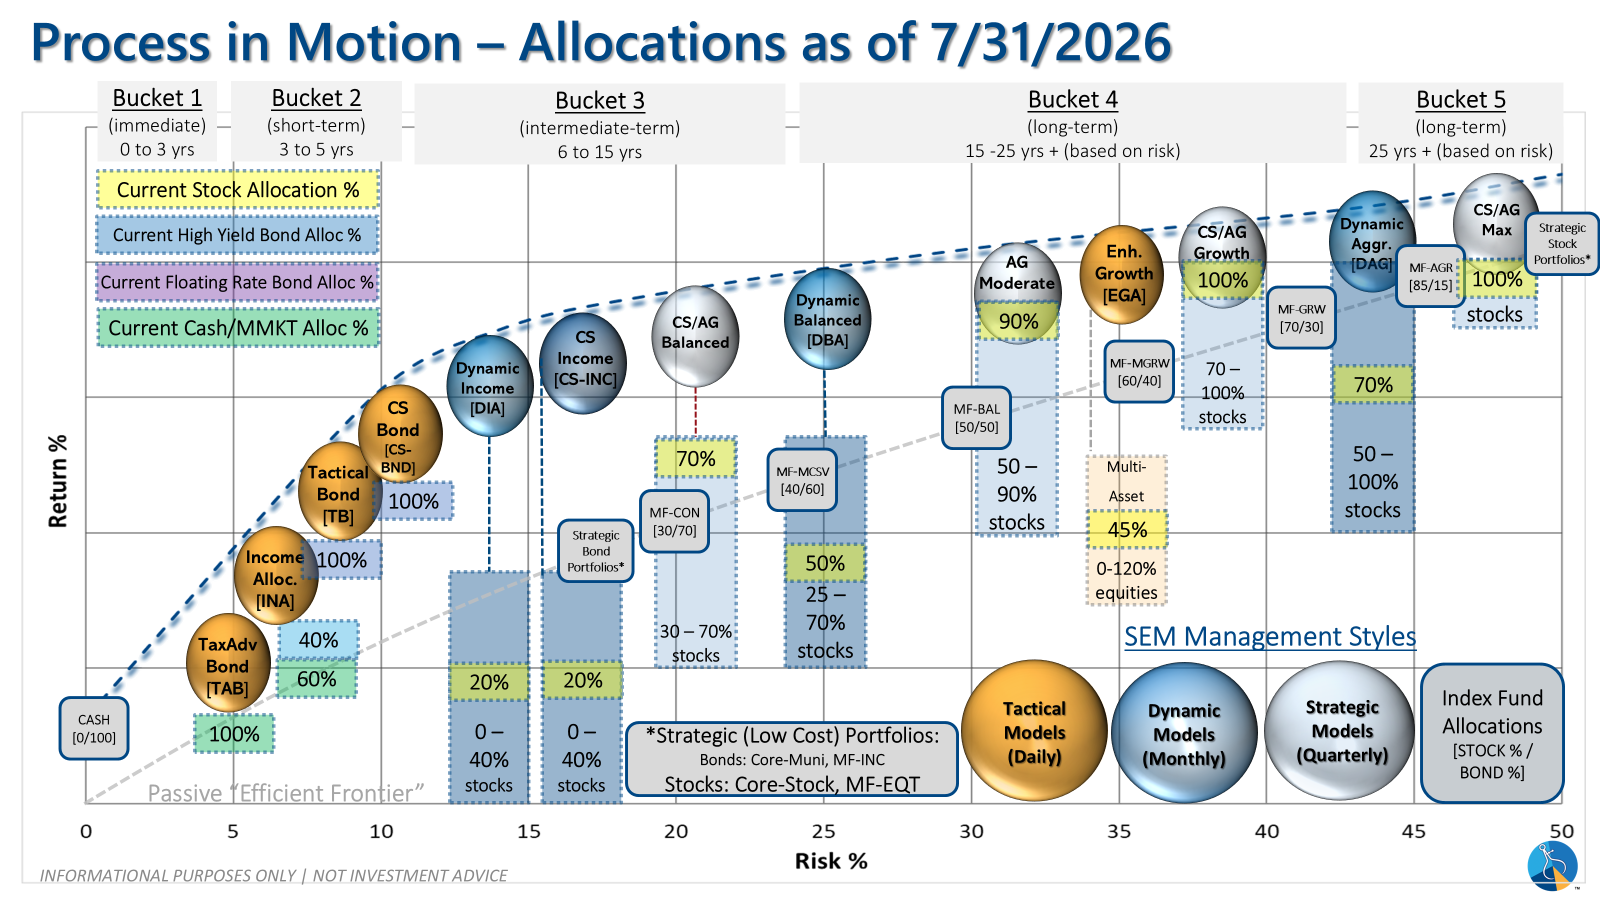
SEM deploys 3 distinct approaches – Tactical, Dynamic, and Strategic. These systems have been described as 'daily, monthly, quarterly' given how often they may make adjustments. Here is where they each stand.
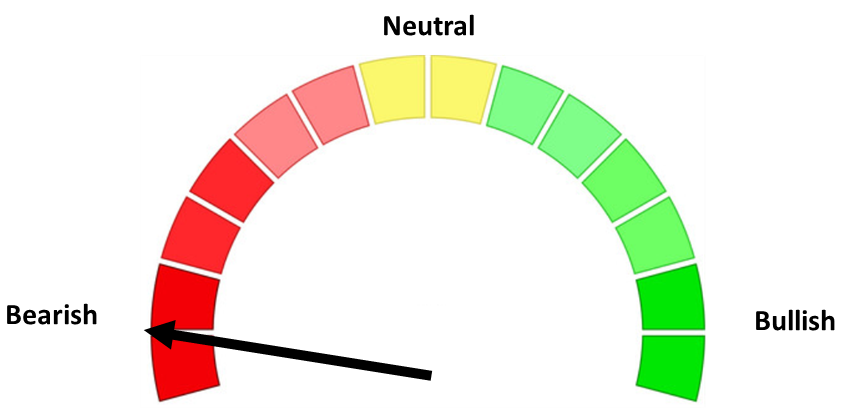
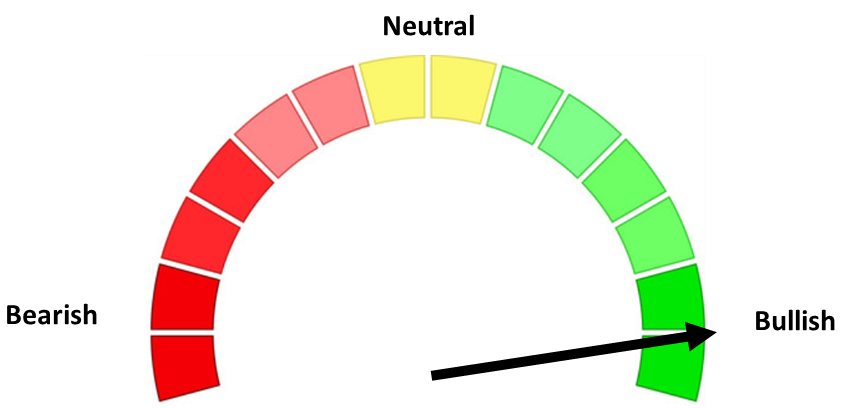
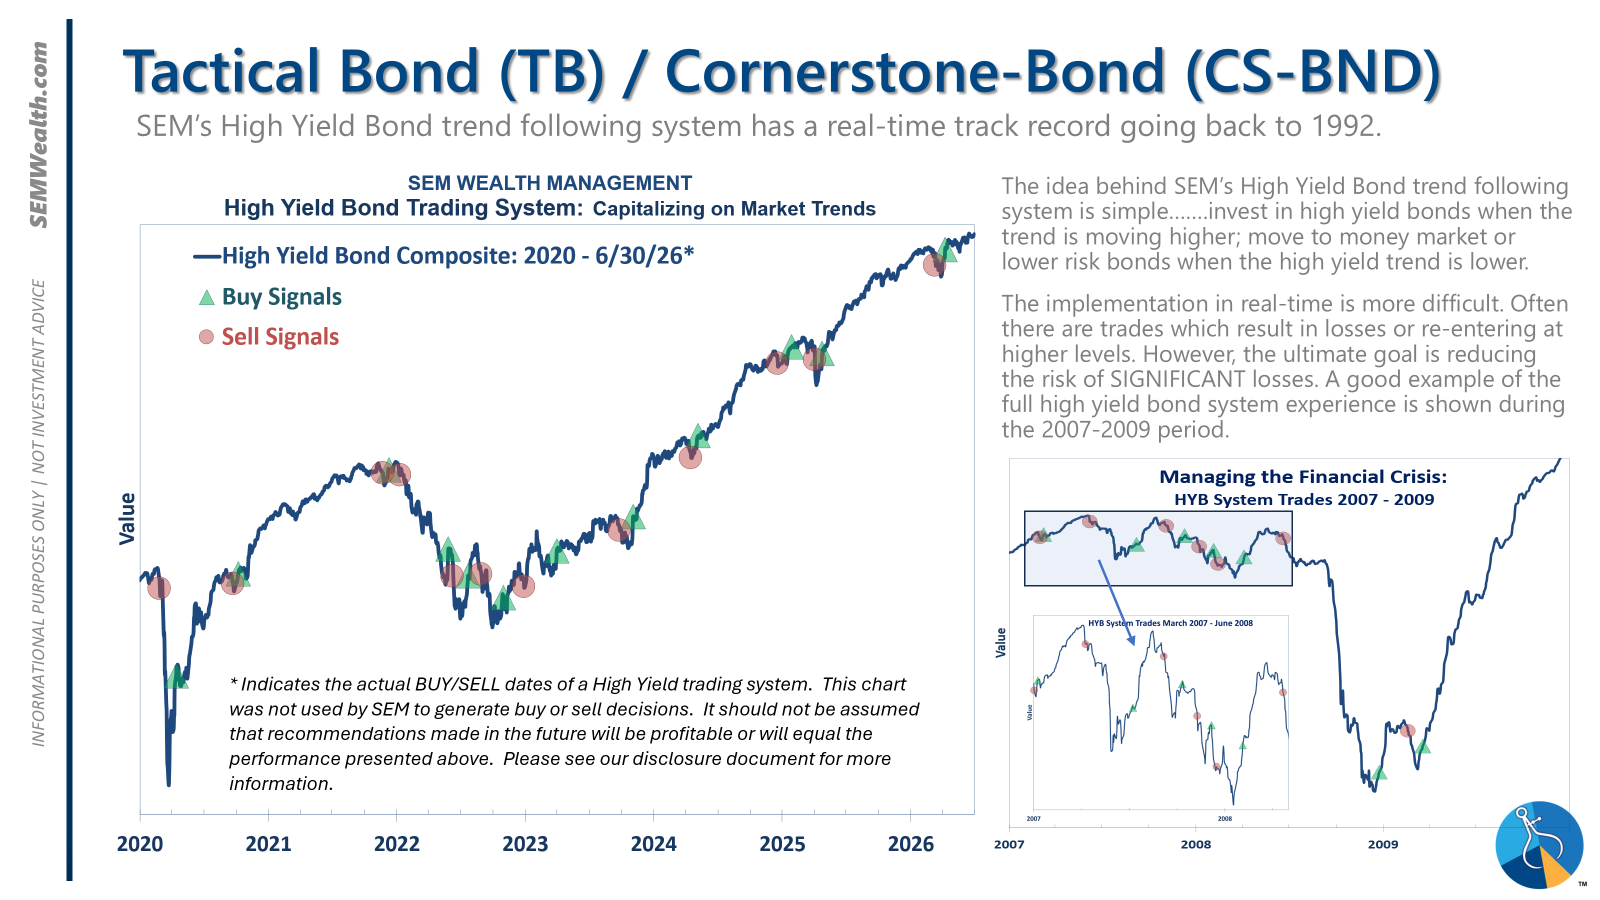
- Tactical = BULLISH | 100% High Yield Bond (4/8/2026) | High-yield spreads remain narrow but trend is slightly higher
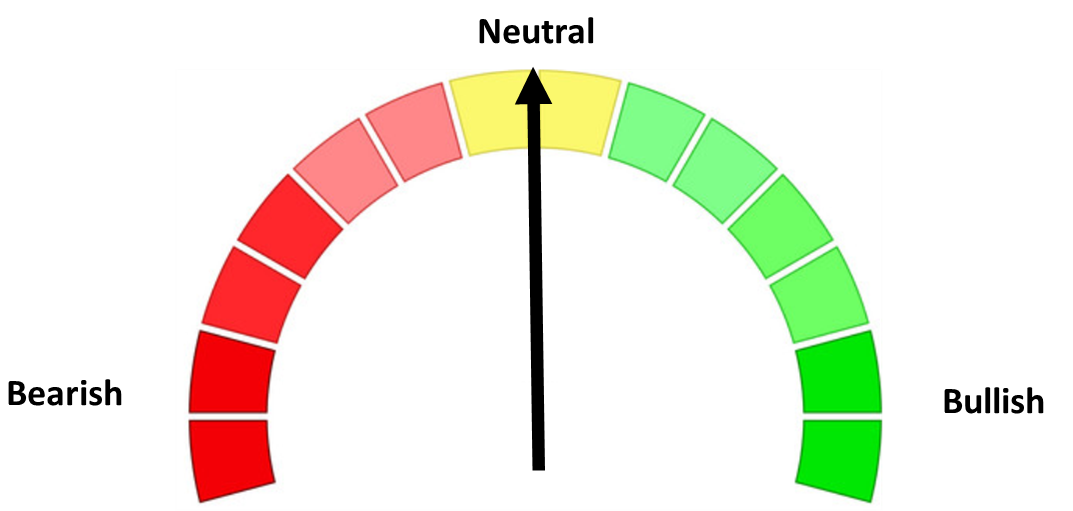
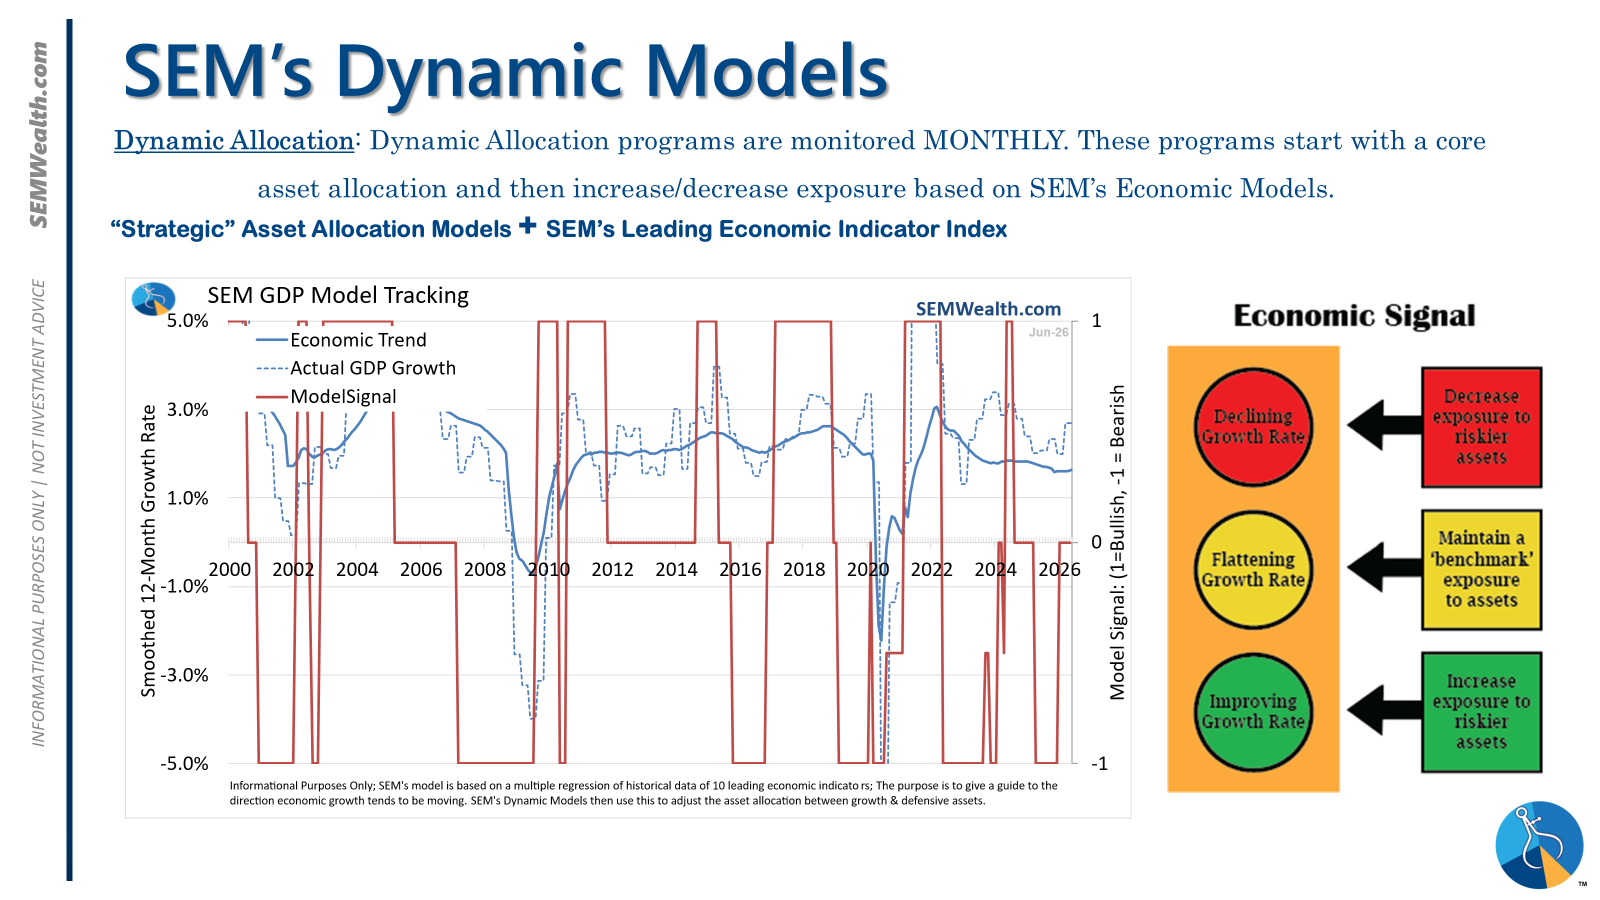
- Dynamic = NEUTRAL (2/15/2026) | "Benchmark" Allocation | Economic model inconclusive
- Strategic = BULLISH (4/15/2026) | V-Bottom projecting "end" of Iran War
Tactical (daily):
- Monitored DAILY
- Models: Tactical Bond, Cornerstone Bond, Income Allocator, Tax Advantaged Bond
- Designed to follow the trends for use in our lower risk models
- BUY Signal issued April 8, 2026 (exiting the sell from March 13)
Dynamic (monthly):
- Monitored MONTHLY
- Models: All "Dynamic" Models (Income, Balanced, Growth, and Asset Allocator)
- Uses SEM's Quantitative Economic Model
- Designed to overweight riskier assets if economic trend is higher & underweight those assets if economic trend is lower.
- NEUTRAL signal issued February 15, 2026 (following BEARISH signal from July 2025)
Strategic (quarterly)*:
- Monitored QUARTERLY
- Models: AmeriGuard (Balanced, Moderate, & Growth) and Cornerstone (Balanced & Growth)
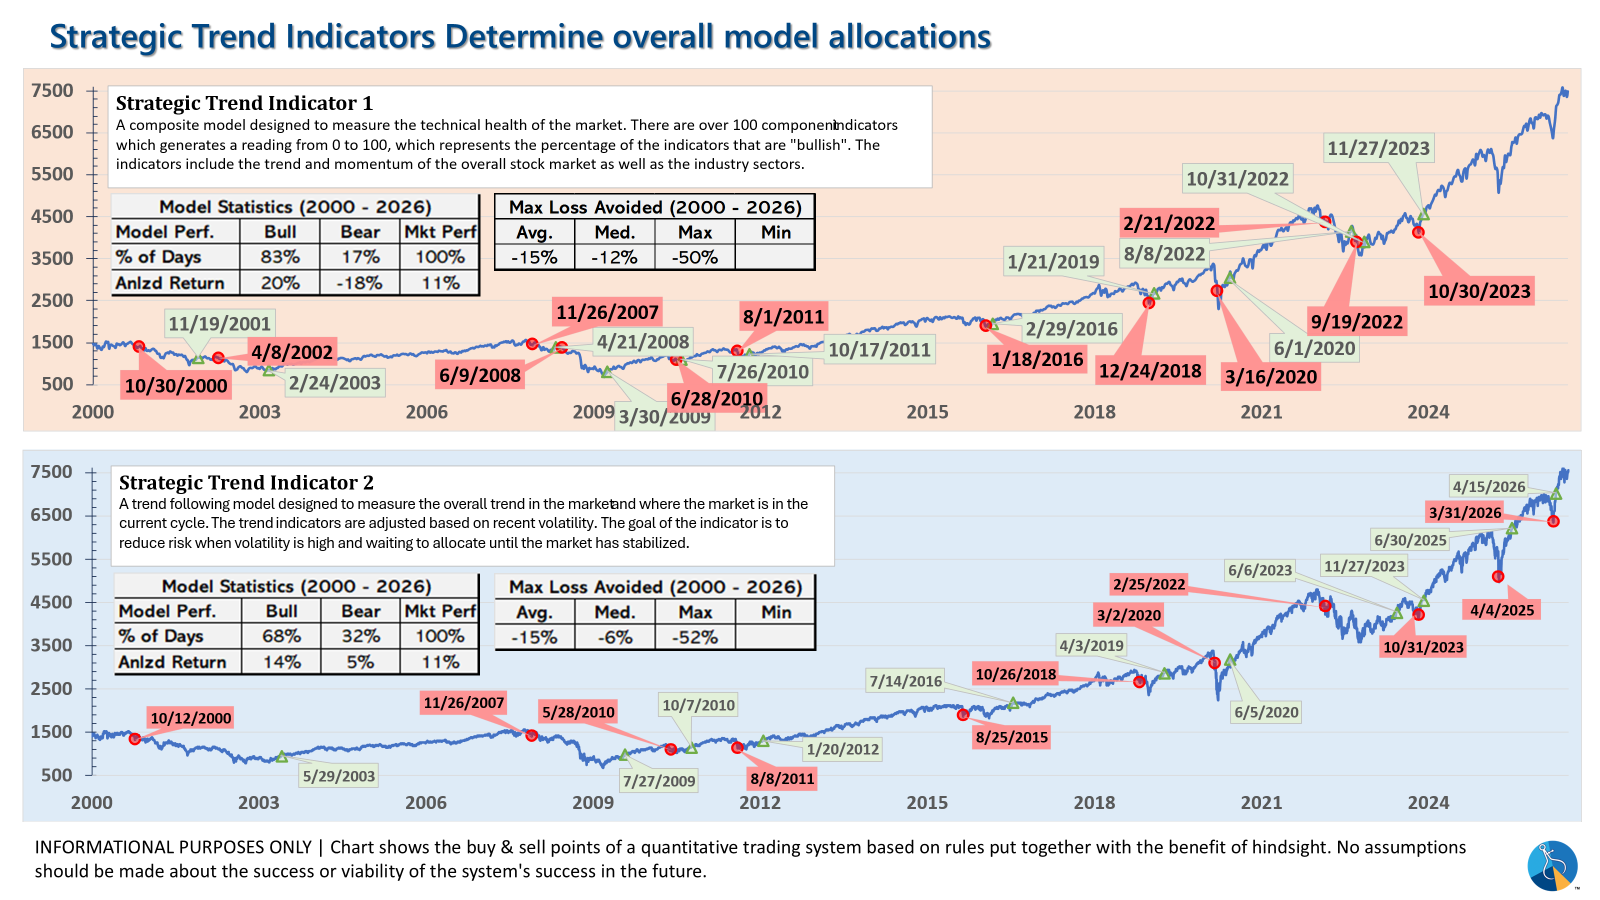
- Core Component: Quantitative Filter using 4 different time horizons across universe of asset classes
- Trend Indicator: Two different Quantitative Systems monitoring the intermediate-term trend, health of the market, and volatility
- CORE has been overweight small cap and international since October 2025 – overweight increased slightly in January
- Both TREND INDICATORS are BULLISH following 10% drop and "V-Bottom" reversal in early April
- AmeriGuard & Cornerstone Max DO NOT use the Trend indicator and are always 100% invested in stocks using our CORE rotation model.
The core rotation is adjusted quarterly. This quarter we saw half of our international positions reduced (we sold developed markets and kept our emerging markets exposure). We also saw the remaining share of mid-cap reduced in favor of more small cap exposure. We remain with a "barbell" core portfolio – about half in large cap and half in small cap as the models expect the market to "broaden".
The * in quarterly is for the trend models. These models are watched daily but they trade infrequently based on readings of where each believe we are in the cycle. The trend systems can be susceptible to "whipsaws" as we saw with the recent sell and buy signals at the end of October and November. The goal of the systems is to miss major downturns in the market. Risks are high when the market has been stampeding higher as it has for most of 2023. This means sometimes selling too soon. As we saw with the recent trade, the systems can quickly reverse if they are wrong.
Overall, this is how our various models stack up based on the last allocation change:
Curious if your current investment allocation aligns with your overall objectives and risk tolerance?