Last week I was at an advisor conference. While I was there to speak that afternoon on AI, I arrived early enough to sit at SEM's table during the "speed dating" session. (It's officially called roundtables, but you have 8 minutes to give your message and then repeat it 10 more times.) Rather than being a commercial for SEM, we instead let it be a rapid fire market update for the advisors. We started off each "date" with a question – what concerns have your clients been raising lately.
Each session included something different, but mostly the same list. I took notes and will go through the key topics today, but first, I want to lead with what I hope will be a more frequent feature (we don't have a name for it yet). Cody, our Client Portfolio Manager has always enjoyed following politics. As you might expect from somebody with an analytical brain, he focuses more on the data, the big picture, and what we should be watching. As he often does, last week he was sharing some of the latest data on the election and I said, "this should be a blog post." Originally it was going to be after my section(s), but after I read it, I wanted to make sure it received top billing as (in my opinion) this is important for all of us to understand as we head into the mid-terms (and beyond).
The election was #4 on my list, so this also fits my original plan for this week's post.
Senate Red Alert!
By: Cody Hybiak
Republicans enter this election cycle at a disadvantage, a common challenge for the party currently holding power and defending existing seats. However, the landscape that Republicans have found themselves in has made it EASIER to defend when you consider the districts they have to try and win and the states that are up for election this year. Republicans won a majority of state legislatures that control redistricting, as we’ve been so familiar with I’m sure when it comes to the gerrymandering efforts that have taken place in Texas and Illinois. Republicans are defending states in the senate that are states with more of their voting bases.
The House is often the first chamber to change hands because all 435 districts are on the ballot every two years, creating more opportunities for voters to register approval or dissatisfaction with the party in power. While it isn’t a foregone conclusion that Republicans will lose the House, that is the way more expected result, the question will simply be which races did Republicans think were safe and will end up in a loss for them. Polymarket has the number around 220 to 225 seats for Dems currently. 218 is a majority.
With Vice President Vance holding the tiebreaker in the Senate, Republicans only need 50 Senators to control the chamber. Republicans currently hold 53 seats, meaning they could afford to lose up to three seats and still maintain control with Vice President Vance serving as the tie-breaking vote. The problem is, depending on your definition of “competitive” there are about 8 competitive seats that they’re having to defend: for this election cycle that would be Alaska, Iowa, Kansas, Maine, Nebraska, North Carolina, Ohio, and Texas. It seems like North Carolina has been punted, as money has been relocated away from there to other states. So, 7 states to defend, 5 to win.
A YouGov poll conducted last week of LIKELY voters polled voters in all of these states, minus Iowa. And what they found is that Dems were leading in ALL of those states (the “Margin of Error” in this poll is 3.9%, which the leads in Kansas, Nebraska, and Michigan all fell within that margin, but still with a Dem lead.) That’s a red alert. That would put the map like this:
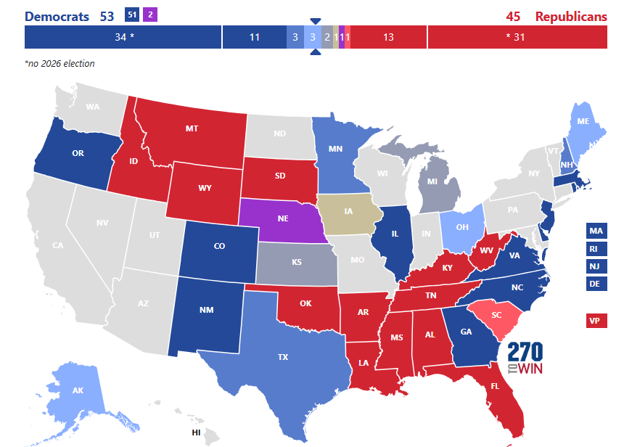
Quick little note on Nebraska. While it is a vulnerable seat for Republicans, the Democrats aren’t actually running their own candidate in the state. Instead, they are putting their efforts behind an Independent, who unlike other Democratically-endorsed Independents like Bernie Sanders may actually be a true independent in the Senate. We’ll cross that bridge when we get there, but as it stands currently that would still be a lost seat for Republicans.
So, what about the battleground state they didn’t poll, Iowa? While YouGov didn’t poll in the state, CNN did. The results of the poll showed a lead for the Republican, but within the margin of error, so it’s basically a coin flip for our purposes. That is essentially what the prediction markets have it as, anywhere from 50% to 55% for Republicans to hold the state. So, what impact has an extremely important race that is also extremely contested had on the Hawkeye state? What you’d expect, honestly. Both candidates, through the hundreds of ads that are running, are viewed as unfavorable:

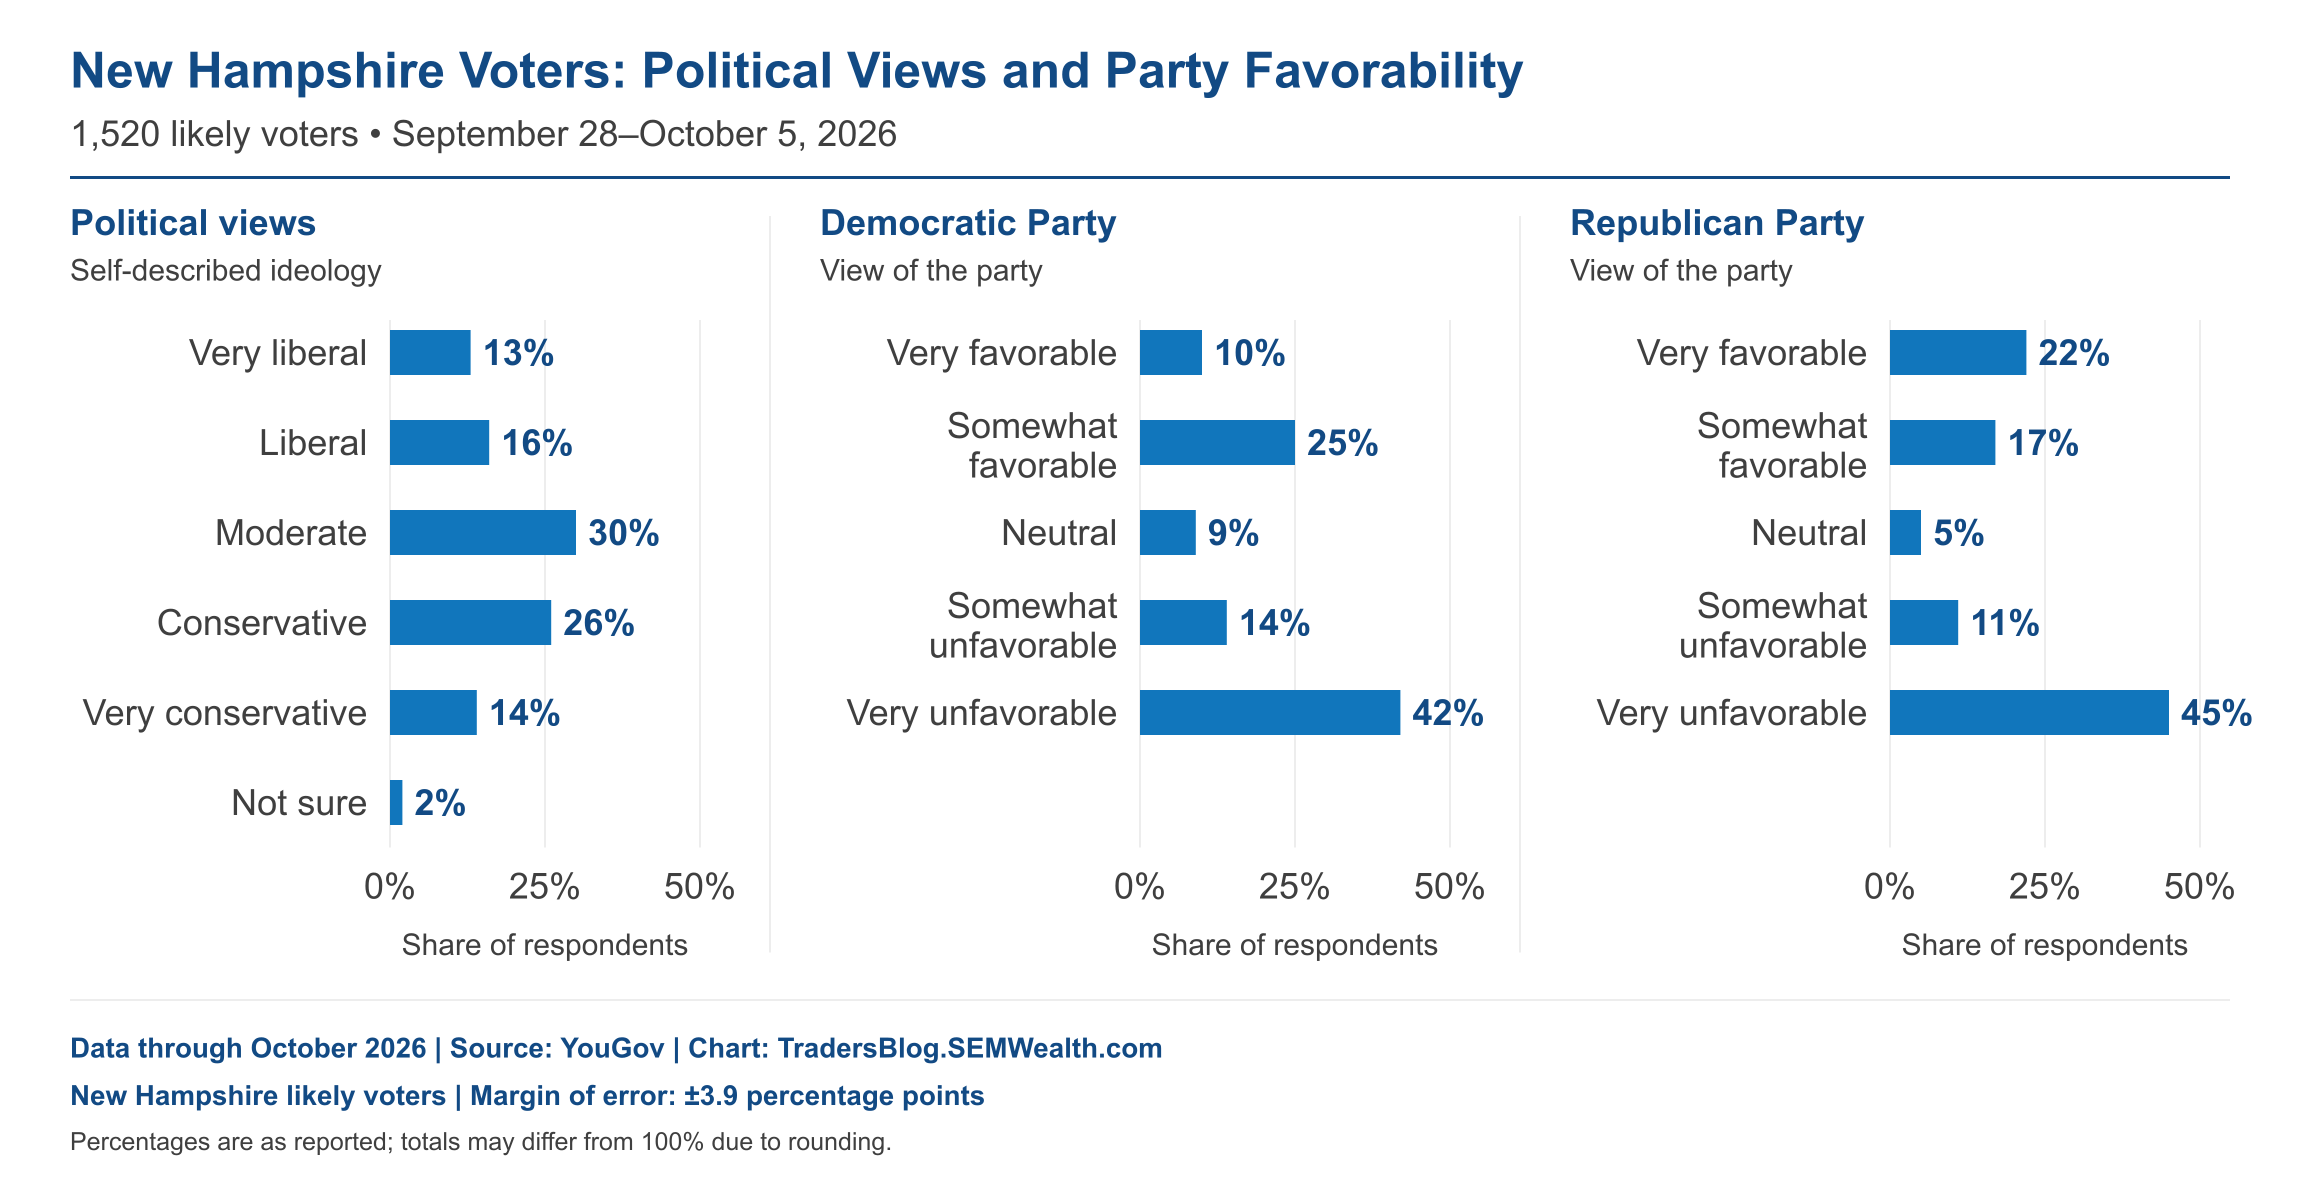
This has been a growing trend as we’ve gone through this election cycle, as well as the election cycle before this one, and the election cycle before that one, and so on and so forth for about the last 10 years. People don’t like EITHER party currently. This is from a state poll conducted in New Hampshire, in which both parties had a net unfavorable view:
With a handful of races still competitive, we will still see the battle heating up for the next few weeks. Stay tuned.
Client Concerns
Ranked in order, here are the concerns advisors said they were addressing with clients.
1.) Inflation
This is a tough one because a.) it is hitting all of us and b.) it's not that easy to determine where it goes in the months ahead. For my most recent take see:
 Jeff Hybiak, CFA
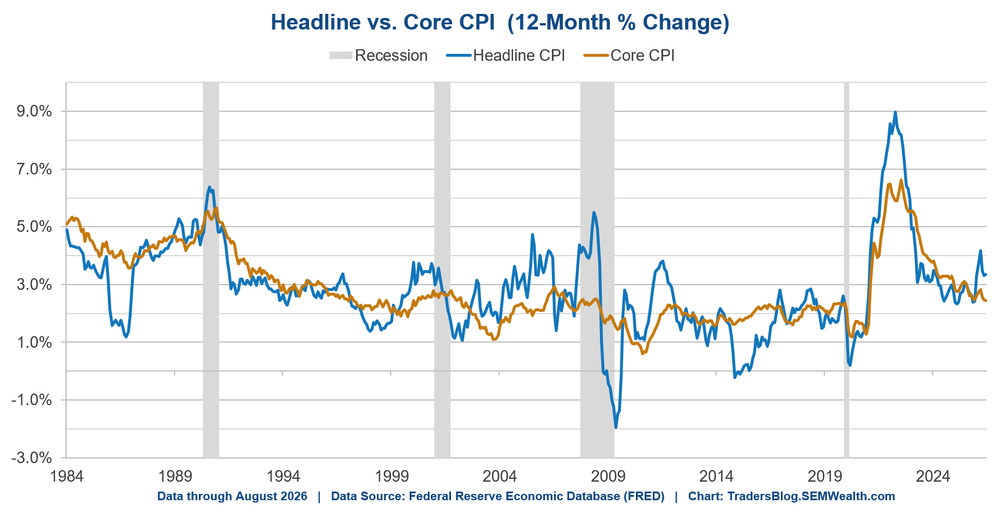
As I look at this, I'd be surprised if the Fed is able to push inflation down to 2% in the foreseeable future.........unless we have a recession. The primary drivers of inflation are all out of the Fed's control:
- Energy / the war in Iran
- Import Prices
- The AI Buildout
The last two are related as most of our trade deficit is related to computer components, which are largely made outside the US. If you've been shopping for anything with computer chips in it, you've seen the problem.
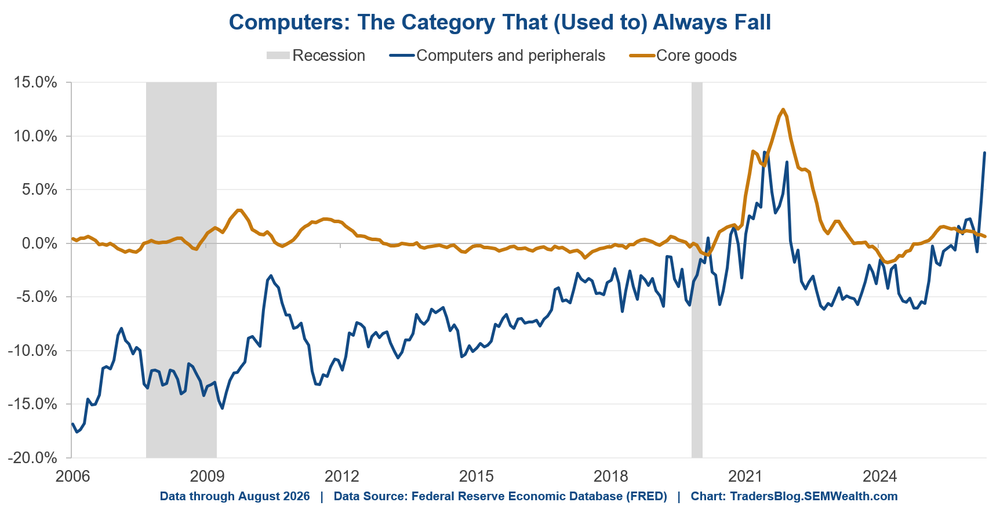
That's the problem right now – probably the easiest way to get inflation below 2% would be to somehow slow the AI buildout, which would put pressure on the economy, which would lower demand for energy, all of which would bring inflation down. I know this is an unpopular opinion, but because of this I would much rather see inflation at 3% than 2% (or below).
2.) Interest Rates
Since the Fed raised (short-term) rates last month, long-term rates have also been moving higher. This goes against my call from the summer where I said (paraphrasing since I said it often), "if the market believes the Fed is serious about cutting inflation, we could see long-term rates go DOWN."
Last week I discussed the "Interest Rate Bermuda Triangle" where I went over the reason I believe long-term rates have gone up and are above 5% for the first time since 2007 on the 10-year.
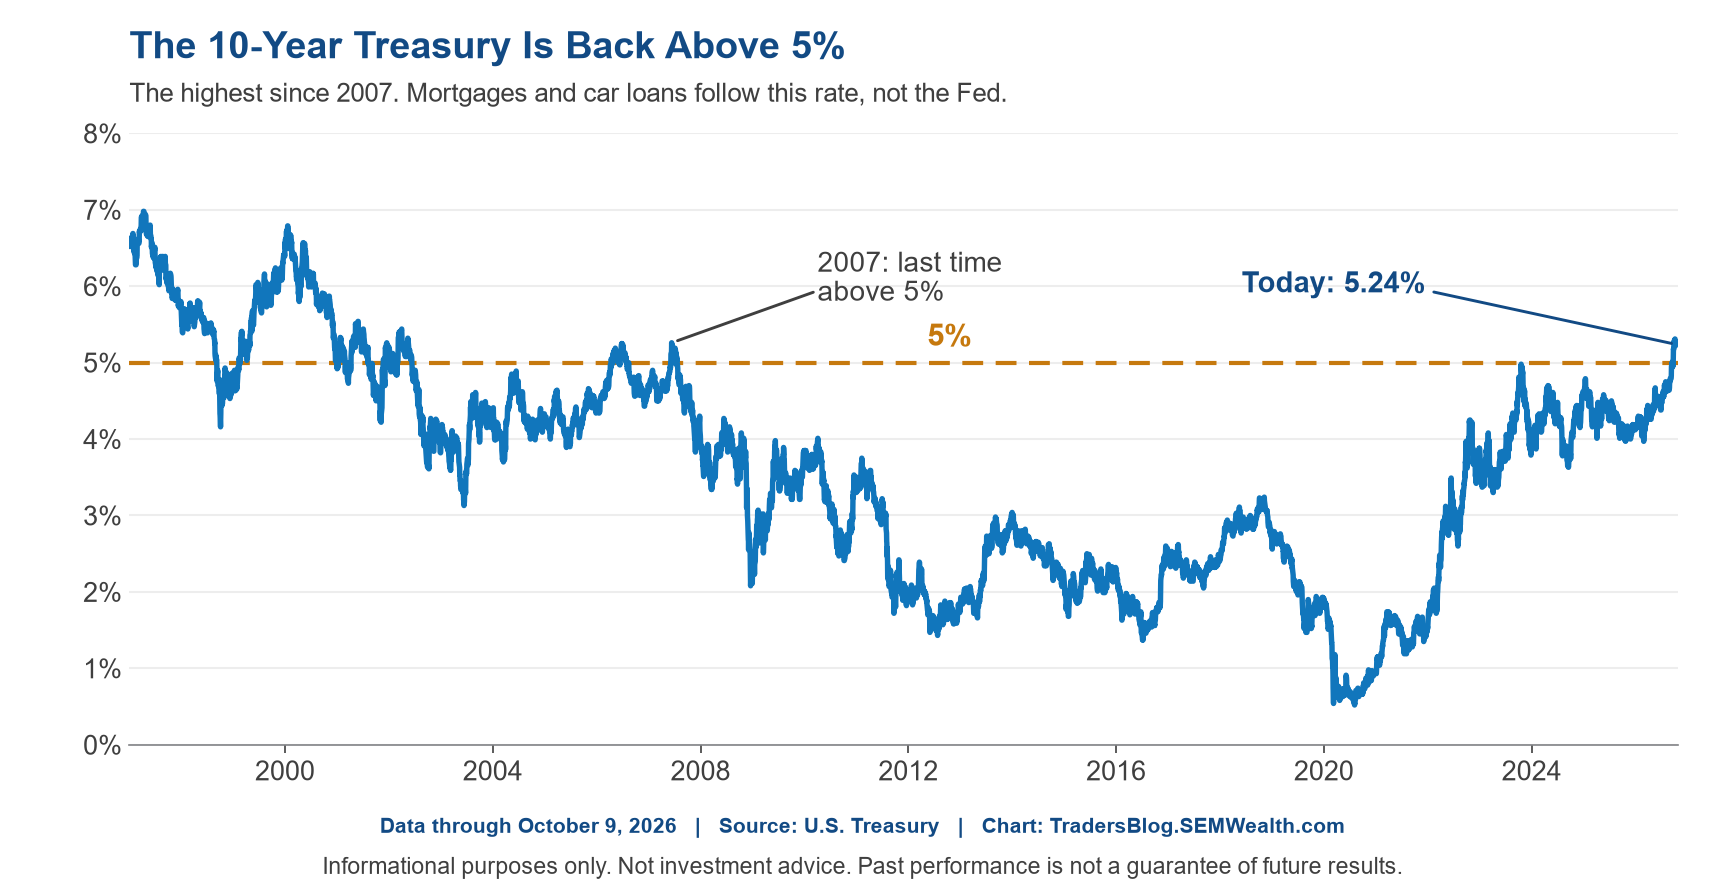
Put simply, the 10-year Treasury is comprised of inflation expectations (because inflation erodes the value of your coupon payments over time) and the "real yield" (the yield demanded to take the "risk" of investing in that bond.)
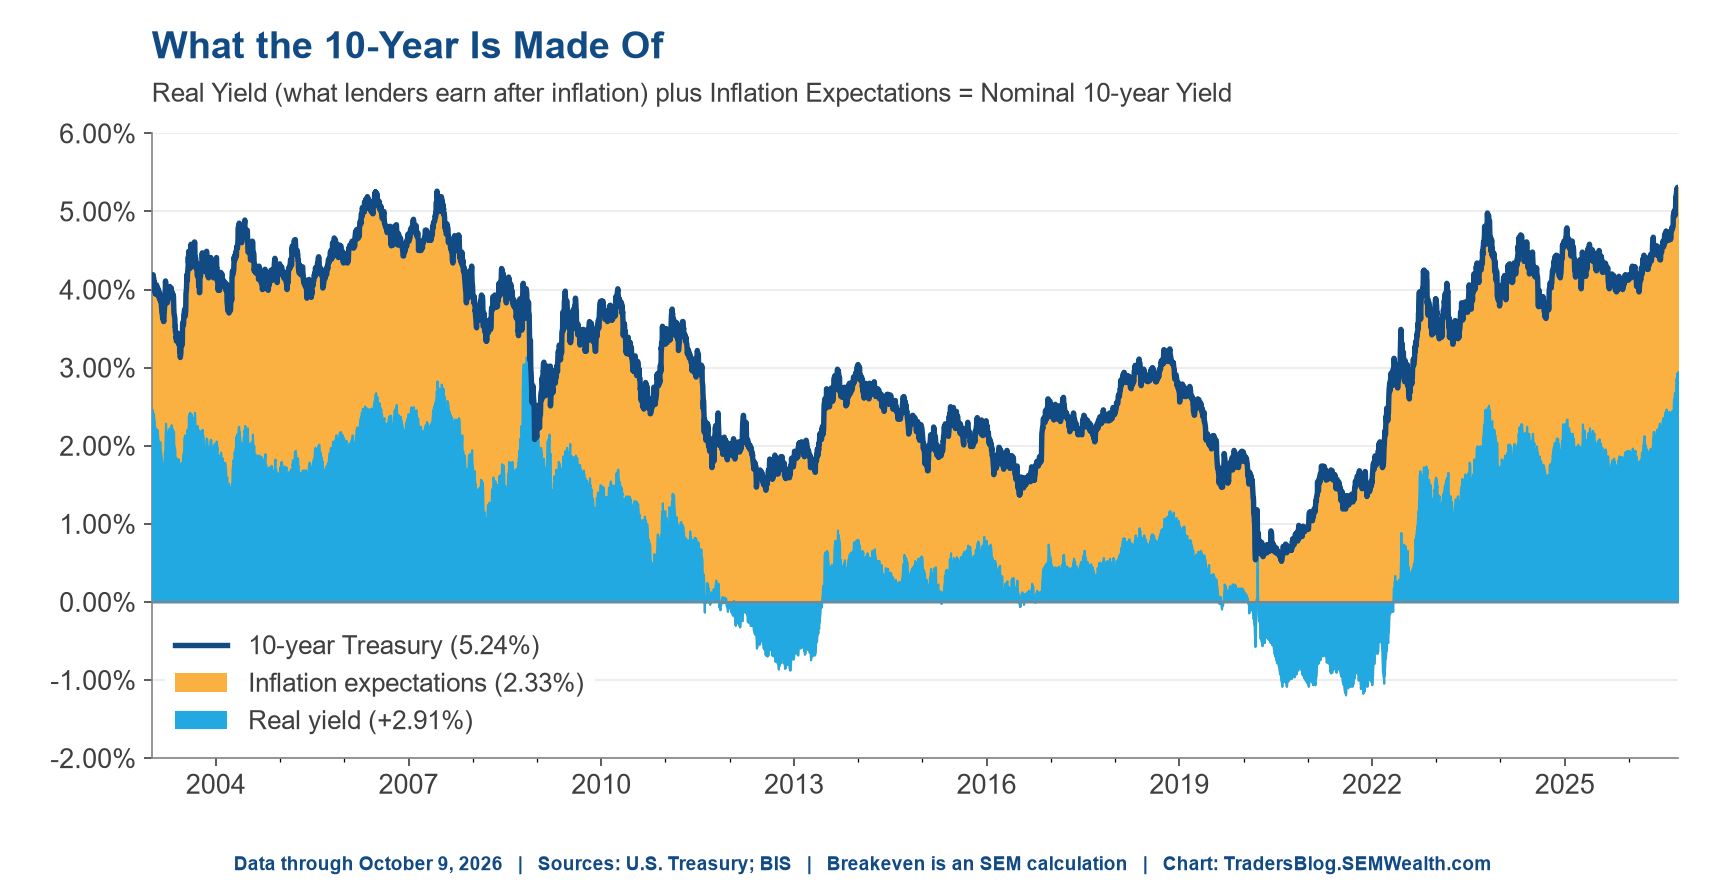
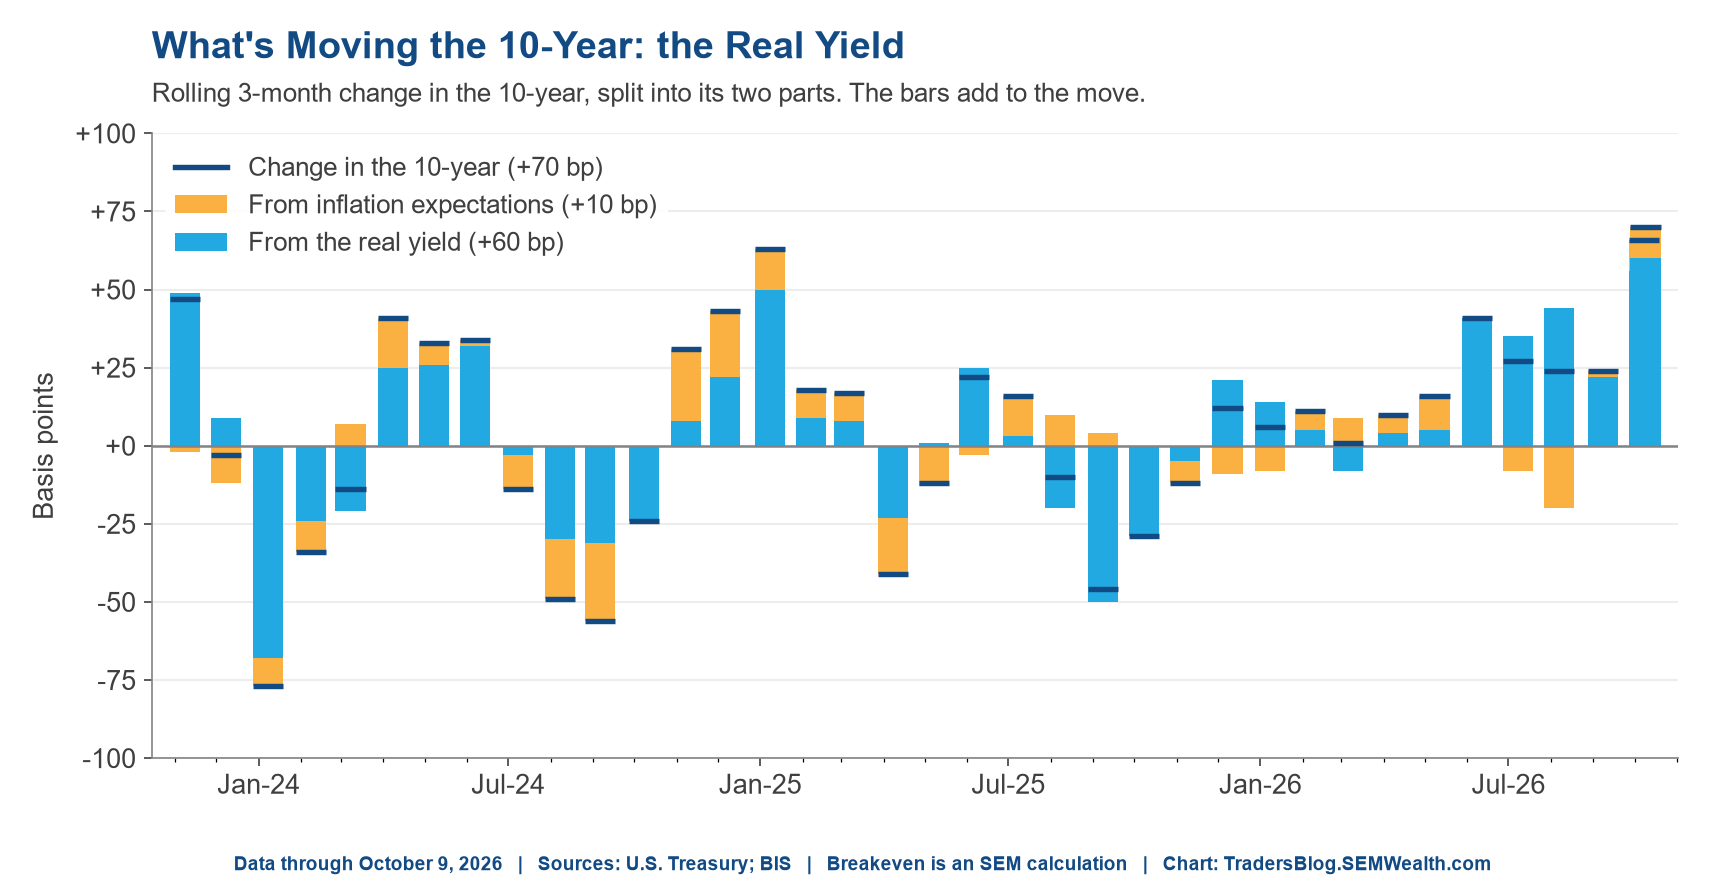
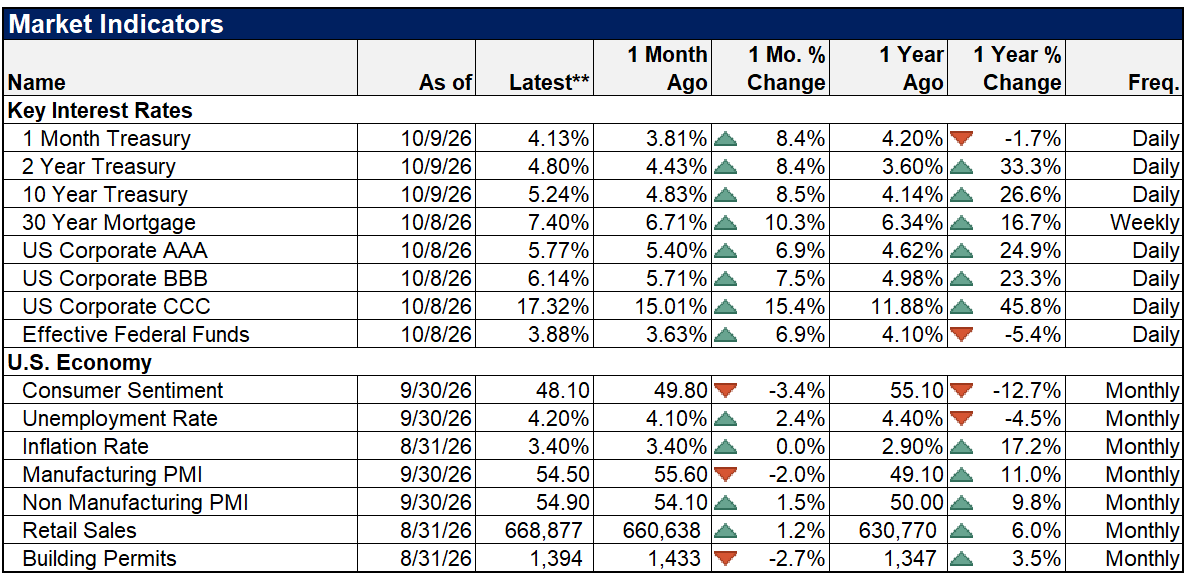
10-year inflation expectations are at 2.33% (so for now the market agrees long-term 2% is not going to happen). The real movement though has been in the "real yield" or what the market is demanding to lend money to the government. When broken down, we can see the bulk of the move this year has not been due to inflation, but investors requiring more money to own these bonds. In the interest of space, I'll delay my post (rant) about government spending for another week.
Higher interest rates most certainly threaten the markets for several reasons:
- It (theoretically) slows the economy
- Government interest expenses will go even higher (threatening long-term growth)
- Increased cost to the AI buildout (which has been a big chunk of overall economic growth)
However, many clients and some advisors have been questioning why own bonds, while others have been asking about locking in at 5%. Owning bonds is more of a financial planning question based on the plan, cash flow strategy, and investment personality, not a market timing mechanism. I will say, however, ignoring the reasons rates are high, from a pure valuation standpoint, bonds are obviously much more attractive now than they were in 2021. Like stocks, your starting valuation is the primary driver of your long-term returns, so starting with higher yields potentially leads to higher long-term returns.
Here's our current rate environment. The further to the right you go, the more risks you are taking.
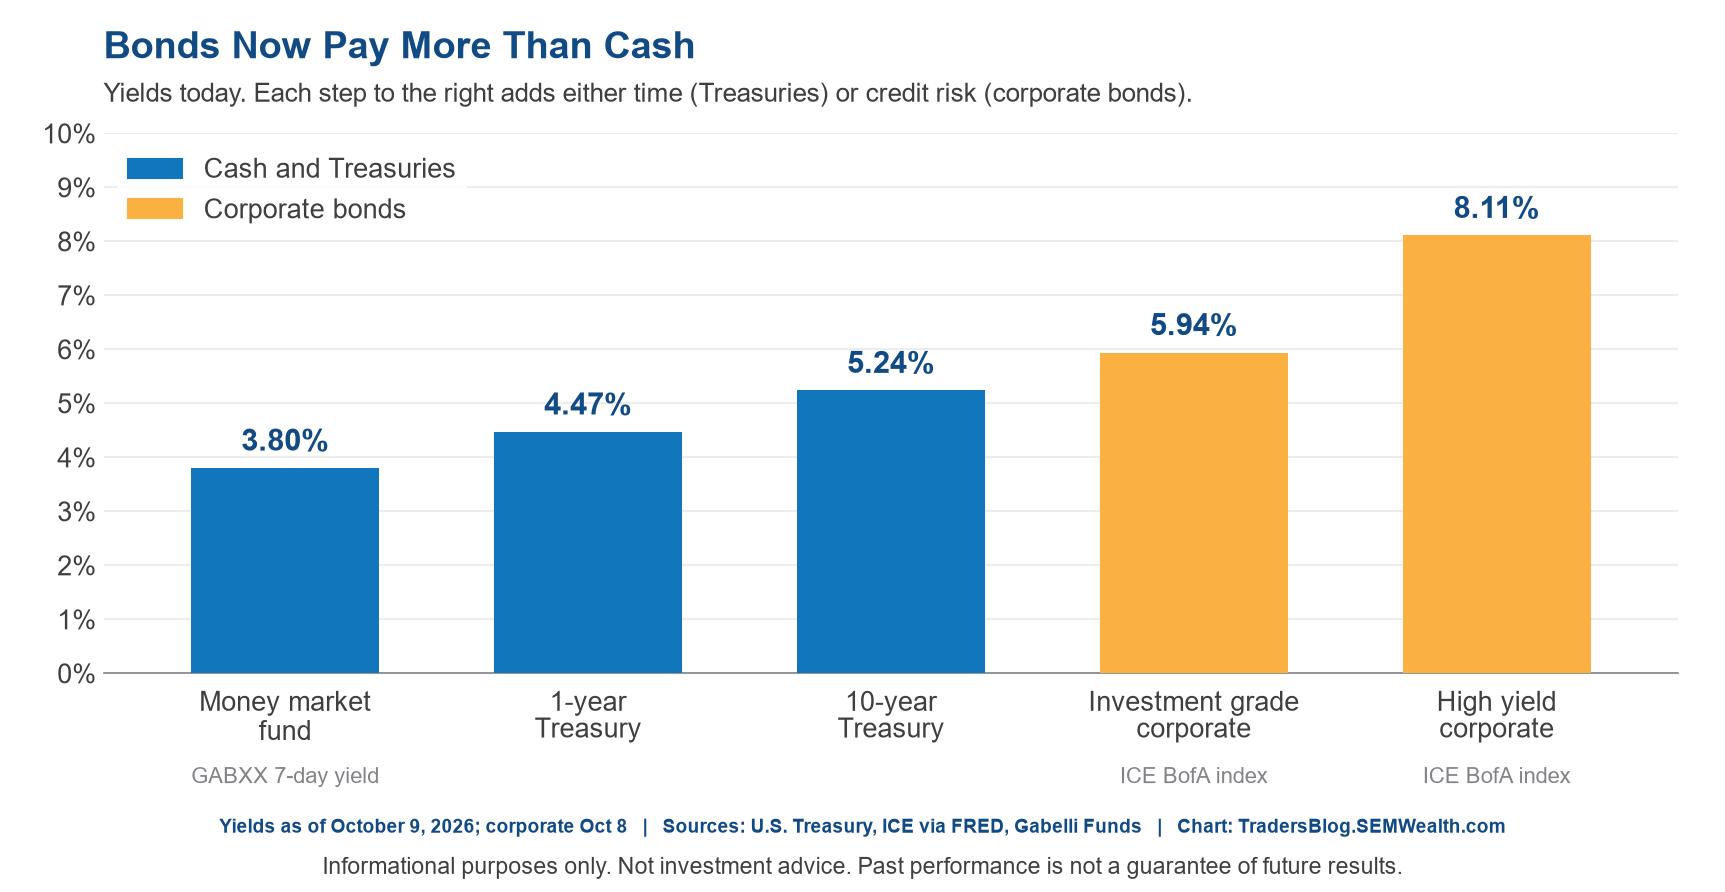
The caveat, though is if you are locking in at 5% and inflation runs at 3%, you're only receiving 2% BEFORE paying taxes. That may be ok for shorter-term money, but likely not the best place for long-term money.
3.) AI
This is a broad topic, but as I asked follow-ups it came down to:
- It could end humanity
- I personally think this is overblown, but deserves much more than I can bring. I continue to read as much as possible and listen to as may podcasts as I have time to learn more about this.
- It's changing everything, which covers a lot of ground, but primarily
- It's an unknown – my personal take is the same I've always had – figure out how best to use it and understand its shortcomings. Don't be so afraid of it that you never use it, but don't trust it so much that you stop thinking for yourself.
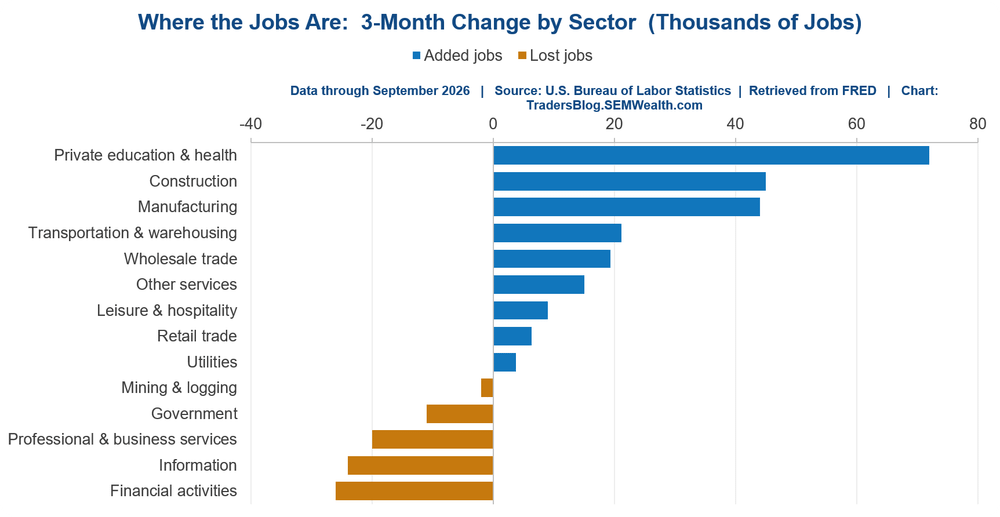
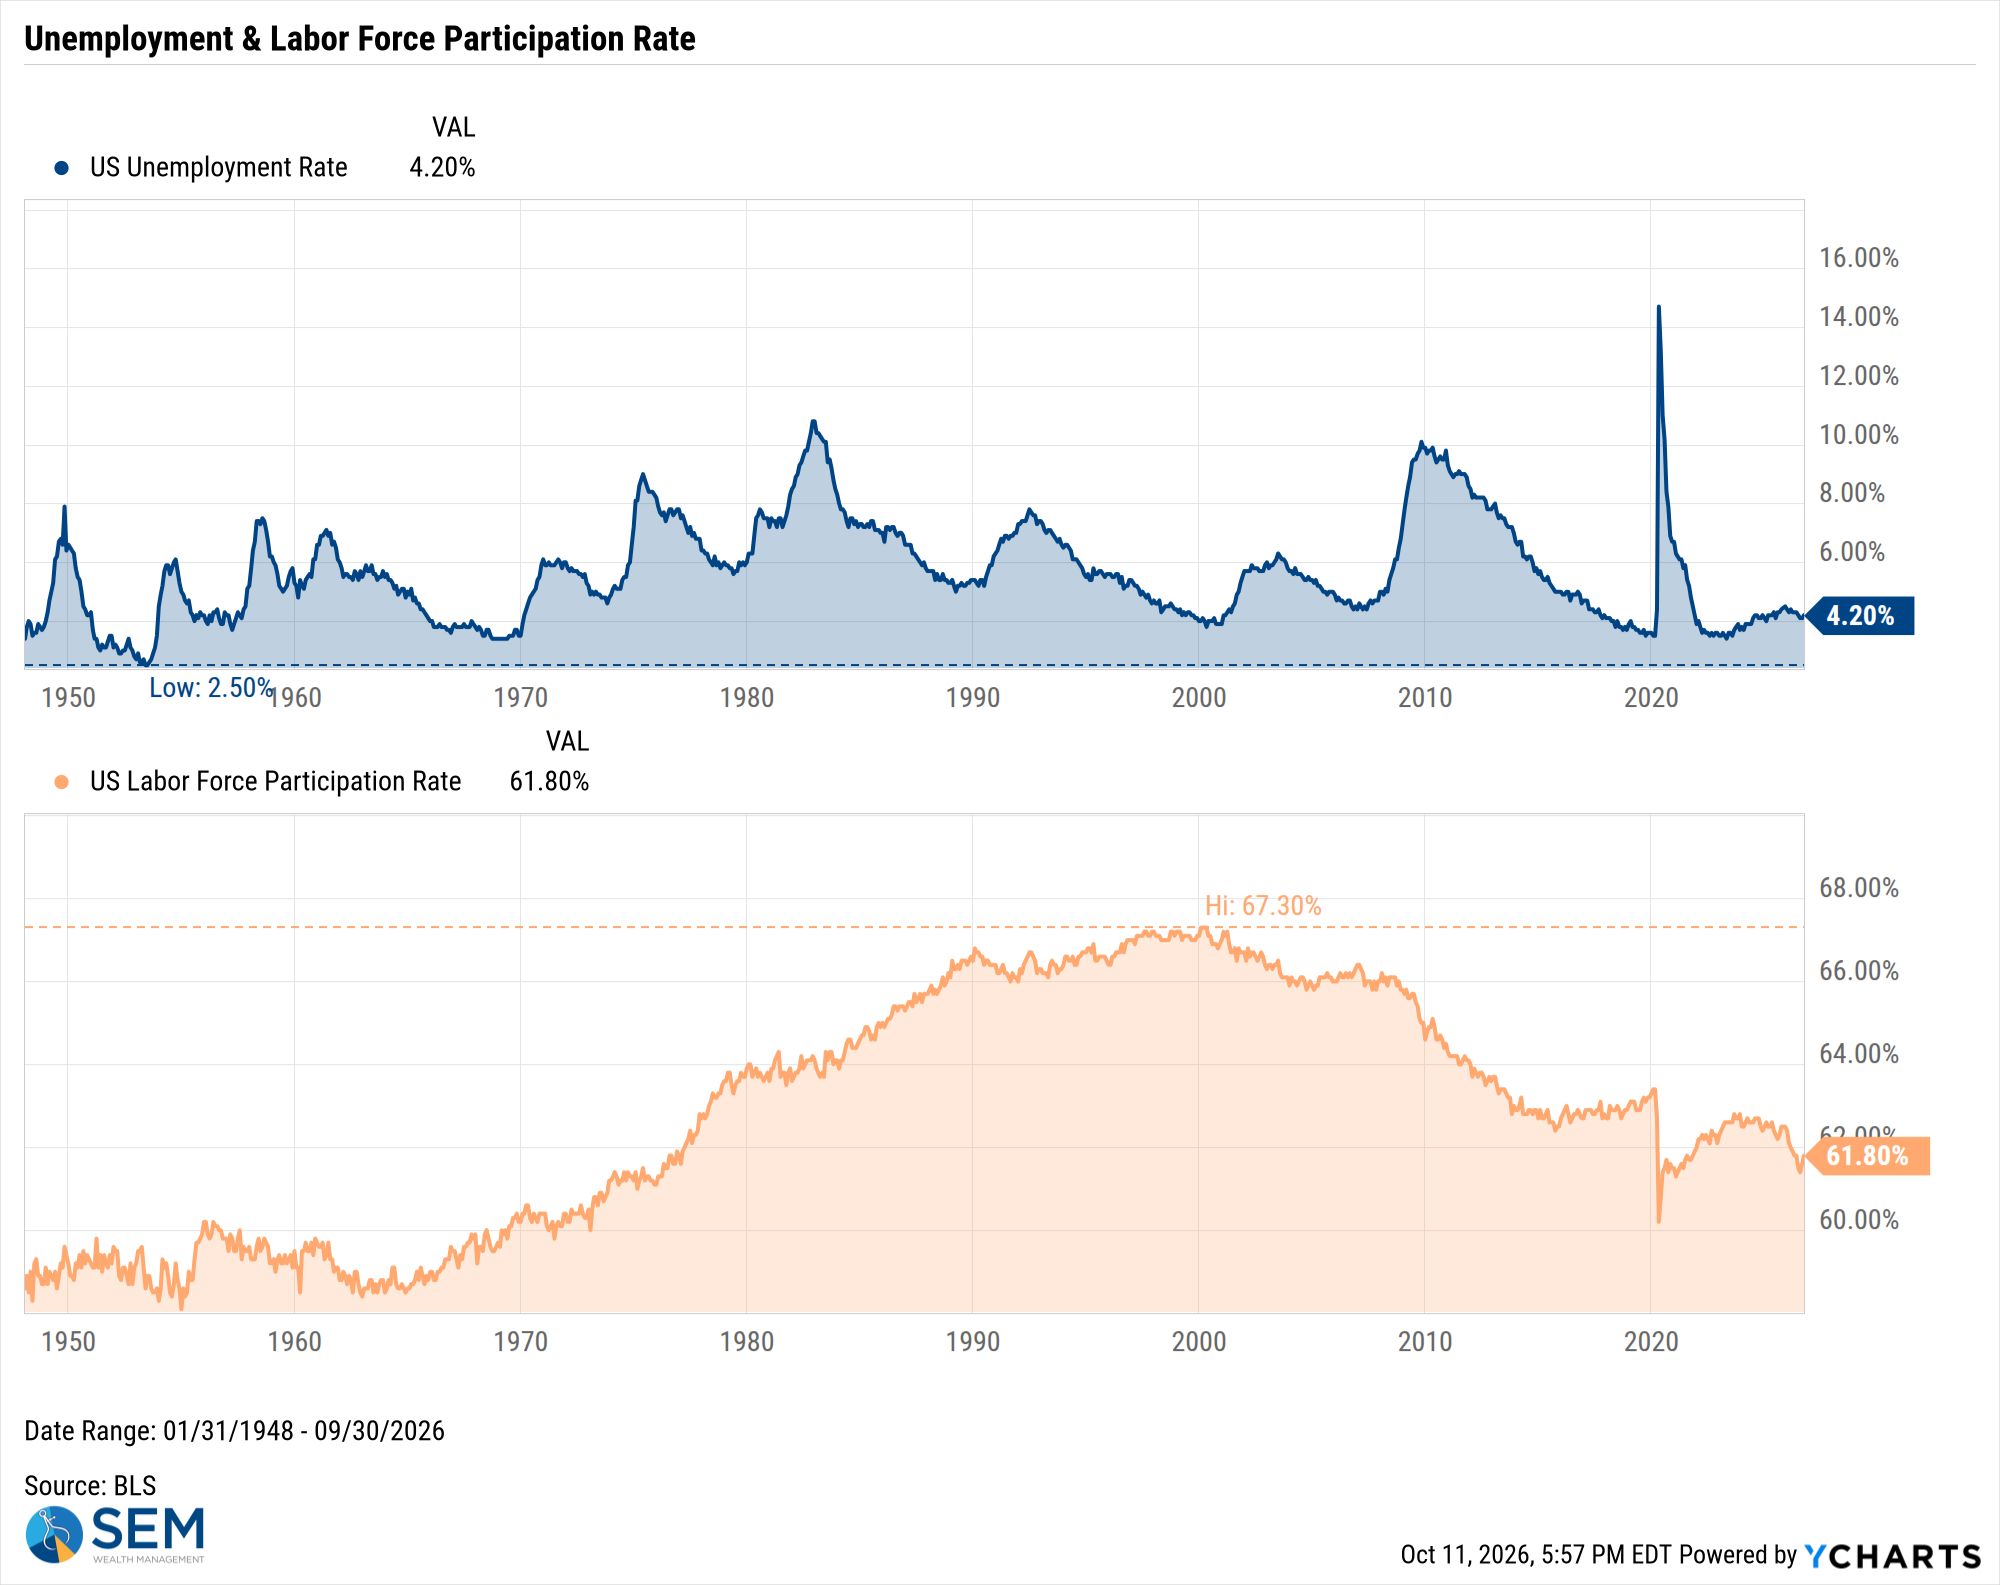
- It will take our jobs – this is a legitimate concern (short-term), but that has always been the case, even in my lifetime. For now, we can see that over the last 3 months the 3 industries, which would be most threatened by AI (Financial, Information Technology, and Professional Services) had net job losses.
- Data Centers – again this is a few things, but mostly:
- We don't want them (people generally bearish on AI)
- Slowing data center growth will hurt (by slowing the buildout and losing our lead on China)
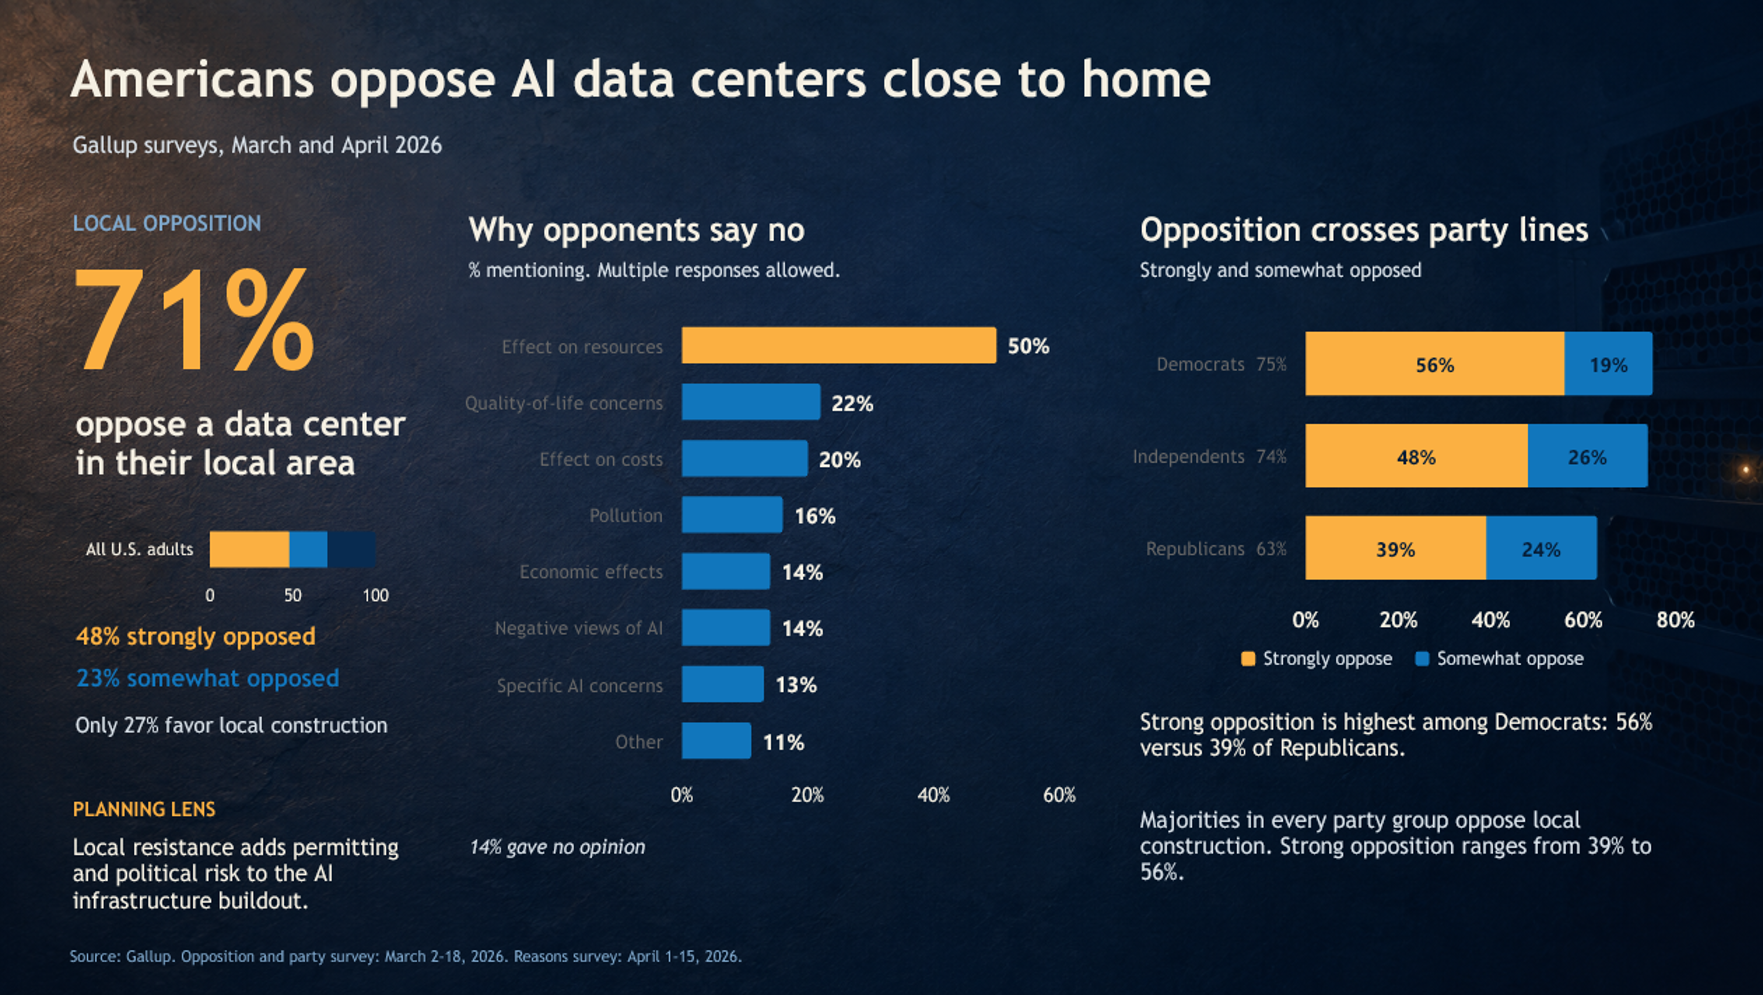
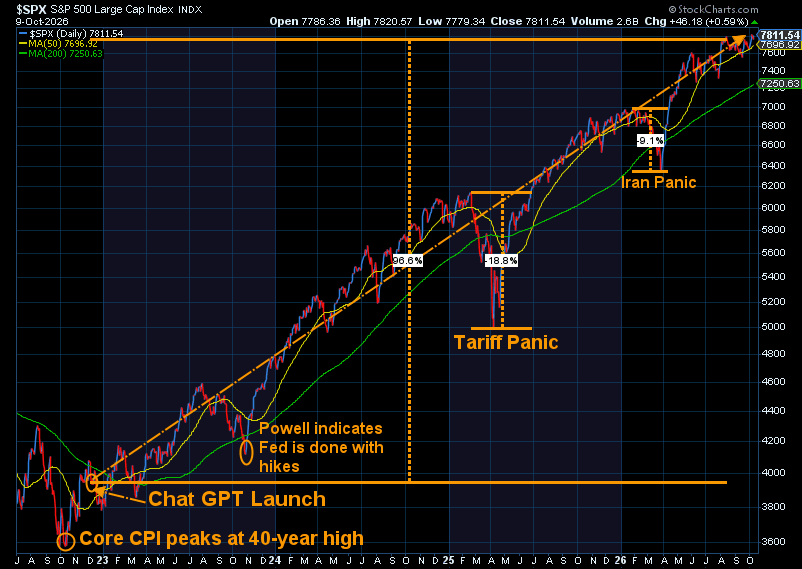
The surveys above show the widespread opposition, becomes a bigger issue if that opposition turns into a slowdown in the buildout. Look how much of the rally since late 2022 has been tied to the technology sector:
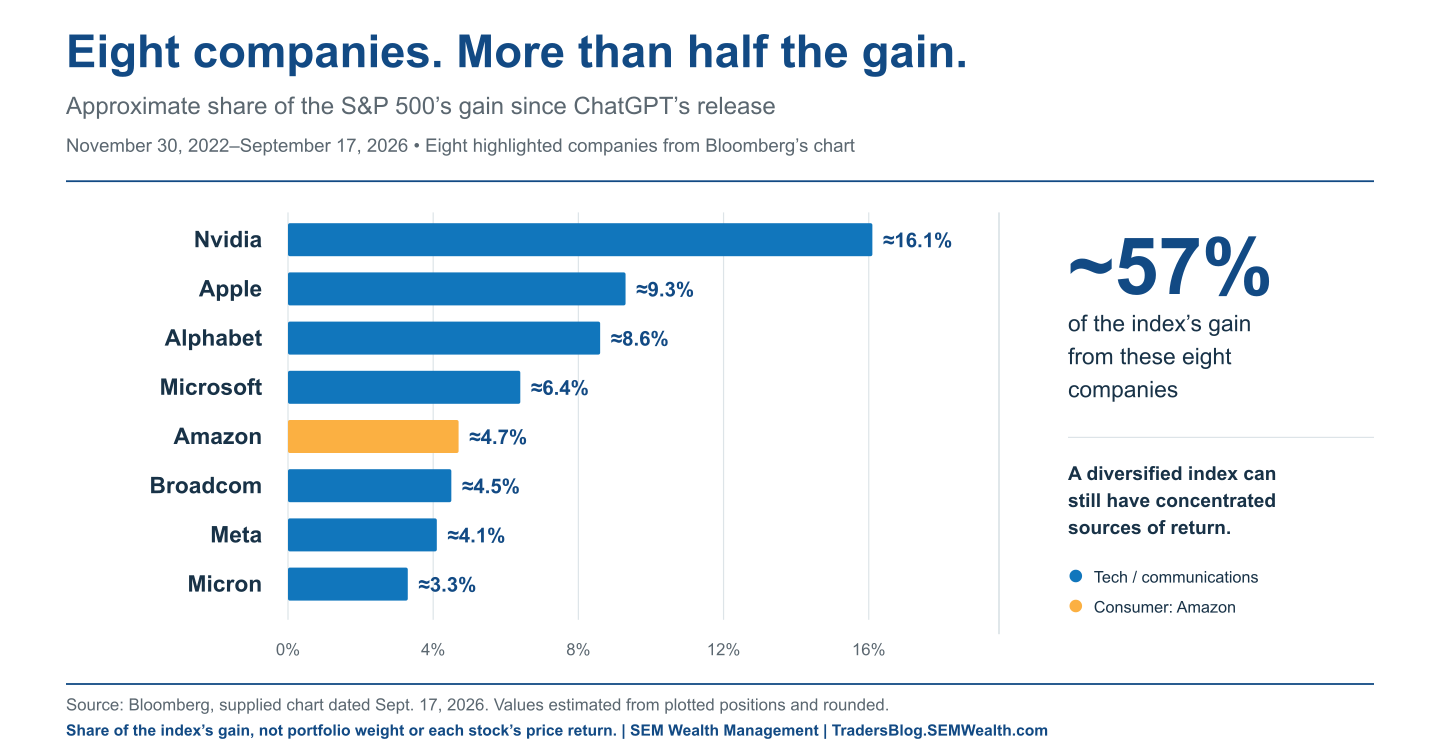
Maybe the market "broadens" and everything is fine, but I think most people understand if the drivers of the economy, corporate earnings, and the economy all grow less than expected, this could turn into something none of us want (see point 5 below).
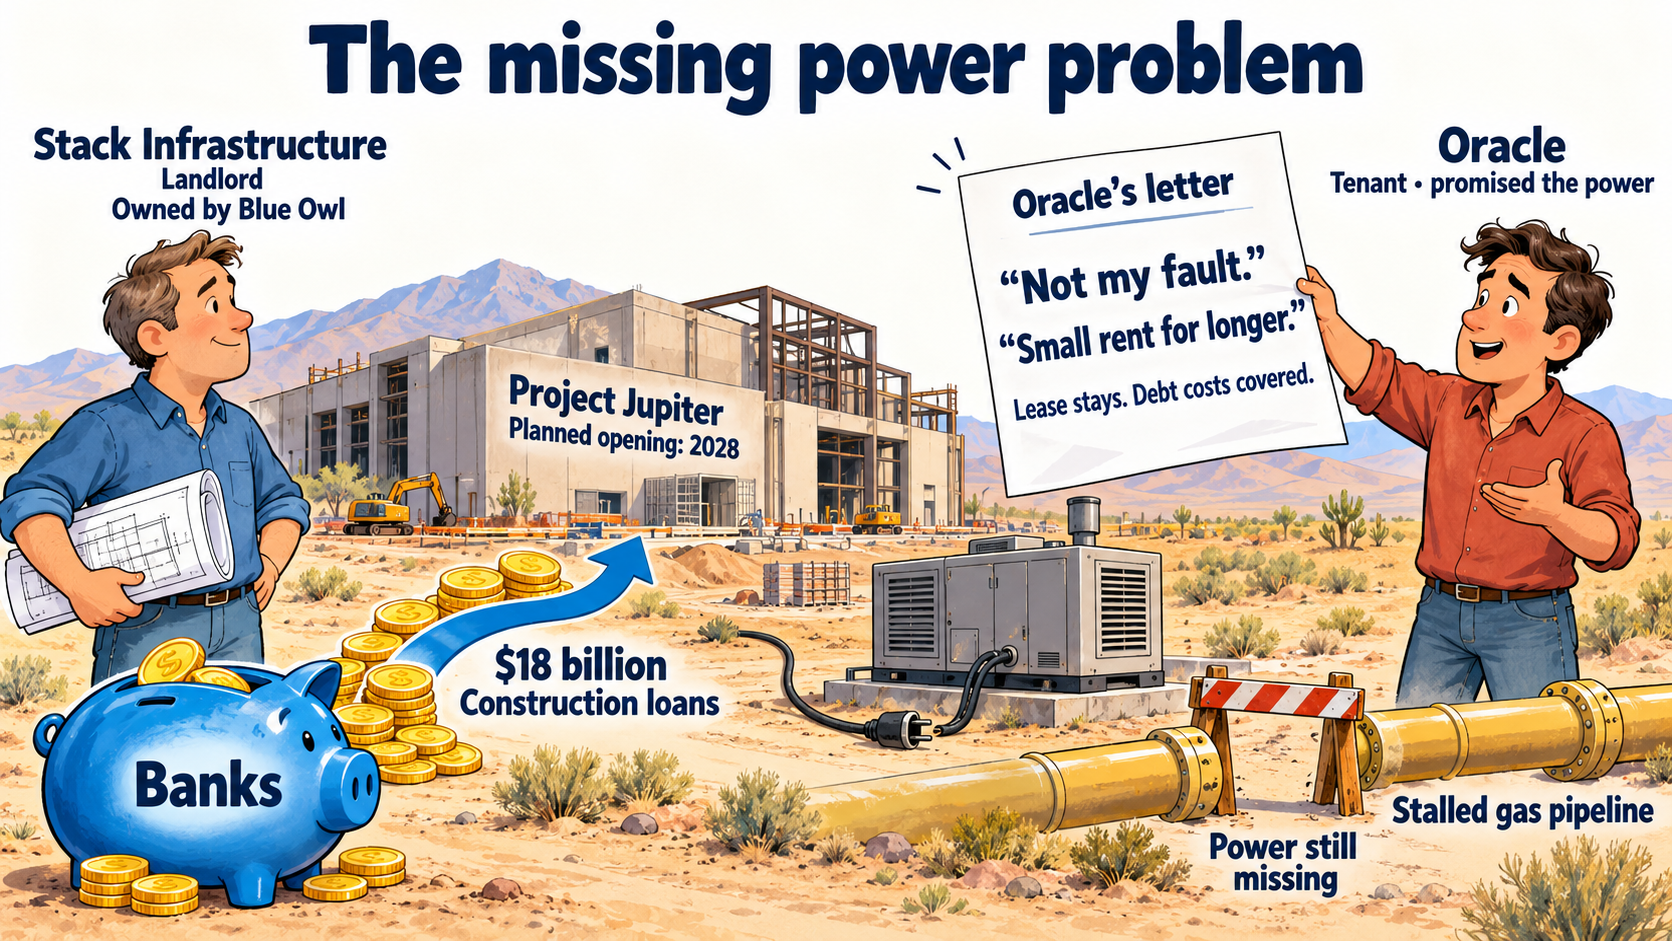
Speaking of AI, our "Everchanging AI Landscape" report included an update on Oracle bonds. Check it out here (note there is an index that links to the section you want to read.)
4.) The Election
This was most certainly something everyone at the conference wanted to talk about. From my perspective, I always say, "Do not let your political opinions influence your investment decisions." I say this because the data says in the grand scheme of things, the performance of the market does not always match the "consensus" view of who is best for the markets. We also have to remember campaign promises rarely become actual policies.
Here is what the data shows. [Sidenote: I've previously said, "the market loves a divided government." The data is not as clear and depends on how you define a "divided" government and whether you use "average" or "median" levels.] The chart below does show why some people may be getting worried about the market. As Cody noted in his post above, there is a growing chance Republicans lose control of both the House and Senate, which whether you use median or average is the worst possible outcome for stocks.
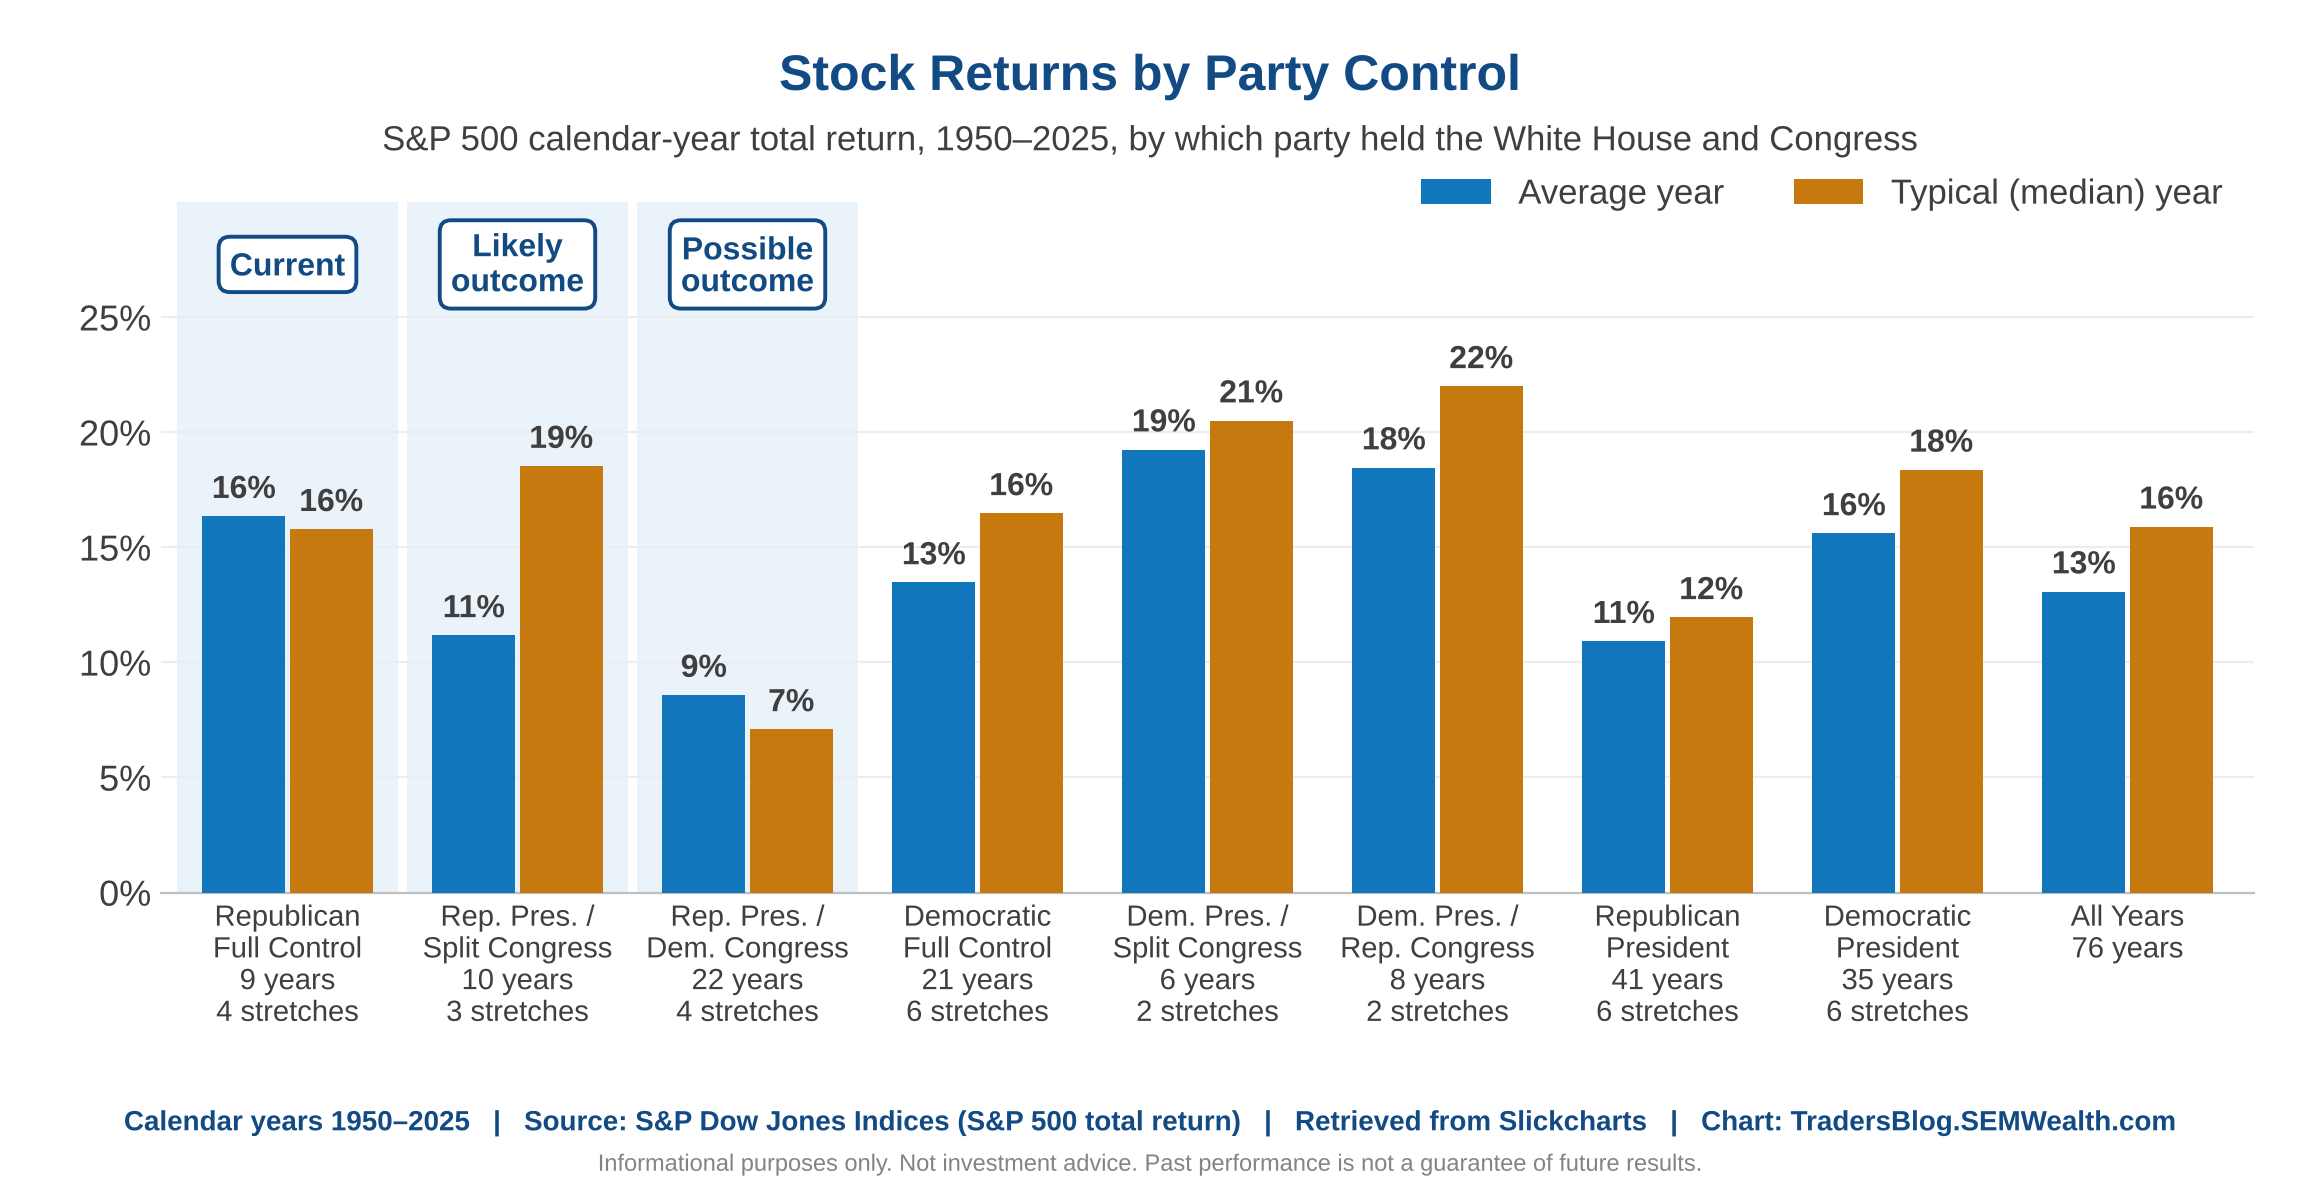
I'd be careful taking action on this as the small number of years and stretches can skew the results (plus the market may adjust prior to the election if participants believe something bearish may emerge). Also keep in mind, even the median year was a positive 7%!
5.) Market Crash (Bubble Bursting)
"When does this end?"
"Is it going to crash?"
"How ugly is it going to get?"
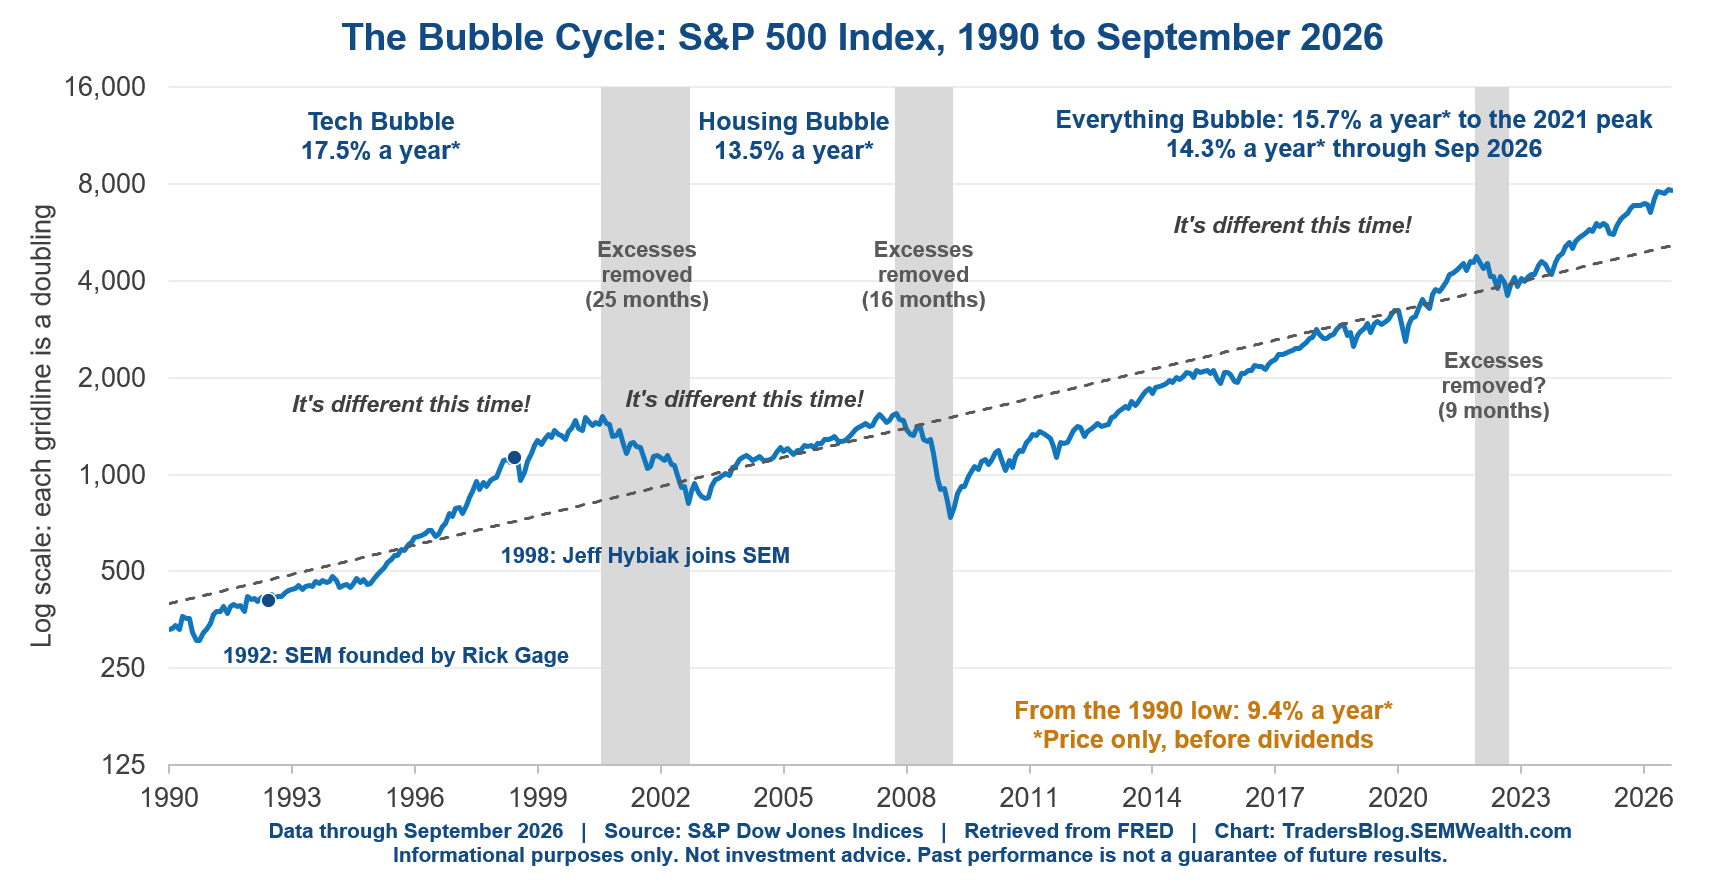
These are all questions I heard at the roundtables. We've had a remarkable run the past (nearly) 4 years since ChatGPT's public launch. This is making people nervous, especially those who remember past manias (bubbles) vividly. This could be an entire blog post, but here are a few notes off the top of my head:
- Valuations using the P/E ratio are above average, but not at extremes. The issue is the "E" is being driven mostly by the largest companies who are posting jaw-dropping earnings growth rates. The question is when the cycle ends and what that looks like. This is why the "Cyclically Adjusted PE" (CAPE or Shiller PE) was created – to smooth those out.
- The CAPE is near an all-time high
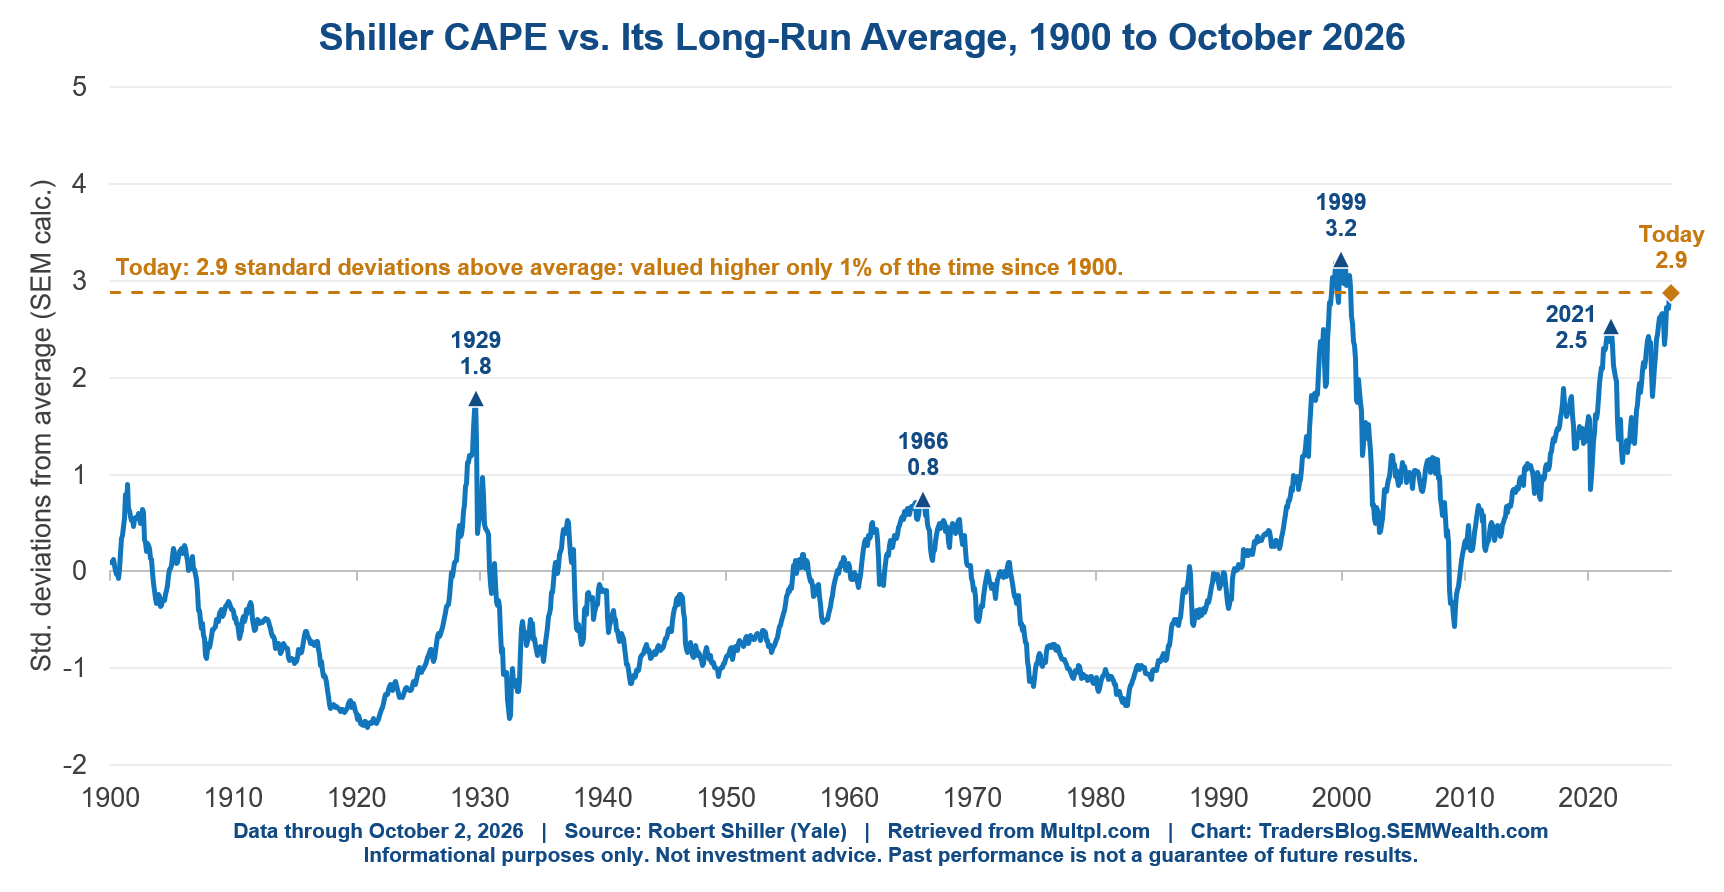
- I remember vividly how impressive earnings were in April 2000. With hindsight, that was the peak in the growth rates, but earnings were still positive, but they just weren't as high as people were expecting. That will be the issue whenever this cycle ends.
- The market does not necessarily have to crash. Studying past technological cycles shows how the technology cycles have moved – each innovation helped create the next one. The market crashed during the radio and internet/broadband cycles, but went through long periods of consolidation during the electricity and computer/IT cycles.
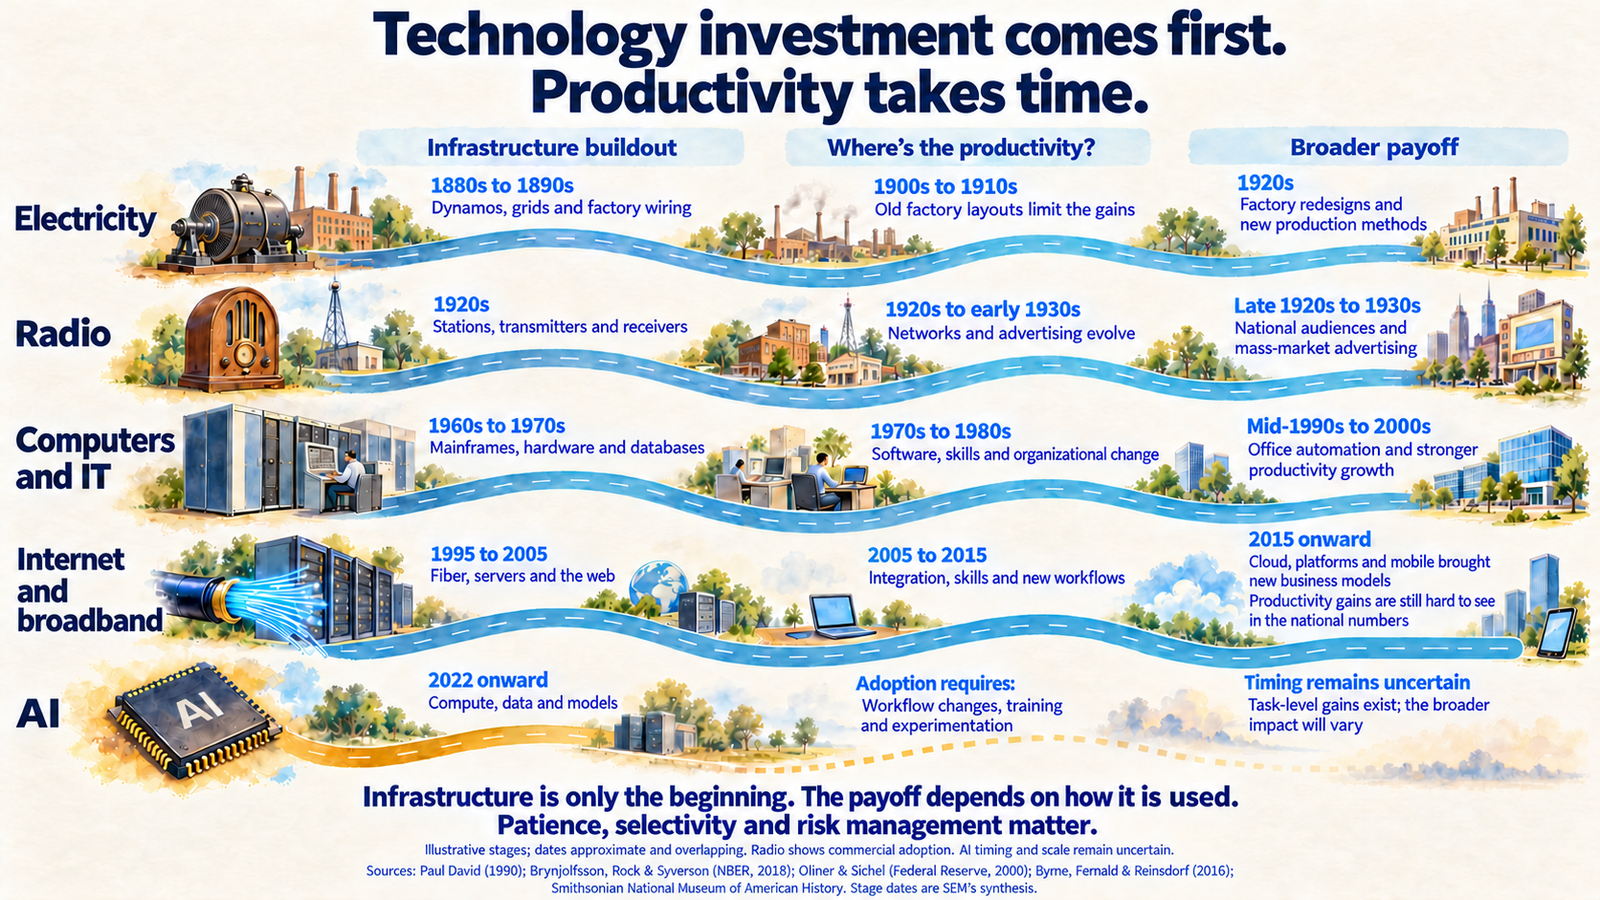
- Cashing out too soon could mean missed opportunities. While it certainly feels like a mania, you could argue we have several more years of the "buildout" phase based on past cycles.
- The plan should determine whether or not to get out of stocks at this point, not how you (or anyone) feels about the market. Staying too long (or chasing the market) with money needed in the next 3-7 years could be a mistake. That's what we saw happening during the more recent "bubbles"
- According to Vanguard, people aged 60-64 hold about 64% of their accounts in stock, which is well above their recommended 48% in their "life cycle" portfolios. A 50% stock market drop would cut the account by about 1/3.
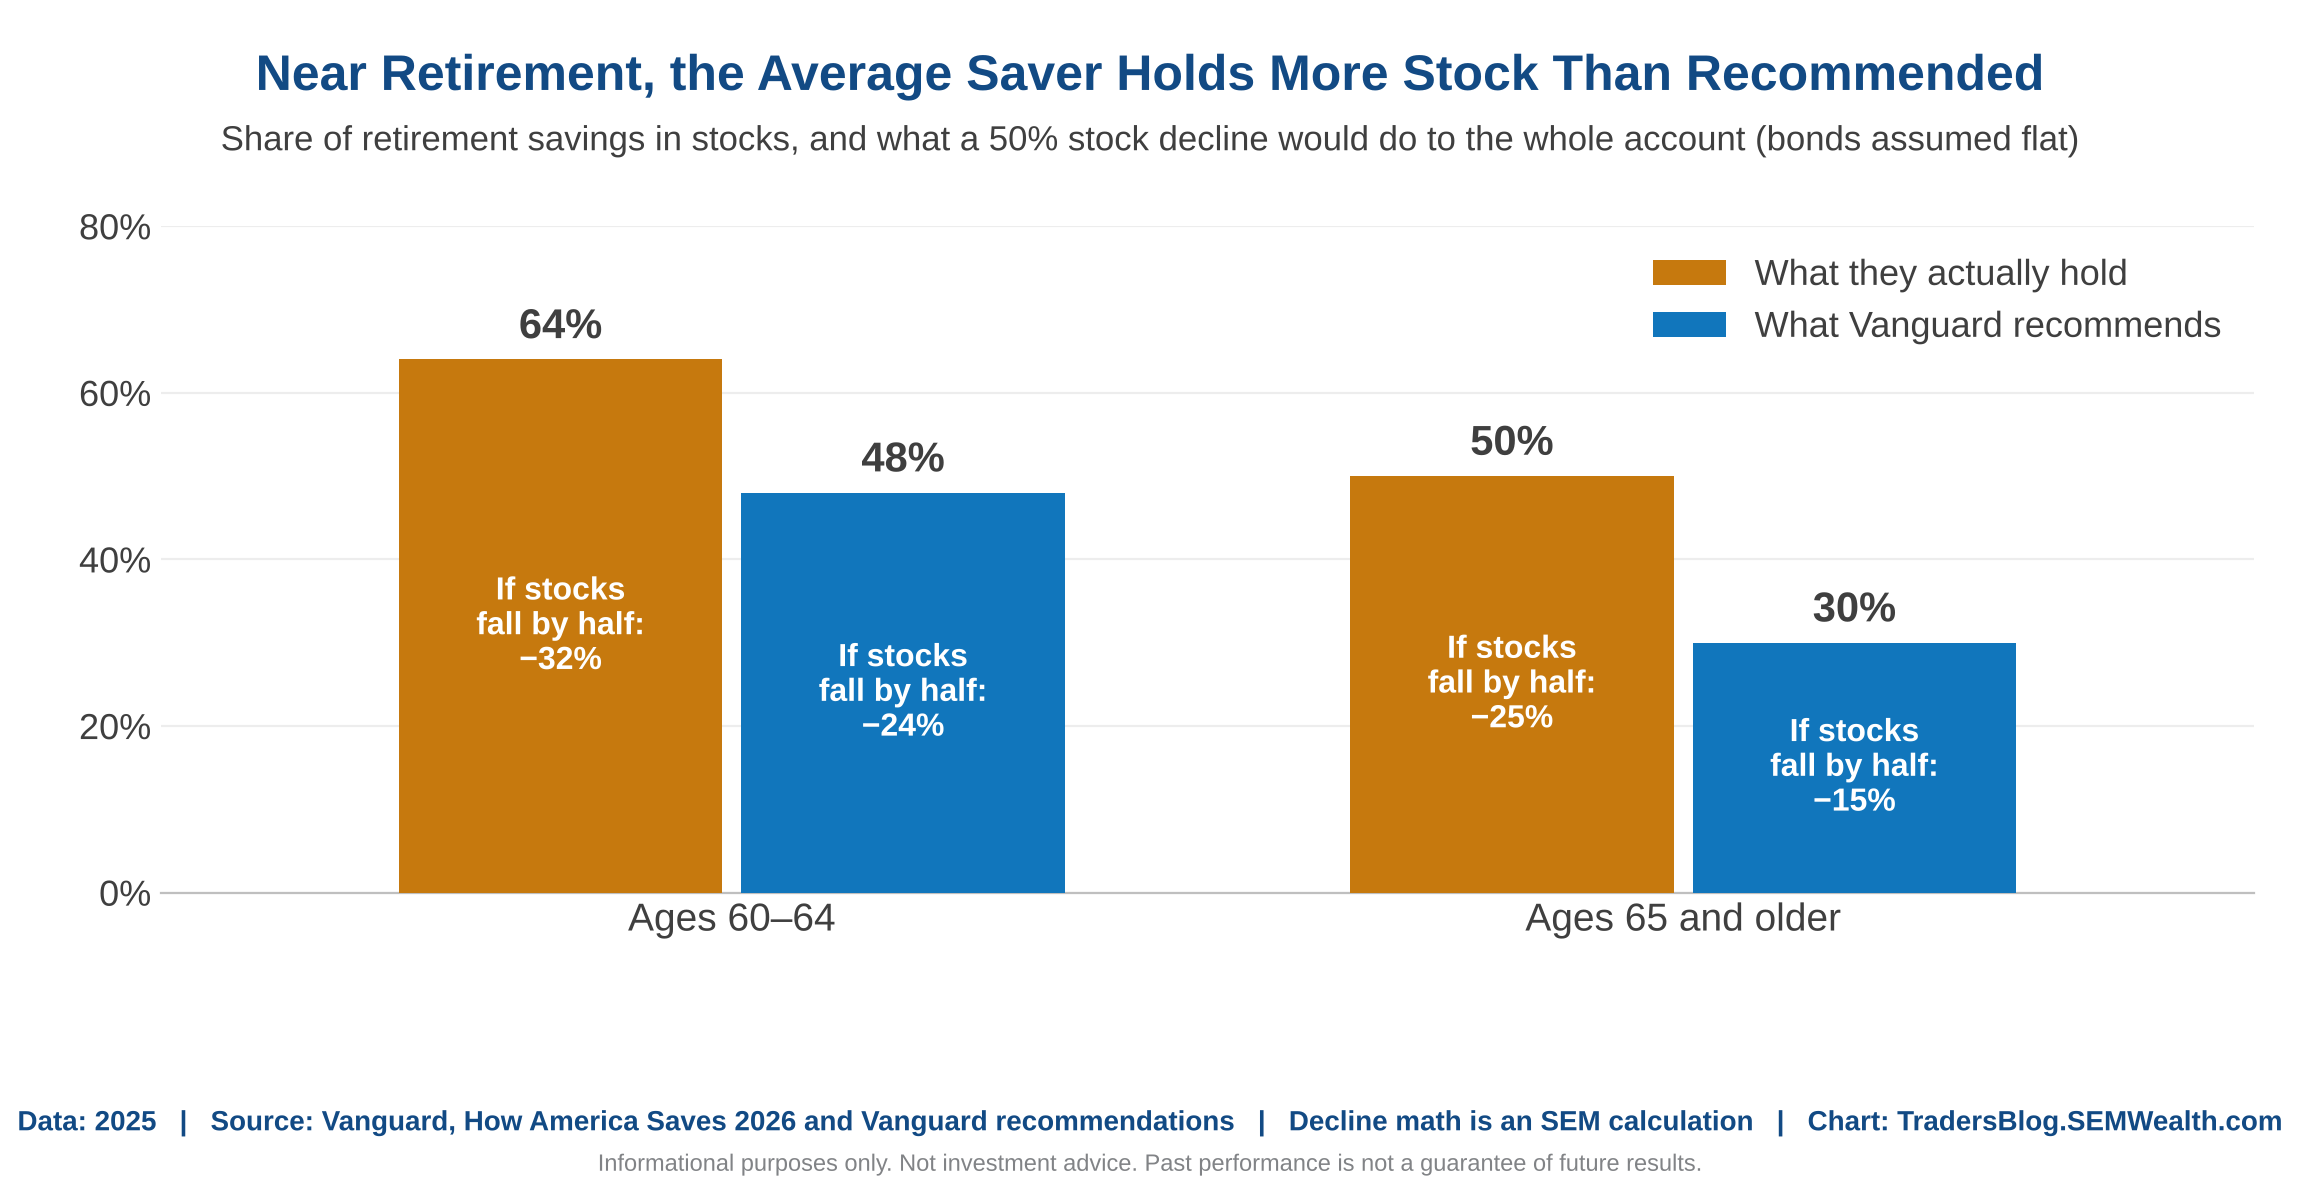
- Losing too much at the start of the retirement could cause serious disruptions to the plan.
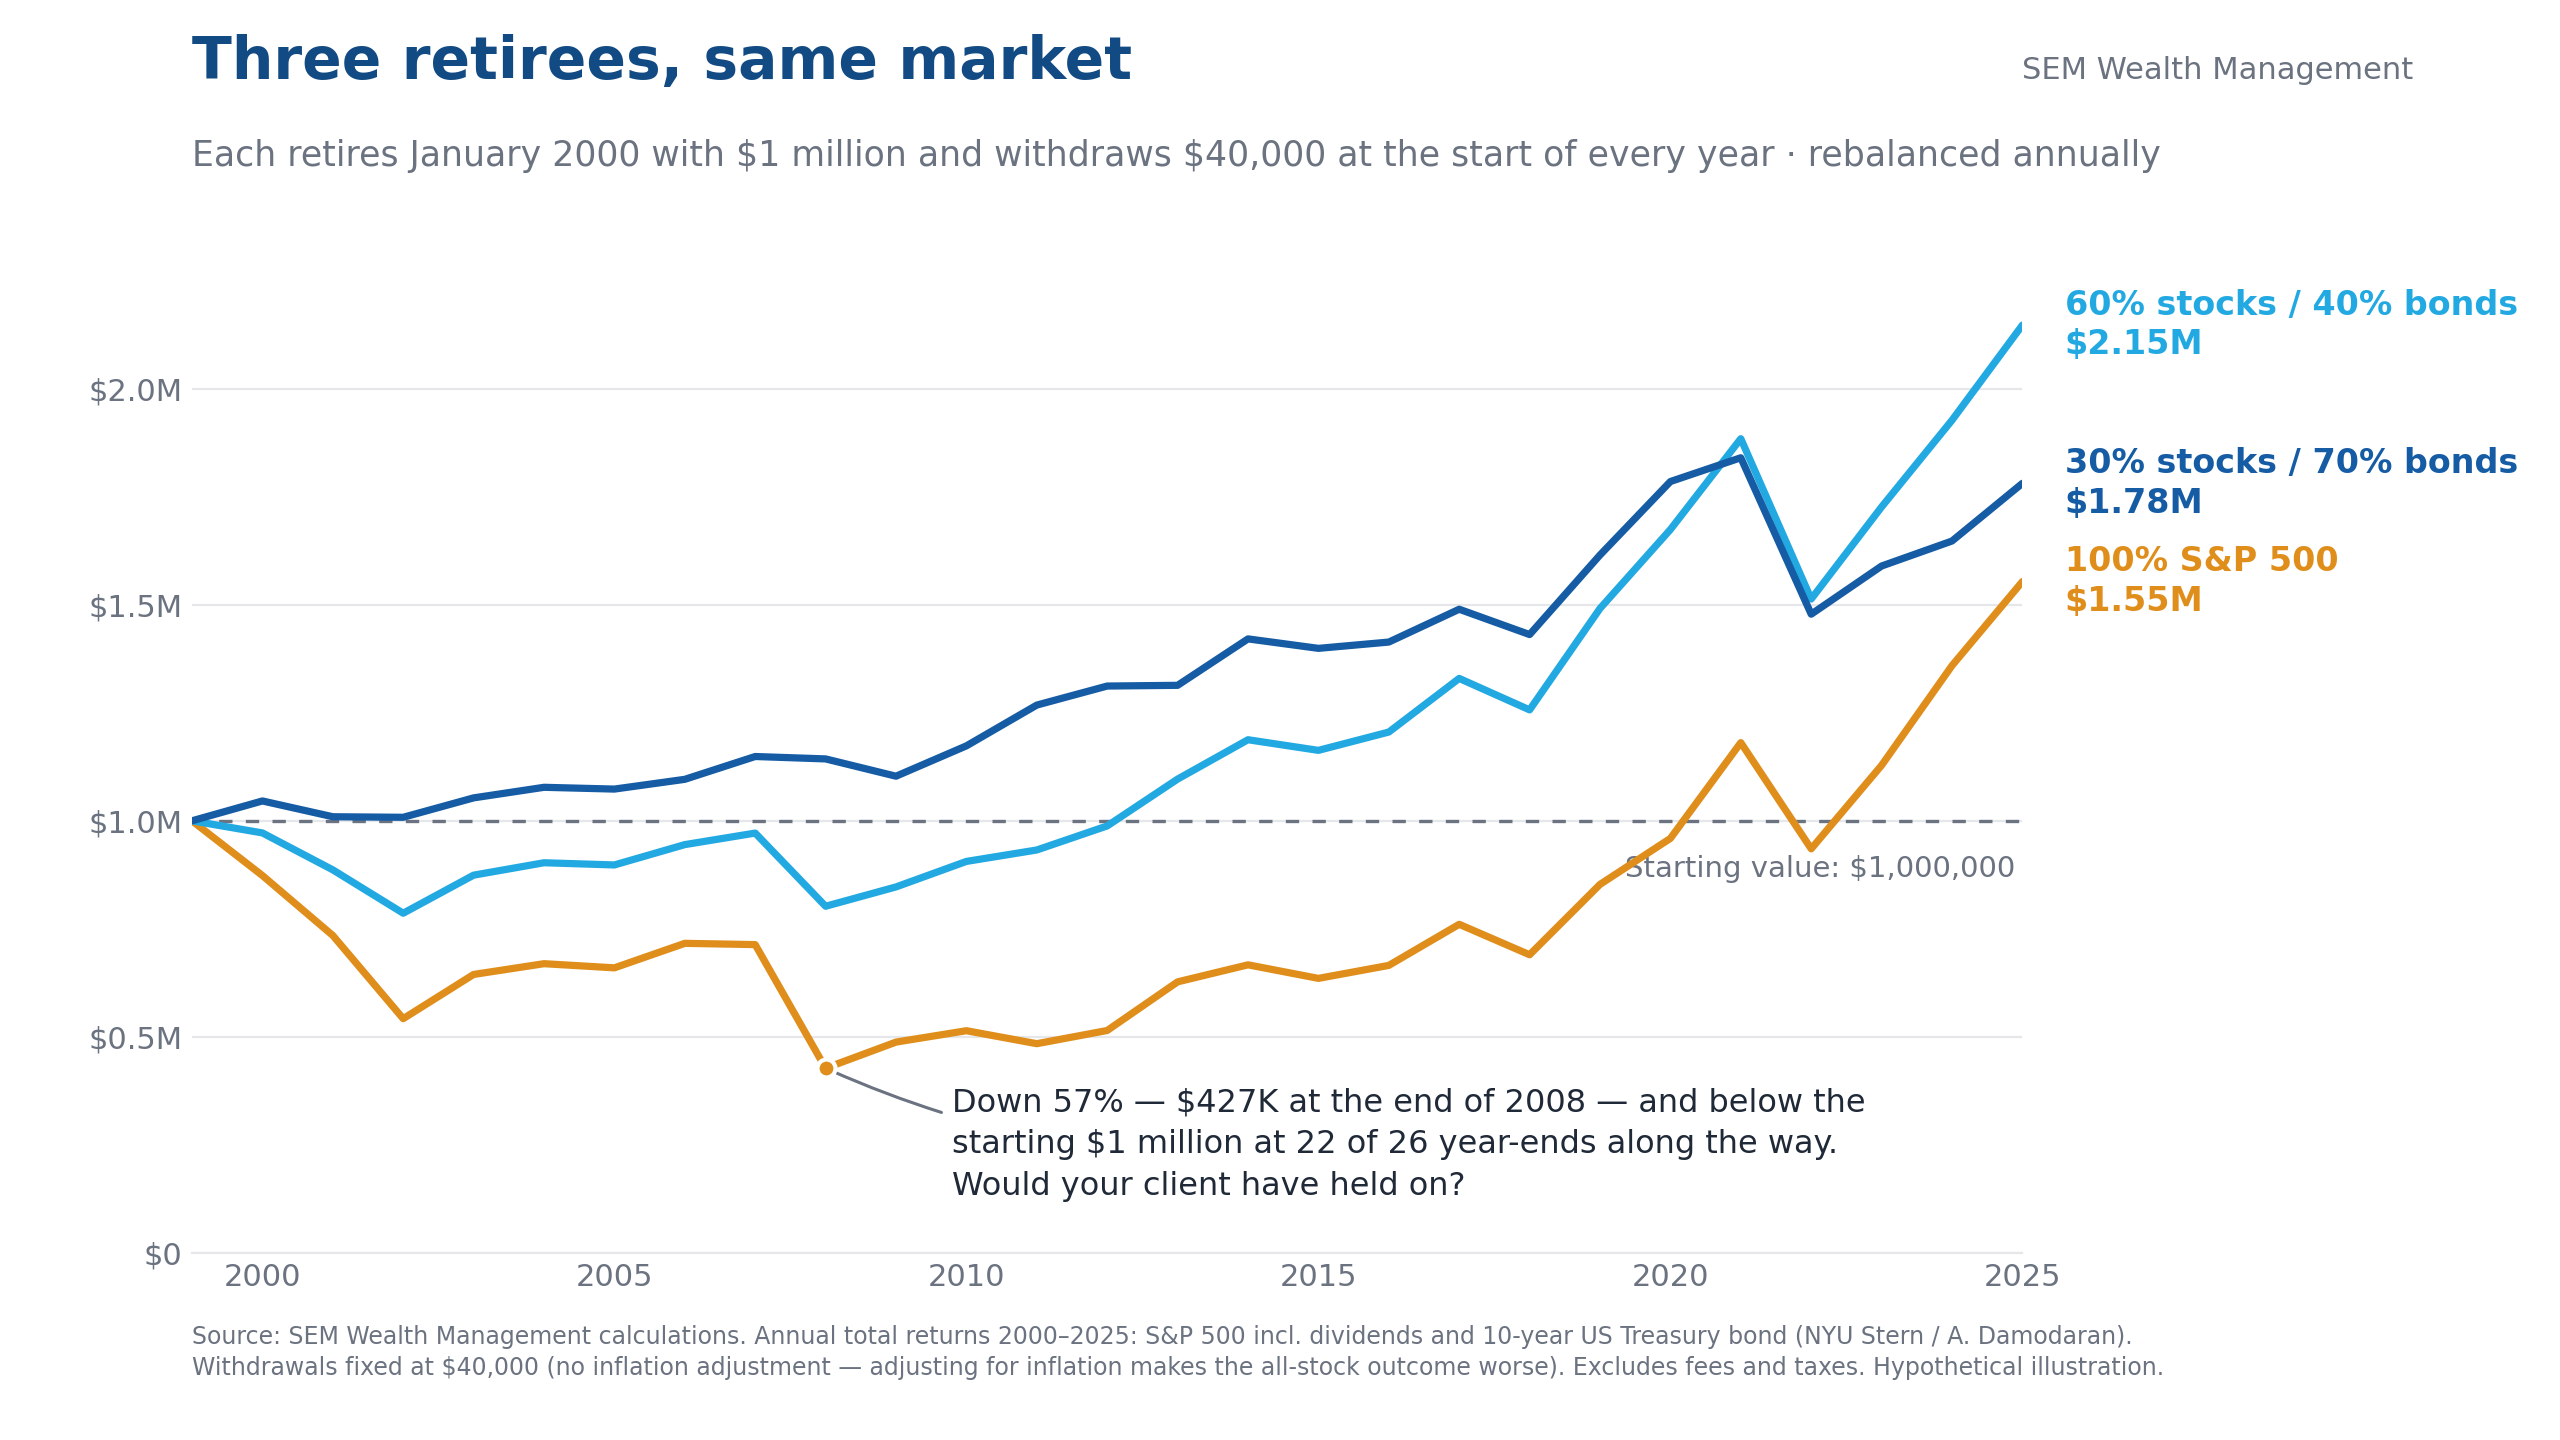
- If you don't need the money for 15 years or more (and have the personality to IGNORE the negativity that comes during a recessionary bear market), even a "crash" is simply noise.
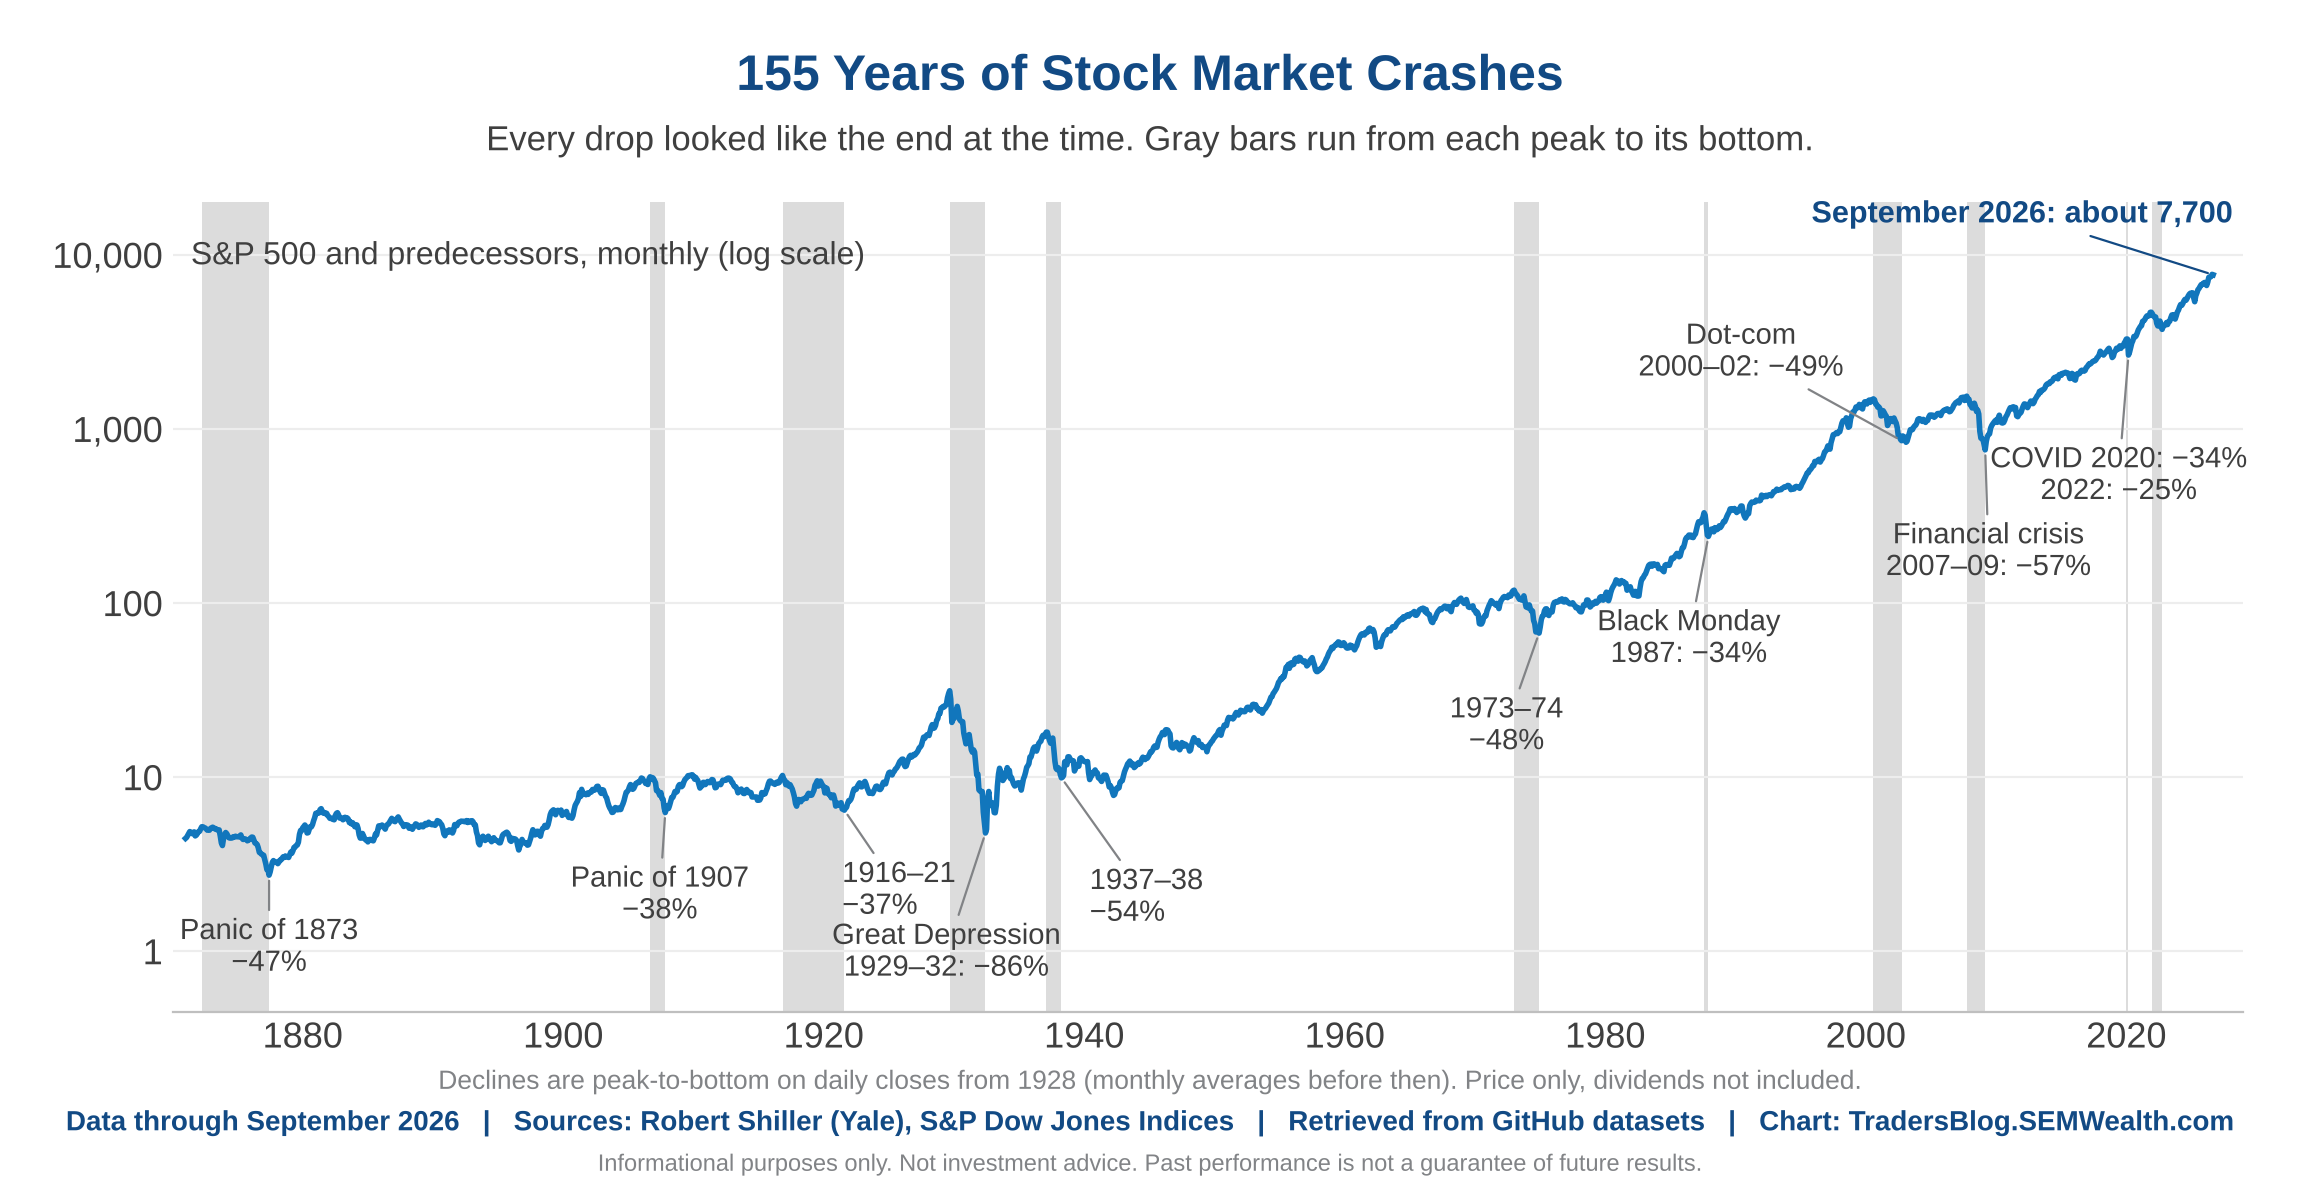
What we've learned from past cycles is a normal, healthy correction can turn into a "crash" in the right conditions. A good metaphor is freeway traffic. Everybody drives 80+ on I-64 (insert name of your freeways here), even conservative drivers like me, because nobody wants to get run over. We all KNOW we are driving too fast. We all KNOW there are consequences if we get caught, but we justify our speeds as "just keeping up with traffic". Then someone spots a gray car in the median, the brake lights go on, and if everyone is going too fast and following too closely you get a pileup... even if that gray car was just a broken-down SUV. The accident comes from the SPEED, not the trigger. In markets the speed is borrowed money (both corporations and investors using leverage). I’m not saying we’re there yet, and it doesn’t have to be a crash, but conditions are RIPE for a crash.
Expanding on one of my bullet points above – nobody knows how it ends, but history tells us following the euphoric buildout, we will have a consolidation phase (it doesn’t have to crash, but it might). It’s after that phase where the real opportunities come in and we see the actual economic improvements from the “invention”. This has been true of railroads, electricity, radio/broadcasting, mainframe computing, and broadband. Compared to past cycles we are pretty early in the cycle (in terms of the number of years). Of course we’ve never seen something where this much money has been “invested” this rapidly, so it’s possible the timing of the “consolidation” is also sped up.
The good news is we don’t have to guess when/if it happens. Our systems follow the trends, not the headlines. In September our tactical high yield system moved to money market. That isn’t a crash prediction, it’s just the system doing its job when the trend in riskier bonds turned lower (and it can jump right back in when the trend improves). Our other models are still invested, and each one has triggers to take money off the table if the trends break. [Note: our quarterly "Core Rotation System" inside AmeriGuard last week reduced all of our small cap positions and Cornerstone cut its small cap by about half, with both moving that to more of a "total stock market" position. We maintained our emerging markets holdings.]
The goal of all of our models has always been to stay invested as long as possible, but when the inevitable overreaction to the downside happens, to take money off the table so you don’t have to worry about it.
The Fed's Fight Between Rate of AI Capex Spending
The Fed's ongoing fight with deciphering the rate-sensitivity of AI capex spending and the perpetual growth exposure and acceptance across continues, especially in ex-tech.
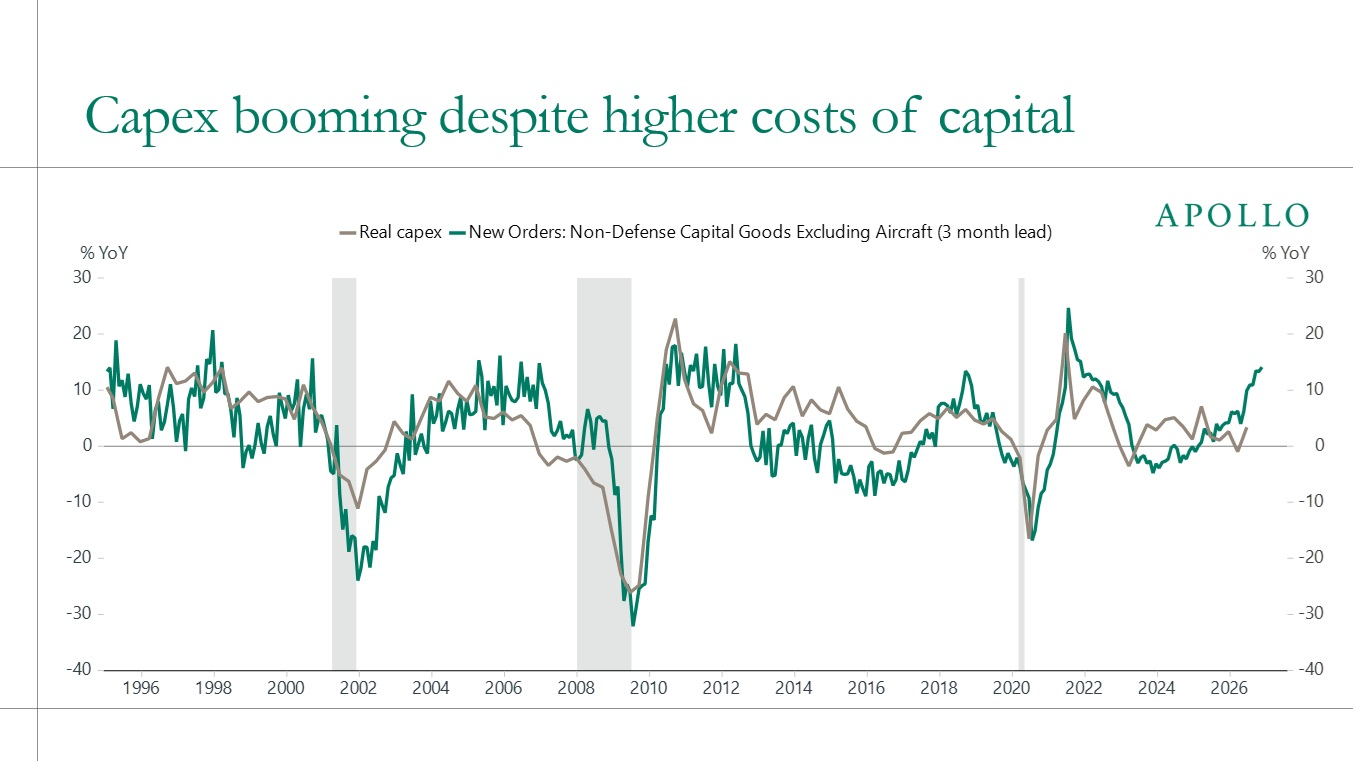
History shows that when interest rates rise and borrowing costs increase, people's purchasing power declines. Think about buying a house or a car, for example.
Looking at the data center build-out plan or initiative across the nation, the consensus shows that expectations will continue to rise.
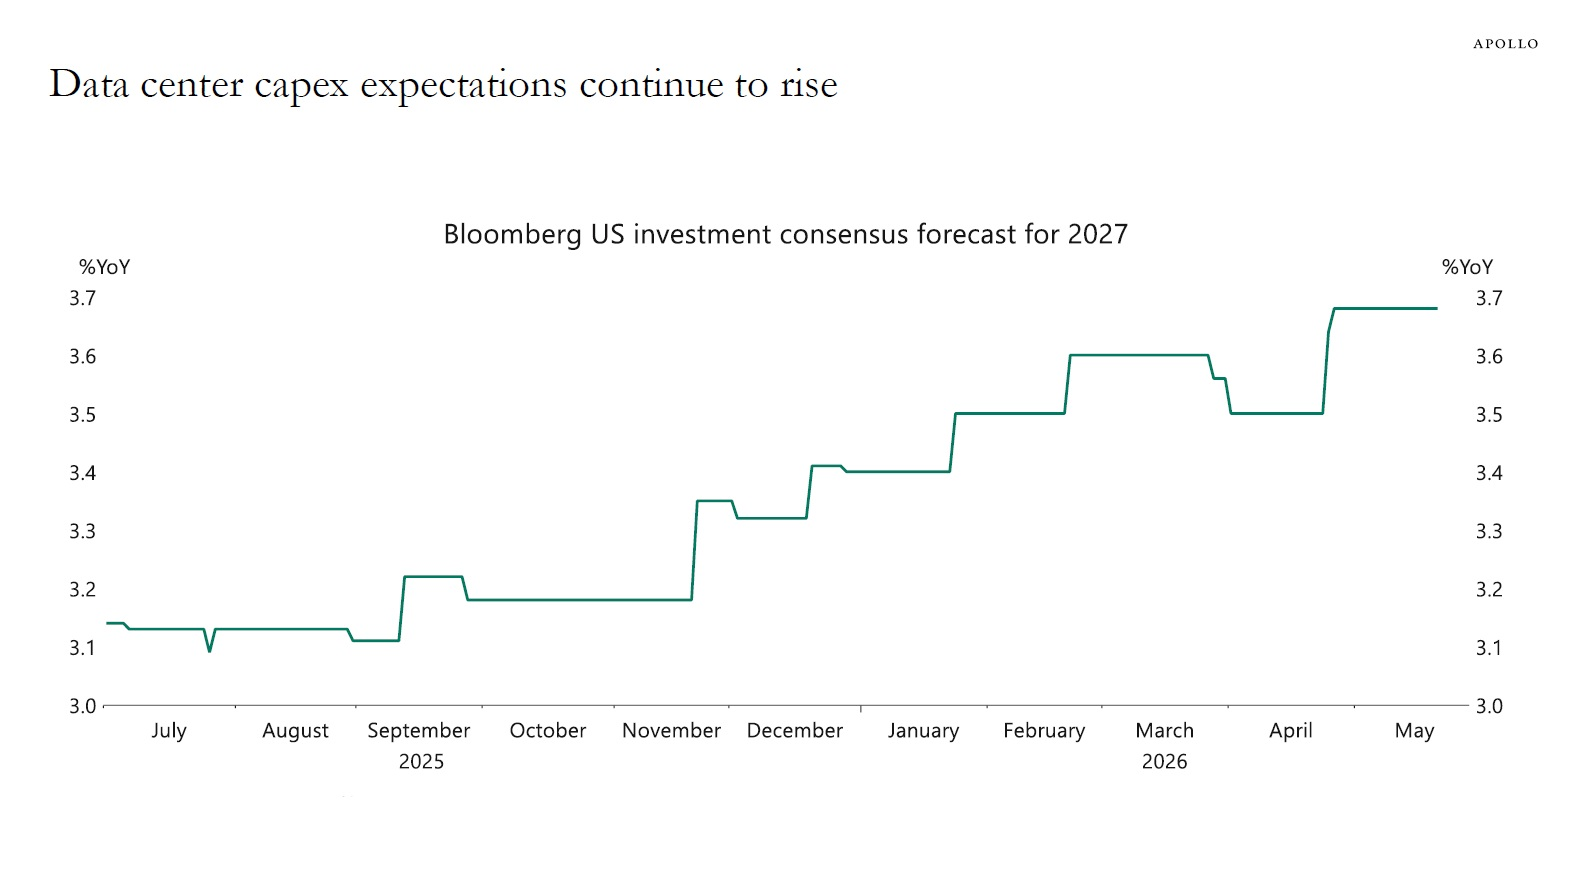
What could this mean? Rates could remain elevated or even rise further because monetary policy has a limited impact on containing the sectoral imbalance and the behavior driving that spending.
Market and Economic Data
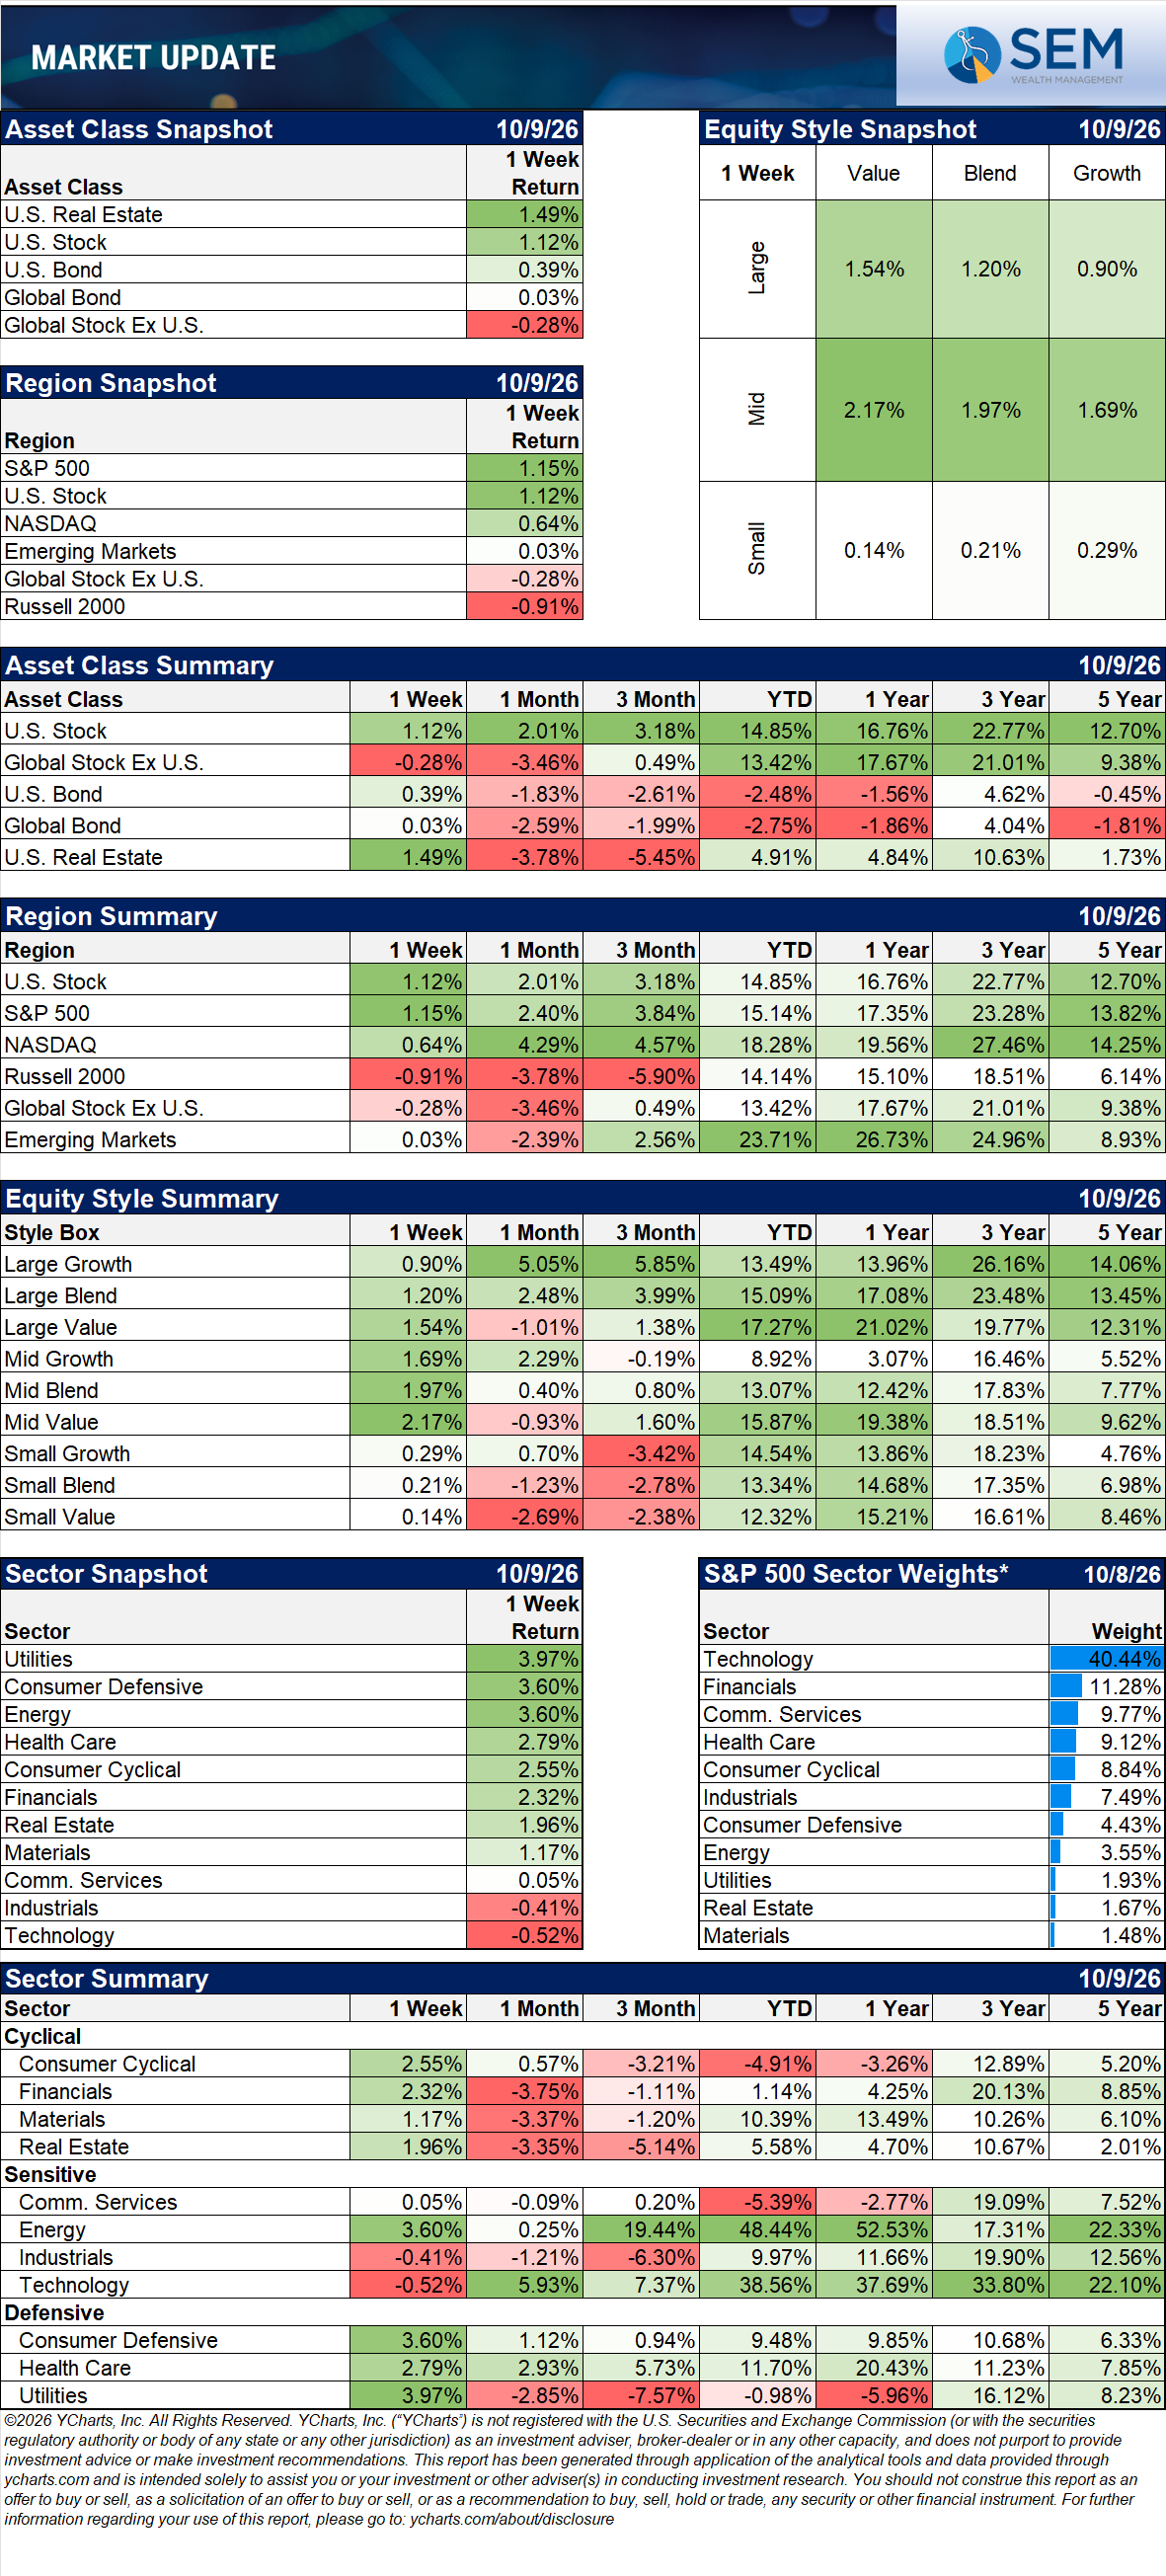
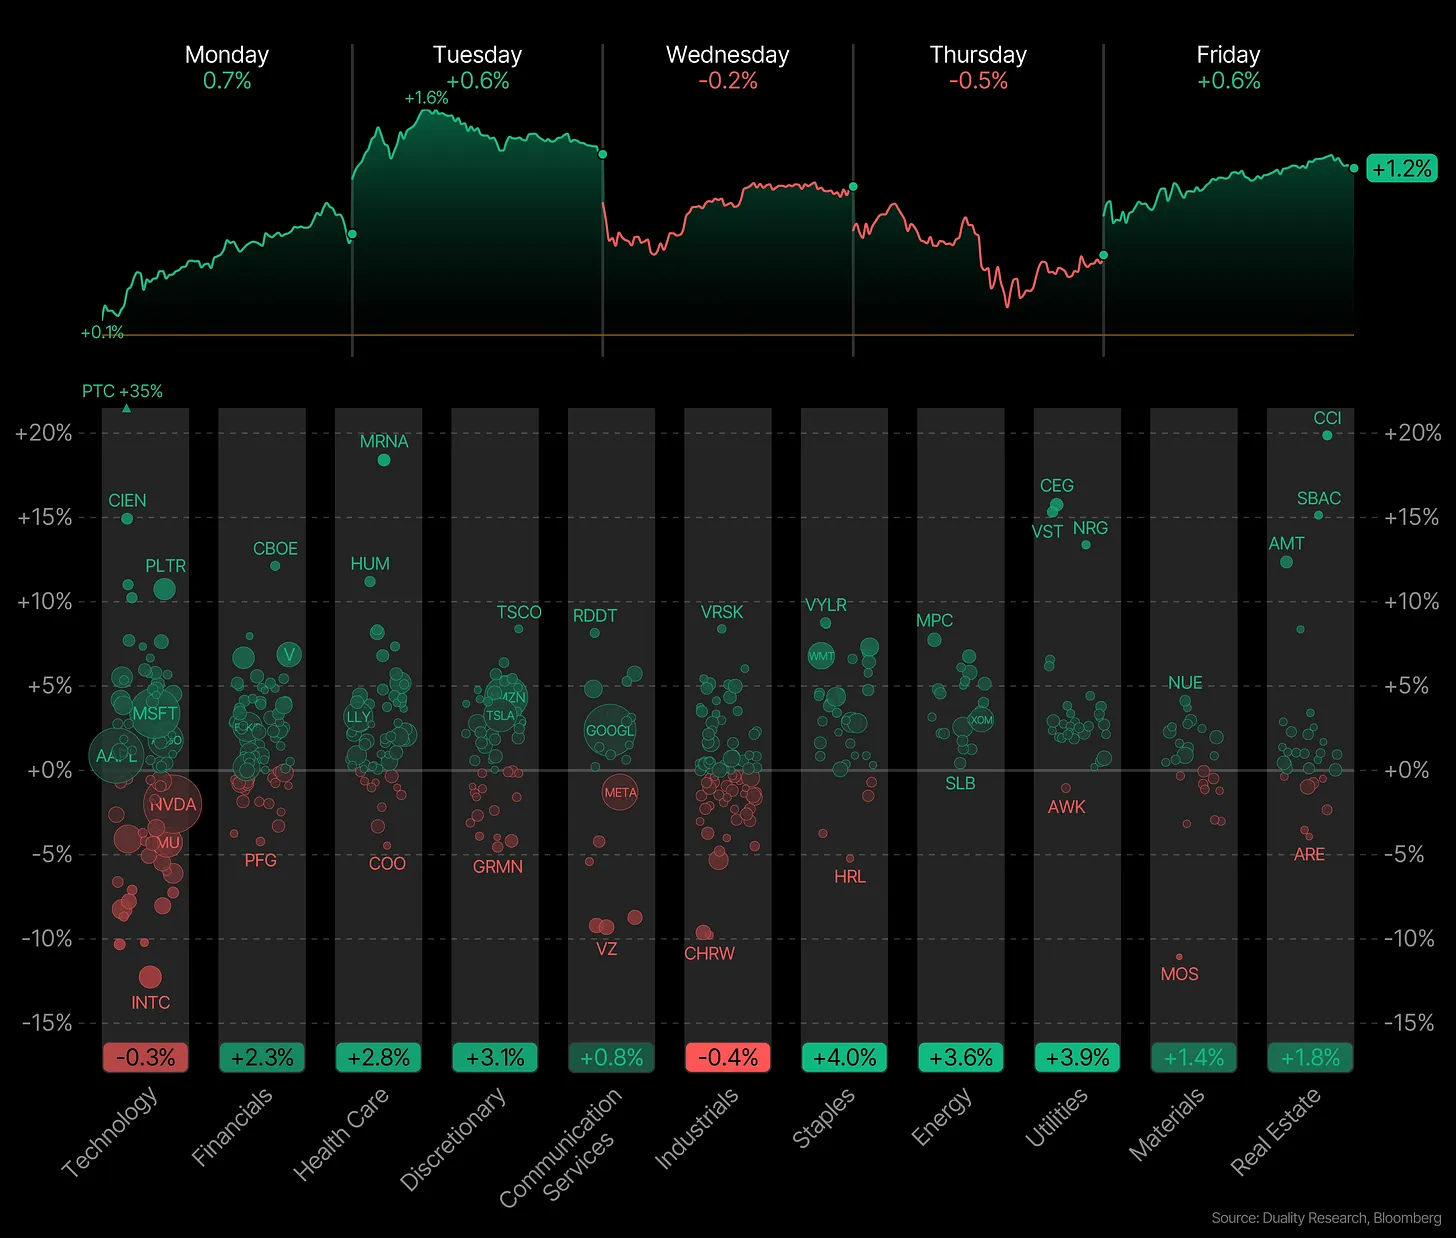
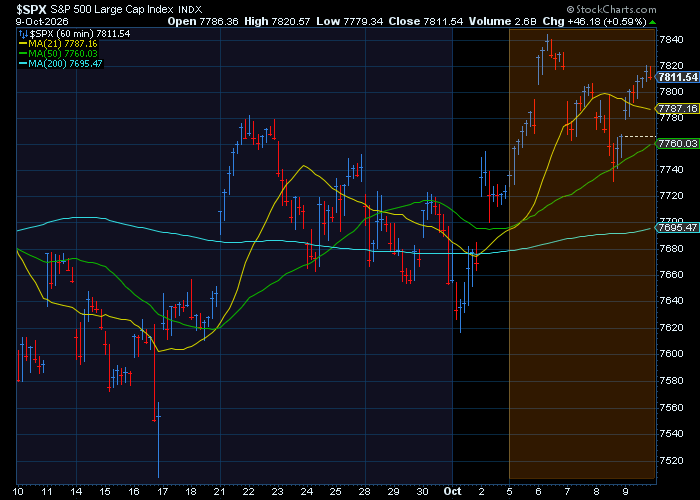
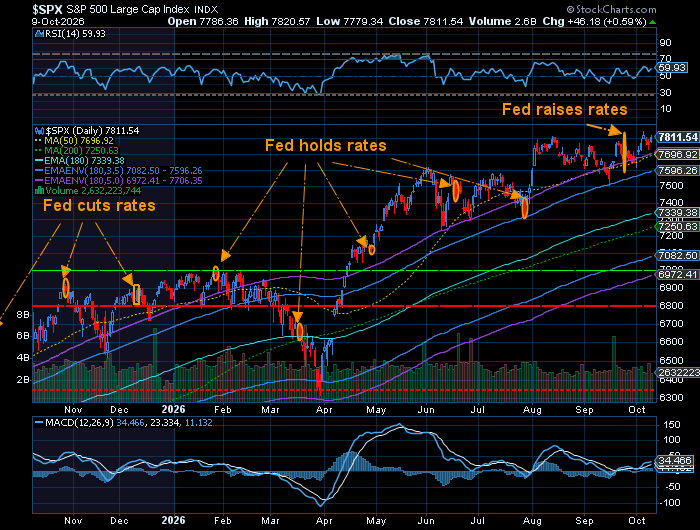
U.S. stocks advanced last week, with a strong start lifting the S&P 500 and Nasdaq to record highs. Small caps continued to lag, with the Russell 2000 down 5.7% over the past five weeks amid concerns about elevated interest rates. Treasury yields eased but remain high, as the 10-year closed at 5.24% and the 30-year at 5.60%.
Minutes from the Federal Reserve’s September meeting, when it raised rates for the first time since 2023, showed policymakers anticipate possibly raising them again before year-end. Consumer sentiment weakened, with the University of Michigan’s preliminary October reading falling to 46.3, a five-month low, on persistent inflation worries.
Attention now turns to inflation data and third-quarter earnings.
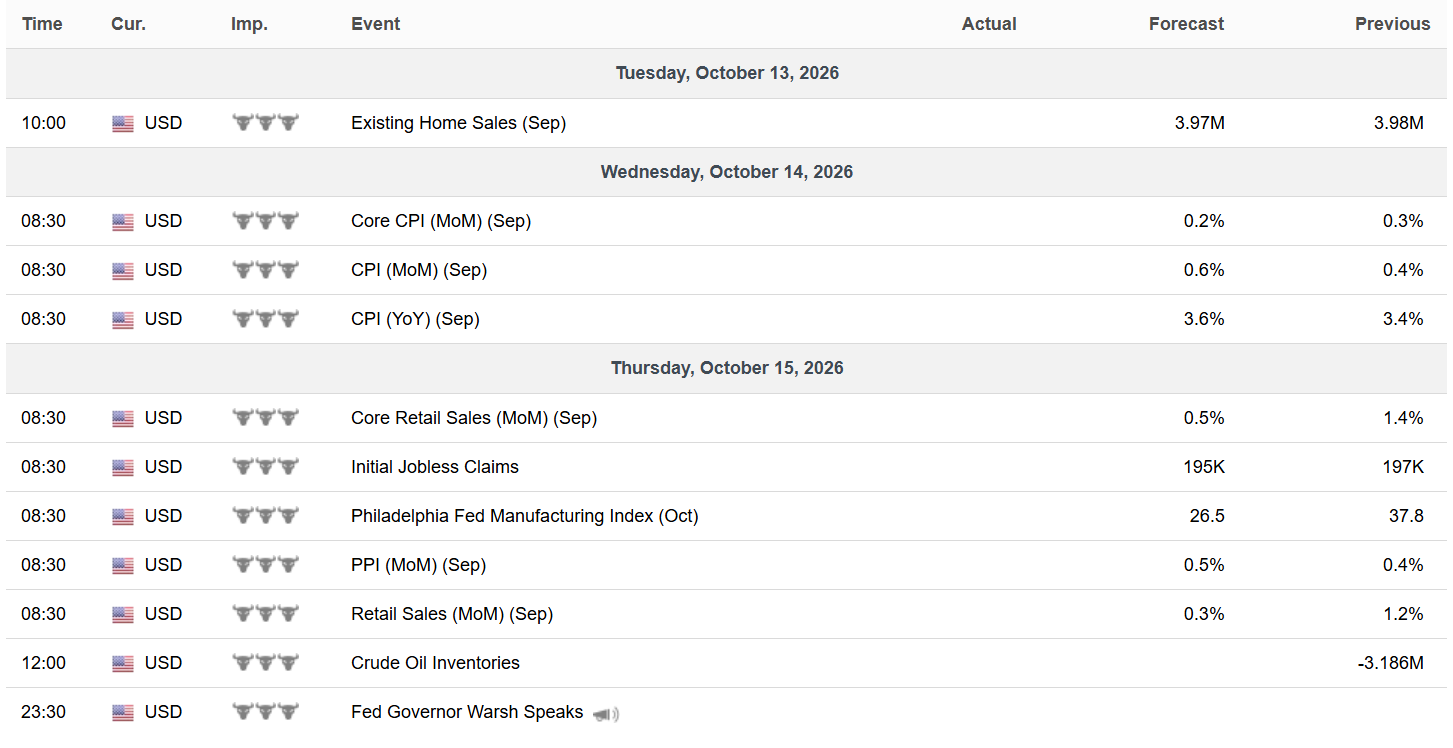
- Wednesday’s consumer price index will be a key data point for the Fed ahead of its policy meeting that ends October 28. The prior report showed inflation at 3.4% annually in August, well above the Fed’s 2% target. Producer prices and retail sales follow on Thursday.
- Earnings season begins Tuesday with JPMorgan Chase, Goldman Sachs, Wells Fargo, and Citigroup, along with Johnson & Johnson and UnitedHealth Group. Expectations are high: analysts project S&P 500 earnings growth of 29.6%, which would mark a third consecutive quarter above 25%.
US Unemployment Rate data by YCharts
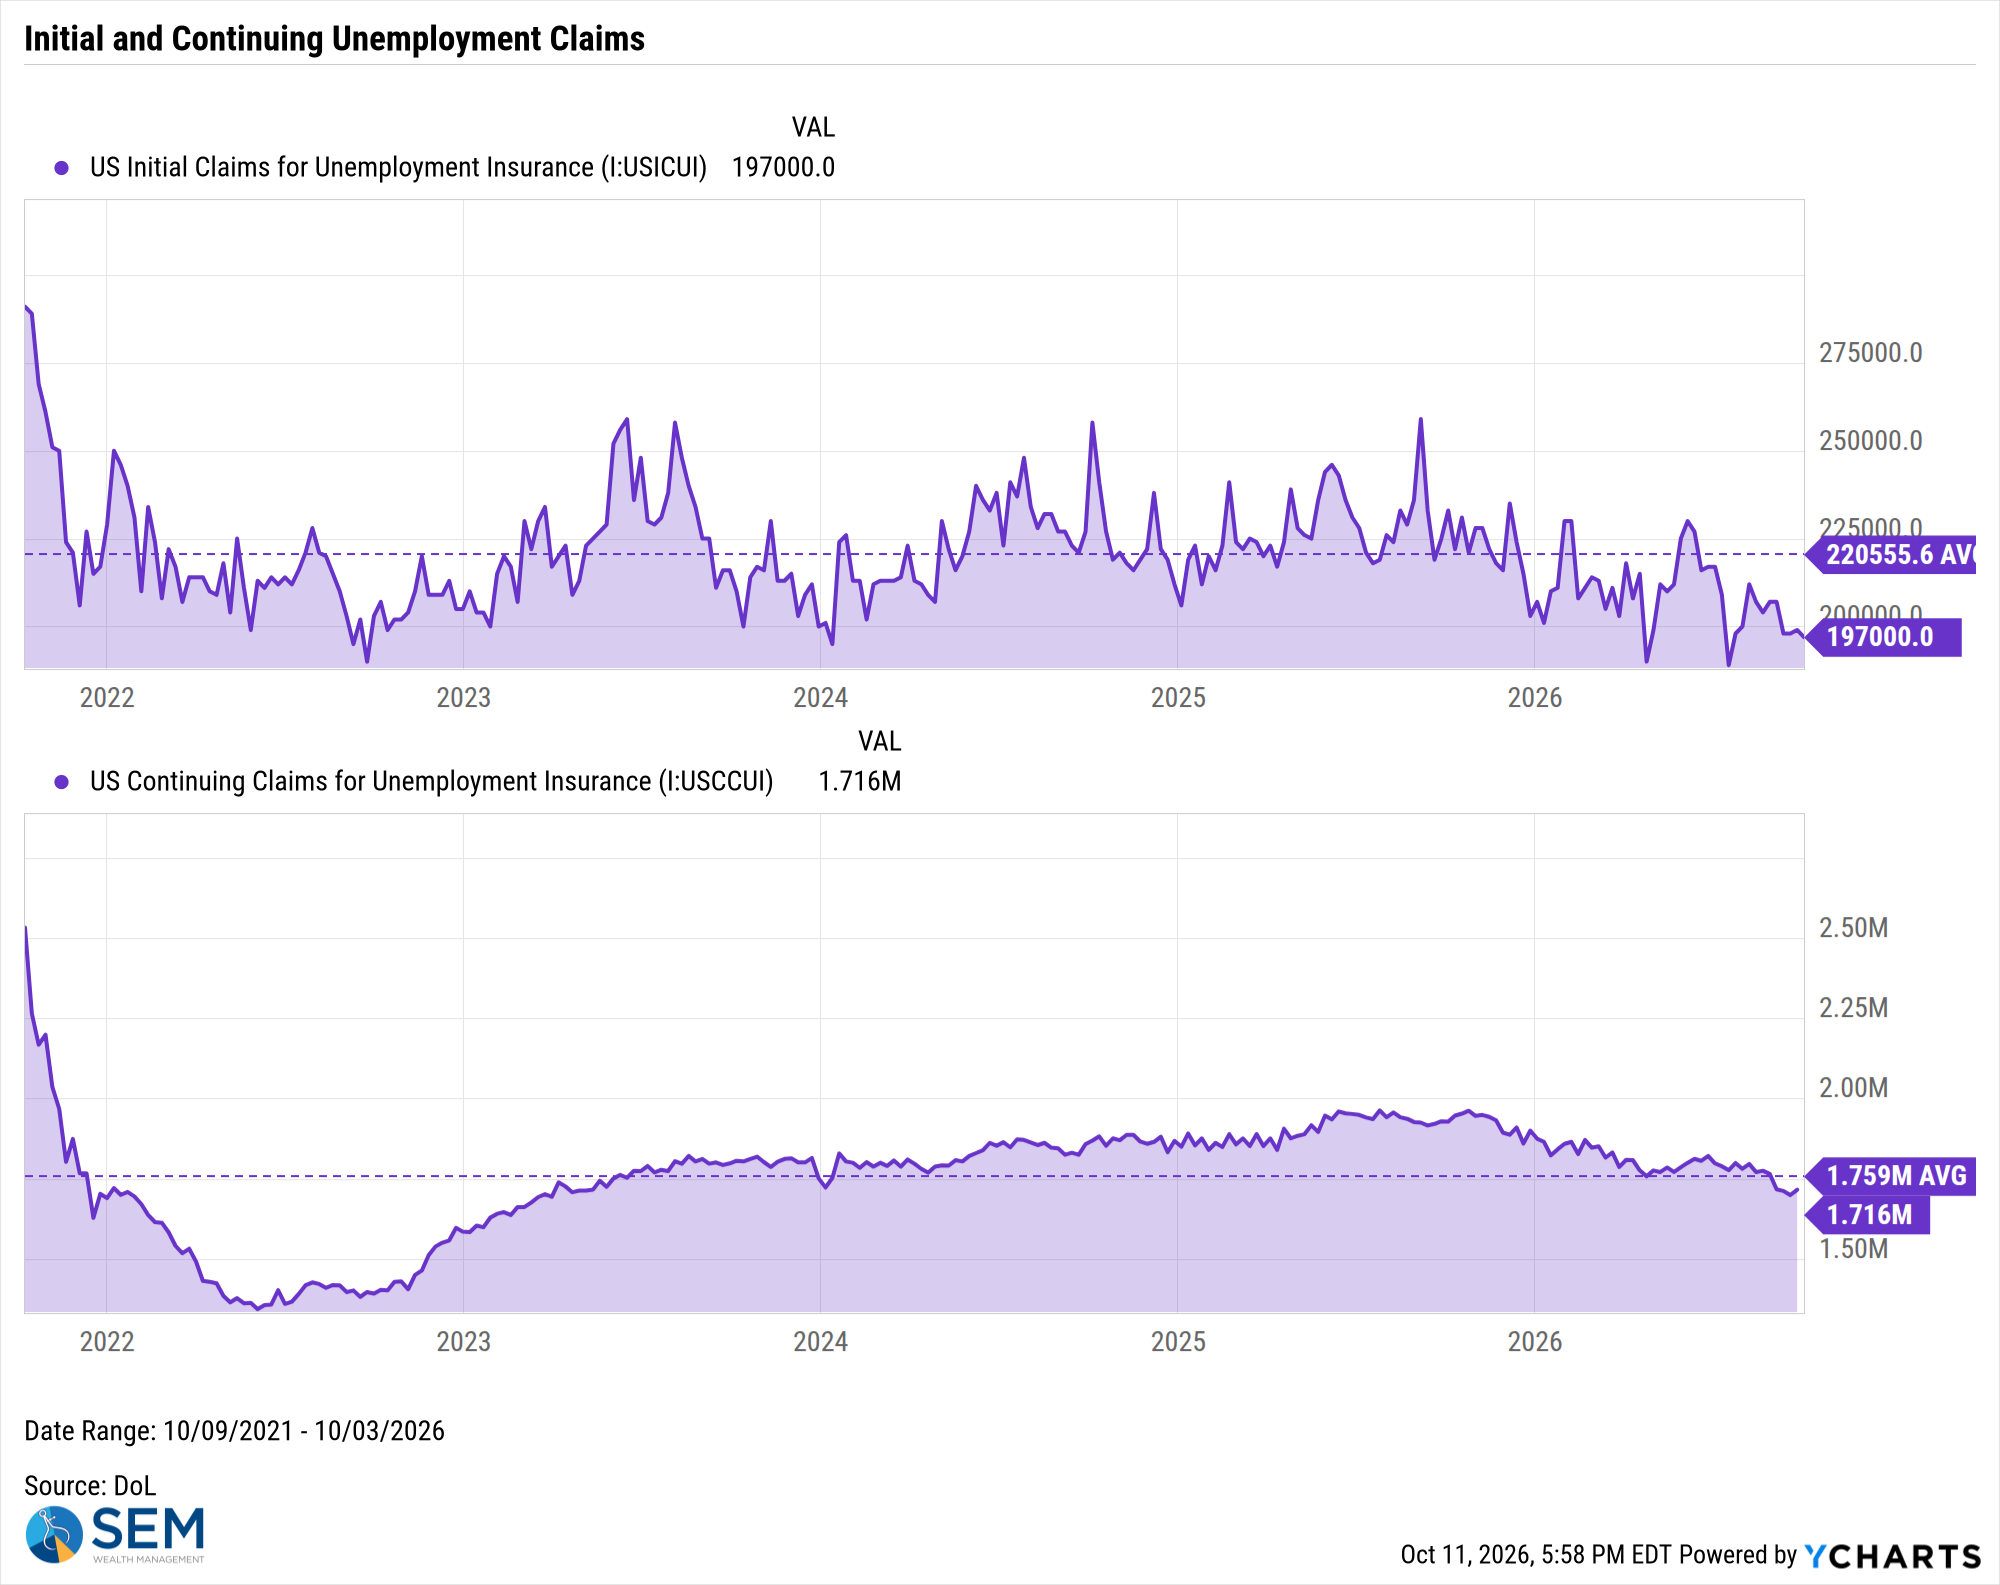
US Initial Claims for Unemployment Insurance data by YCharts
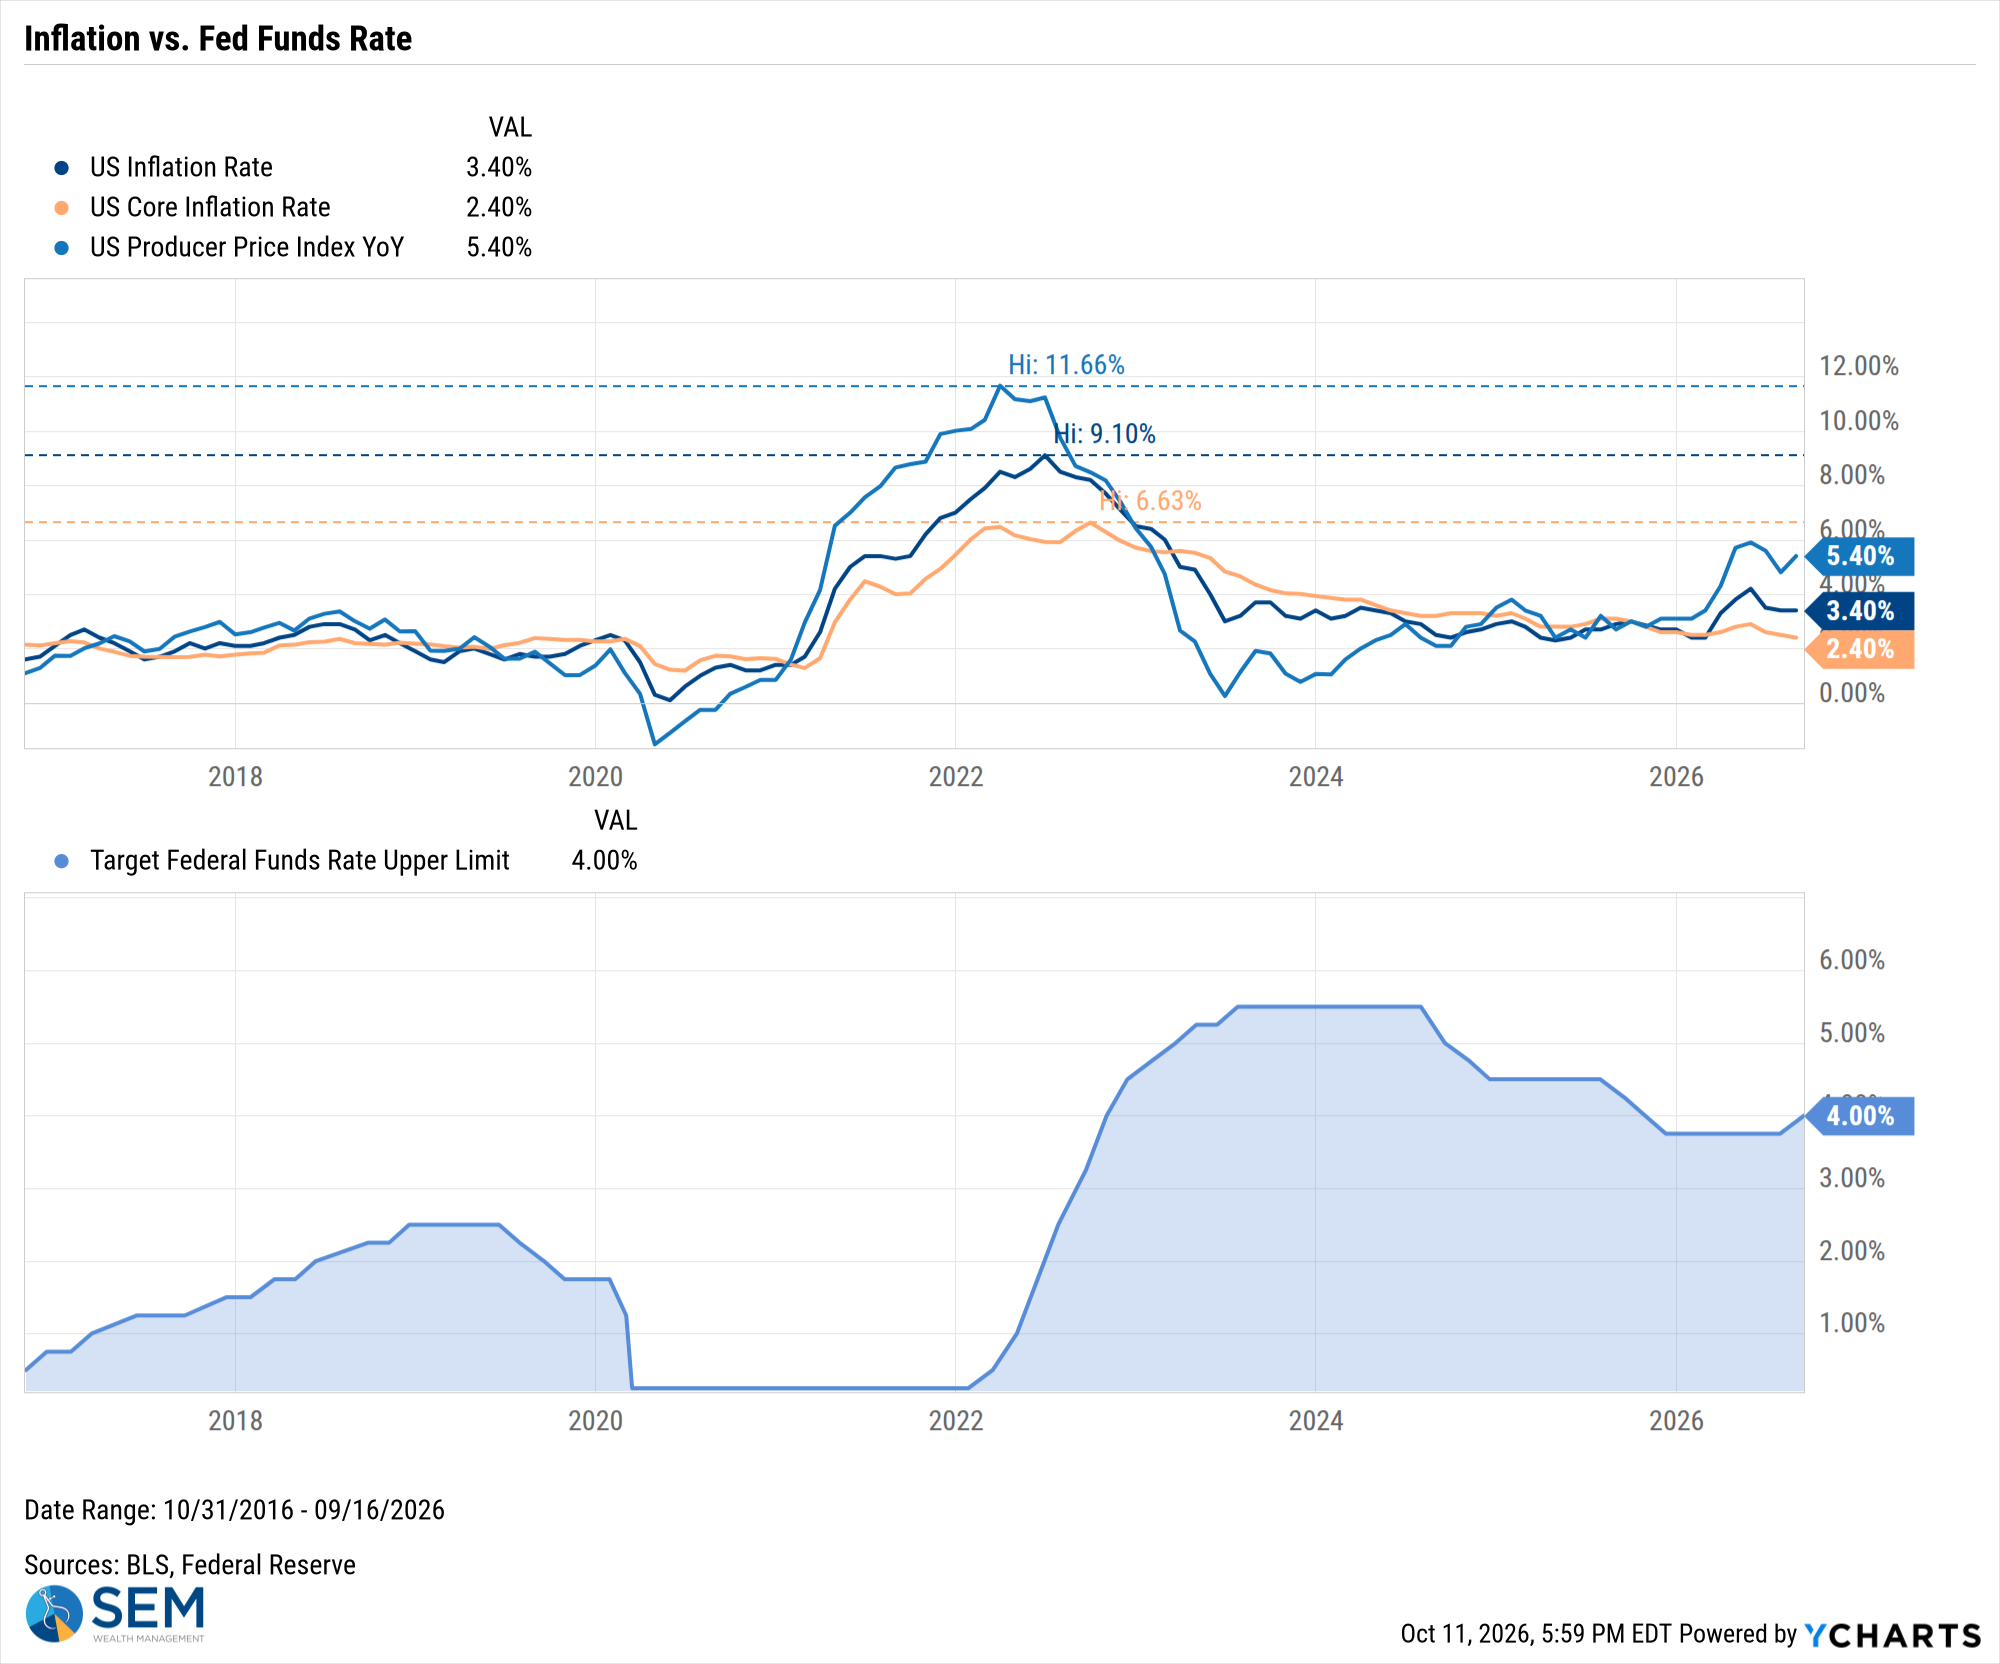
US Inflation Rate data by YCharts
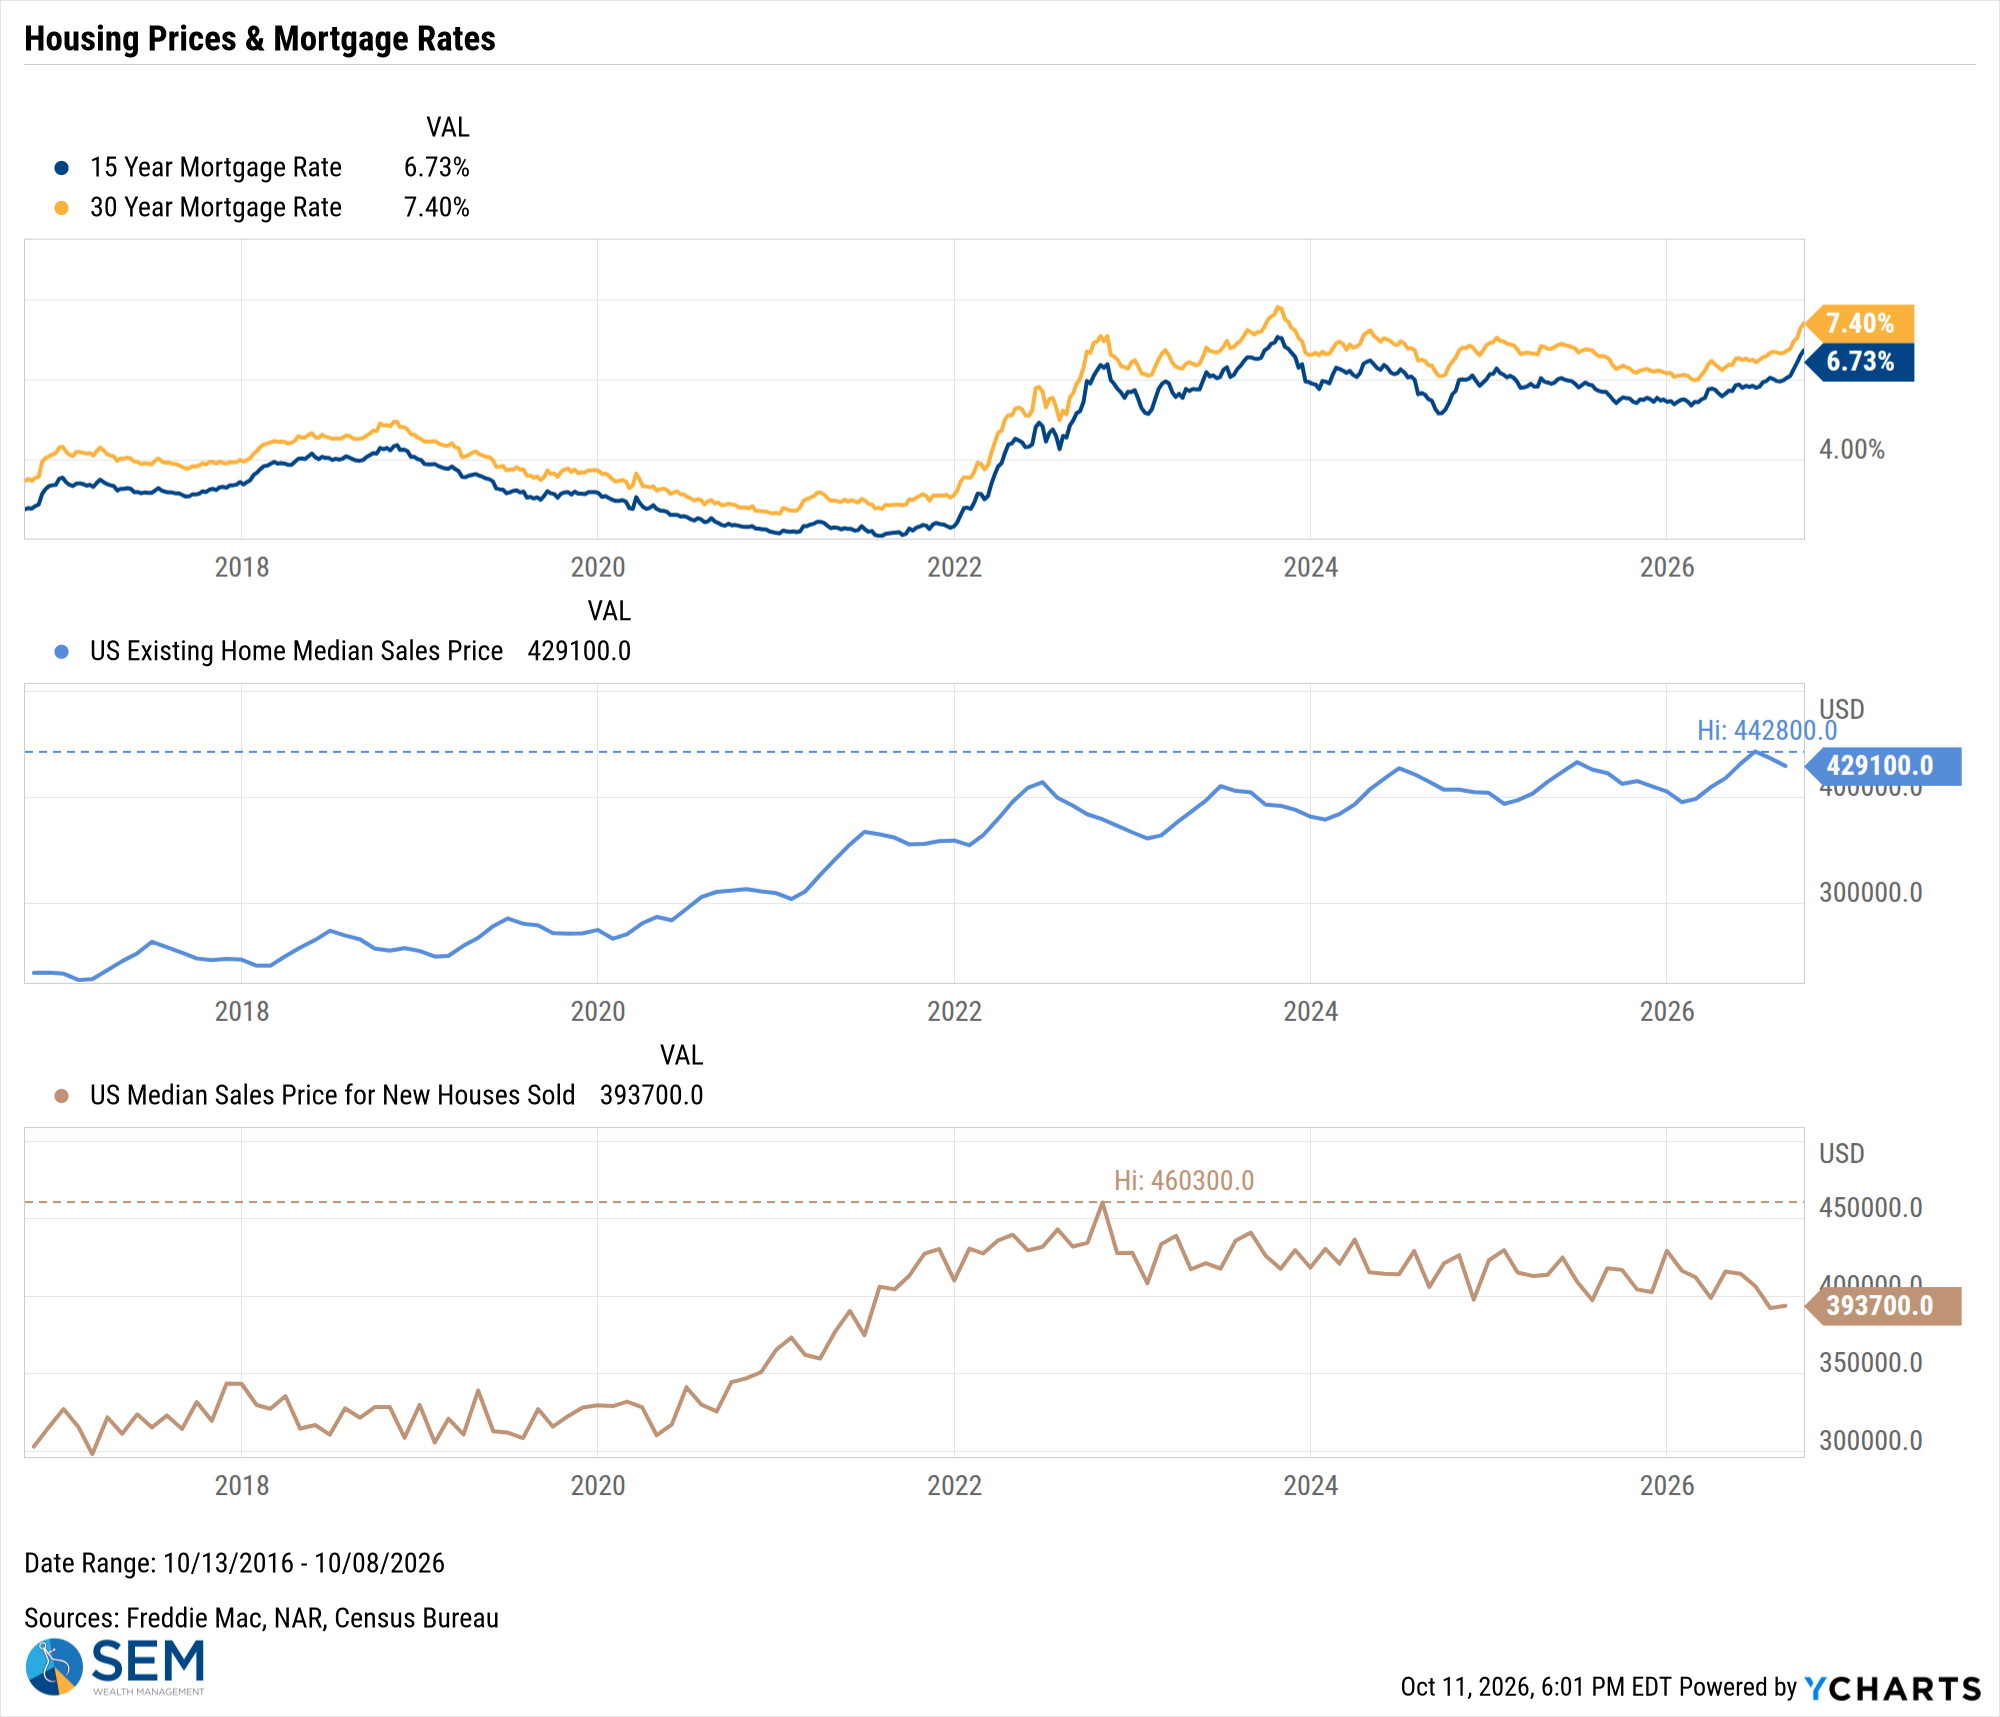
US Existing Home Median Sales Price data by YCharts
SEM Market Positioning
SEM deploys 3 distinct approaches – Tactical, Dynamic, and Strategic. These systems have been described as 'daily, monthly, quarterly' given how often they may make adjustments. Here is where they each stand.
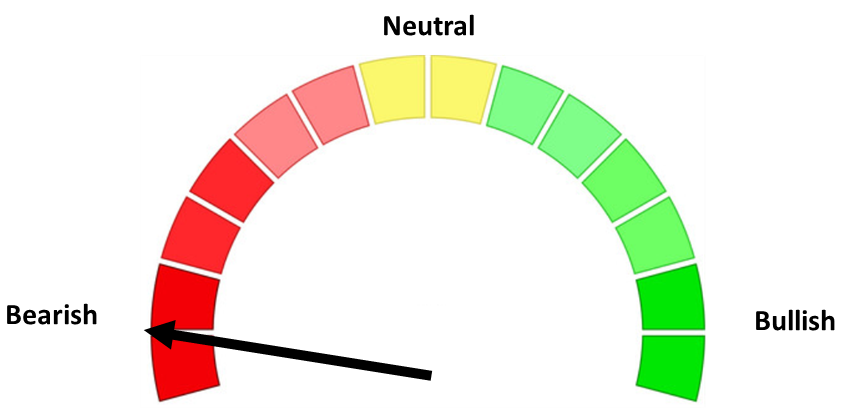
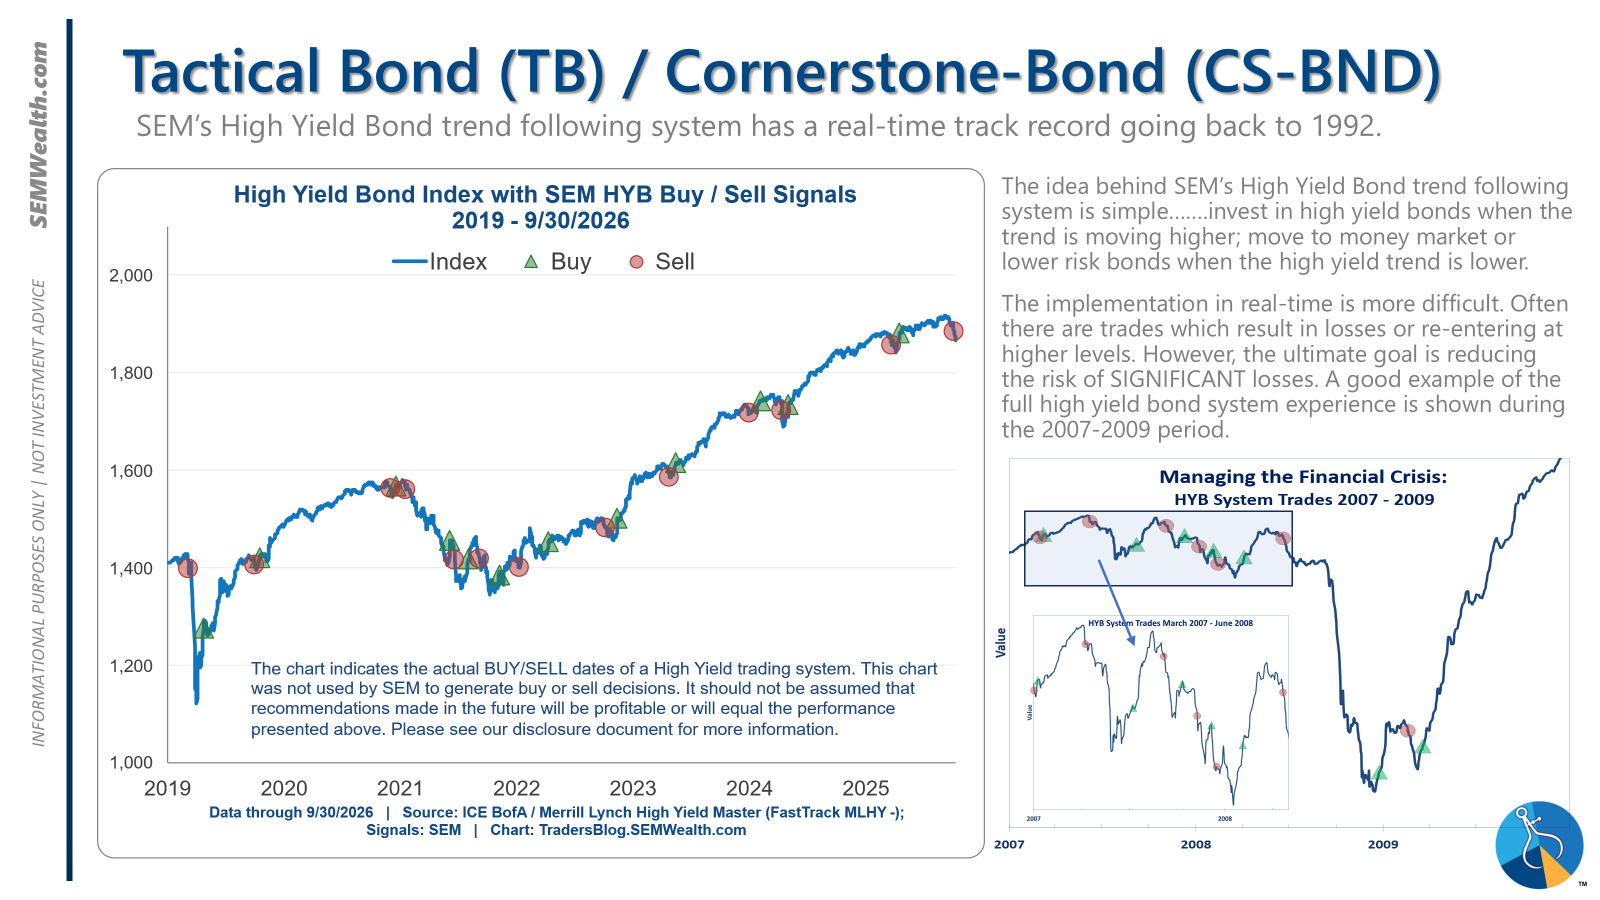
- Tactical = BEARISH (9/24/26) | 100% Money Market / Short Term Bonds (9/24/26) | High-yield trends reversed lower with spreads near historic lows.
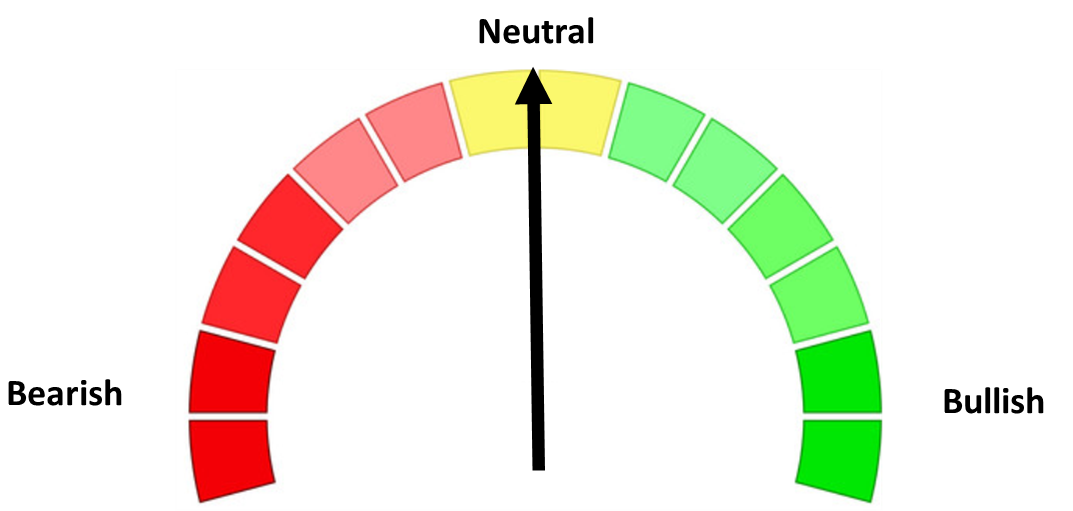
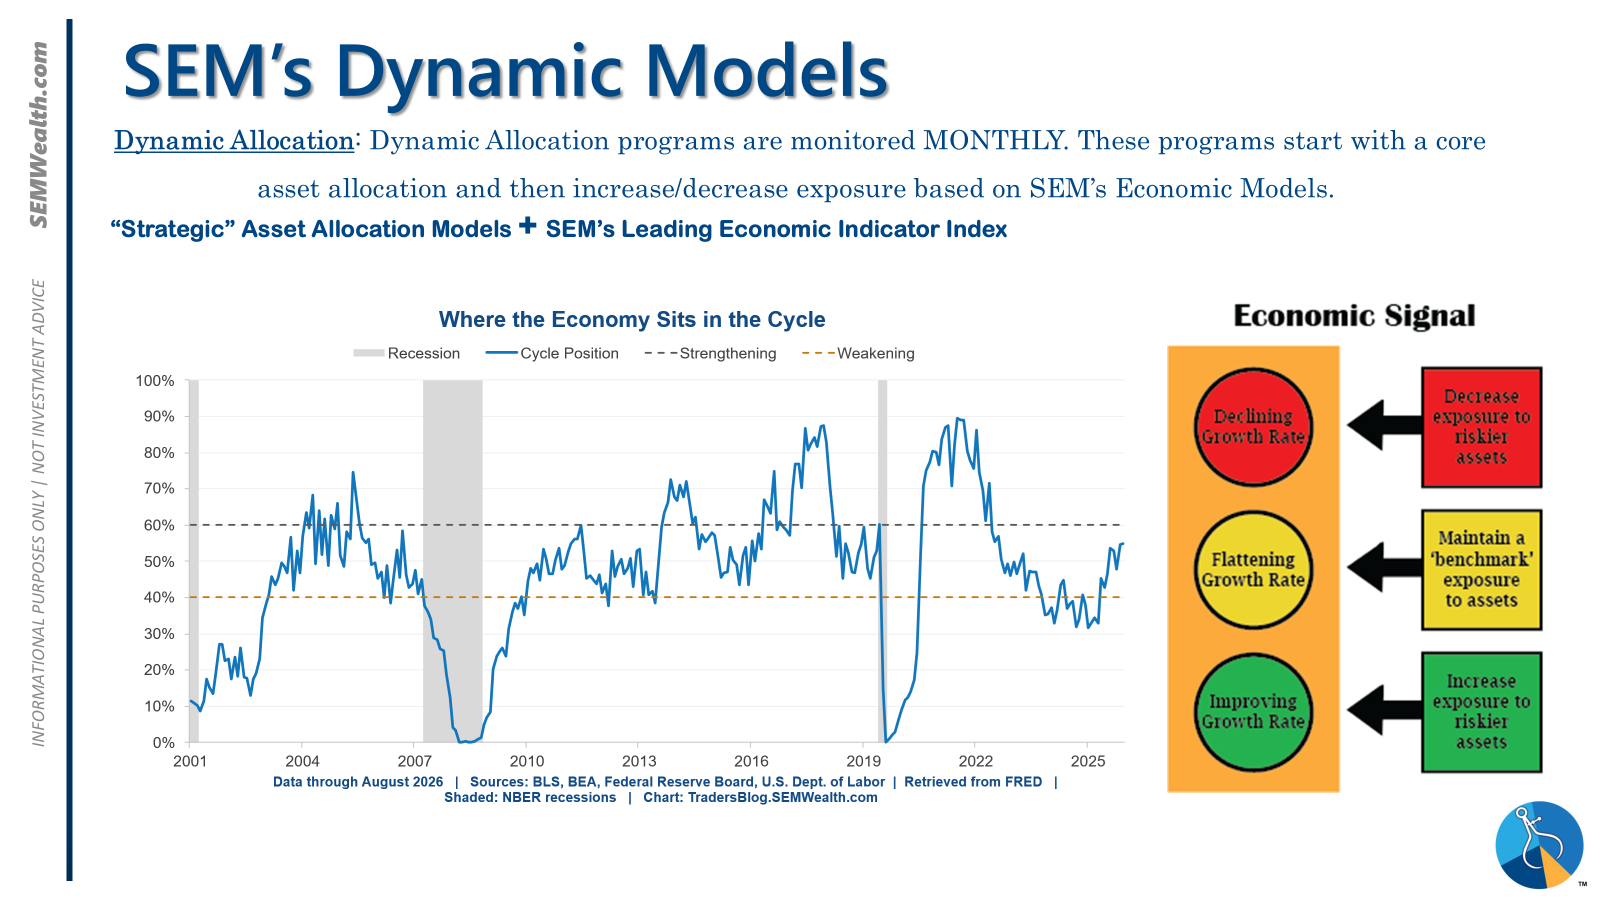
- Dynamic = NEUTRAL (2/15/2026) | "Benchmark" Allocation | Economic model inconclusive
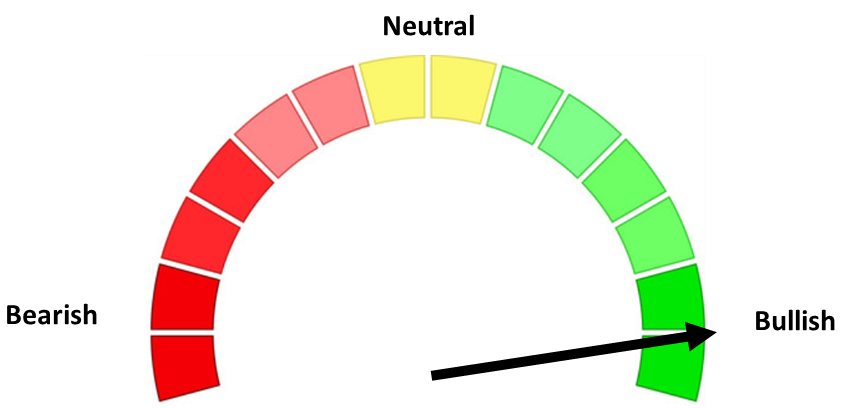
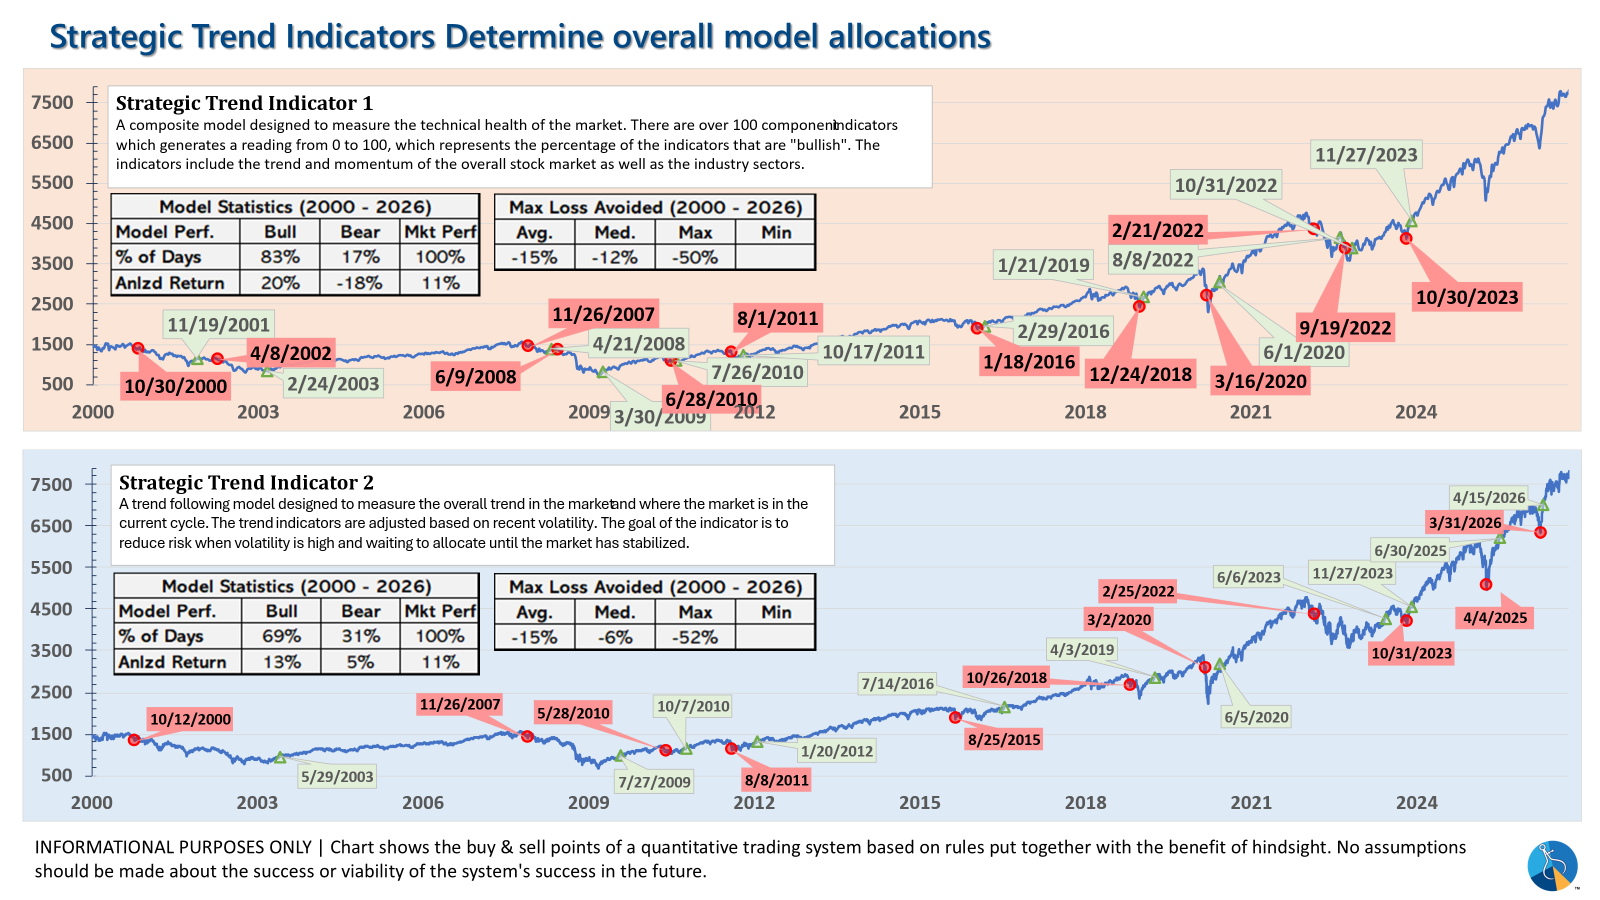
- Strategic = BULLISH (4/15/2026) | V-Bottom projecting "end" of Iran War
Tactical (daily):
- Monitored DAILY
- Models: Tactical Bond, Cornerstone Bond, Income Allocator, Tax Advantaged Bond
- Designed to follow the trends for use in our lower risk models
- SELL Signal issued September 24, 2026 (exiting the buy from April 8, 2026)
Dynamic (monthly):
- Monitored MONTHLY
- Models: All "Dynamic" Models (Income, Balanced, Growth, and Asset Allocator)
- Uses SEM's Quantitative Economic Model
- Designed to overweight riskier assets if economic trend is higher & underweight those assets if economic trend is lower.
- NEUTRAL signal issued February 15, 2026 (following BEARISH signal from July 2025)
Strategic (quarterly)*:
- Monitored QUARTERLY
- Models: AmeriGuard (Balanced, Moderate, & Growth) and Cornerstone (Balanced & Growth)
- Core Component: Quantitative Filter using 4 different time horizons across universe of asset classes
- Trend Indicator: Two different Quantitative Systems monitoring the intermediate-term trend, health of the market, and volatility
- CORE has been overweight small cap and international since October 2025 – overweight increased slightly in January
- Both TREND INDICATORS are BULLISH following 10% drop and "V-Bottom" reversal in early April
- AmeriGuard & Cornerstone Max DO NOT use the Trend indicator and are always 100% invested in stocks using our CORE rotation model.
The core rotation is adjusted quarterly. This quarter we saw half of our international positions reduced (we sold developed markets and kept our emerging markets exposure). We also saw the remaining share of mid-cap reduced in favor of more small cap exposure. We remain with a "barbell" core portfolio – about half in large cap and half in small cap as the models expect the market to "broaden".
The * in quarterly is for the trend models. These models are watched daily but they trade infrequently based on readings of where each believe we are in the cycle. The trend systems can be susceptible to "whipsaws" as we saw with the recent sell and buy signals at the end of October and November. The goal of the systems is to miss major downturns in the market. Risks are high when the market has been stampeding higher as it has for most of 2023. This means sometimes selling too soon. As we saw with the recent trade, the systems can quickly reverse if they are wrong.
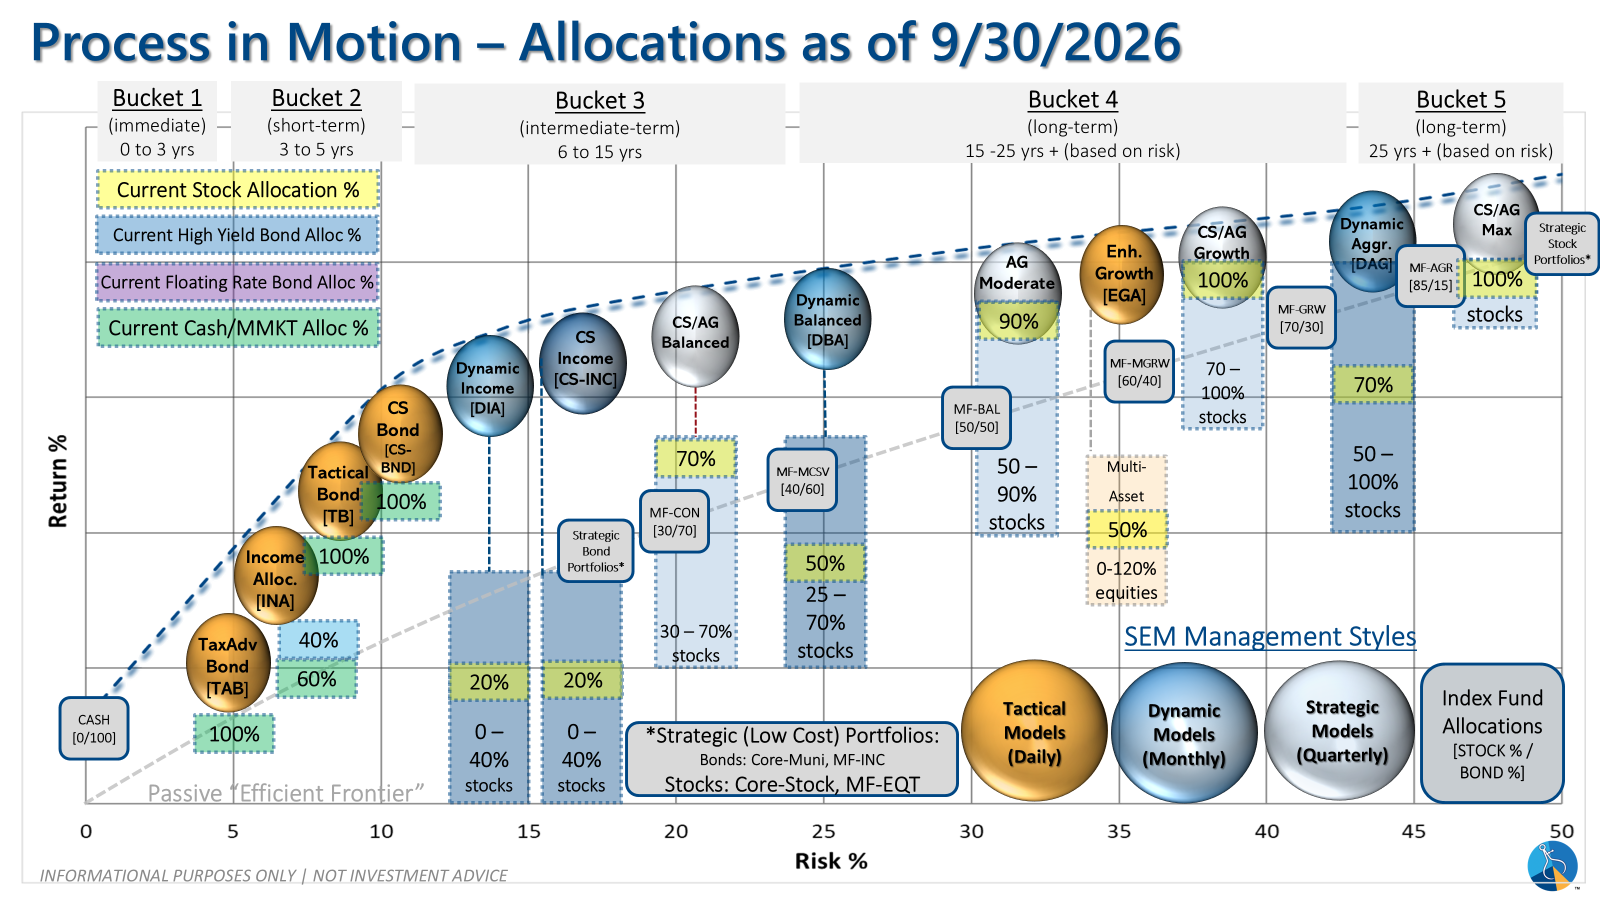
Overall, this is how our various models stack up based on the last allocation change:
Curious if your current investment allocation aligns with your overall objectives and risk tolerance?