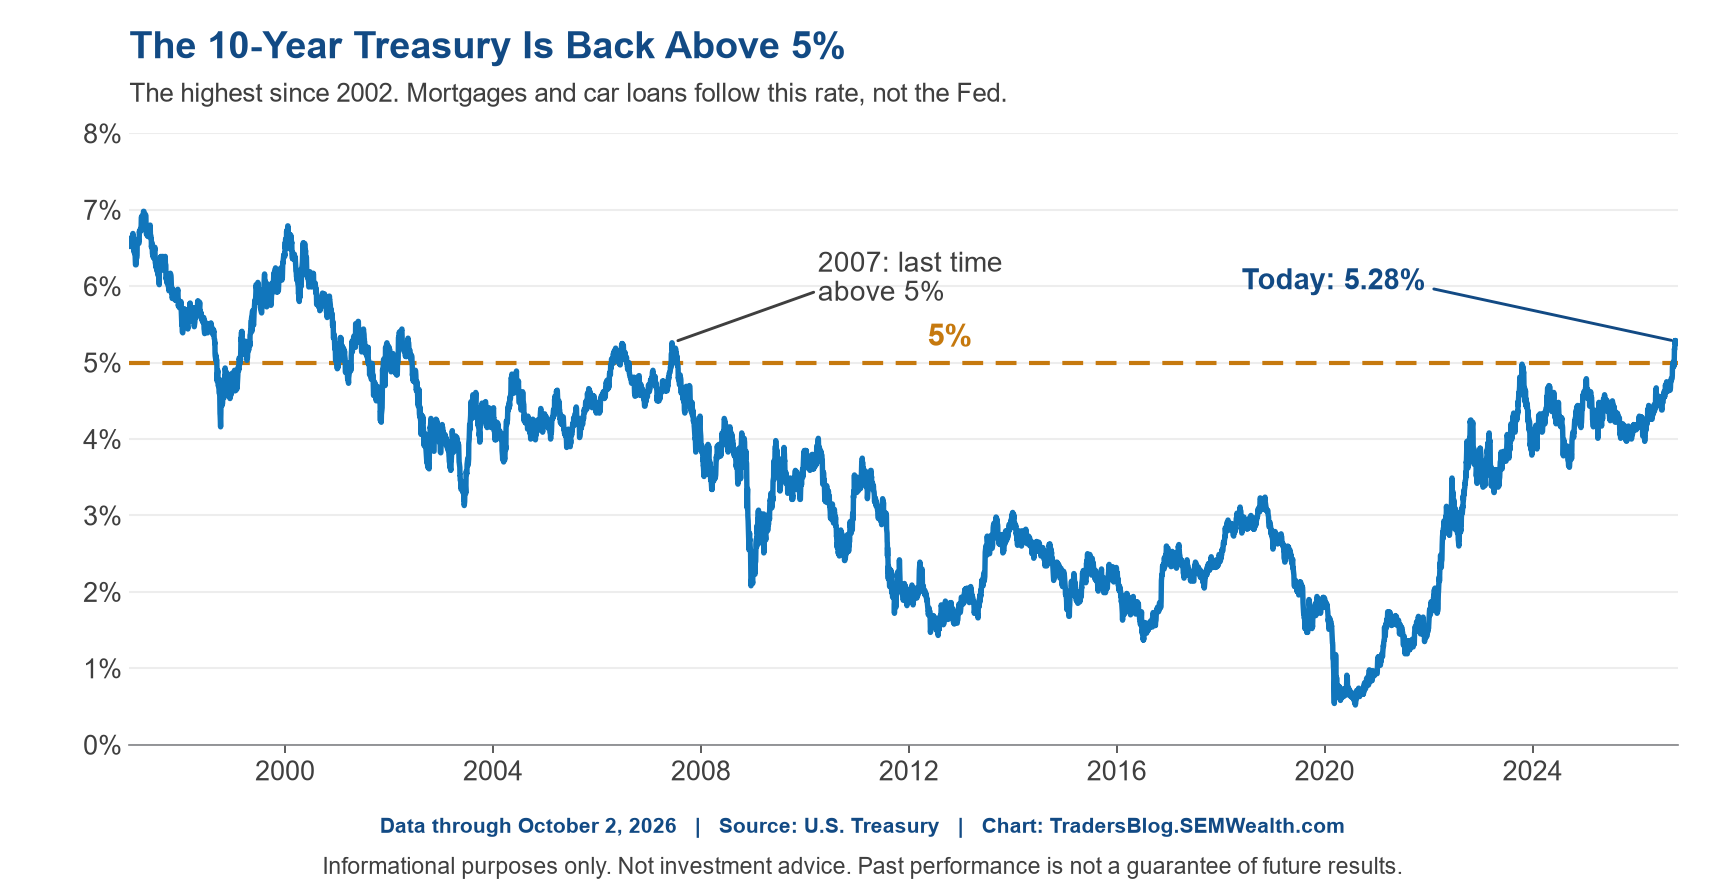
For the first time in 8 years I spent a week not opening my laptop. We took a cruise to Bermuda and despite my best efforts, the crawl at the bottom of the cruise news channel caught my attention. Interestingly enough, it wasn't the stock market, but the bond market getting the headline, as long-term US interest rates hit 20-year highs.
I was back last Monday, but left the blog to Cody and George. I thought they did a great job covering the move in interest rates, the reasons behind it, the sell in our tactical high yield system, and the other topic I couldn't seem to avoid on the cruise......AI.
As I settled back in last week I couldn't help but think about the stories of the Bermuda Triangle and all the ships lost to the hidden reefs, rough seas, and unpredictable weather. There are a lot of metaphors we could use to tie it back to today's market and economic environment. As we watched our captain pilot our ship around what would turn into the nor'easter that hit the East Coast the day after we returned, it was apparent how important it is to have good data and a well-thought-out plan. That certainly applies to where we are in this economic and market cycle, as witnessed by the September jobs report.
Jobs: slower, not broken
Last month I said one good jobs report isn't a trend, and that if the next two looked like August, the "economy is cooling so the Fed can't raise rates" argument would lose its evidence. September's jobs report certainly didn't look like August's. In September our economy added 29,000 jobs, July went back to a loss, August was revised down, and hours worked didn't budge. That would put the labor market in the 'cooling' category.
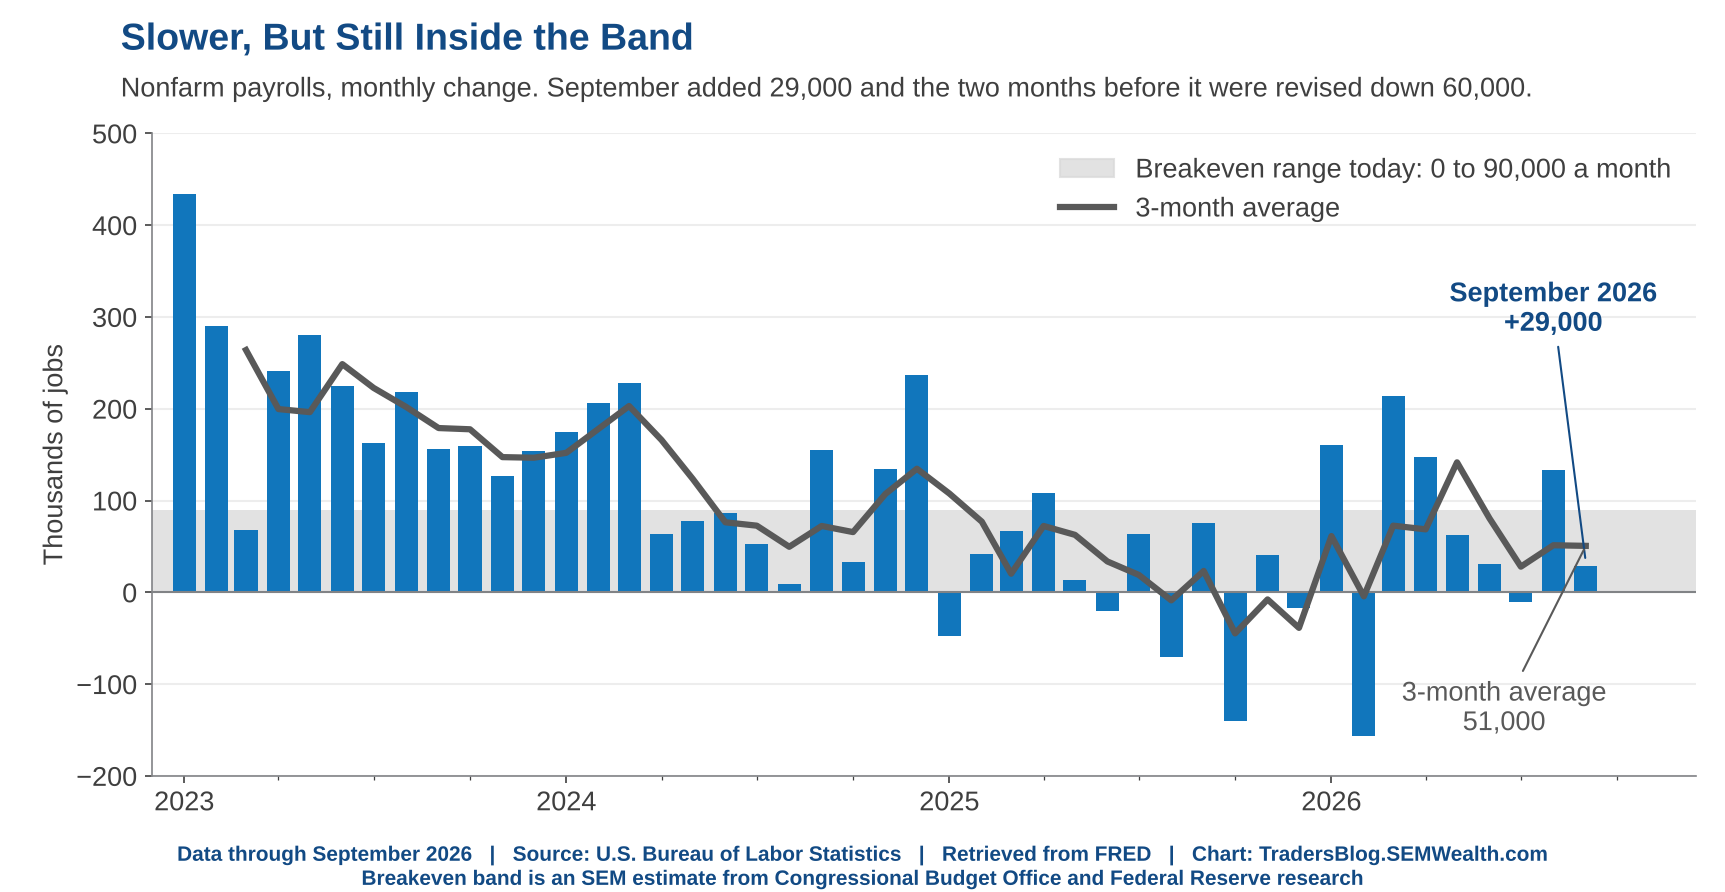
This sounds worse than it really is. The breakeven employment rate (the number of jobs needed just to hold unemployment steady) now runs somewhere between zero and 90,000 a month. The last three months average was about 50,000. That's slower, but still inside the band. The part we should be concerned about is the direction we are heading (down from 70,000 last month) and the downward revisions of the prior months' data.
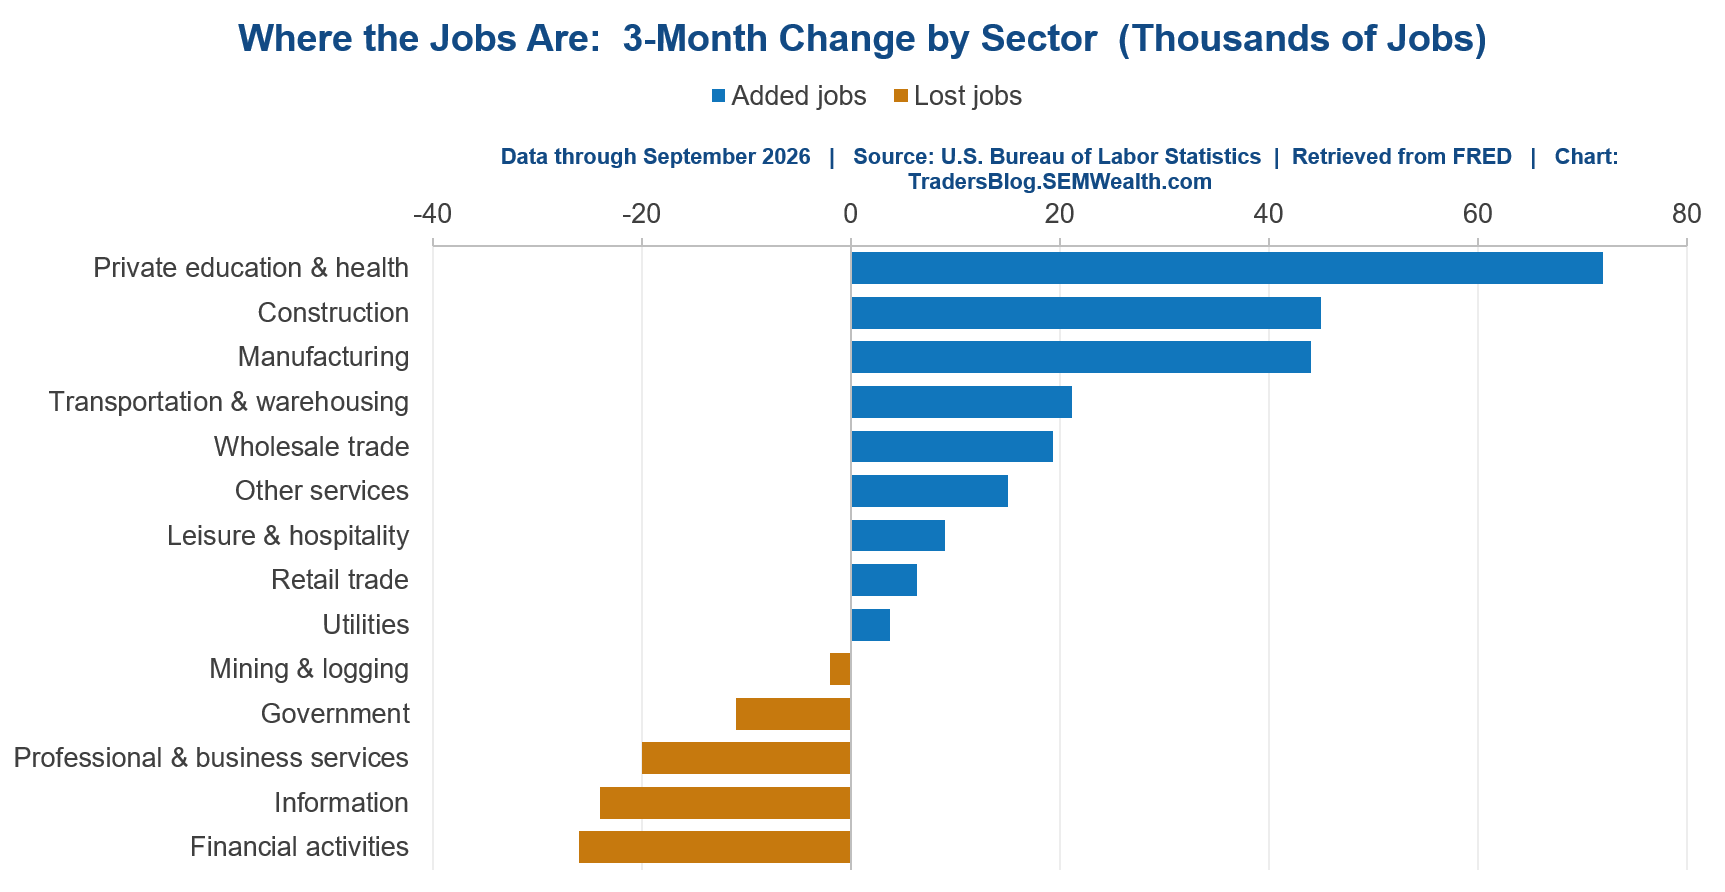
Looking at the last 3 months, we see education & health, construction, and manufacturing continue to lead the way in terms of new jobs. We are seeing job losses in finance, technology, and business services.
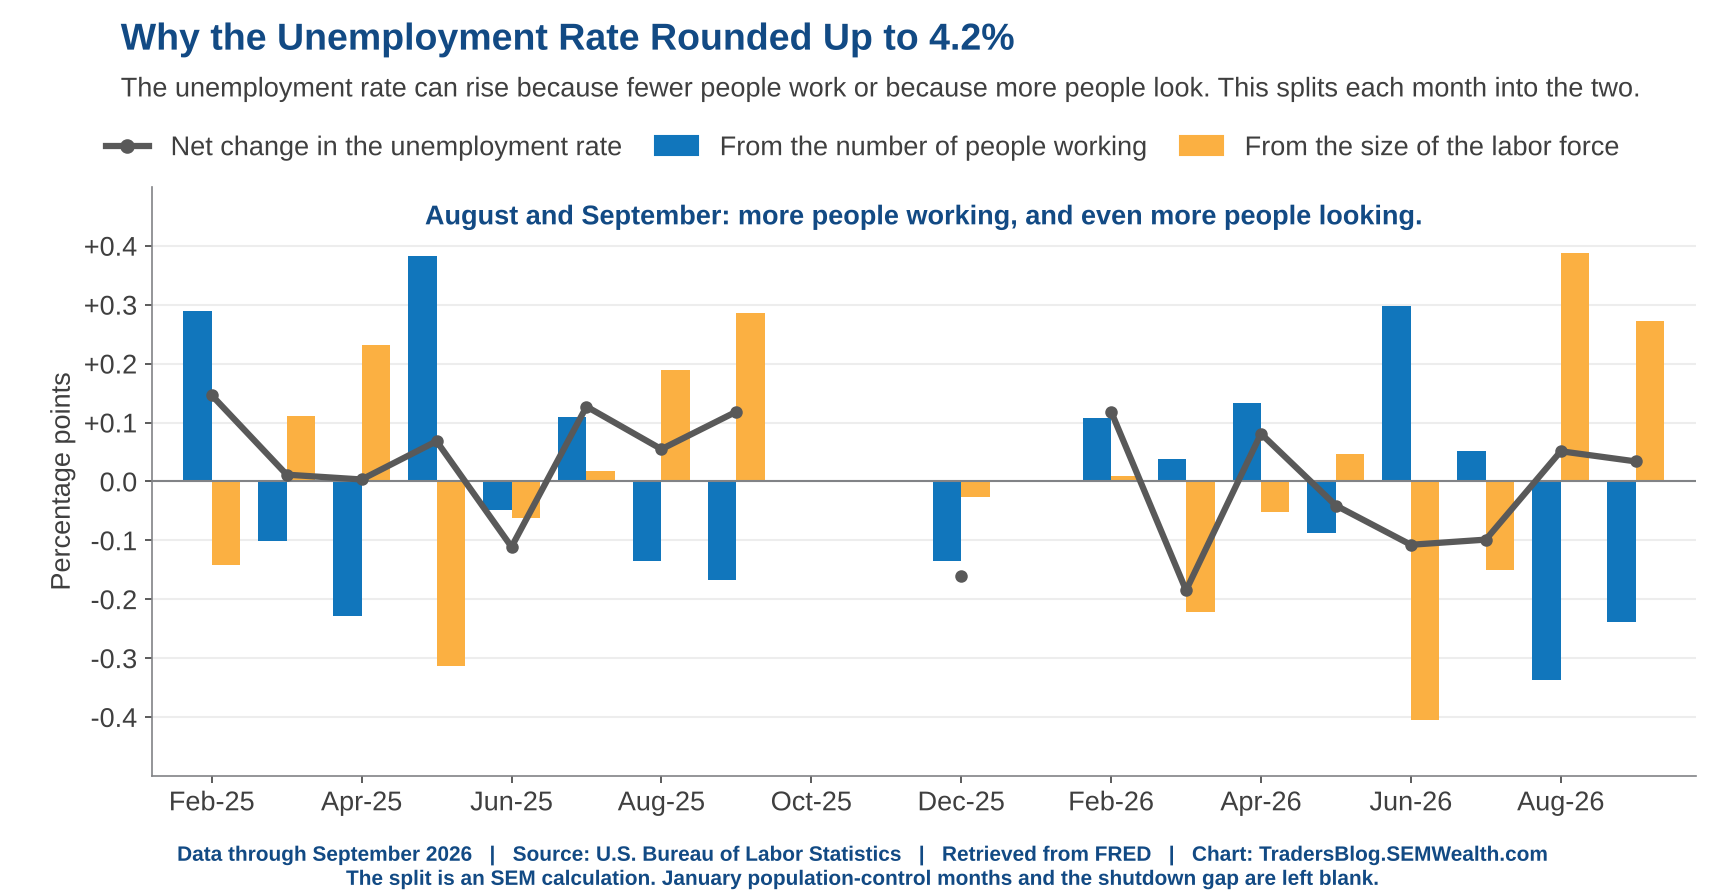
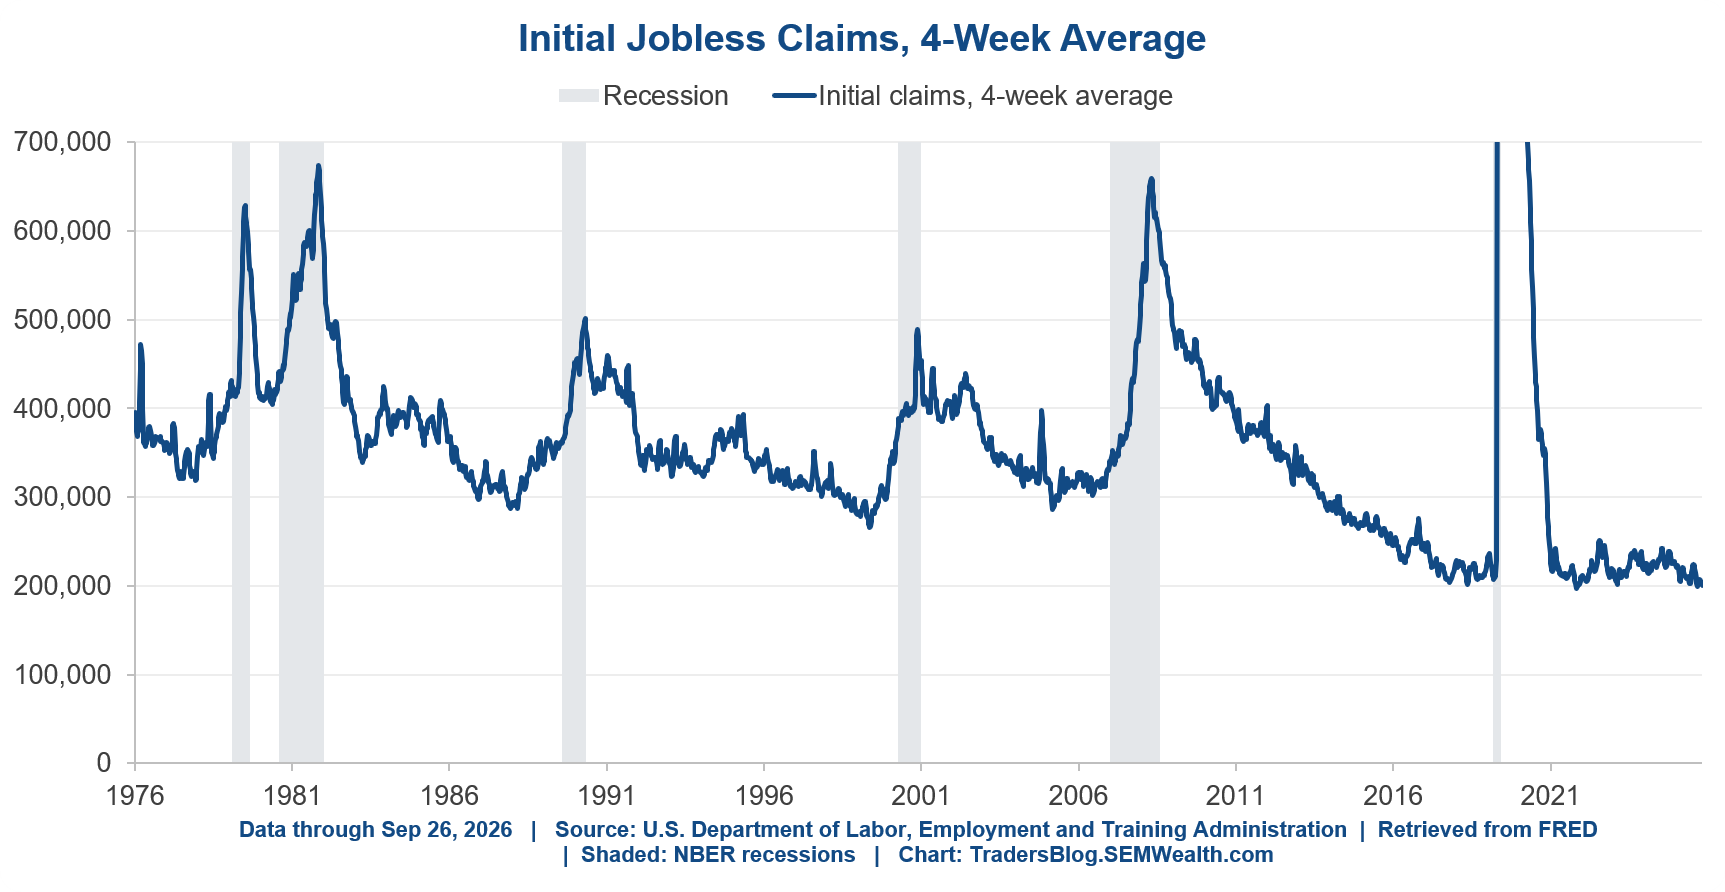
The unemployment rate rounded up to 4.2%. More people came back to look for work than found it, the second month in a row the workforce grew. Layoffs aren't the problem either: weekly jobless claims are lower than a year ago.
The Interest Rate Bermuda Triangle
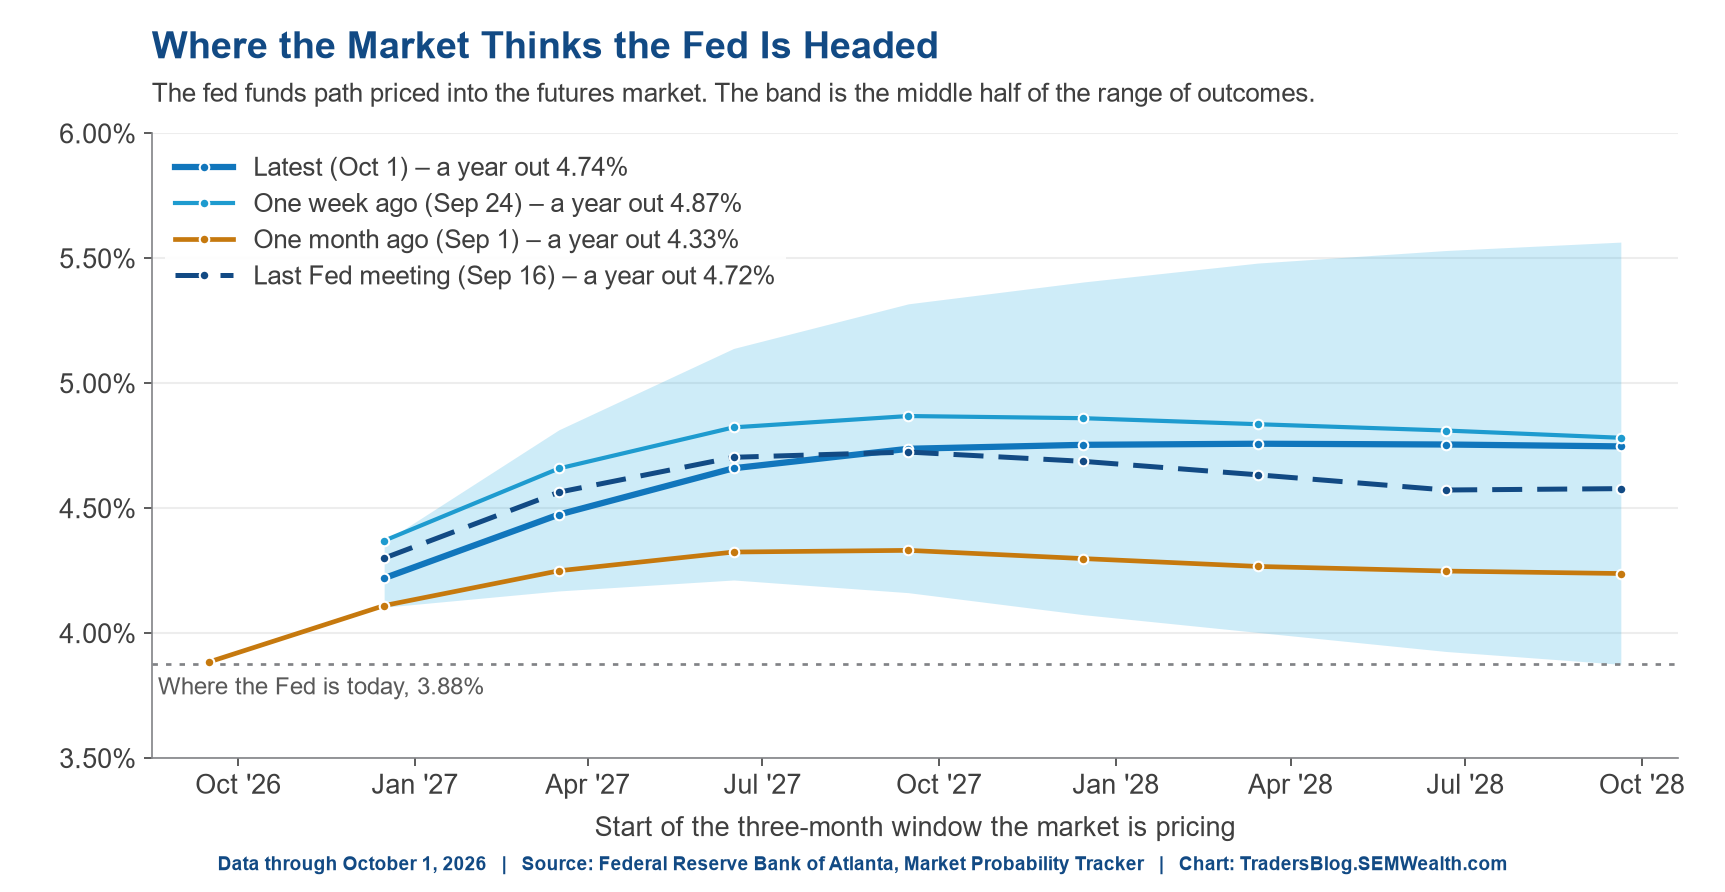
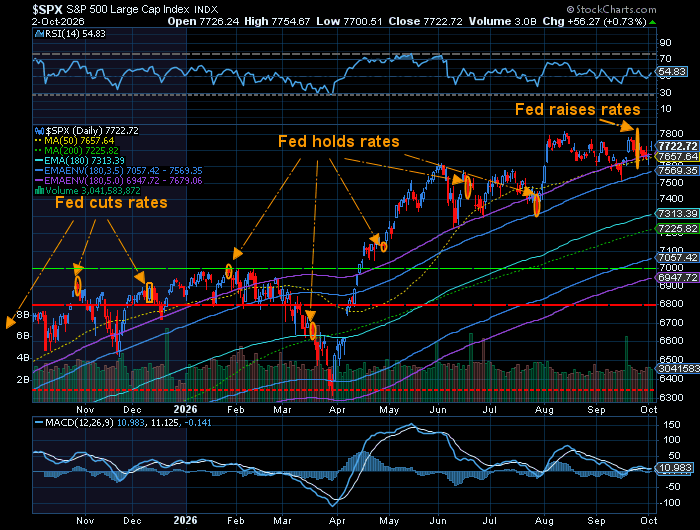
Before Friday, a second Fed hike in October was roughly a coin flip. After Friday, it's a long shot. Long-term rates dipped but stayed above 5%. I'd been saying throughout the summer if the Fed showed the market they were serious about inflation long-term rates should go DOWN. That has obviously not happened. There are three reasons we've seen rates shoot up:
1.) The market does not believe the Fed can control inflation due to the drivers being outside the Fed's control (AI buildout and the war in Iran)
2.) The lack of anybody in Washington caring about our massive budget deficit.
3.) Treasury demand / liquidity being absorbed from the debt being issued to finance the AI buildout.
Whatever it is, we're in a rate environment we haven't seen in quite some time.
The odds of a Fed rate hike dropped significantly after the jobs report.
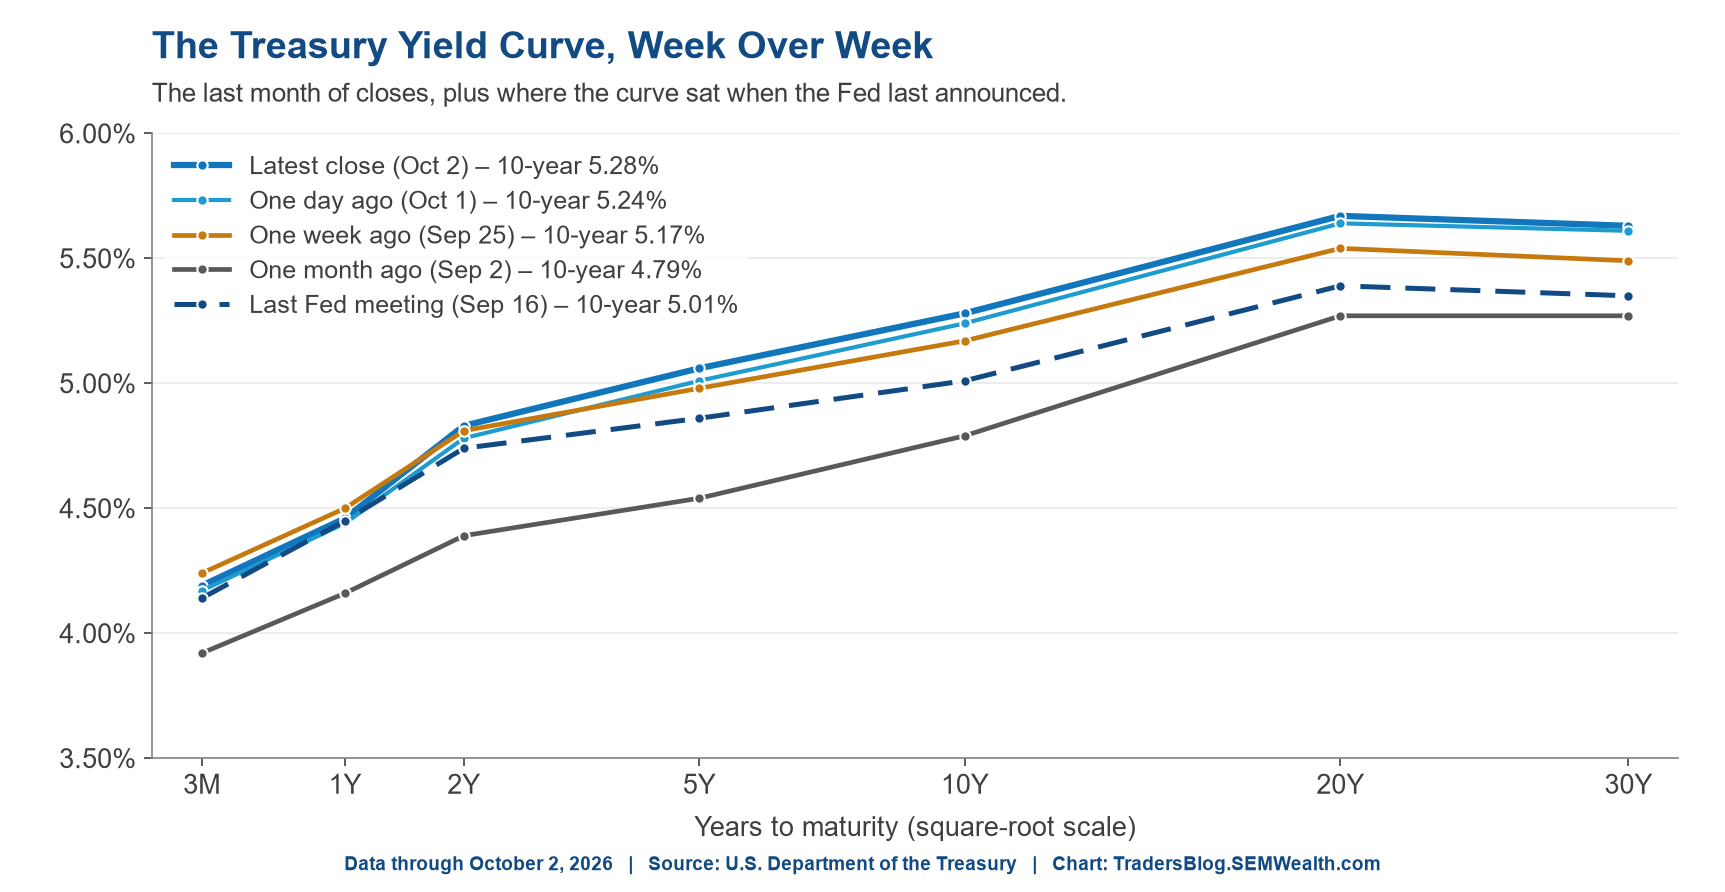
It's tough to see on the chart, but the biggest impact on rates after the jobs report was on the shorter end of the yield curve. Rates still moved higher for the week for longer-term bonds.
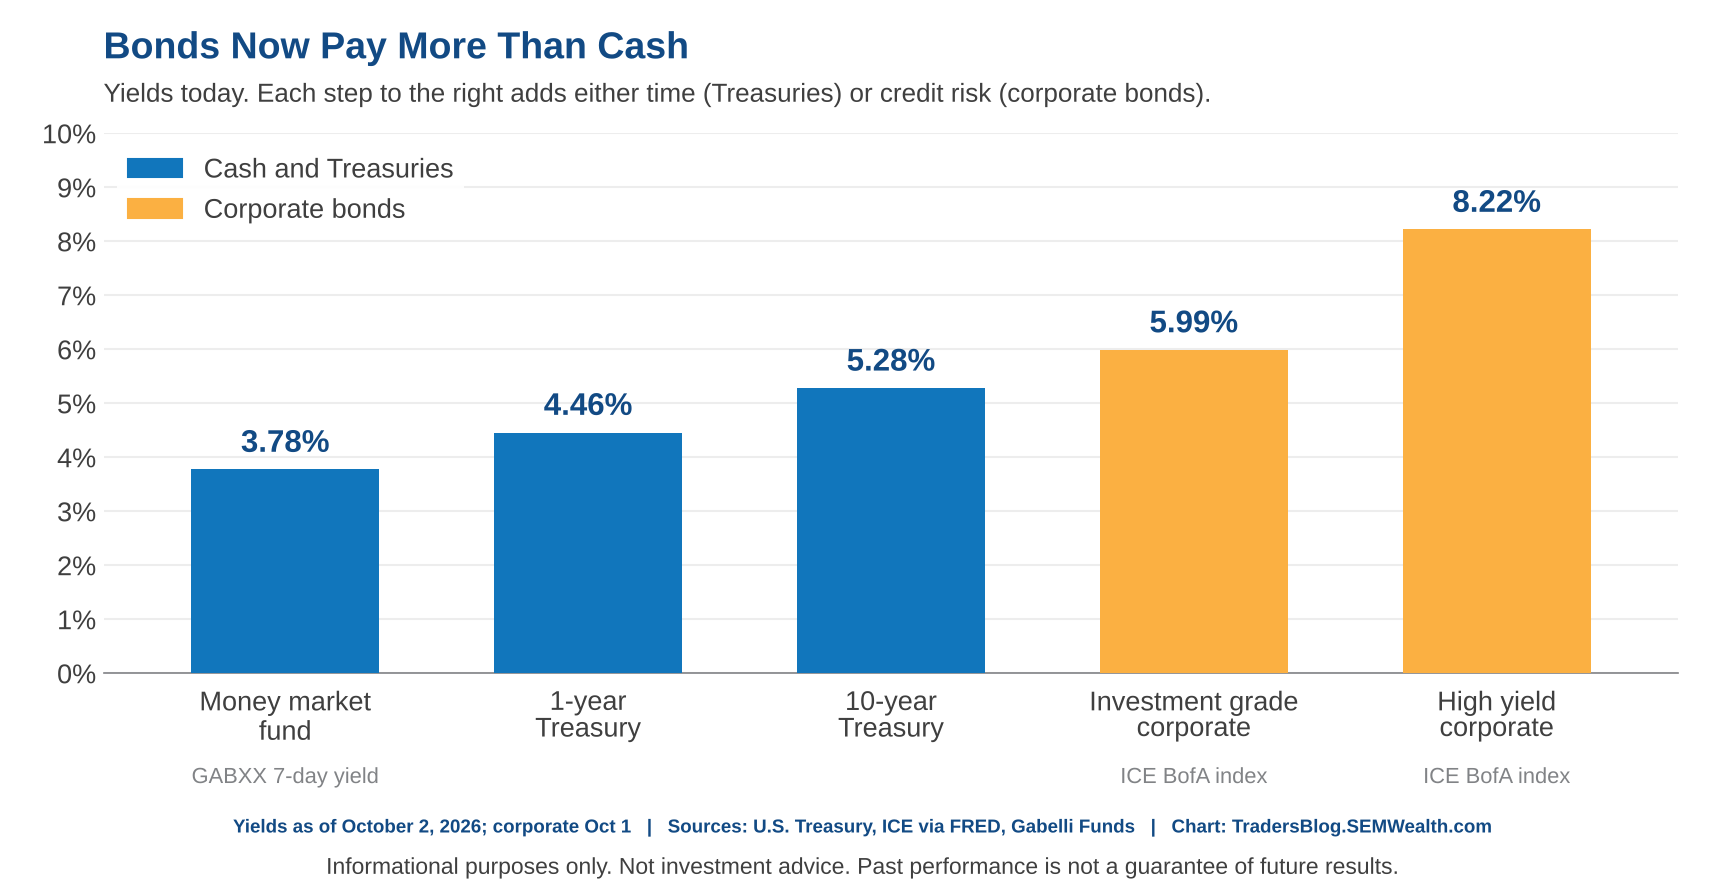
Things are starting to get interesting in the interest rate markets. Despite the Fed's rate hike, which gave savers (and our 'CASH' model a pay increase), the free market moving rates higher has pushed bond yields to levels which may be attractive (so long as you hold them to maturity.)
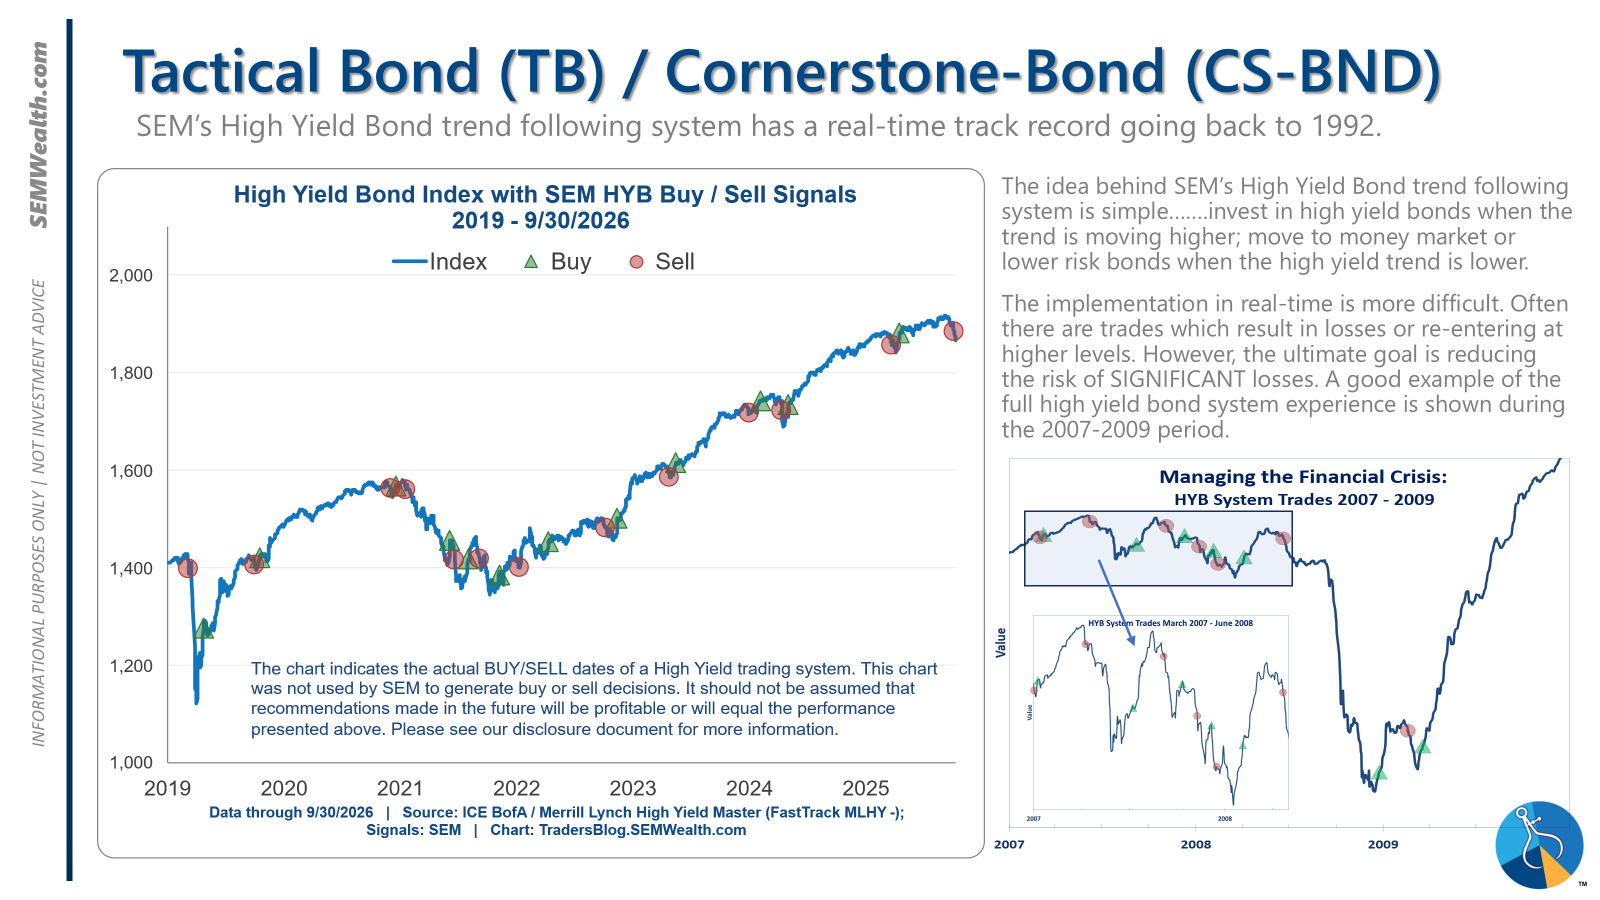
Cody mentioned our tactical high yield sell from September 24. While yields did move up a bit (and prices were down about 1.4% from the high) the spread between corporate bond yields and Treasuries remains near historic lows.
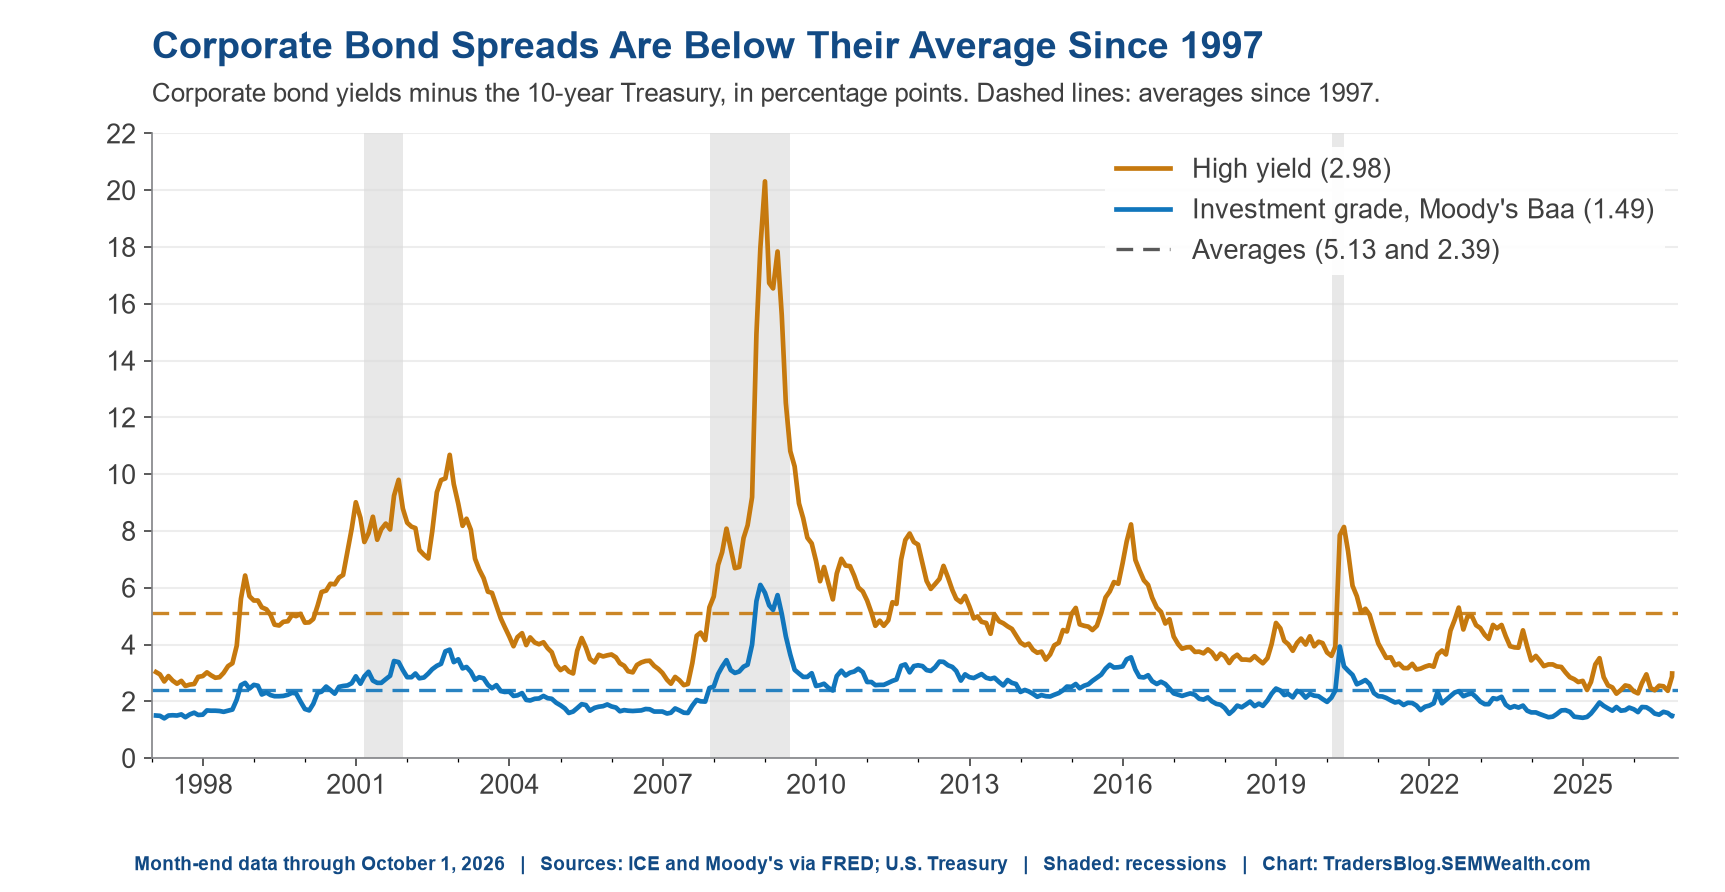
The easiest way to make money in bonds is when spreads are high. When they are this low there are too many risks to chase yields into riskier credit. It may not be easy to do given the double digit stock returns, but patience is key at this stage in the cycle when it comes to your lower risk/shorter-term investment dollars.
The SEM economic model: still flat
With the employment report, we close out our economic model. Our model reads a little over 2% growth, the same as each of the last three months (note this is the 12-month growth rate. If the model is correct, this means the "official" number for the 3rd quarter will be right at 4% (remember our number is the year-over-year growth rate, while the "official" number is the growth rate over the last 3 months compounded 4 times.)
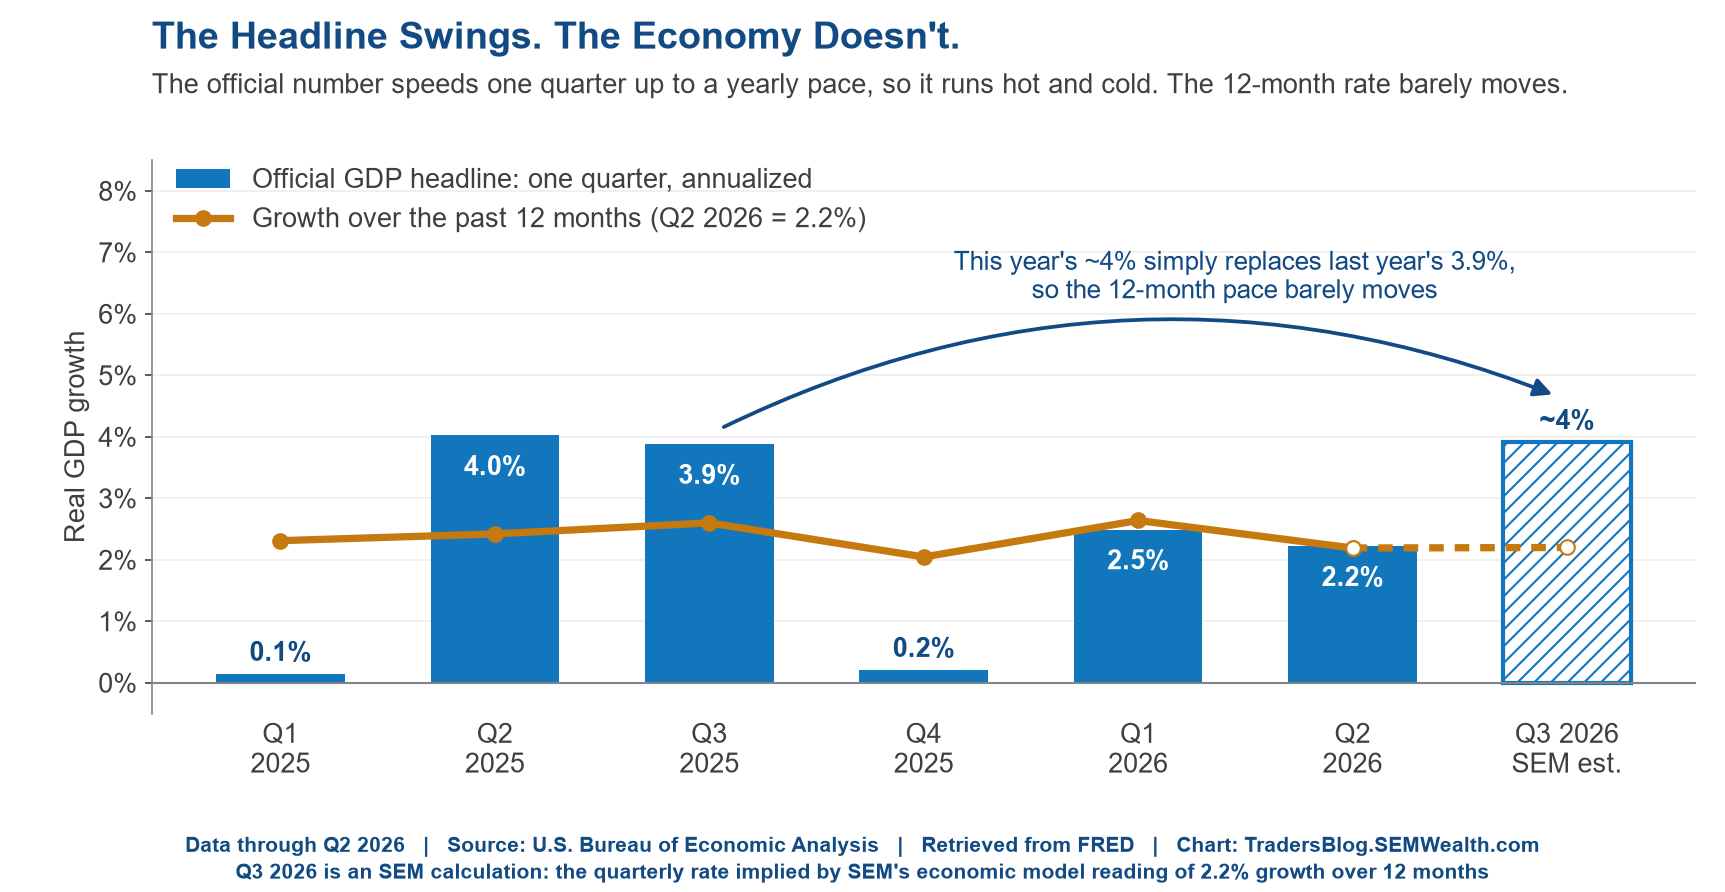
So despite what might be "great" headlines (4% does sound pretty great!), the actual growth rate is "average". It's not even really "average" when you consider the LONG-TERM average is 3.1%. For the better part of this recovery 2 to 2.5% has been about the best we could hope for (more on that next week – I hope).
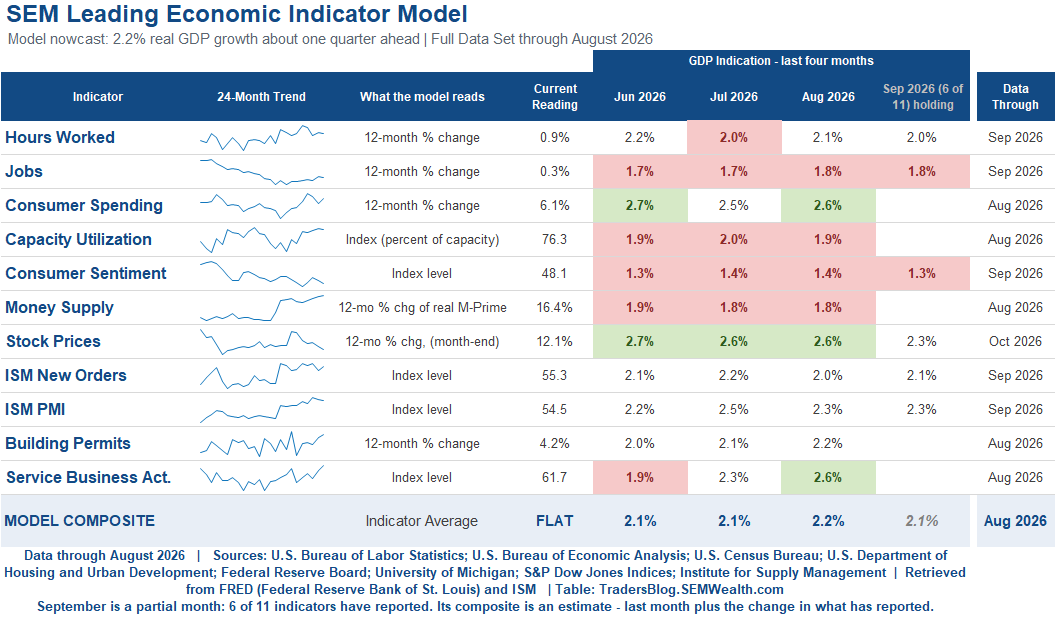
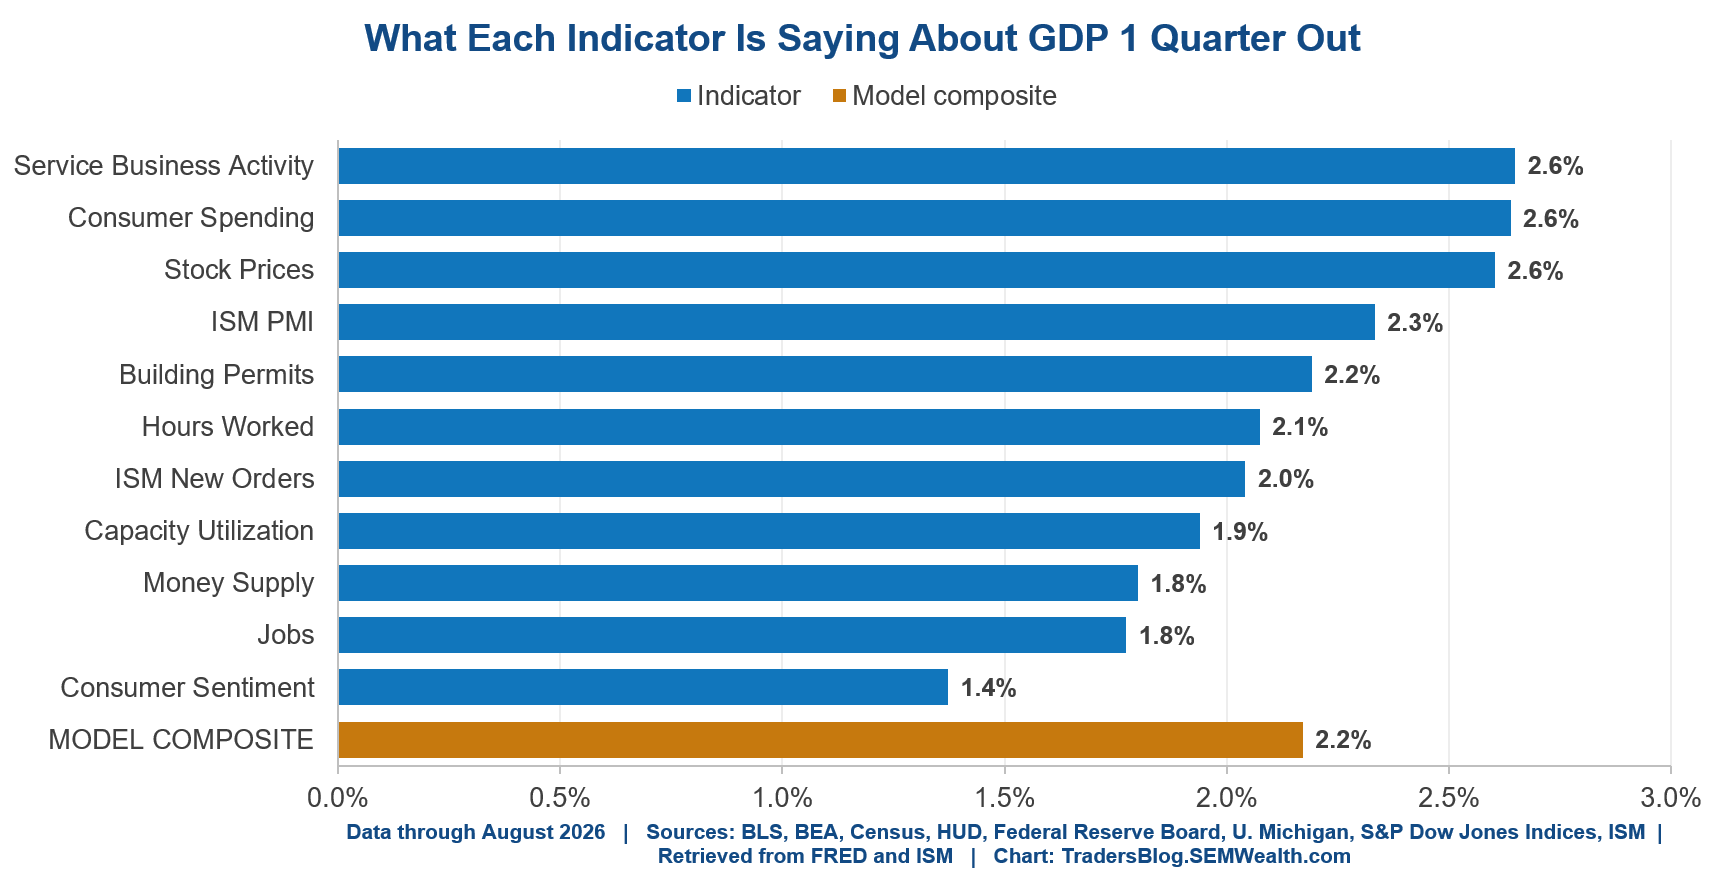
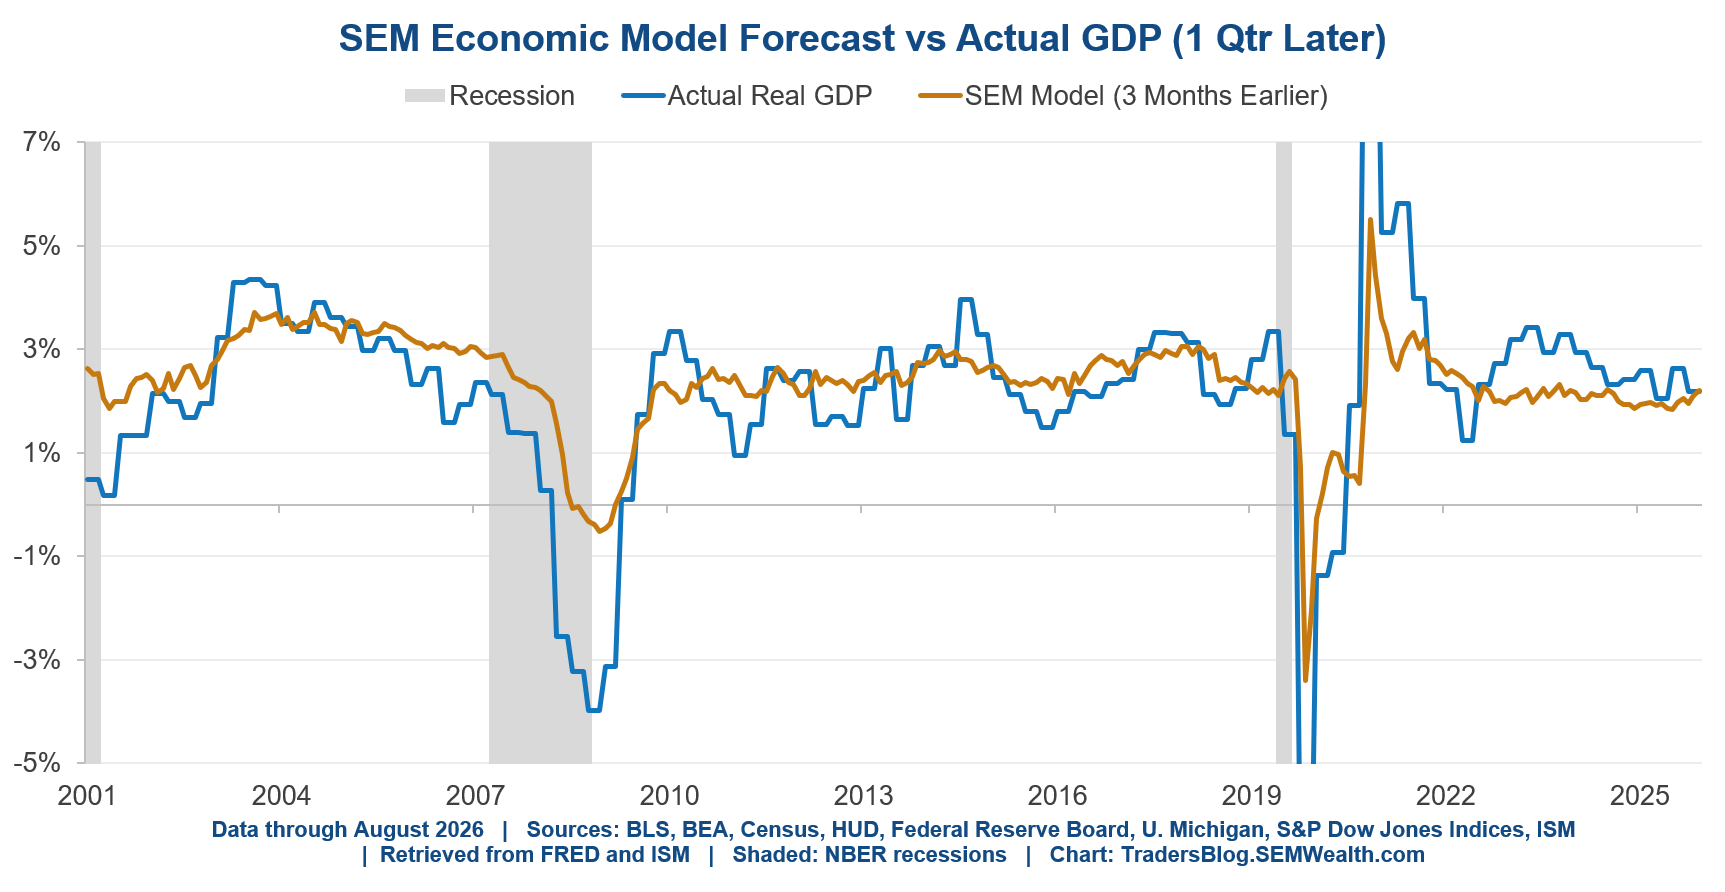
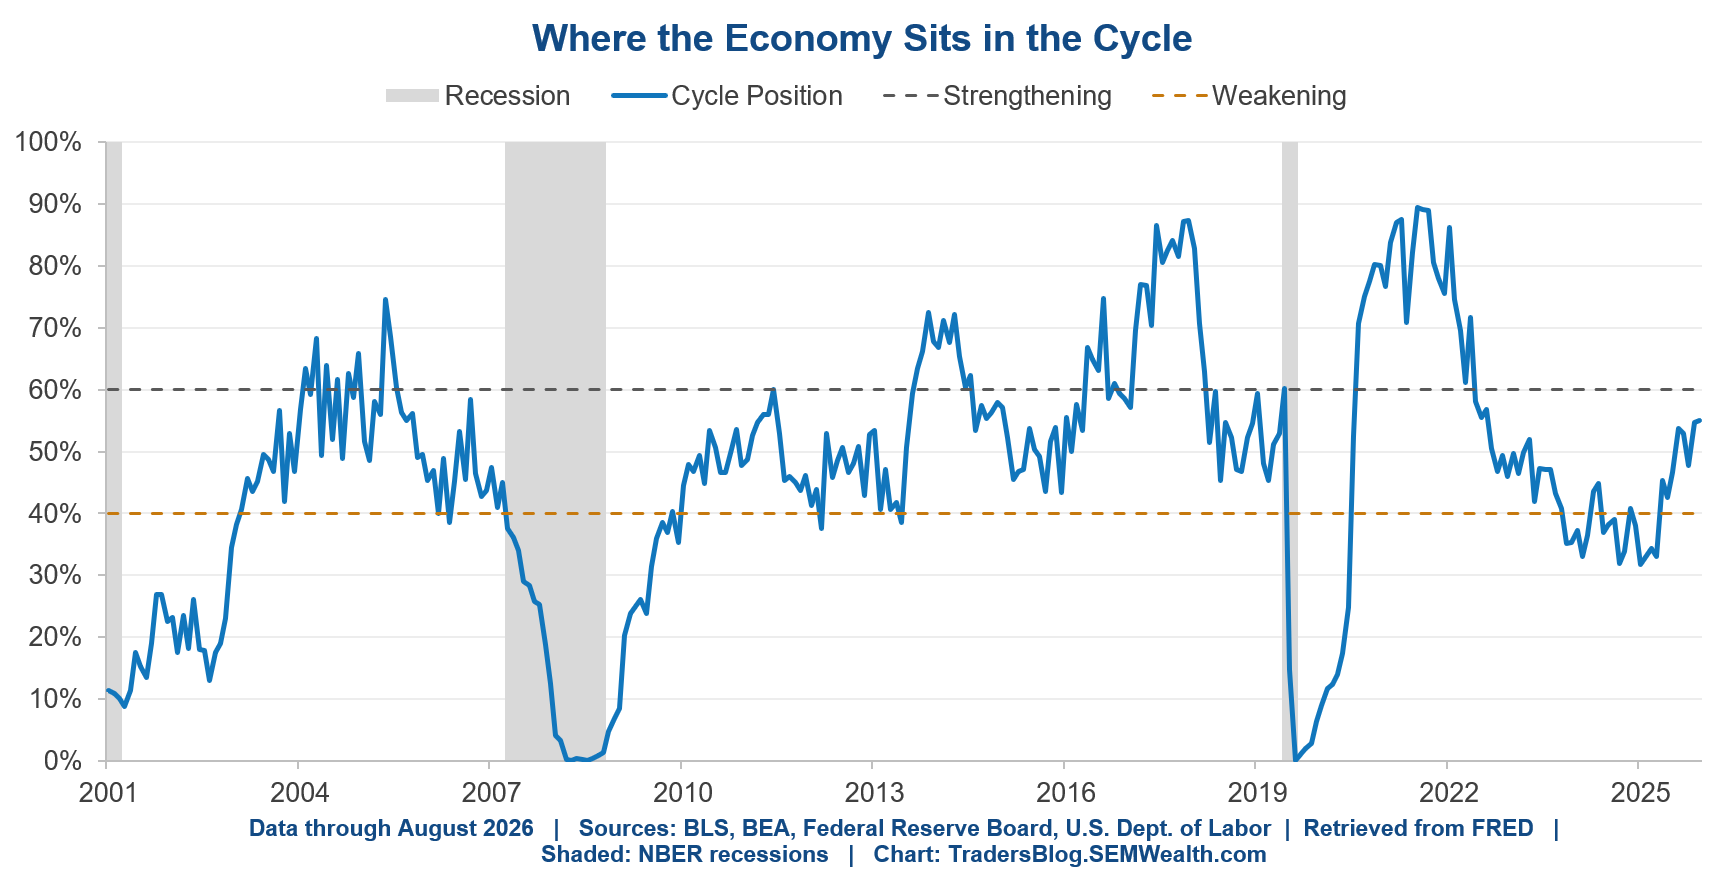
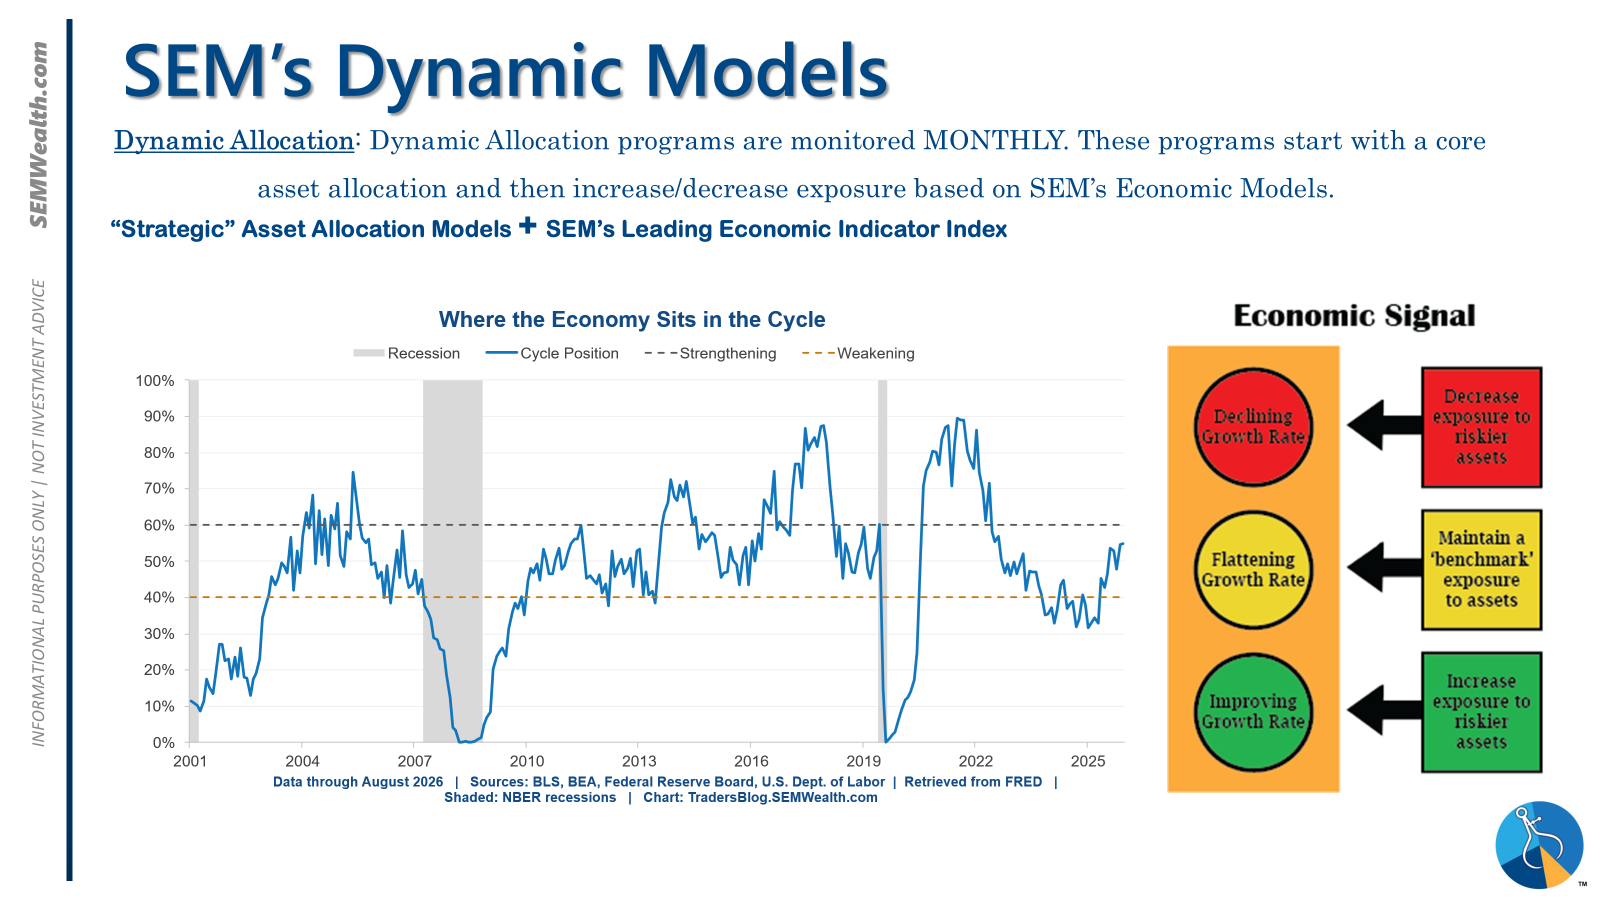
Our cycle chart that had been climbing toward "strengthening" looks to have paused in September. This means the Dynamic models stay neutral, at their benchmark, as they have since February.
In case you missed it: SEM's Quarterly Newsletter
We posted our Fall Newsletter last week. As always, we take the most popular content from the blog and condense it to a format easier for investors. We talk about the two most frequently discussed topics last quarter: AI and Interest rates.
Check it out here:
 Jeff Hybiak, CFA

A Moment Is Not the Whole Year
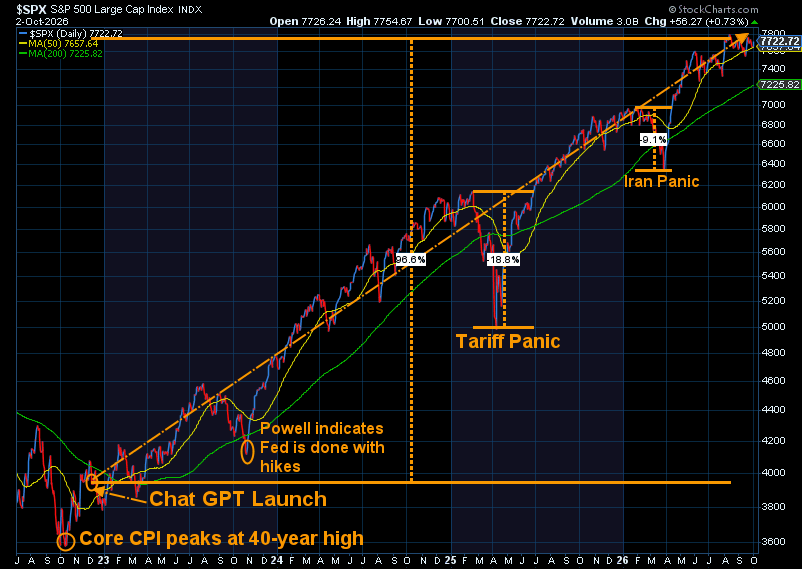
Markets rarely travel in a straight line, and this week's chart shows how wide the gap can be between a year's worst moment and where that year ends.
Since 1980, the S&P 500 has had an average intra-year decline of 14%, yet it has delivered an annualized total return of roughly 12% and finished in positive territory in 38 of the 46 full calendar years.
Some of the most uncomfortable stretches gave way to solid results: in 1987 the index fell 34% at its low and still ended the year up 6%, in 2020 it dropped 34% and finished up 18%, and just last year a 19% pullback was followed by an 18% gain.
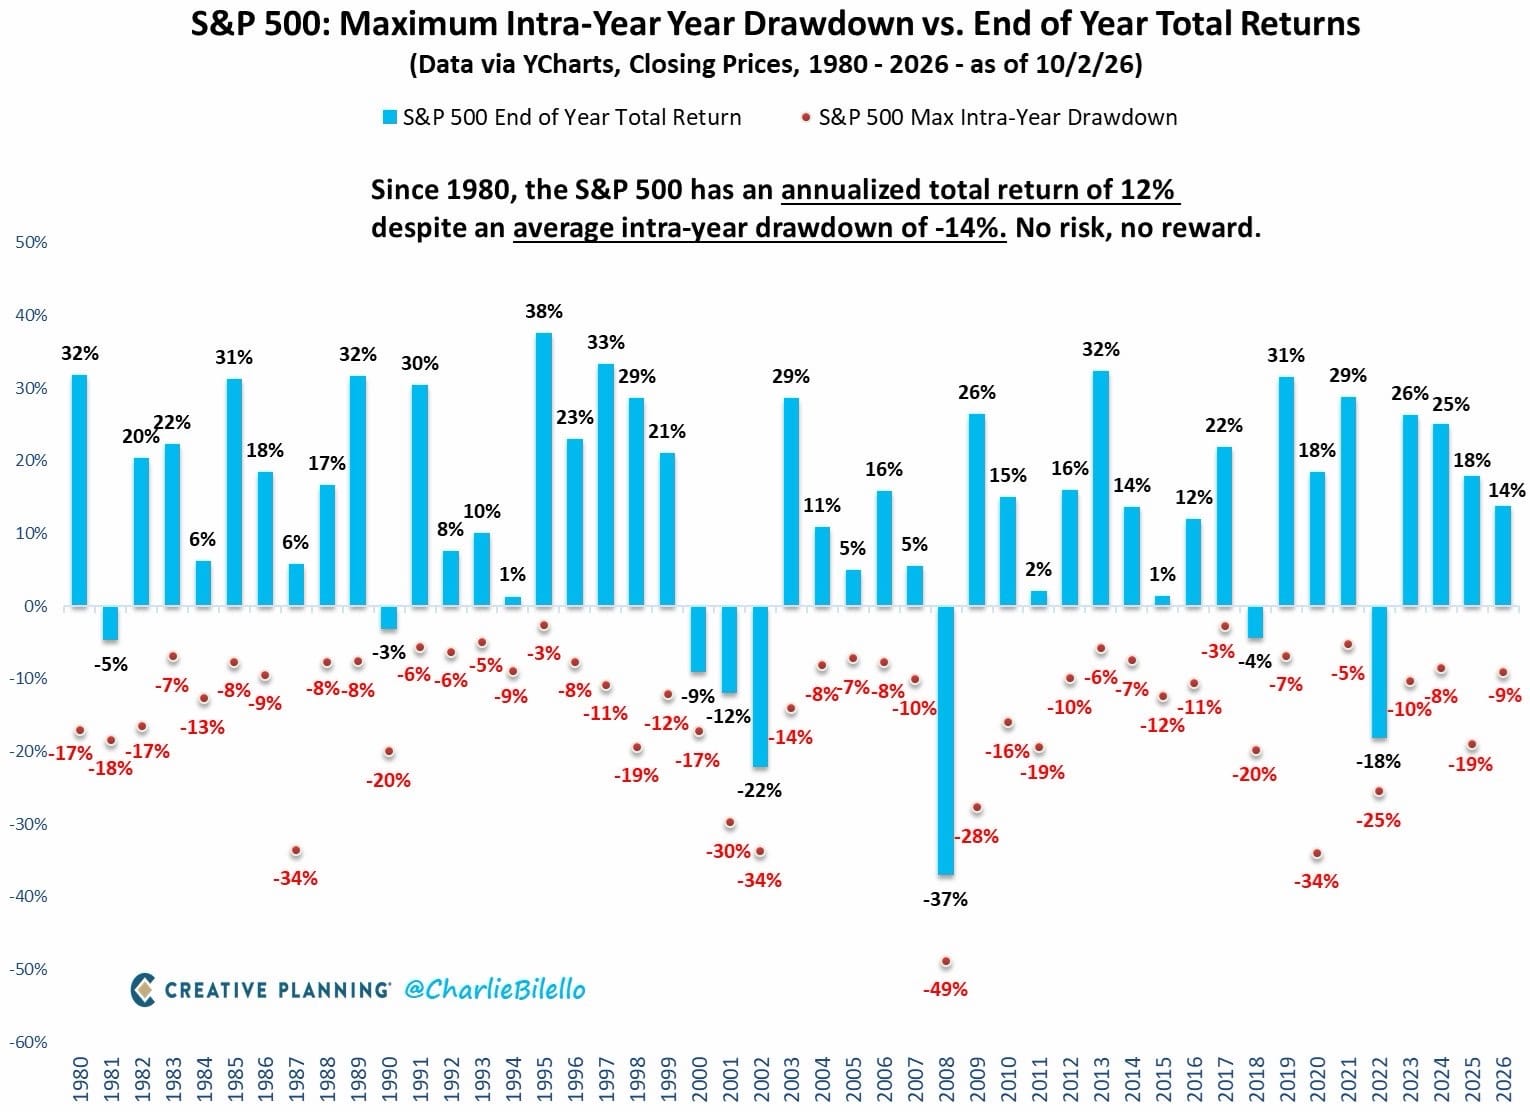
A drawdown is a snapshot, not a verdict. Declines of this size are a normal part of investing rather than a sign that something is broken, and investors who acted on the low point in those years would have missed the recovery that followed. Not every year ends well, as 2008 and 2022 remind us, and past performance does not guarantee future results. Still, history suggests that staying disciplined through temporary volatility has been more rewarding than trying to subjectively guess when to sidestep it.
This is where SEM comes in. Having a well-designed, quantitative strategy that works with your financial plan, cash flow strategy, and investment personality allows you to ignore some of the swings throughout the year.
Market and Economic Data
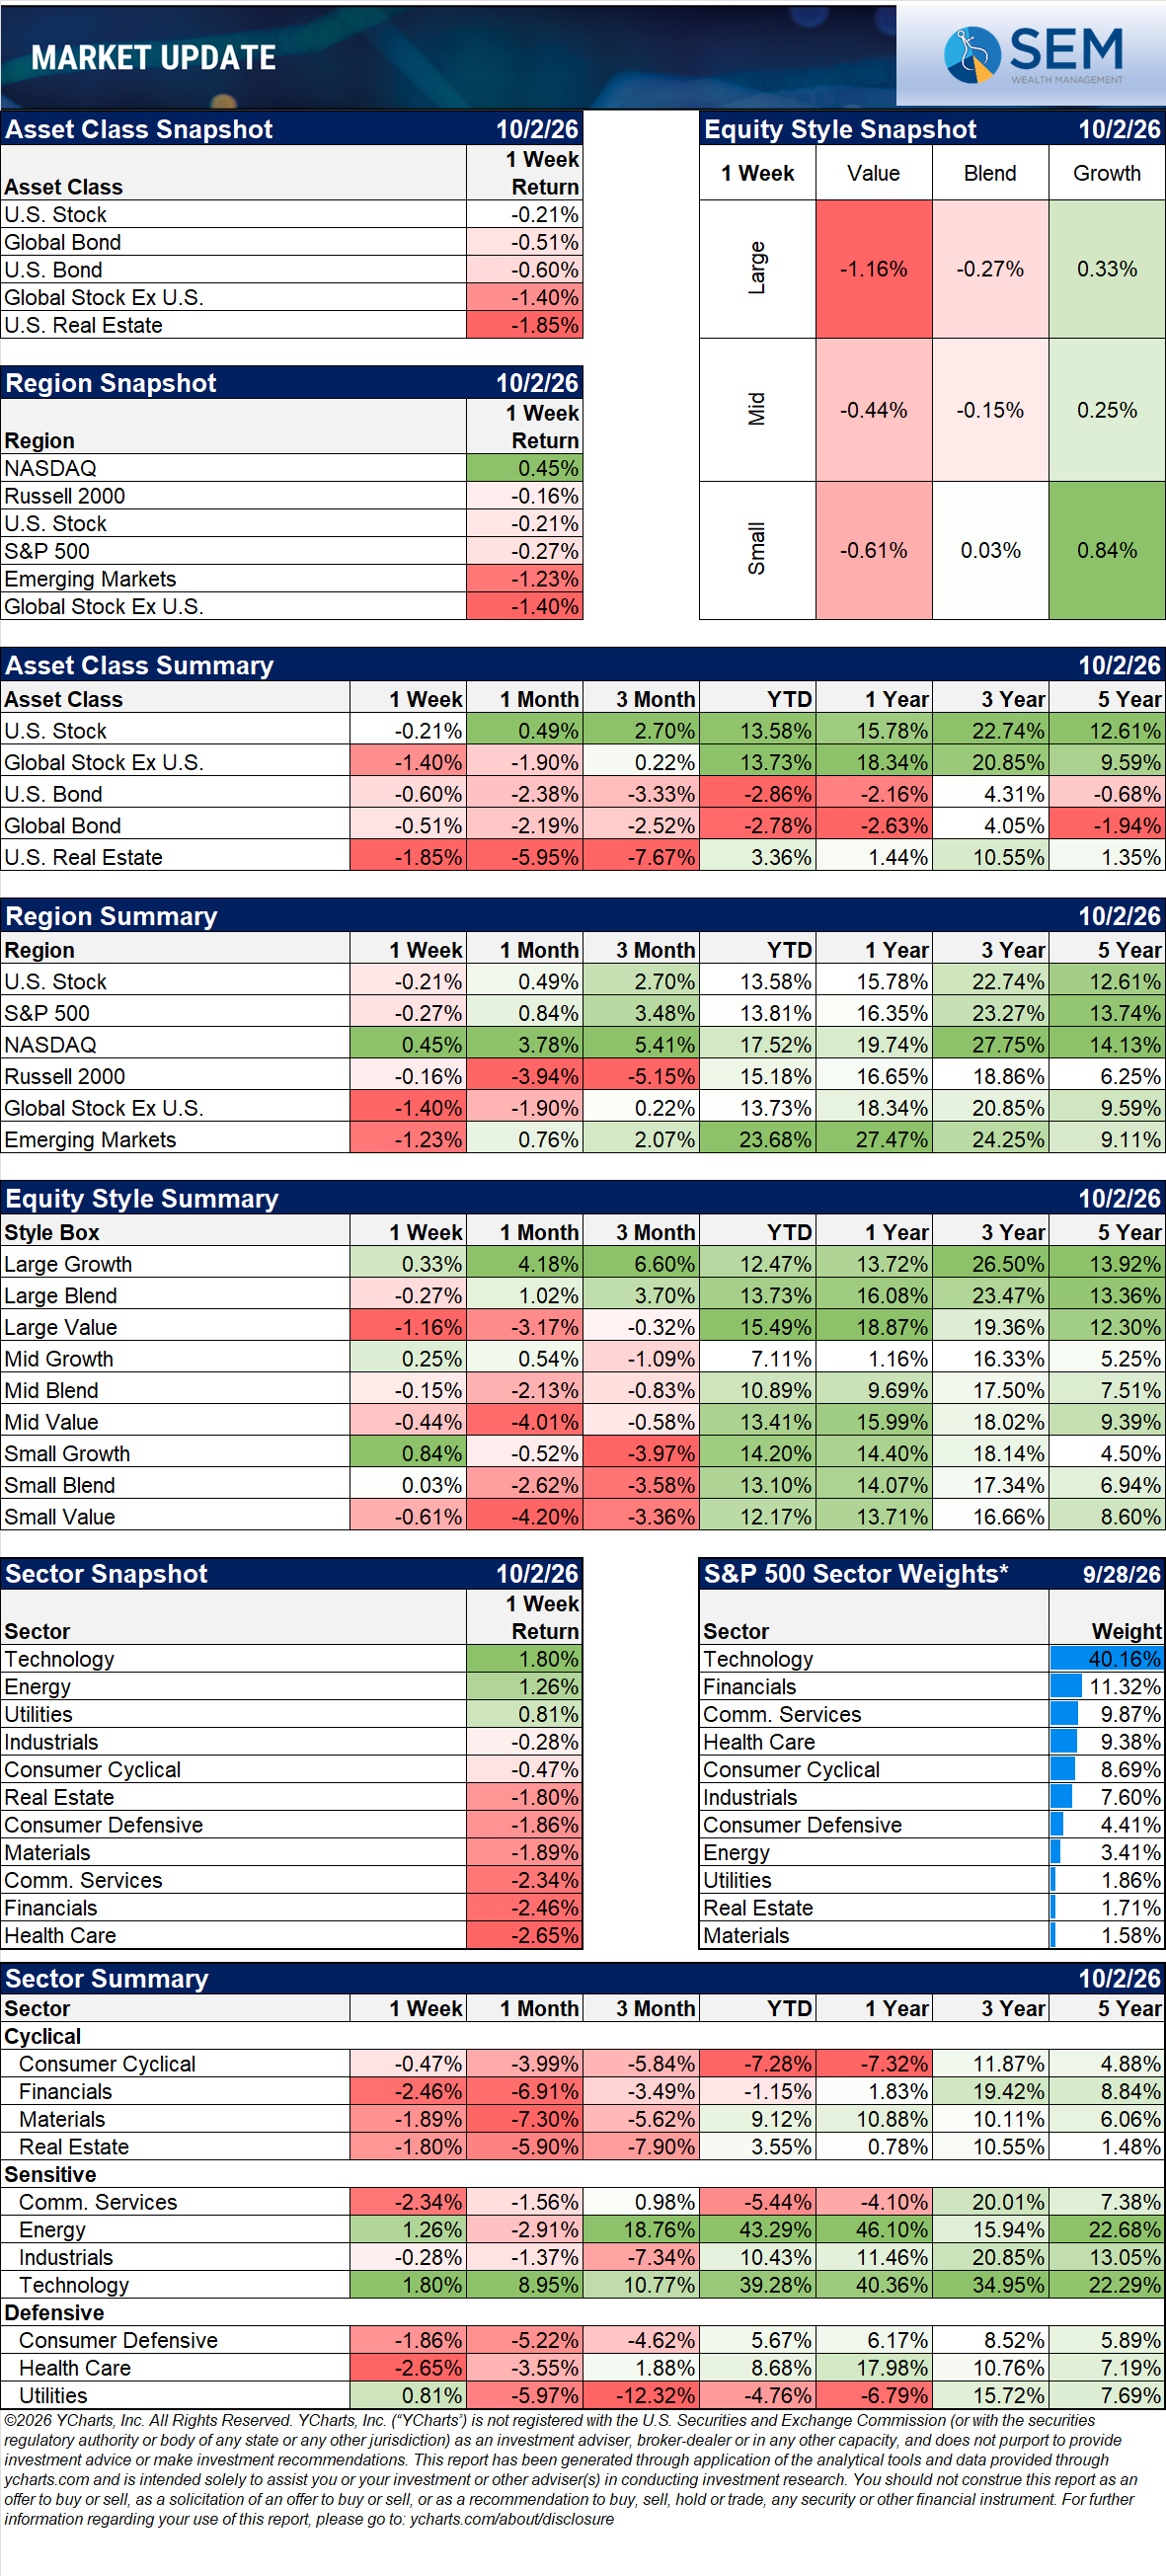
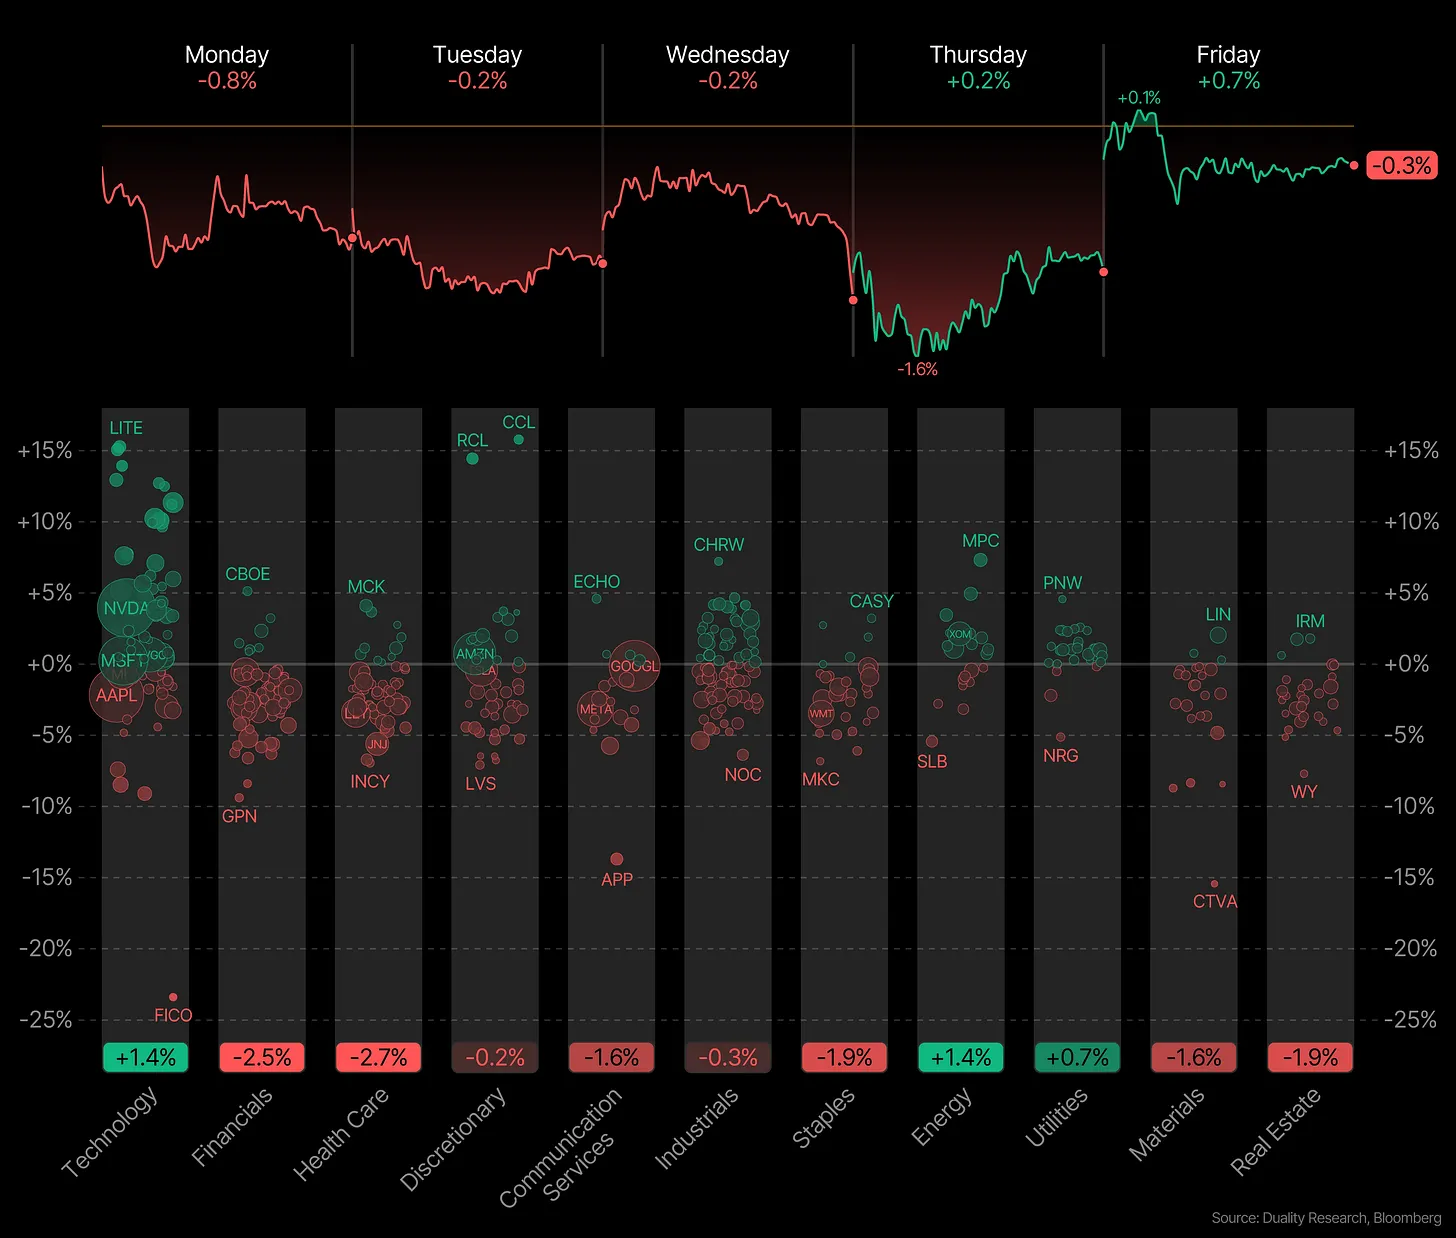
Markets were mixed as investors digested inflation and labor market data to gauge how the Fed may shift its expectations at the next FOMC meeting.
Nonfarm payrolls rose by just 29,000 in September, roughly a third of the 90,000 expected. August payrolls were revised down to 133,000, and July's figure turned negative at -10,000, a net reduction of 60,000 jobs.
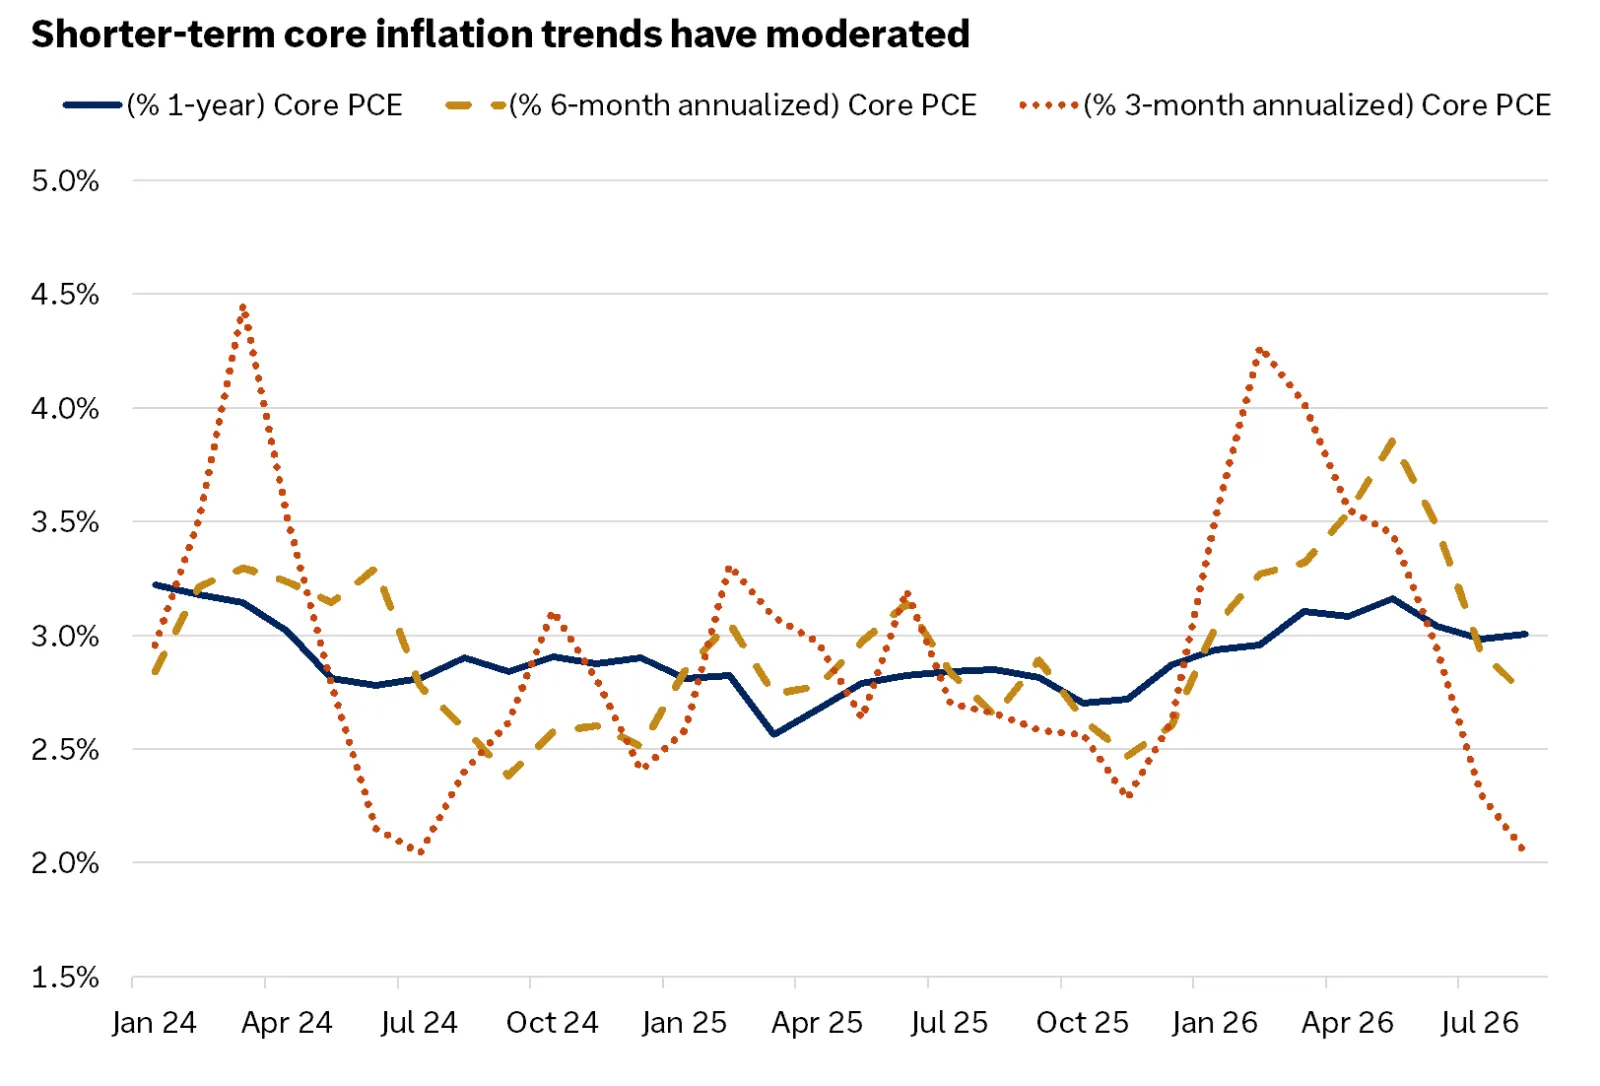
The unemployment rate ticked up to 4.2% from 4.1%, and recent inflation data improved, with core PCE inflation rising 3.0% from a year ago in August.
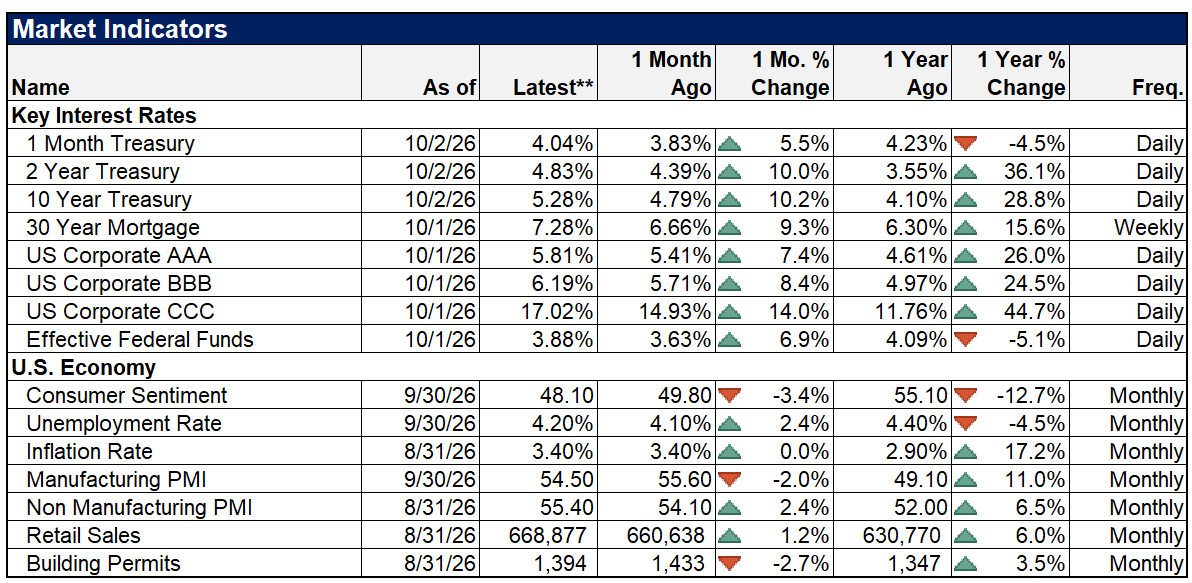
Markets now price in a 77% probability that the FOMC will hold rates steady at its late-October meeting, up from 36% a week ago. The 10 Year Treasury Rate rose to 5.29% by week's end, touching an intraday high of 5.34% on Thursday, its highest level since 2002. The 30 Year Treasury Rate also climbed near 2002 highs at 5.64%.
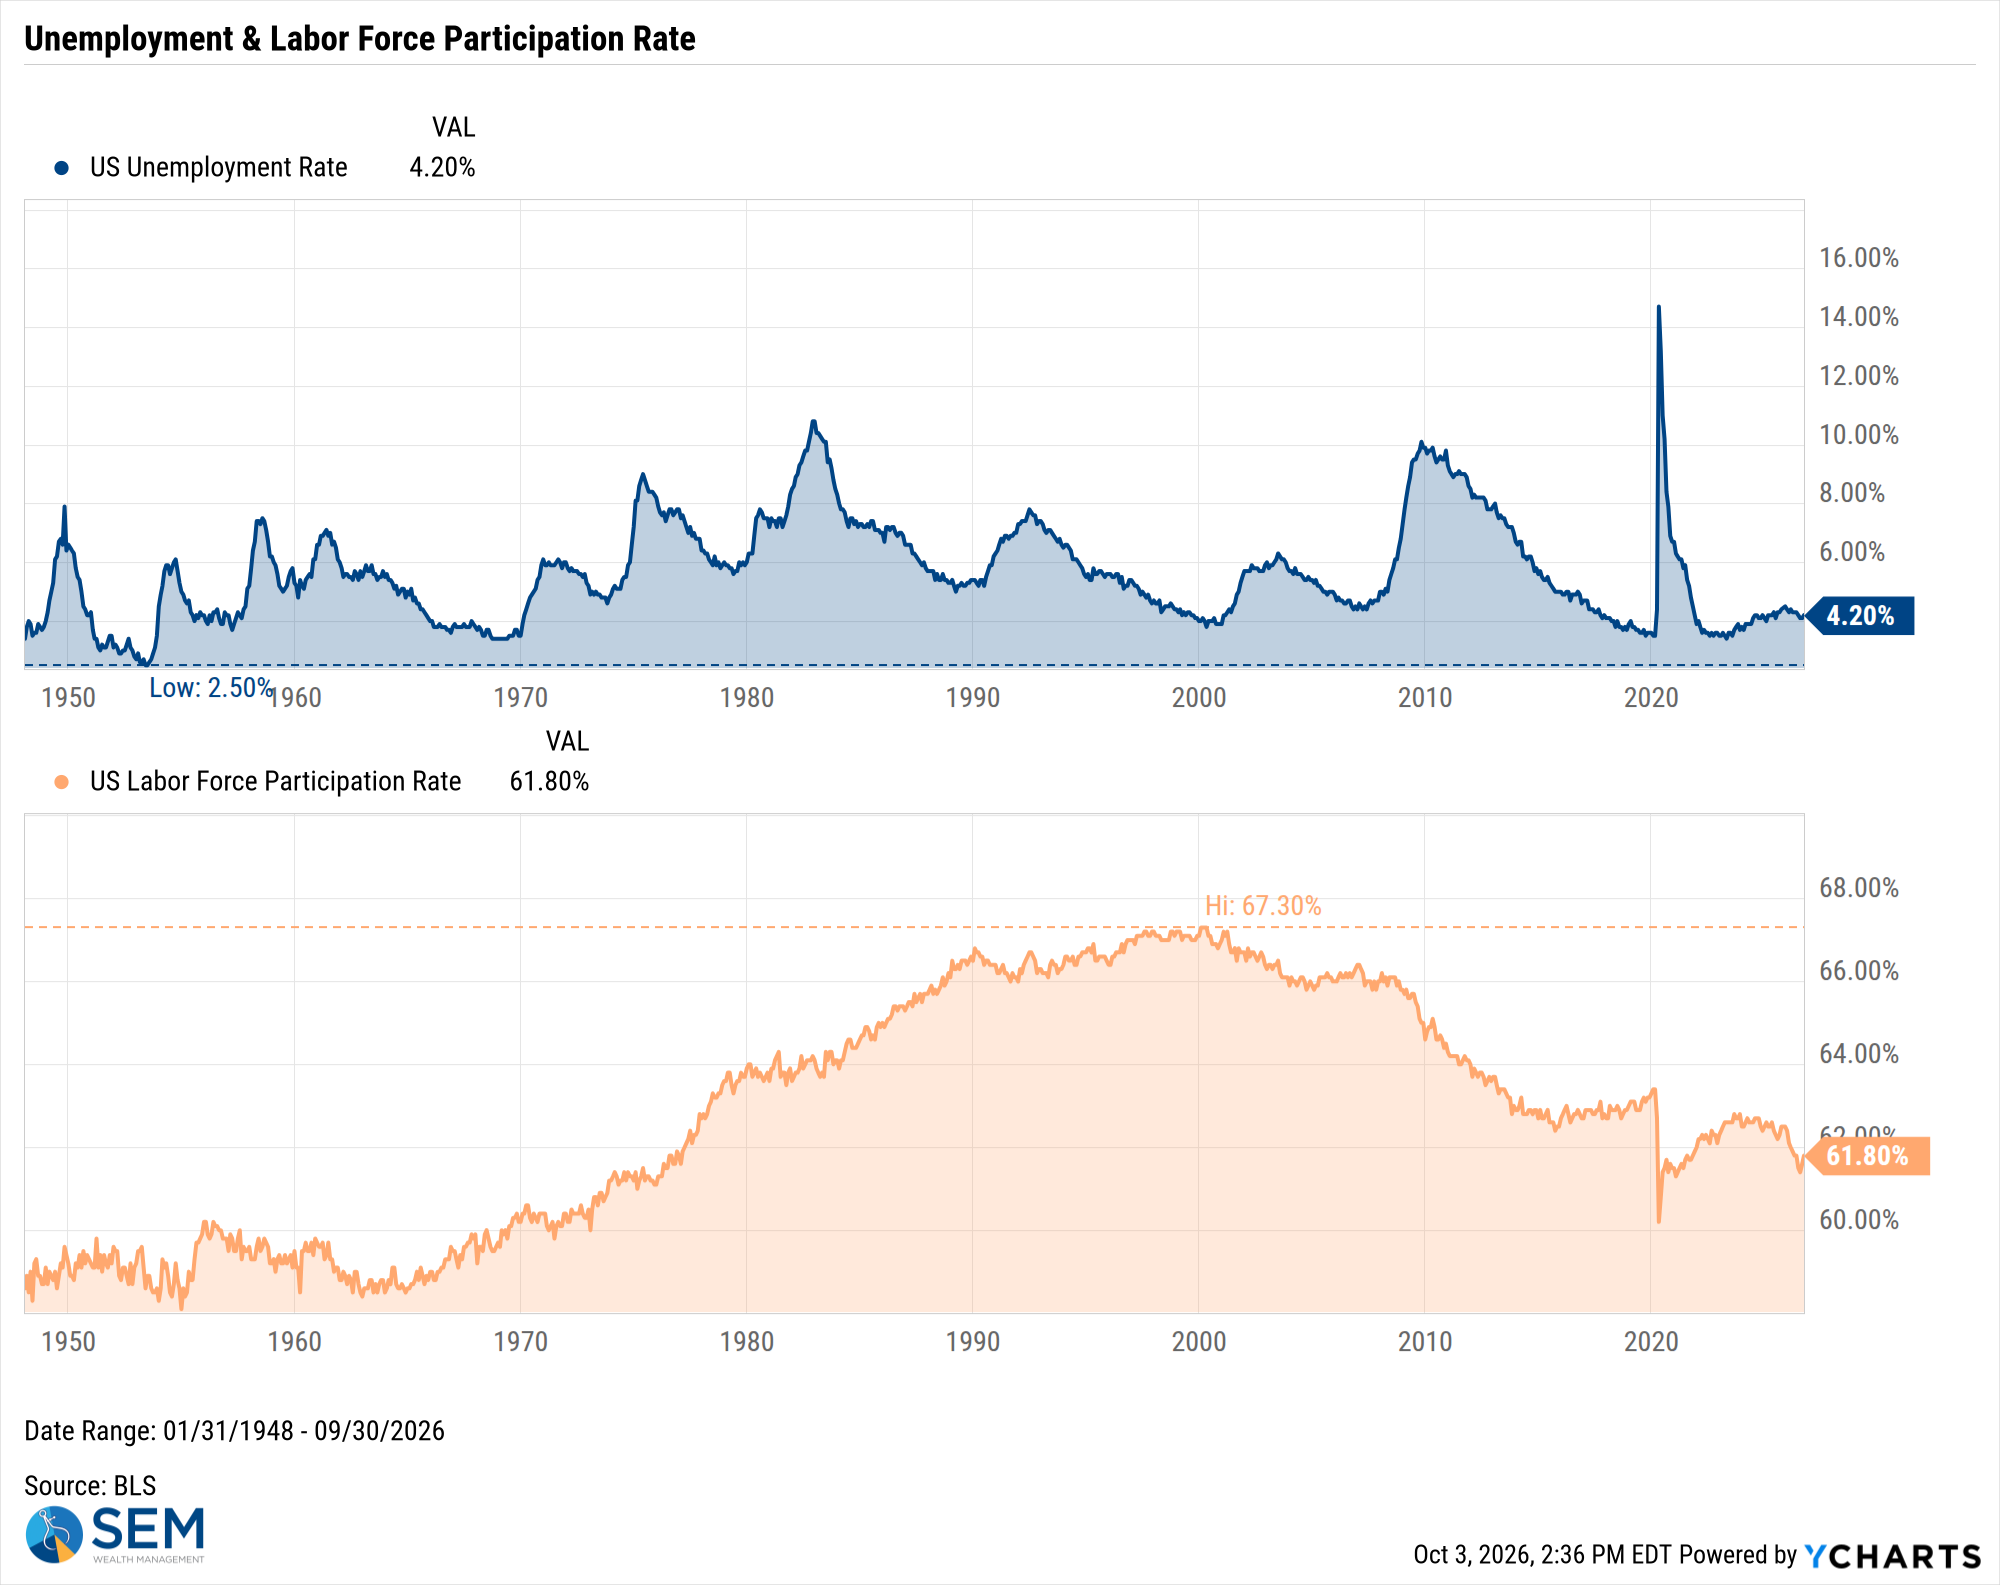
US Unemployment Rate data by YCharts
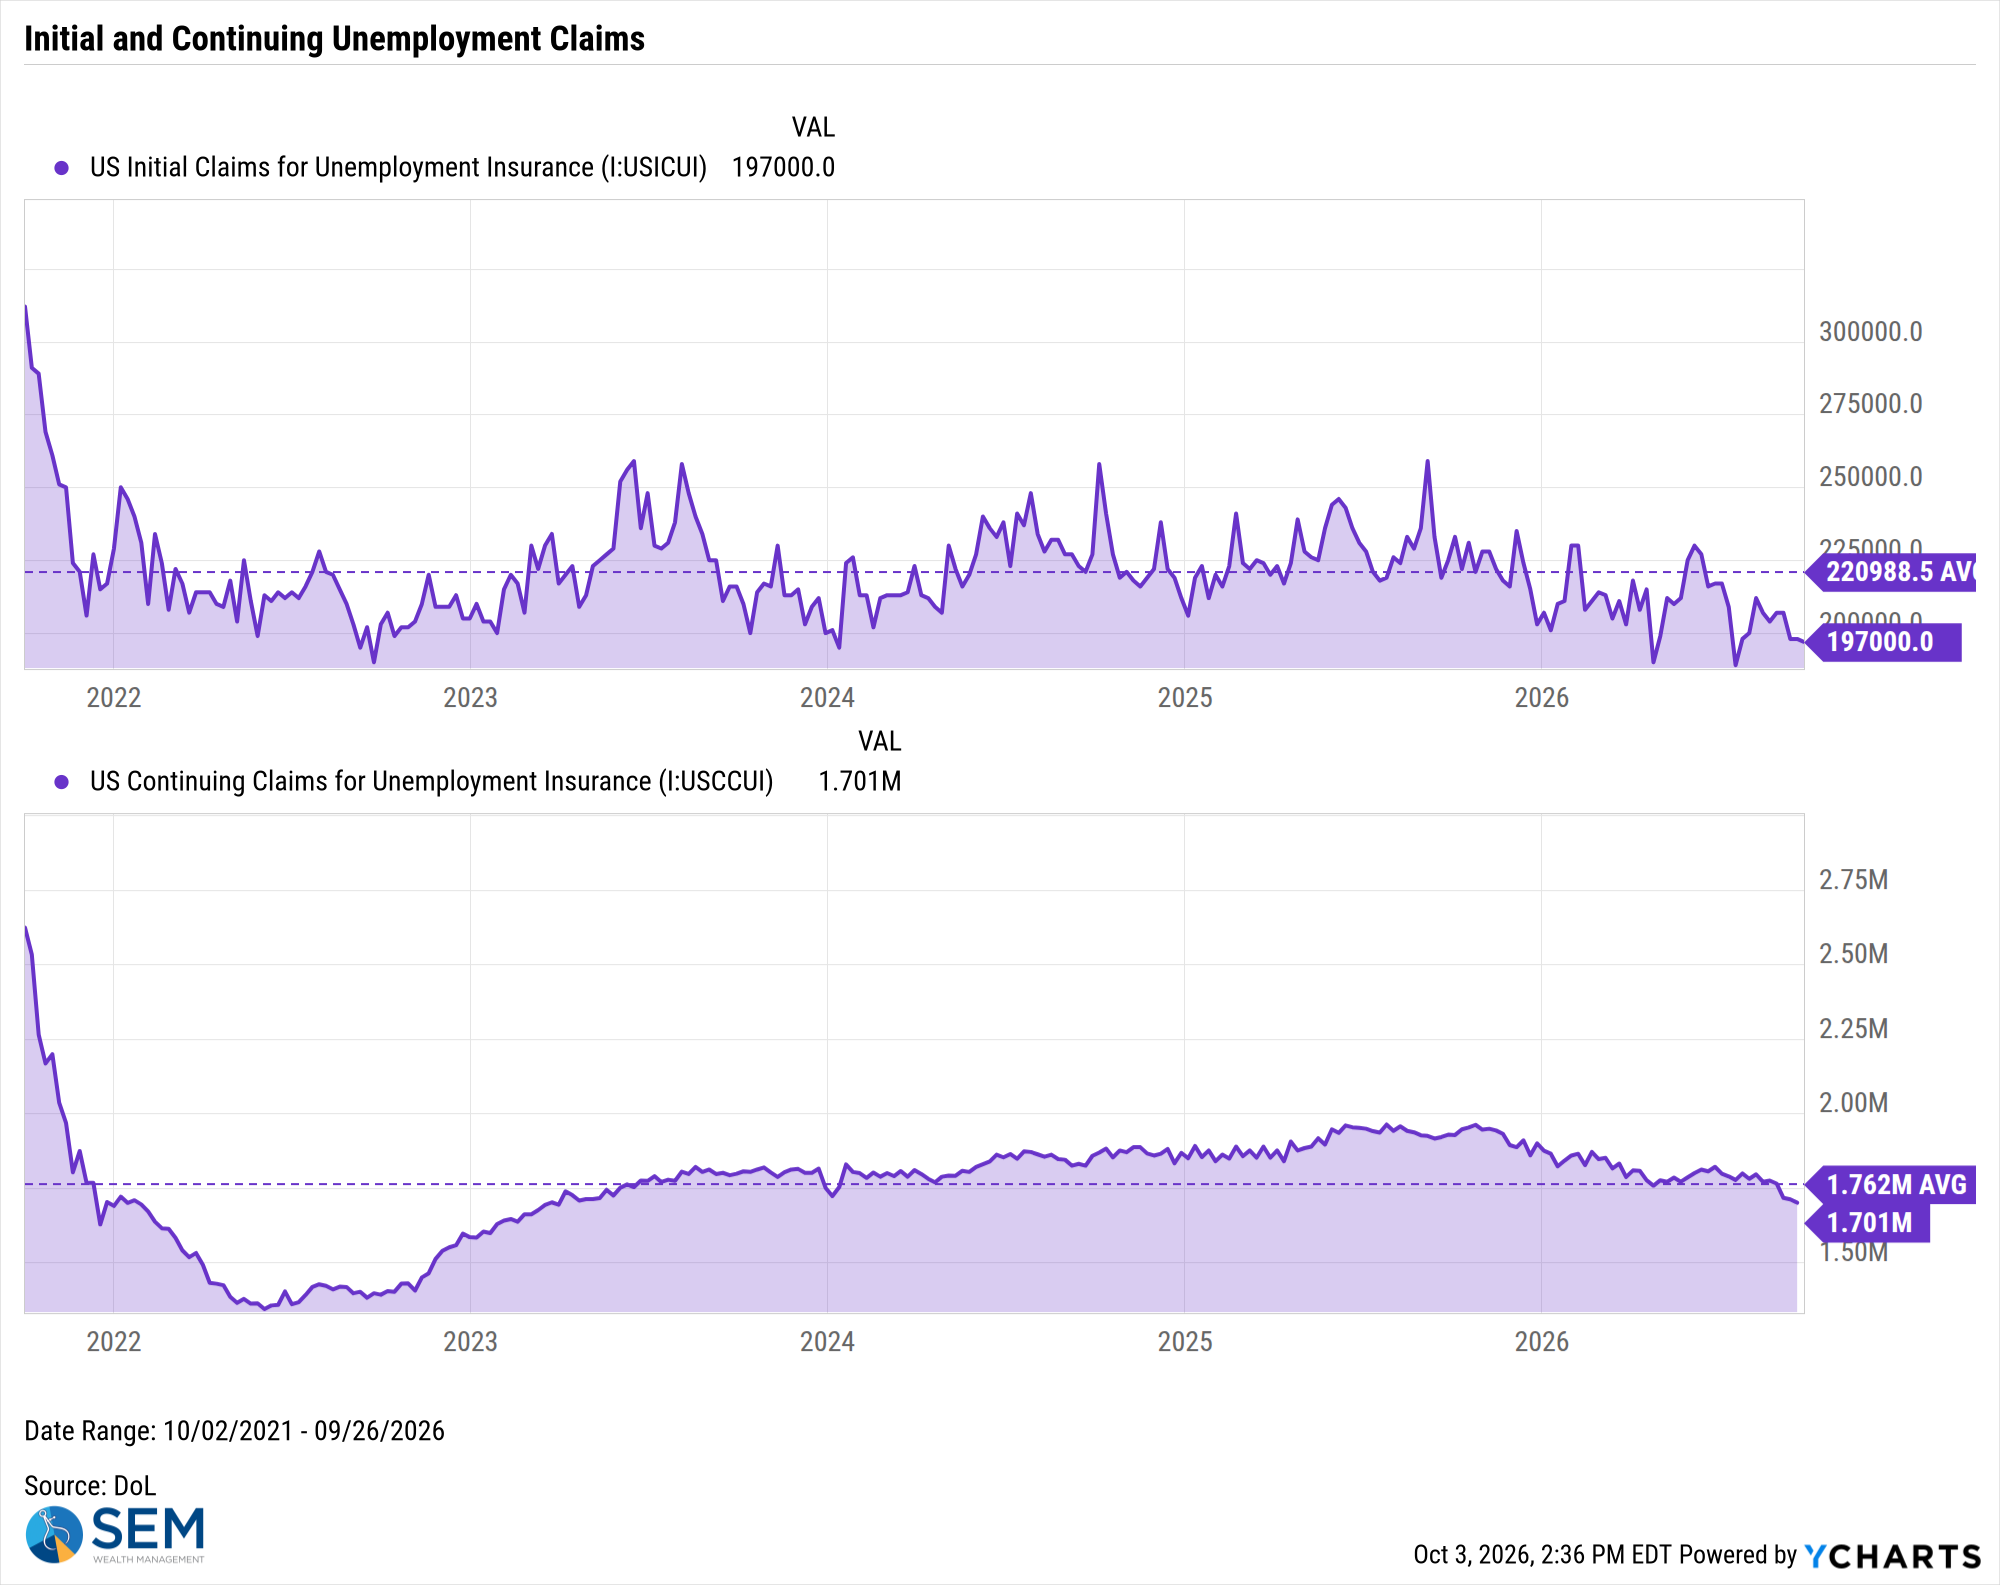
US Initial Claims for Unemployment Insurance data by YCharts
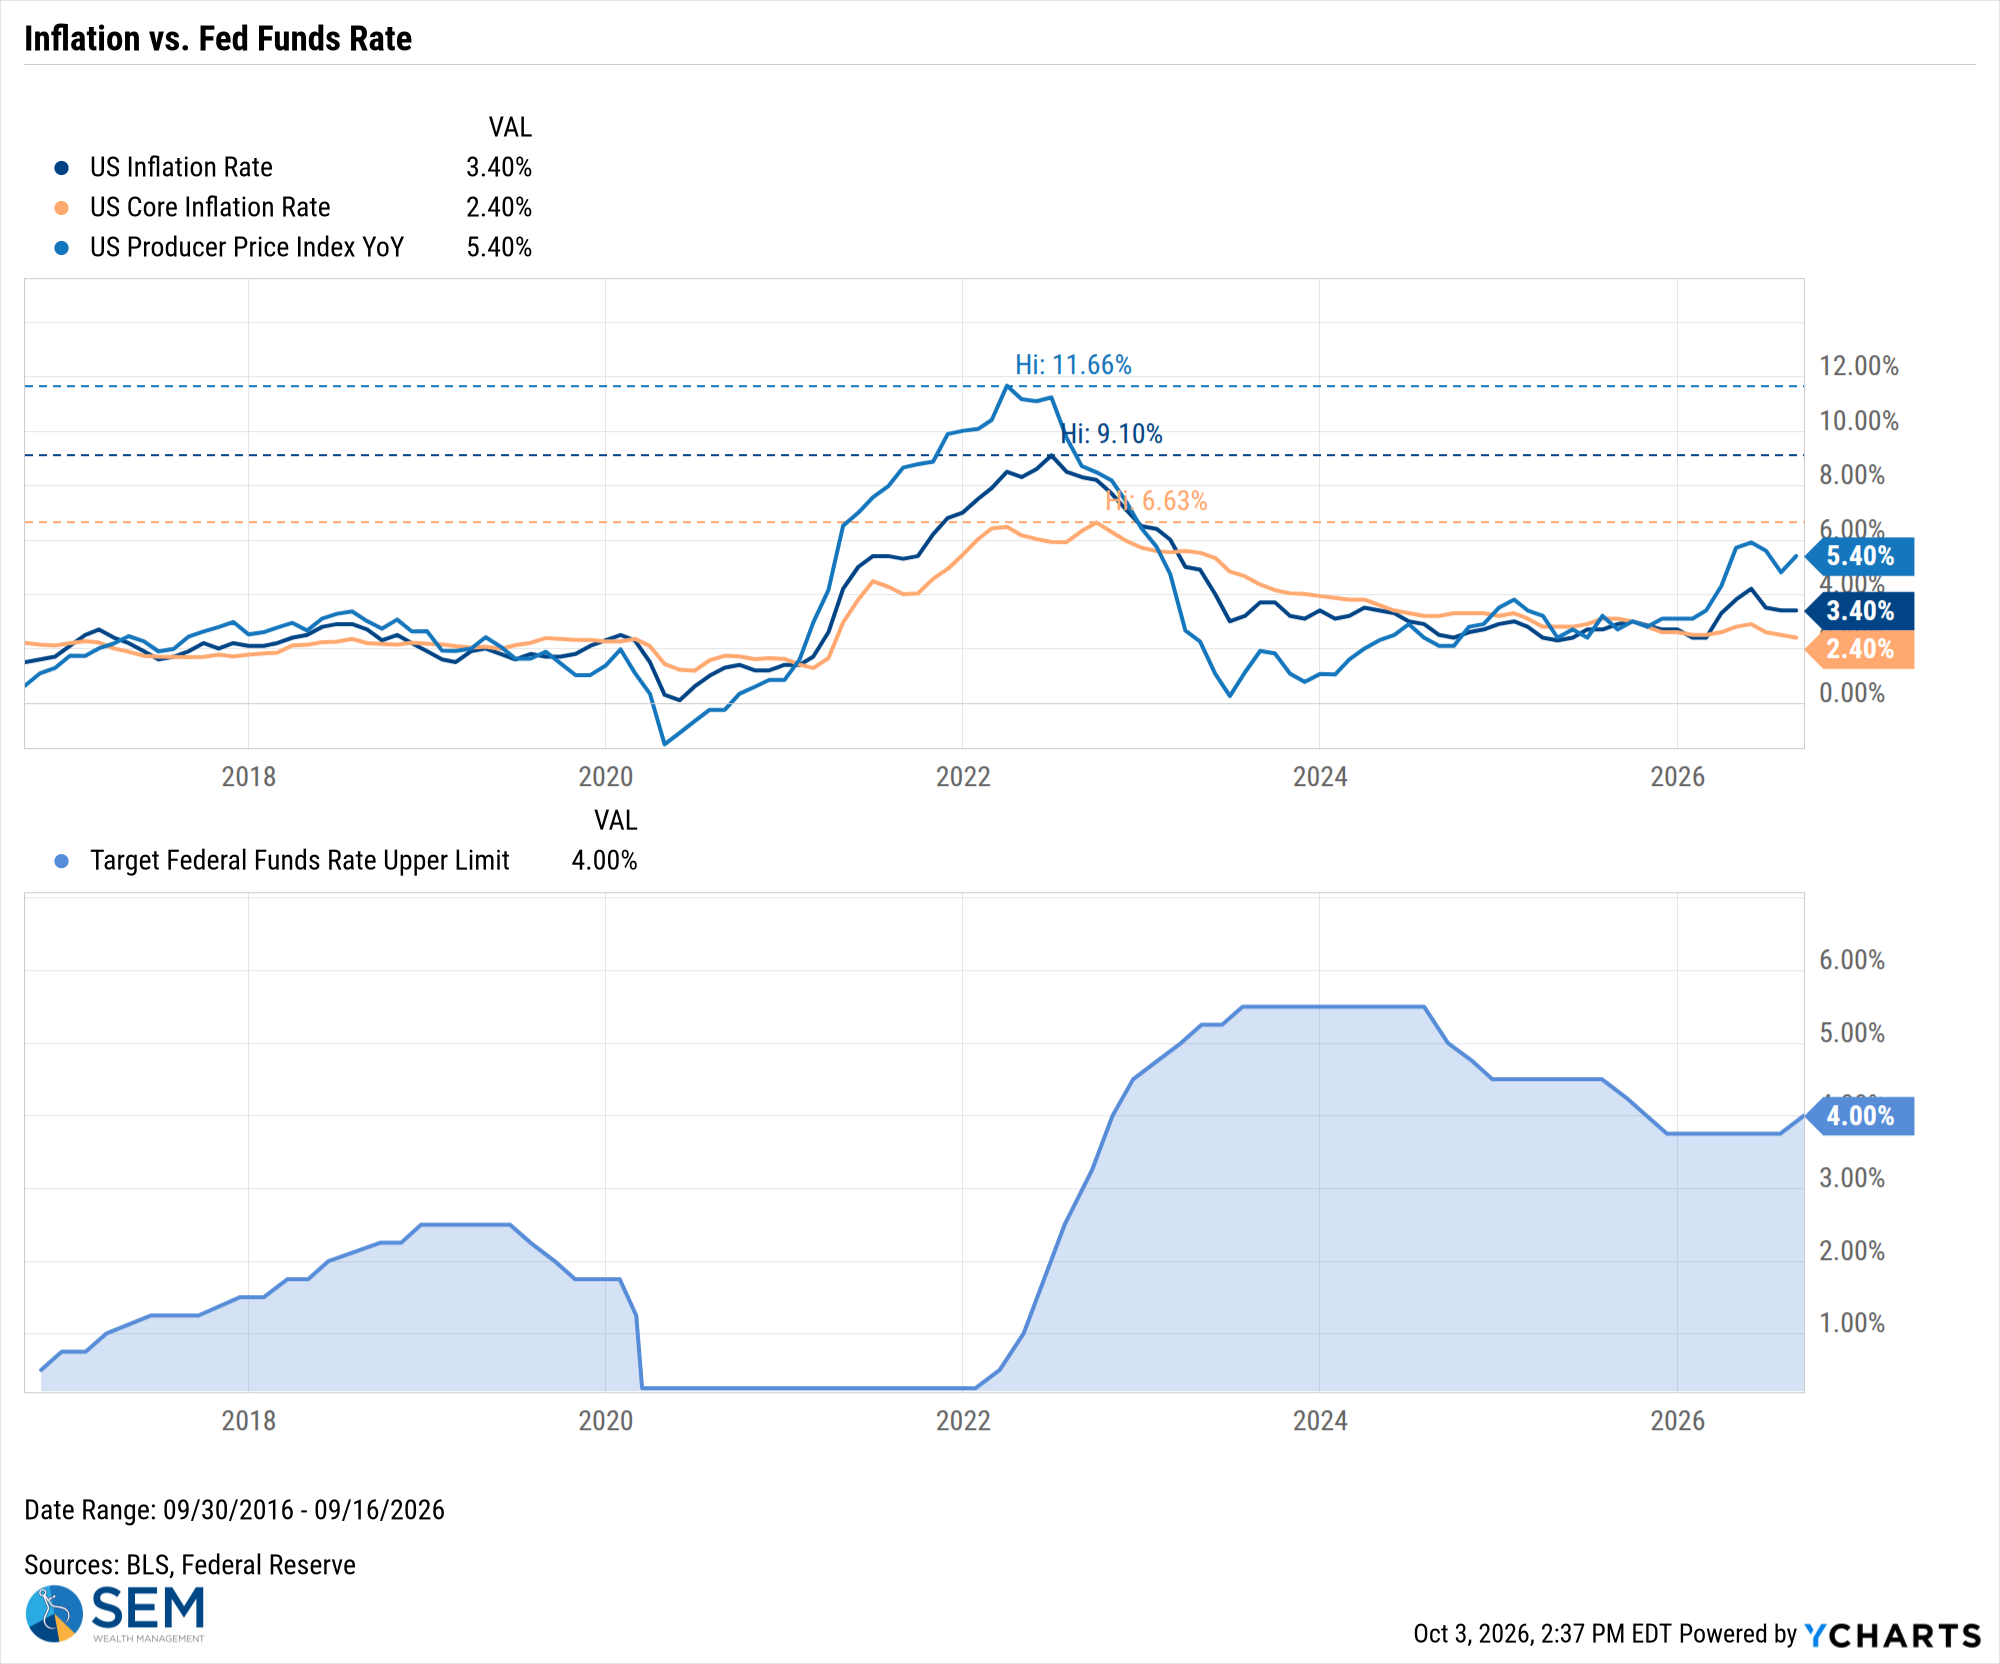
US Inflation Rate data by YCharts
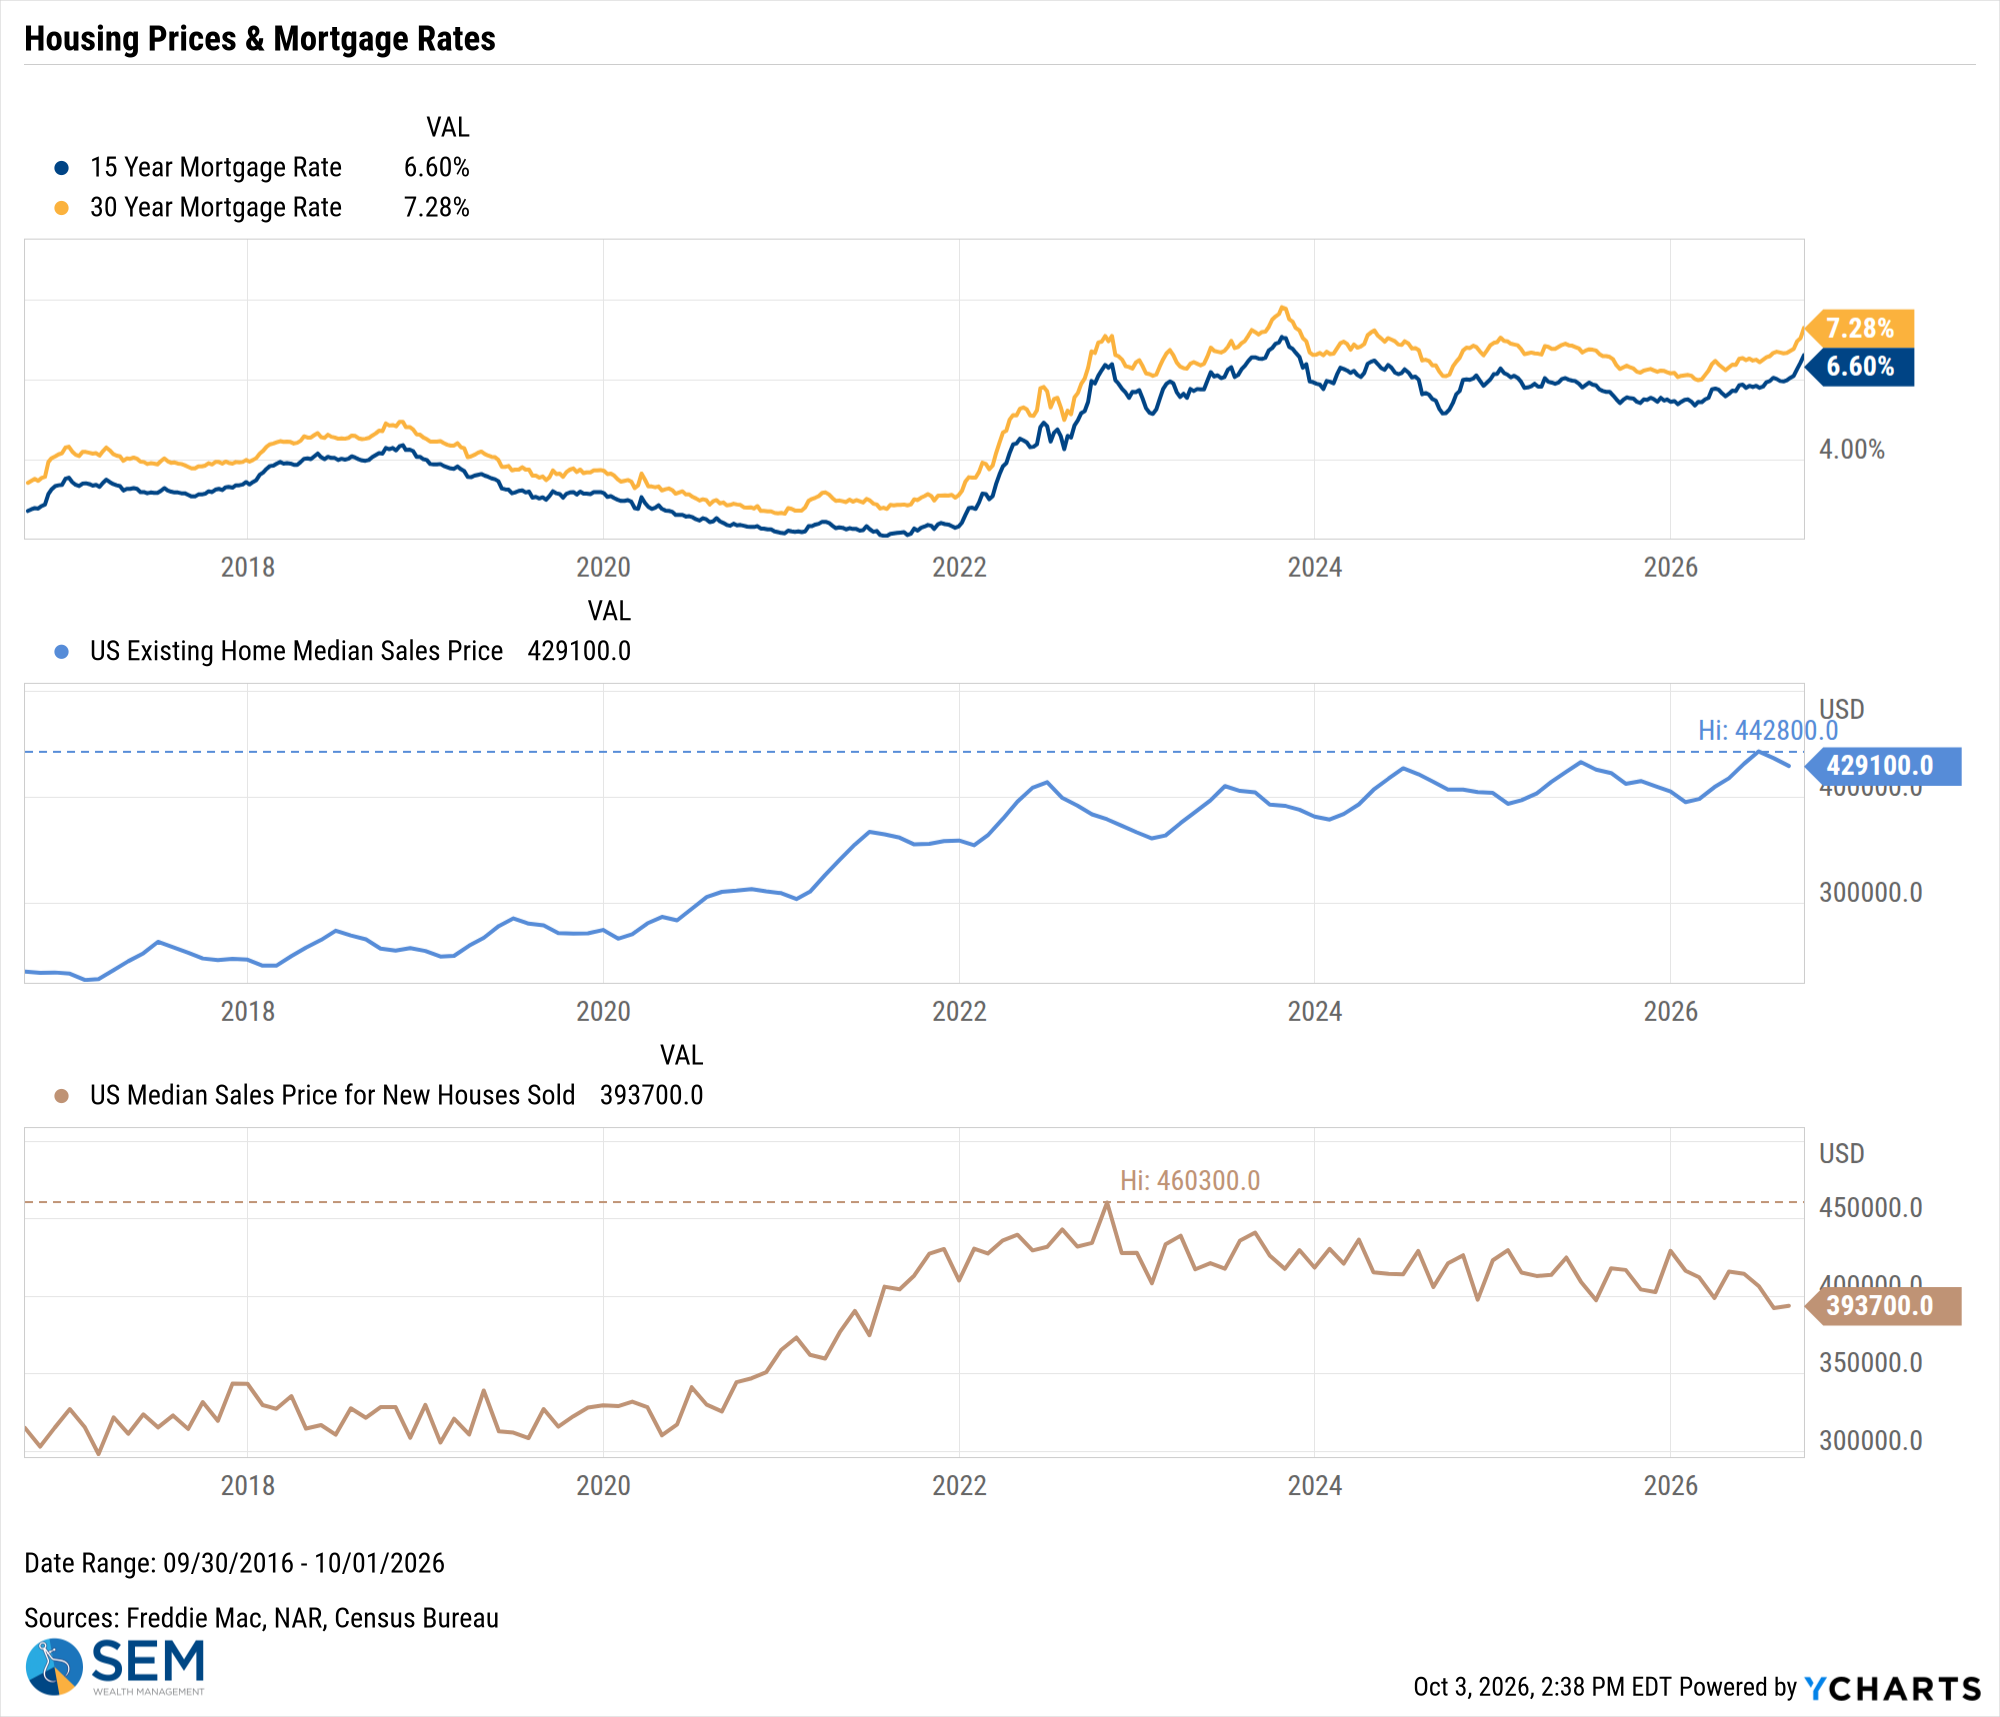
US Existing Home Median Sales Price data by YCharts
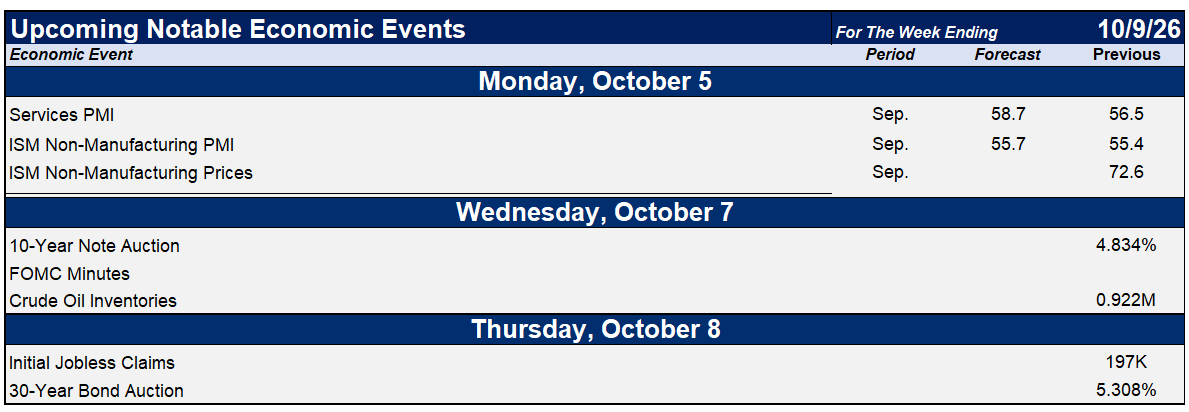
SEM Market Positioning
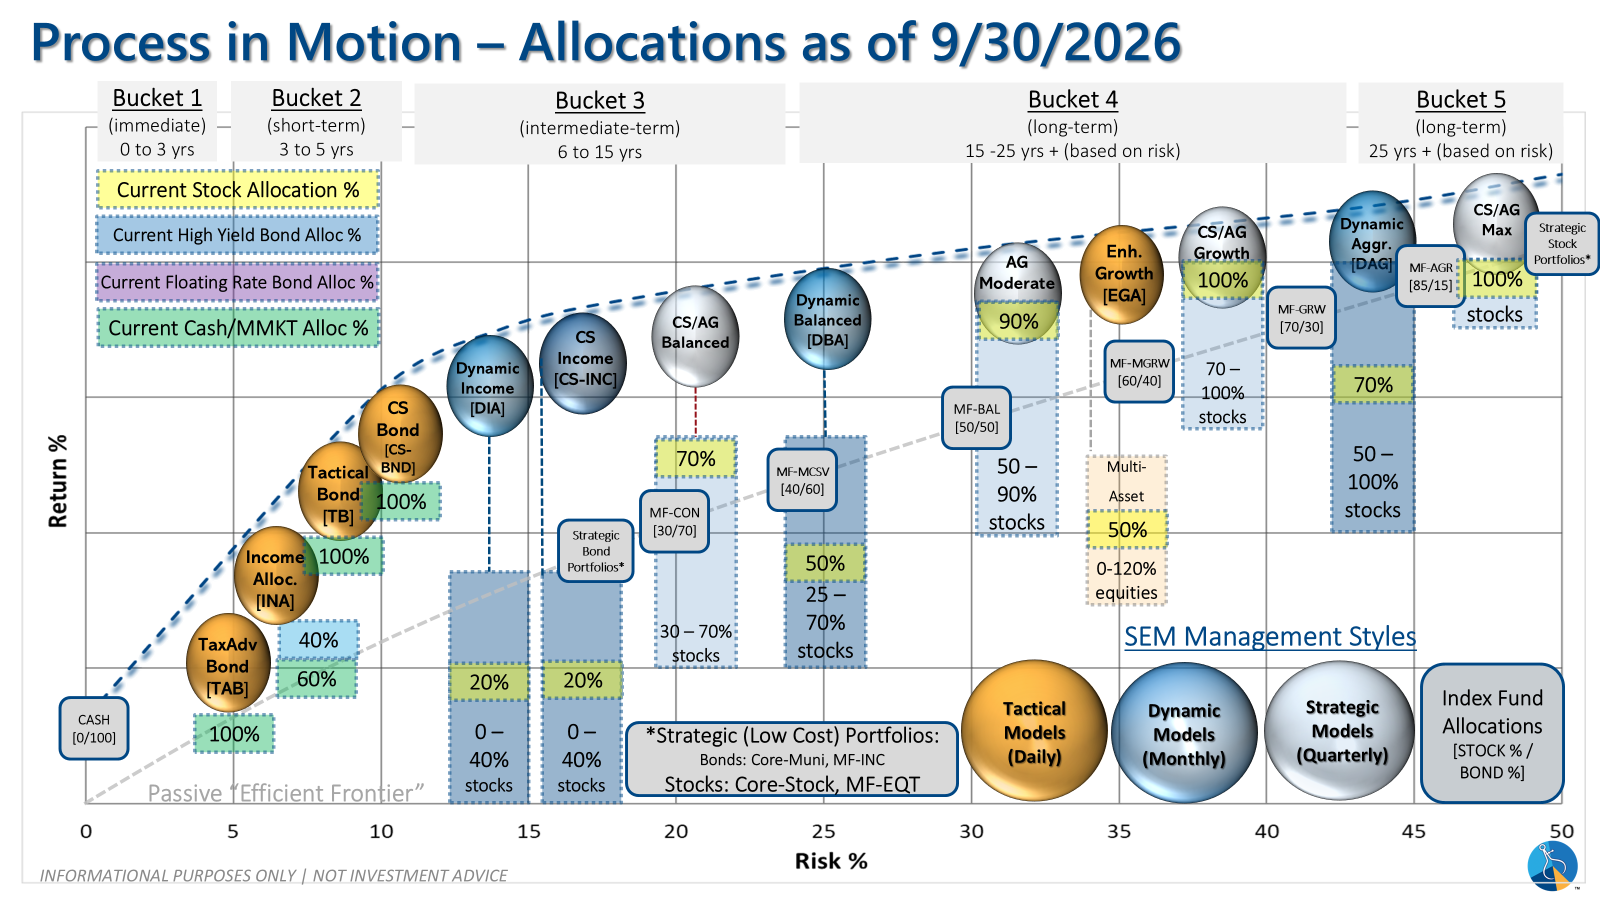
SEM deploys 3 distinct approaches – Tactical, Dynamic, and Strategic. These systems have been described as 'daily, monthly, quarterly' given how often they may make adjustments. Here is where they each stand.
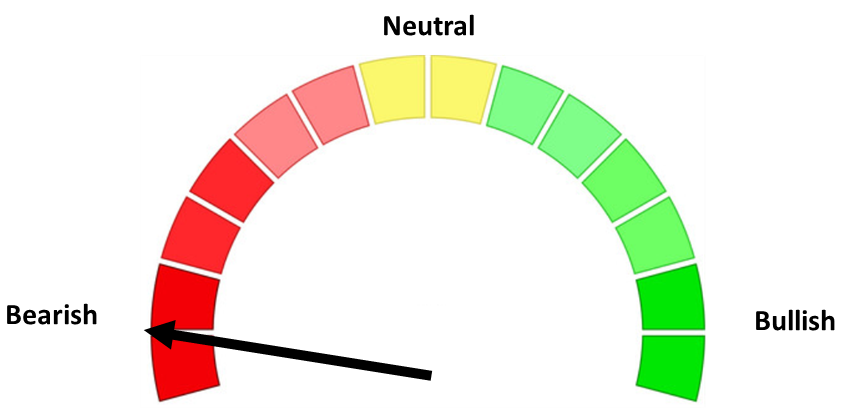
- Tactical = BEARISH (9/24/26) | 100% Money Market / Short Term Bonds (9/24/26) | High-yield trends reversed lower with spreads near historic lows.
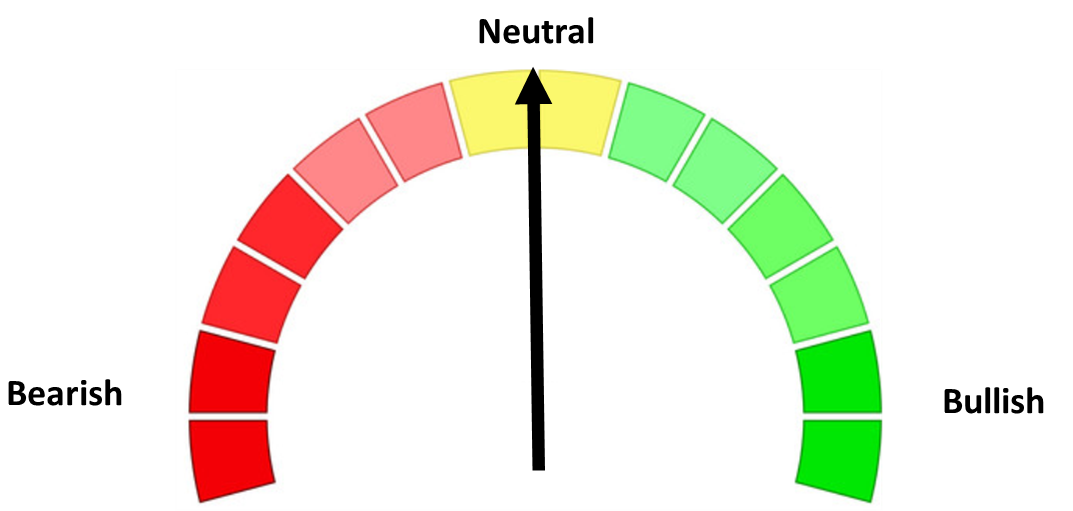
- Dynamic = NEUTRAL (2/15/2026) | "Benchmark" Allocation | Economic model inconclusive
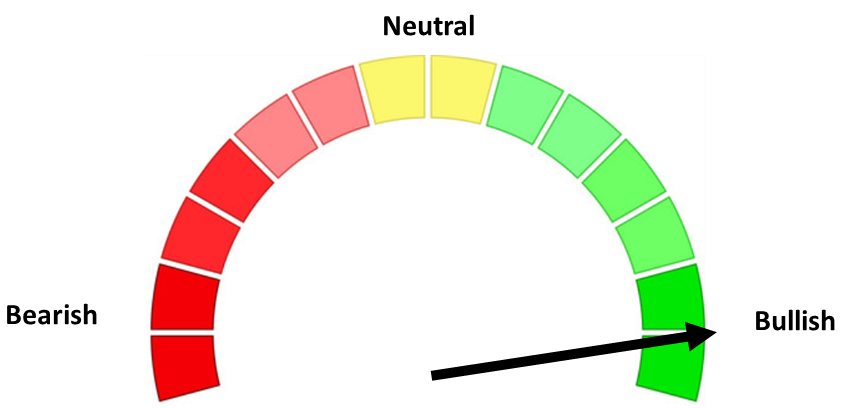
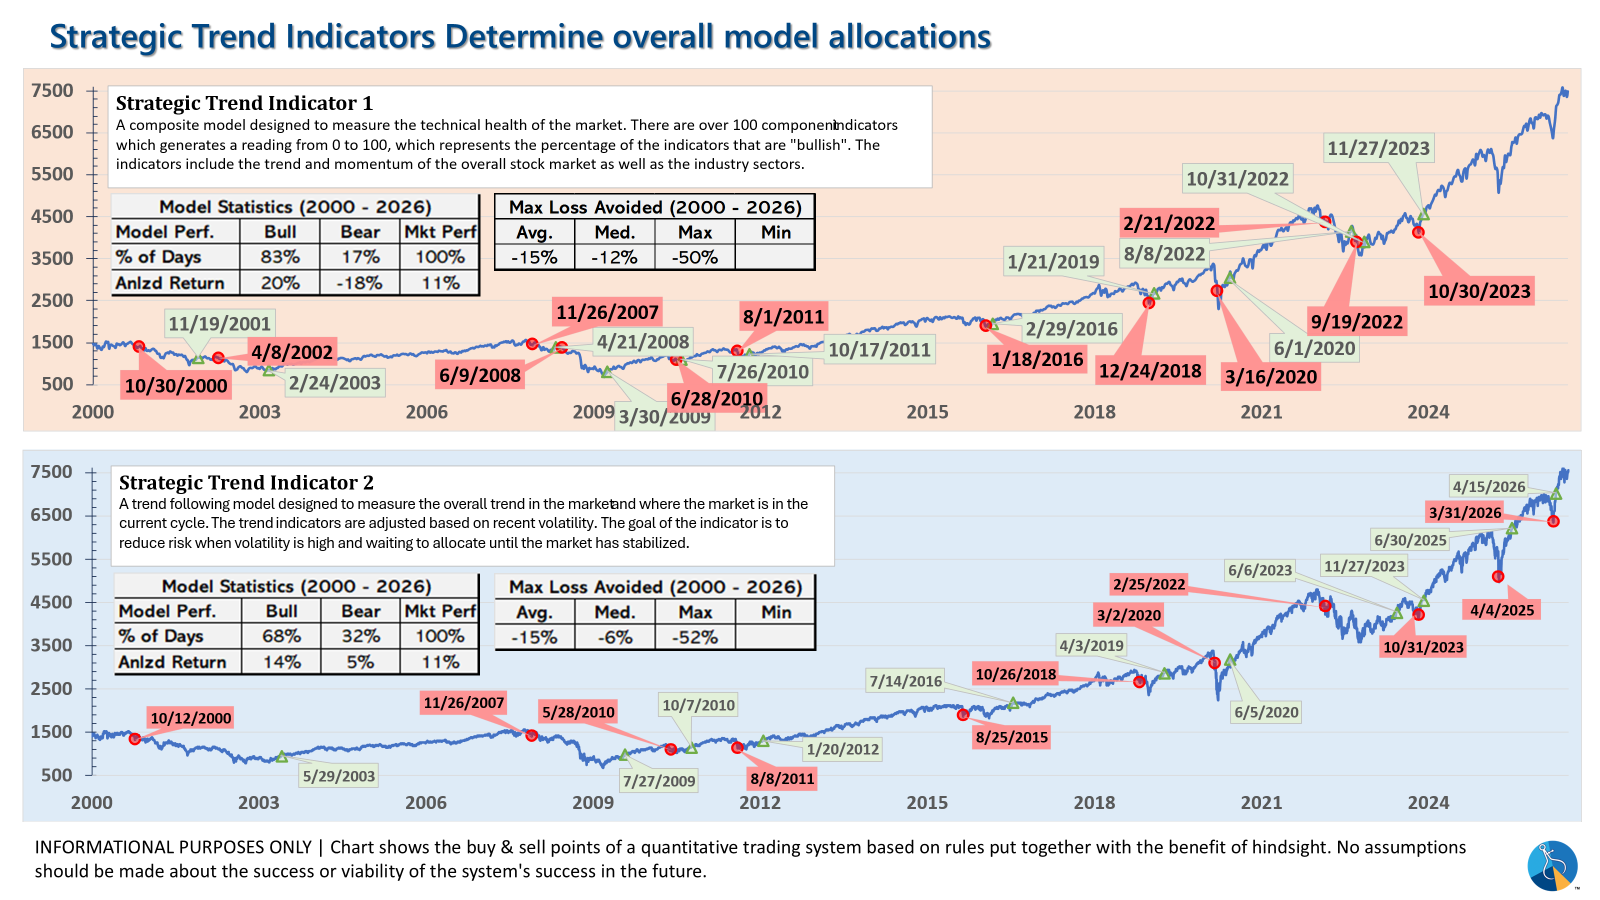
- Strategic = BULLISH (4/15/2026) | V-Bottom projecting "end" of Iran War
Tactical (daily):
- Monitored DAILY
- Models: Tactical Bond, Cornerstone Bond, Income Allocator, Tax Advantaged Bond
- Designed to follow the trends for use in our lower risk models
- SELL Signal issued September 24, 2026 (exiting the buy from April 8, 2026)
Dynamic (monthly):
- Monitored MONTHLY
- Models: All "Dynamic" Models (Income, Balanced, Growth, and Asset Allocator)
- Uses SEM's Quantitative Economic Model
- Designed to overweight riskier assets if economic trend is higher & underweight those assets if economic trend is lower.
- NEUTRAL signal issued February 15, 2026 (following BEARISH signal from July 2025)
Strategic (quarterly)*:
- Monitored QUARTERLY
- Models: AmeriGuard (Balanced, Moderate, & Growth) and Cornerstone (Balanced & Growth)
- Core Component: Quantitative Filter using 4 different time horizons across universe of asset classes
- Trend Indicator: Two different Quantitative Systems monitoring the intermediate-term trend, health of the market, and volatility
- CORE has been overweight small cap and international since October 2025 – overweight increased slightly in January
- Both TREND INDICATORS are BULLISH following 10% drop and "V-Bottom" reversal in early April
- AmeriGuard & Cornerstone Max DO NOT use the Trend indicator and are always 100% invested in stocks using our CORE rotation model.
The core rotation is adjusted quarterly. This quarter we saw half of our international positions reduced (we sold developed markets and kept our emerging markets exposure). We also saw the remaining share of mid-cap reduced in favor of more small cap exposure. We remain with a "barbell" core portfolio – about half in large cap and half in small cap as the models expect the market to "broaden".
The * in quarterly is for the trend models. These models are watched daily but they trade infrequently based on readings of where each believe we are in the cycle. The trend systems can be susceptible to "whipsaws" as we saw with the recent sell and buy signals at the end of October and November. The goal of the systems is to miss major downturns in the market. Risks are high when the market has been stampeding higher as it has for most of 2023. This means sometimes selling too soon. As we saw with the recent trade, the systems can quickly reverse if they are wrong.
Overall, this is how our various models stack up based on the last allocation change:
Curious if your current investment allocation aligns with your overall objectives and risk tolerance?