I like to think of myself as an emotionally grounded individual. Any time I can, I try to make the least emotional decision possible. Consider the facts, alternatives, potential wins and losses, that sort of thing. That all goes out the window when it comes to sports. The only thing that matters is what just happened. That isn't more true than when America's most popular sport, football, is going on.
The problem with football, especially when it comes to those emotions, is that there isn't a big difference between winning the game and losing the game, yet your thoughts about the game and the future are drastically different depending on whether your team got the win or the loss. Every win makes you feel like they have it all figured out and may never lose again. Every loss makes you feel like they may never win again. This leads to the "it's so over, we're so back" roller coaster.
We have the benefit of hindsight to know that we're almost always wrong with these emotional outlooks on the future. Your team will always win AND lose in the future, regardless of how positive or negative you feel the day after the game. The same is true with economic trends. With the exception of the stock market, when zoomed way out, most things that have gone up have gone back down, and vice versa. We know that, but the question is the timing of these corrections. How high will the trends rise before they correct? How long will it be before things correct? Well, let's go through an update on some of those economic trends and see if we can find an answer.
Since I spoke to you seven days ago, prices have not gone in the direction we hoped. Diesel has really taken off, rising another quarter per gallon in just the last seven days. That's the kind of change that can't be ignored. The easiest and most direct way to lower prices would be an end to the Iran war, which has not made any headway in the last week. So, the administration has tried a new, drastic way to deal with this issue.
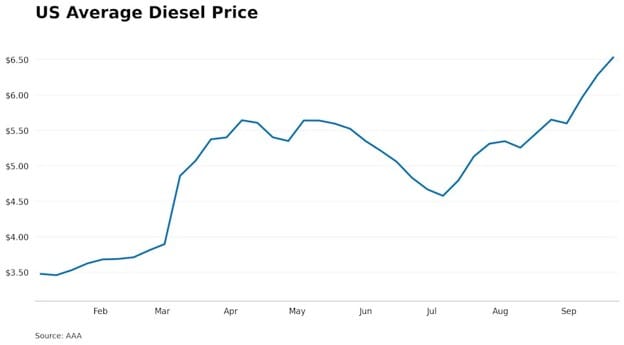
The news last week of a proposed 90-day diesel export ban could help the supply problem with diesel and should theoretically allow a dip in price. As is the case most times, if the solution seems like a simple one, it likely isn't that simple. In this case, a number of experts and economists have pointed out how this could backfire, such as diesel manufacturers simply reducing their own production to offset the increased supply, keeping prices right where they are. There may be a need for a simple short-term solution to help prices and give people some optimism and relief. This isn't a foregone conclusion, so we will have to wait and see if this export ban actually goes through.
Diesel going up isn't some independent metric that doesn't affect us as long as we drive a gas-powered vehicle. Our stuff gets to us through diesel trucks and ships. Farming equipment runs on diesel. This is just one of many examples economists can point to that show how intertwined the economy really is. Chances are we are all affected by these changes in the economy, even if it doesn't seem like we are directly.
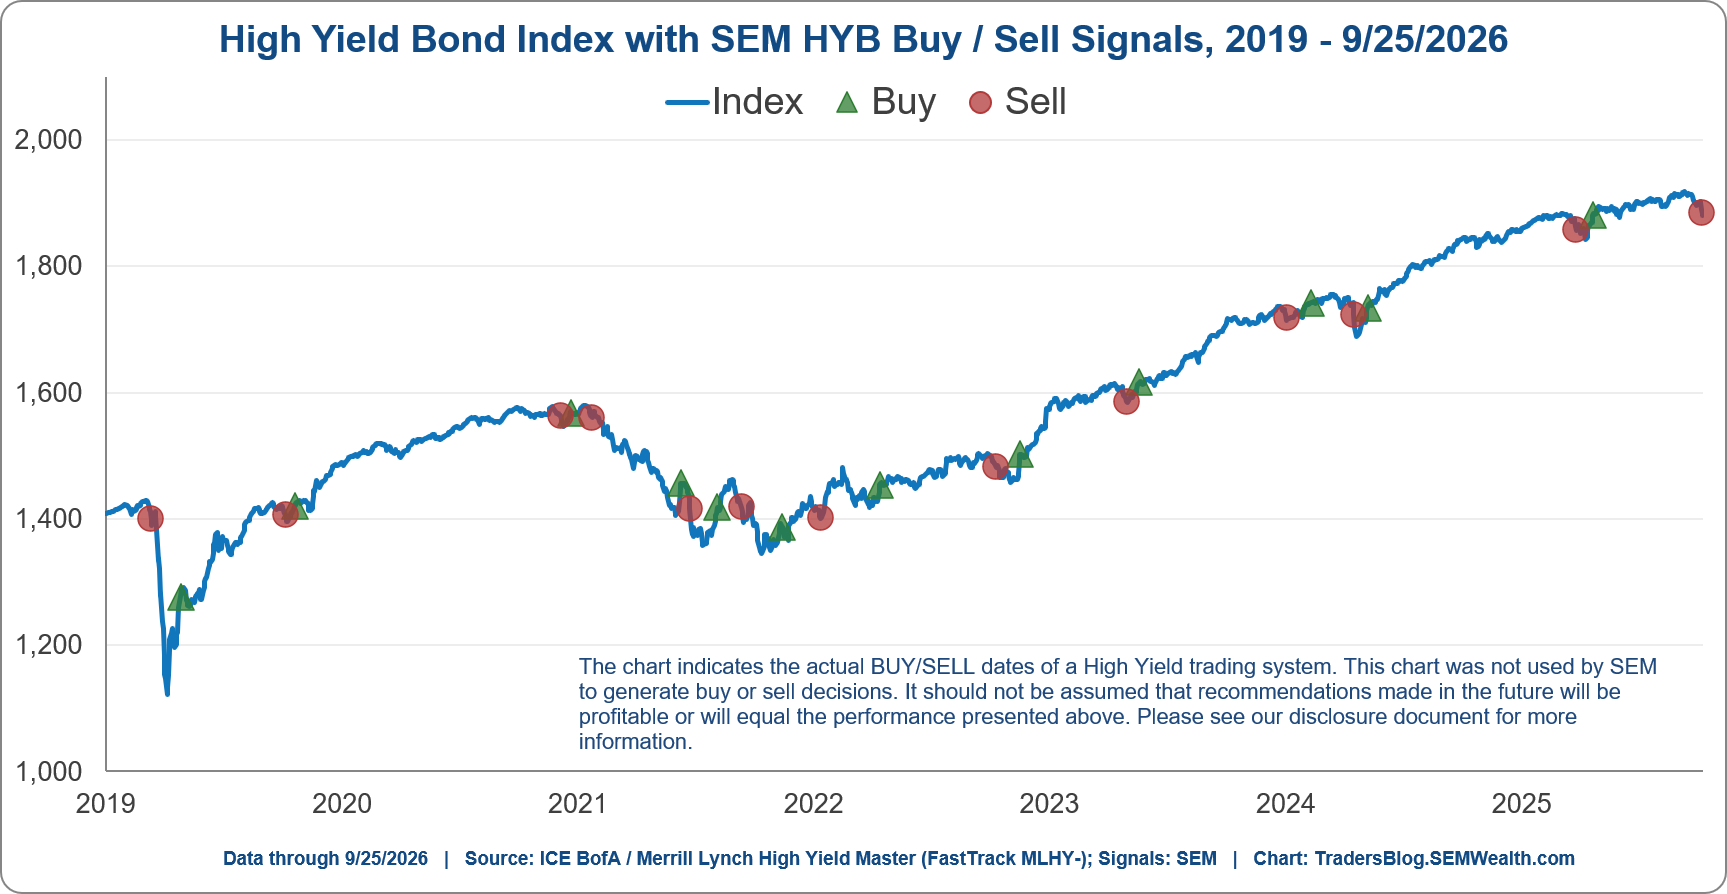
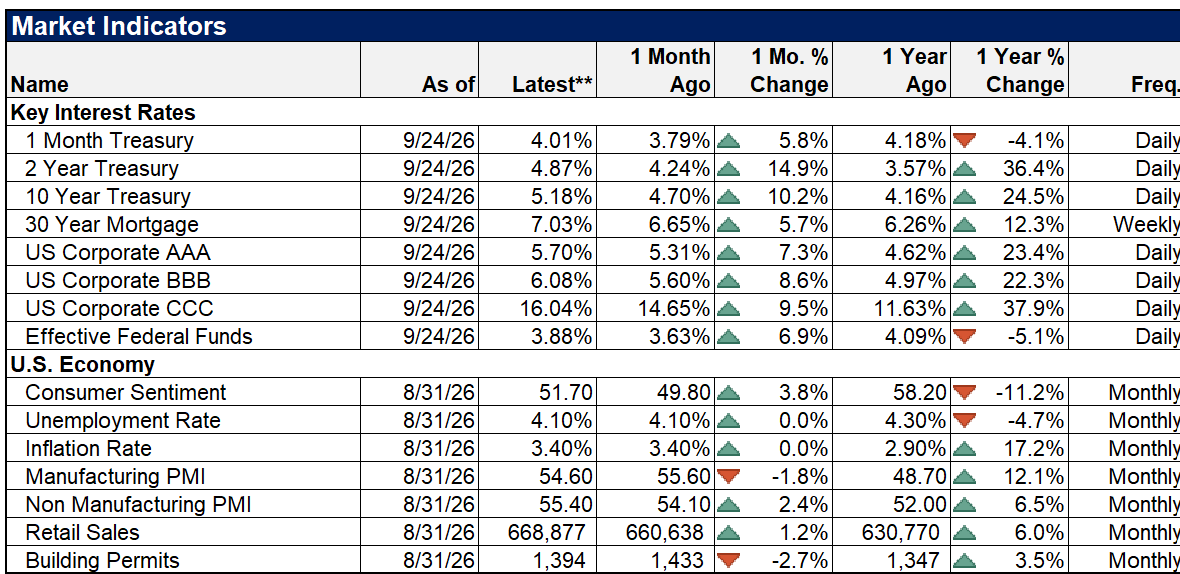
Unfortunately, rising diesel prices weren't an isolated incident last week. We also saw Treasury yields rise again, with the 10-year yield reaching the highest level it's been since 2007. This change in yields, caused by a decline in bond prices, led us to make sales in our fixed-income models last week, which had been invested in high-yield bonds for most of the summer. What that means for the rest of us is that mortgage rates have once again risen, with 30-year rates above 7.3%.
These rates make it difficult to access your home's equity because, unless your home's increased value is being used to pay cash for your next home, you are going to have a more expensive loan for that next home. This leaves people feeling like they are stuck where they're at, which is bad for sentiment.
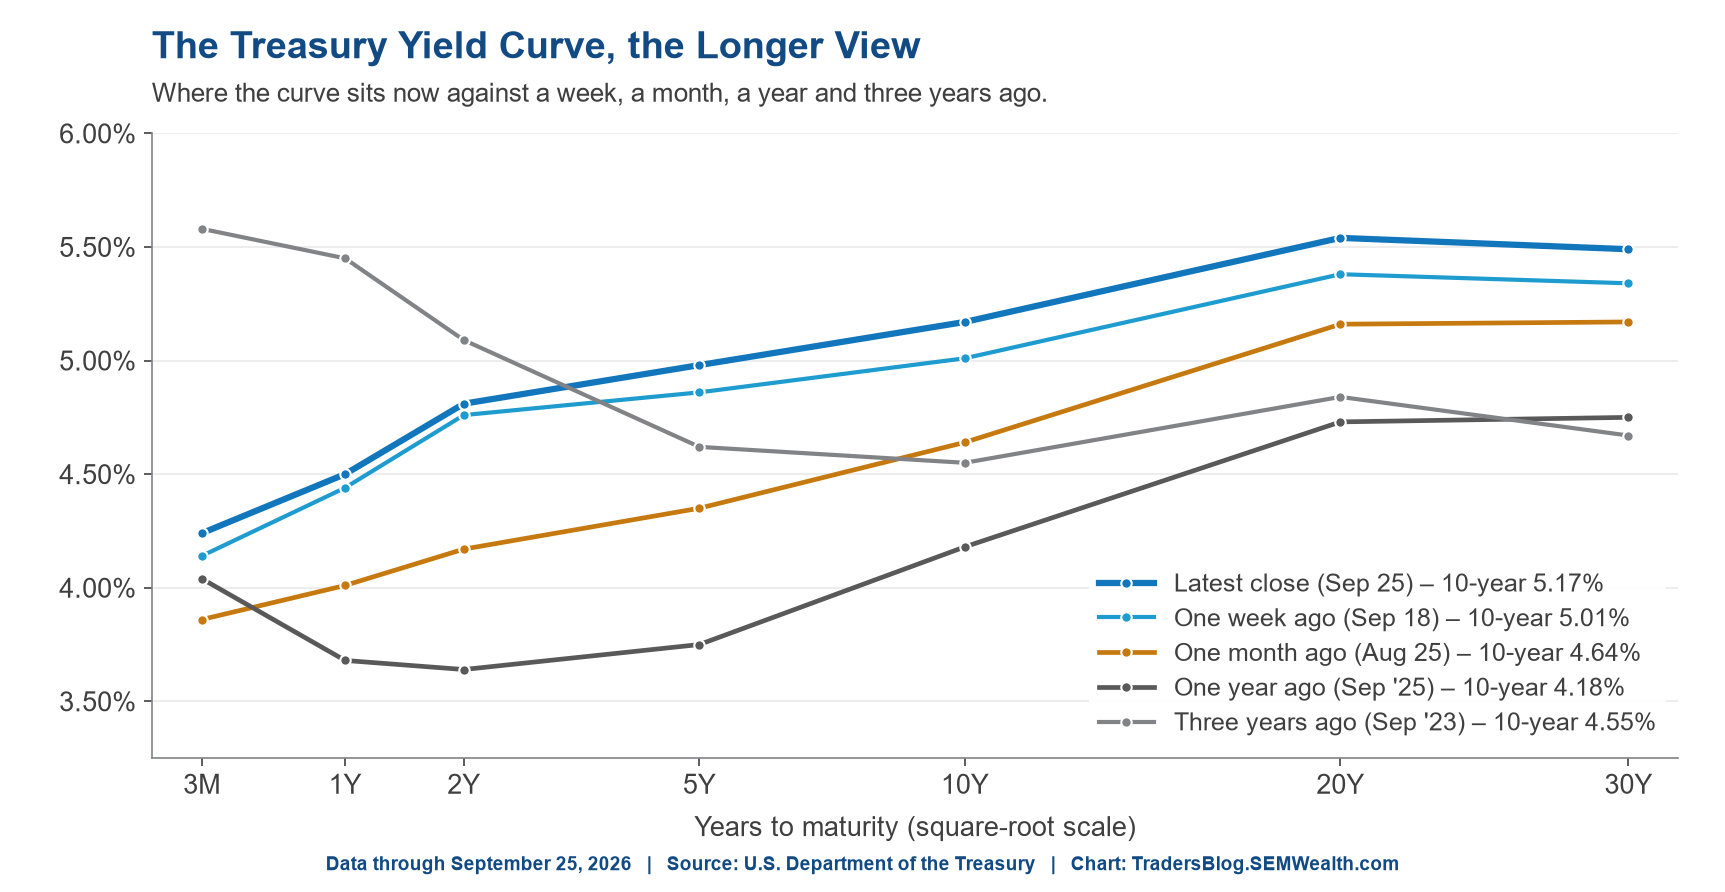
As I said last week, it is my opinion that as borrowing rates go up, inflation will ease. The problem with raising borrowing rates while things are unaffordable, however, is that you're making it more difficult to buy things. I'm not smart enough to find a way for you to handle both of those issues at the same time.
While these trends are overall bad for the economy, they haven't done anything to change the midterm forecasts. Those have stayed the same since last week, still showing that Democrats are favored to win the House and slightly favored to win the Senate. We're a week away from potential "October surprises," which I will state are almost always overblown and are simply attempts to make as loud a noise as possible before the election.
You will be hearing a lot of noise, and if any of it is real, we will make note of that. We've also entered the time in the cycle where, if the races are still showing as competitive, the tactic will be to attack the opponent. Things are going to get very negative, and that can impact our own emotions. Hopefully you're able to avoid as much of that as possible.
The good news in all of this is that there are a lot of ways for things to turn around for the economy. Even if you use expensive fuel and high yields as a reminder of how things were in 2007, right as things got really bad for a lot of people, you can also look at that period and see that we got through it and recovered. The economy acts in cycles, after all.
So, you don't need to have the mindset that "it's so over" like you do when your football team loses. I'm not one to make predictions, but I'll go out on a limb and say that this isn't the downfall of America, and we will get through whatever negativity we are going through.

The One Assumption Behind the AI Build-Out
Hyperscaler free cash flow is falling by design. The market is betting it recovers on schedule.
As we discussed in previous blogs, the hyperscalers' build-out of artificial intelligence is probably the biggest bet our nation has made in our lifetimes. The critical question is whether these companies and investors see their capital-intensive investment pay off in a timely fashion. By doing so, we can track their success by following their free cash flow.
First, let's define free cash flow ("FCF").
According to the CFA curriculum, free cash flow is defined as:
The actual cash that would be available to the company’s investors after making all investments necessary to maintain the company as an ongoing enterprise (also referred to as free cash flow to the firm); the internally generated funds that can be distributed to the company’s investors (e.g., shareholders and bondholders) without impairing the value of the company.
The largest cloud companies are spending on AI infrastructure at a pace with little precedent, and free cash flow is where it shows. The question for investors is what has to go right for that spending to pay off.
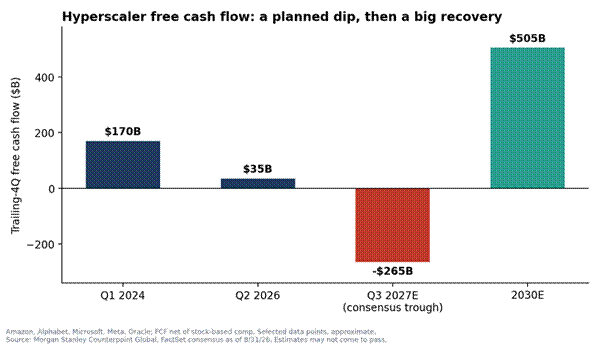
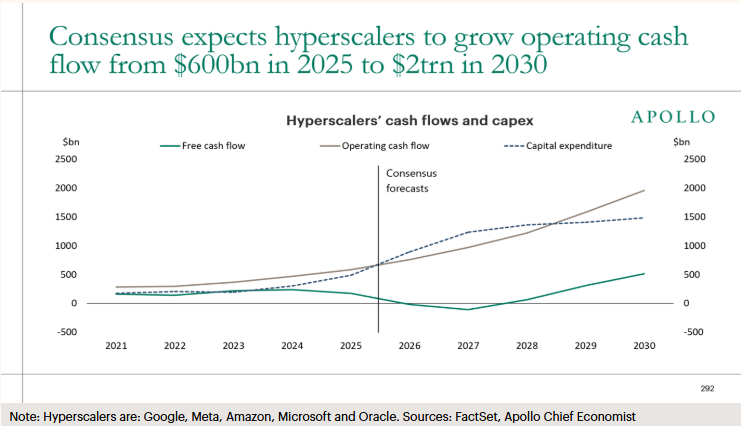
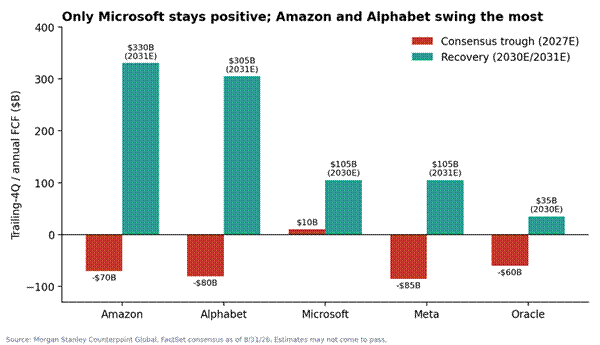
Free cash flow is being squeezed. Morgan Stanley’s Counterpoint Global tracks combined free cash flow for Amazon, Alphabet, Microsoft, Meta, and Oracle, adjusted for stock-based compensation. Trailing-four-quarter free cash flow fell from roughly $170 billion in early 2024 to about $35 billion in Q2 2026. Consensus has it bottoming near -$265 billion in Q3 2027, then recovering to about $505 billion by 2030. Microsoft is the only one of the five expected to stay positive throughout.
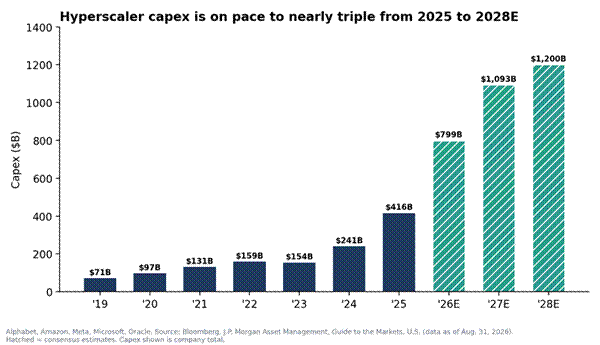
The spending is accelerating. J.P. Morgan Asset Management’s Guide to the Markets shows capex at the five hyperscalers rising from $71 billion in 2019 to $416 billion in 2025. Consensus expects $799 billion in 2026, $1.09 trillion in 2027, and $1.2 trillion in 2028. As a share of sales, capex is forecast to run above operating cash flow in 2026 and 2027, pushing free cash flow to about -4% of sales at the 2027 low before it turns positive again in 2028.
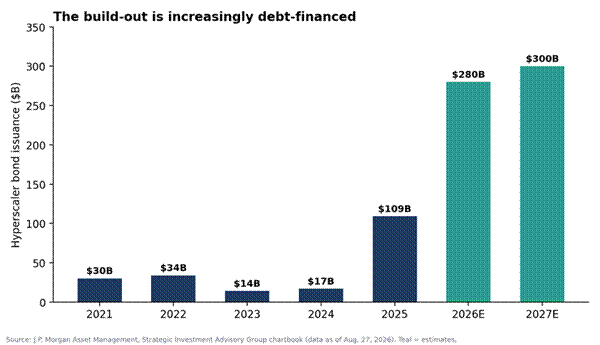
The funding mix is shifting toward debt. The same J.P. Morgan slide notes that, unlike past infrastructure booms, the AI wave has so far been financed primarily through cash flows, as operating cash flows have risen alongside capex. That is changing. J.P. Morgan’s Strategic Investment Advisory Group shows hyperscaler bond issuance rising from $17 billion in 2024 to $109 billion in 2025, with $280 billion estimated for 2026 and $300 billion for 2027.
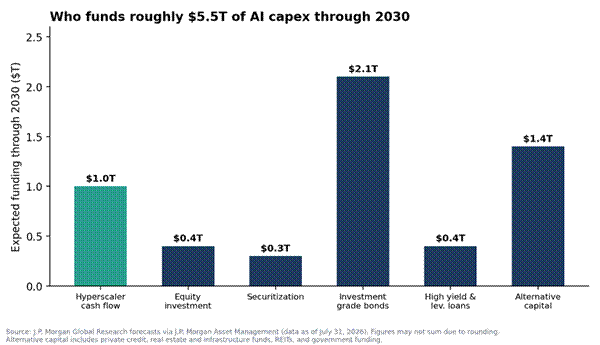
Looking through 2030, J.P. Morgan Global Research expects roughly $5.5 trillion of AI capex. Hyperscaler cash flow covers about $1.0 trillion of that. Investment-grade bonds ($2.1 trillion) and alternative capital such as private credit and infrastructure funds ($1.4 trillion) supply much of the rest.
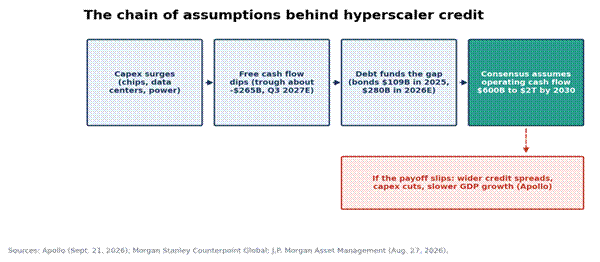
The market is assuming a payoff. Apollo’s Torsten Slok frames the credit story as resting on a single consensus assumption: that hyperscaler operating cash flow triples from roughly $600 billion to $2 trillion by 2030. If it falls short, he sees credit spreads widening, capex plans being cut, and eventually slower U.S. GDP growth.
Negative free cash flow isn’t automatically a problem. Morgan Stanley’s point is that it depends on returns. Walmart ran negative free cash flow for 14 straight years (1973–1986) while earning an average return on invested capital of 18%, well above its cost of capital, and the stock outperformed. For the hyperscalers, the group’s return on incremental invested capital peaked near 40% against an estimated cost of capital of about 8%. It is projected to trough near 23% in 2027, still comfortably above the cost of capital.
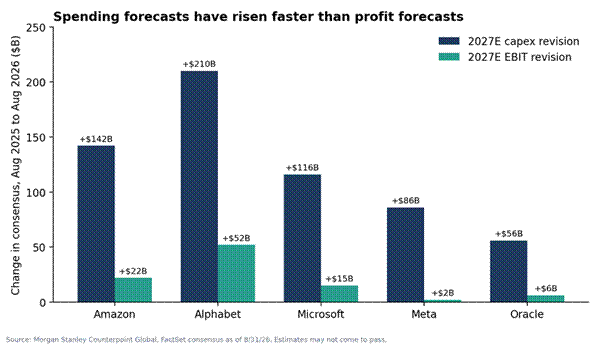
The watch item is revisions. Since August 2025, consensus 2027 capex estimates have risen by $210 billion at Alphabet, $142 billion at Amazon, $116 billion at Microsoft, $86 billion at Meta, and $56 billion at Oracle. Sales and EBIT estimates have not risen by nearly as much at every company. Meta’s 2027 EBIT estimate rose only about $2 billion against its capex increase. The key is whether profit forecasts keep pace with investment.
Takeaway: The AI build-out is priced on the expectation that today’s cash-flow trough is temporary. The math can work, but only if revenue and profit growth arrive on time. J.P. Morgan frames the range of outcomes: in its baseline, AI capex normalizes near $800 billion as the build-out matures; in a sustained-demand case it stays above $1 trillion; and in an overcapacity case it corrects by roughly 45% from peak. We’ll be watching capex guidance and forecast revisions more closely than headline spending totals.
Forecasts are consensus estimates and may not come to pass. Charts are firm-produced from cited figures; selected data points are approximate. For informational purposes only; not investment advice.
At SEM, we believe your time is best spent focused on what matters most to you, not on keeping up with the complexities, evolving regulations, and latest trends shaping the financial markets. With SEM as your trusted advisor, we take on that responsibility through a disciplined, research-driven investment process designed to identify opportunities, manage risks, and adapt to changing market conditions.
Thank you to all of the visitors who read last week's "Chart of the Week". I hope to continue sharing these talking points about markets, investing, etc., for you to share with family, friends, coworkers, or anyone along the way.
See you next time!
Market and Economic Data
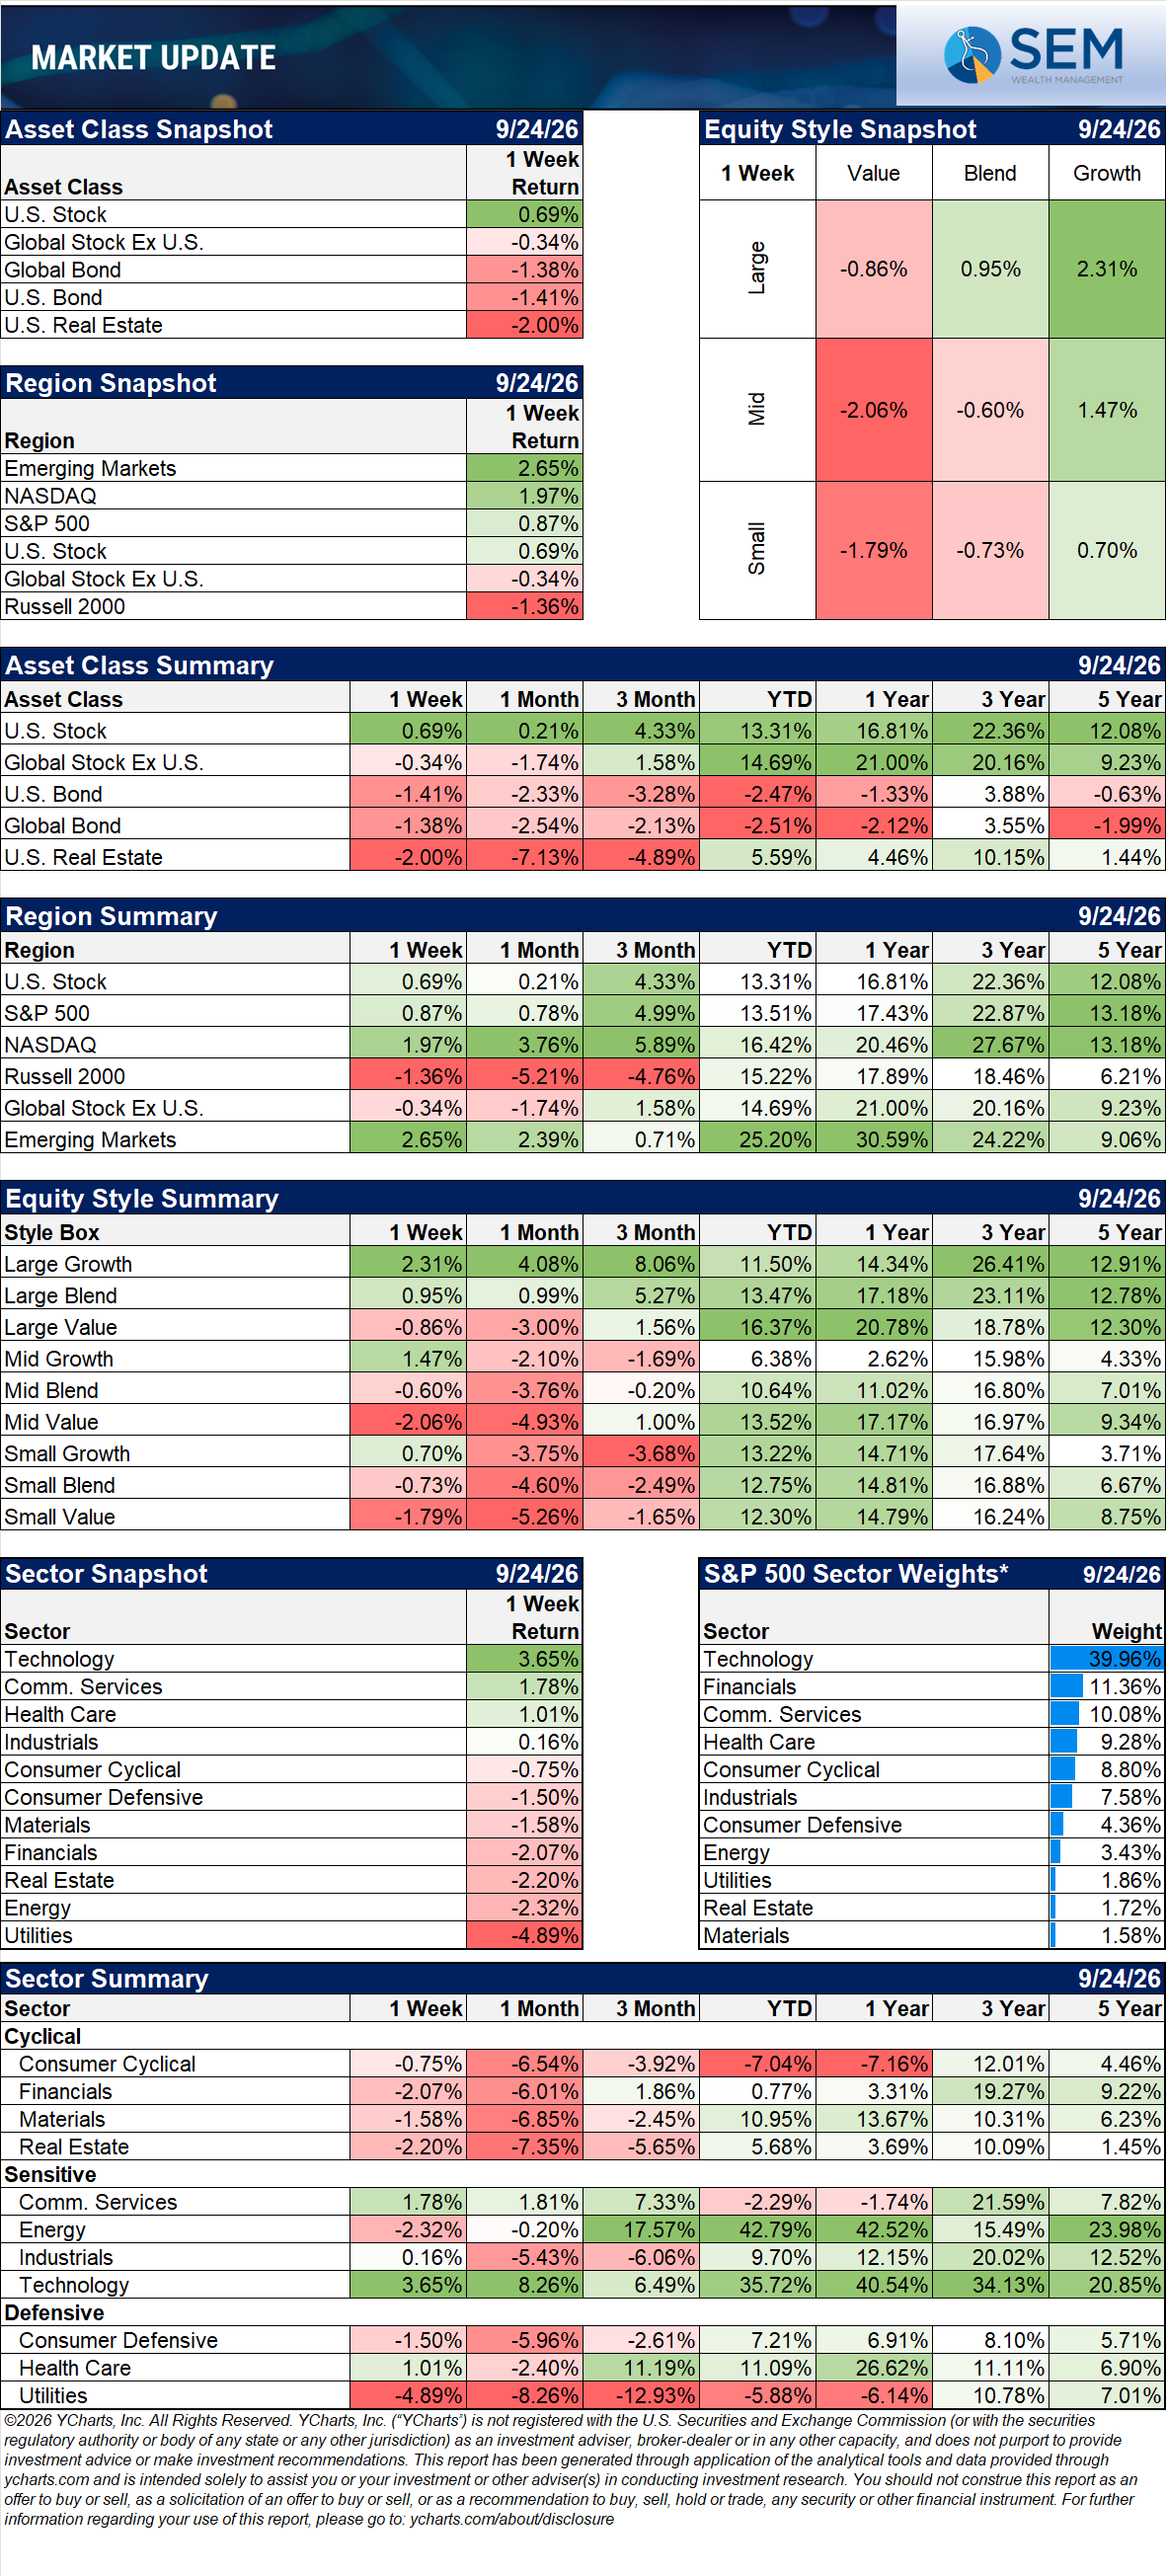
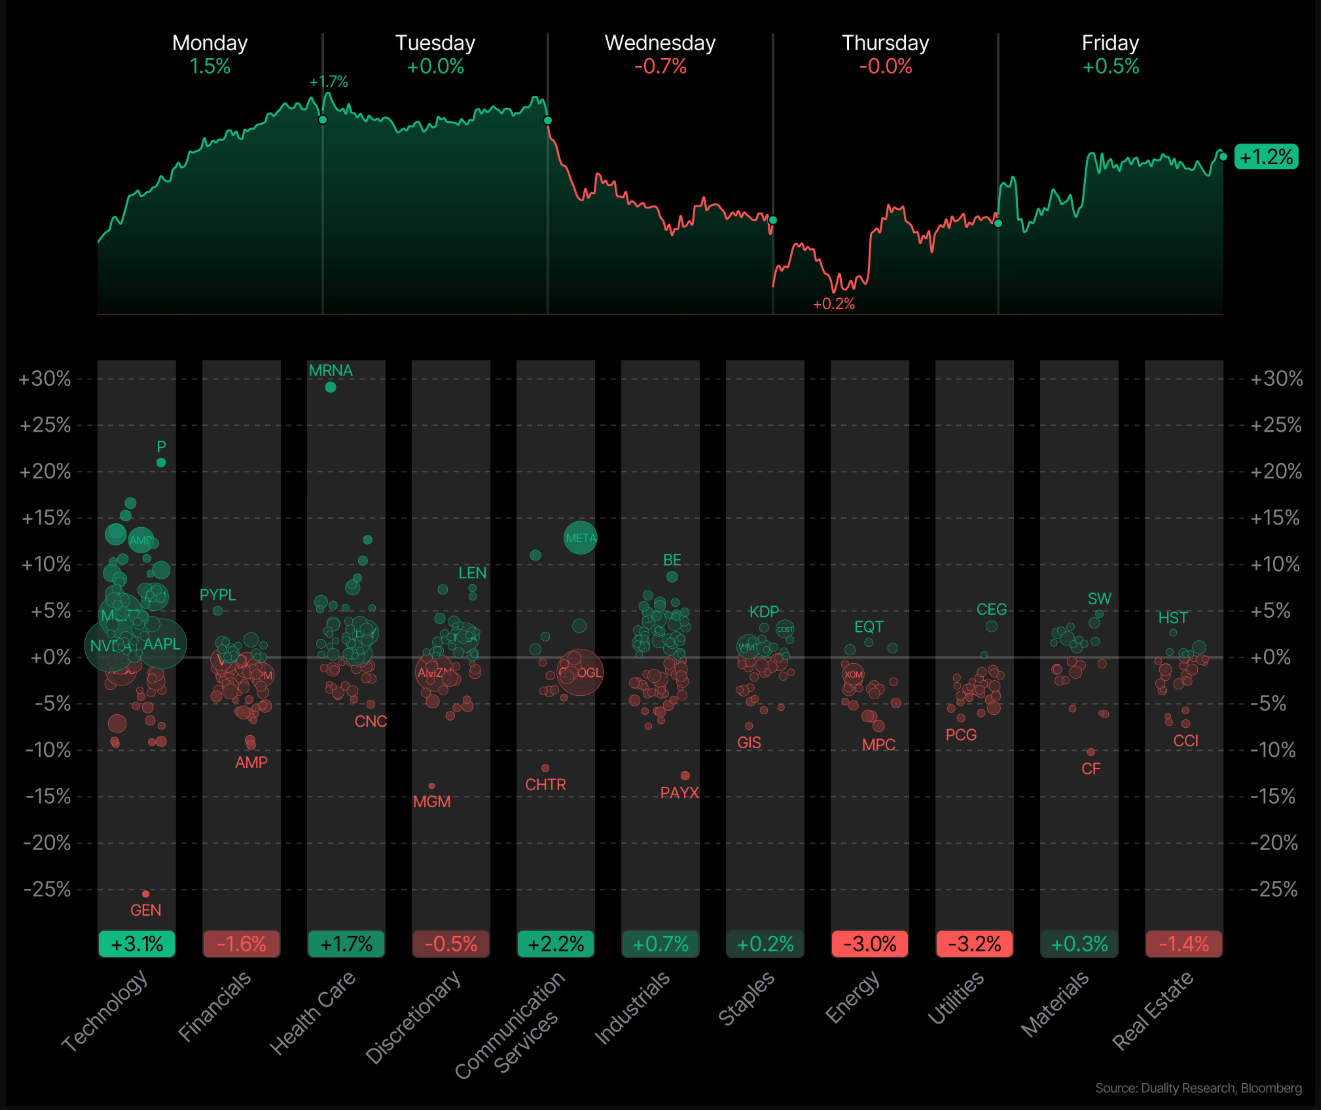
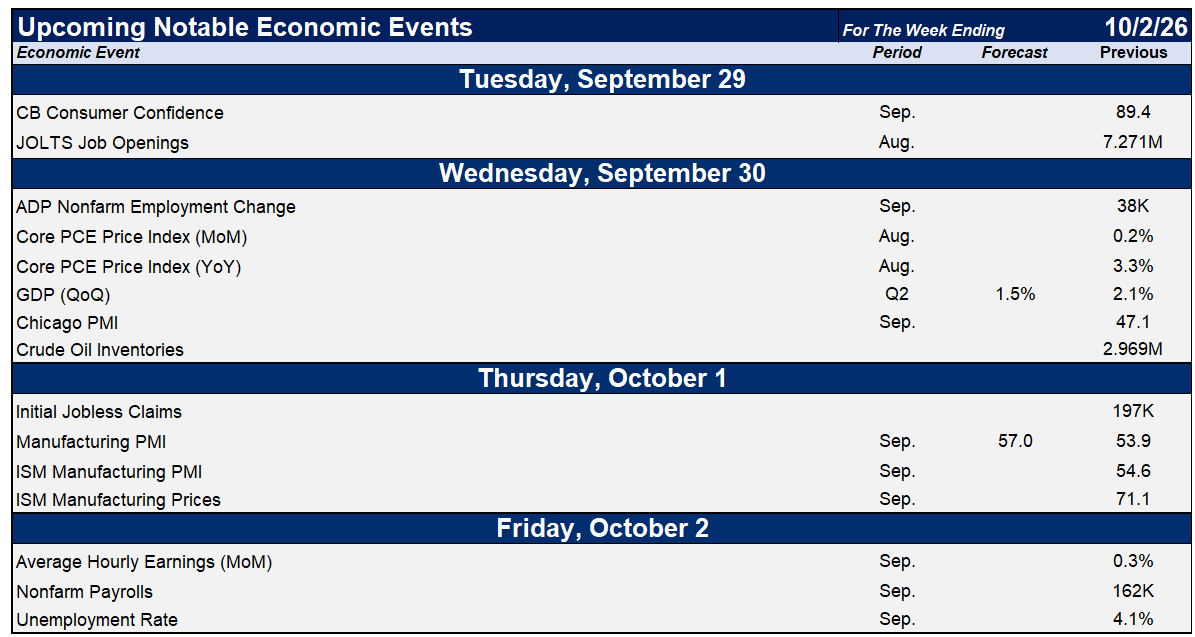
U.S. equities finished the week higher even with a sharp selloff in bonds and ongoing geopolitical uncertainty. The S&P 500 gained 1.21%, while the NASDAQ rose 2.06%, respectively. The main story early in the week came from fixed income: the 10-year Treasury yield rose to 5.18% on Friday, its highest level since the global financial crisis, as inflation concerns grew.
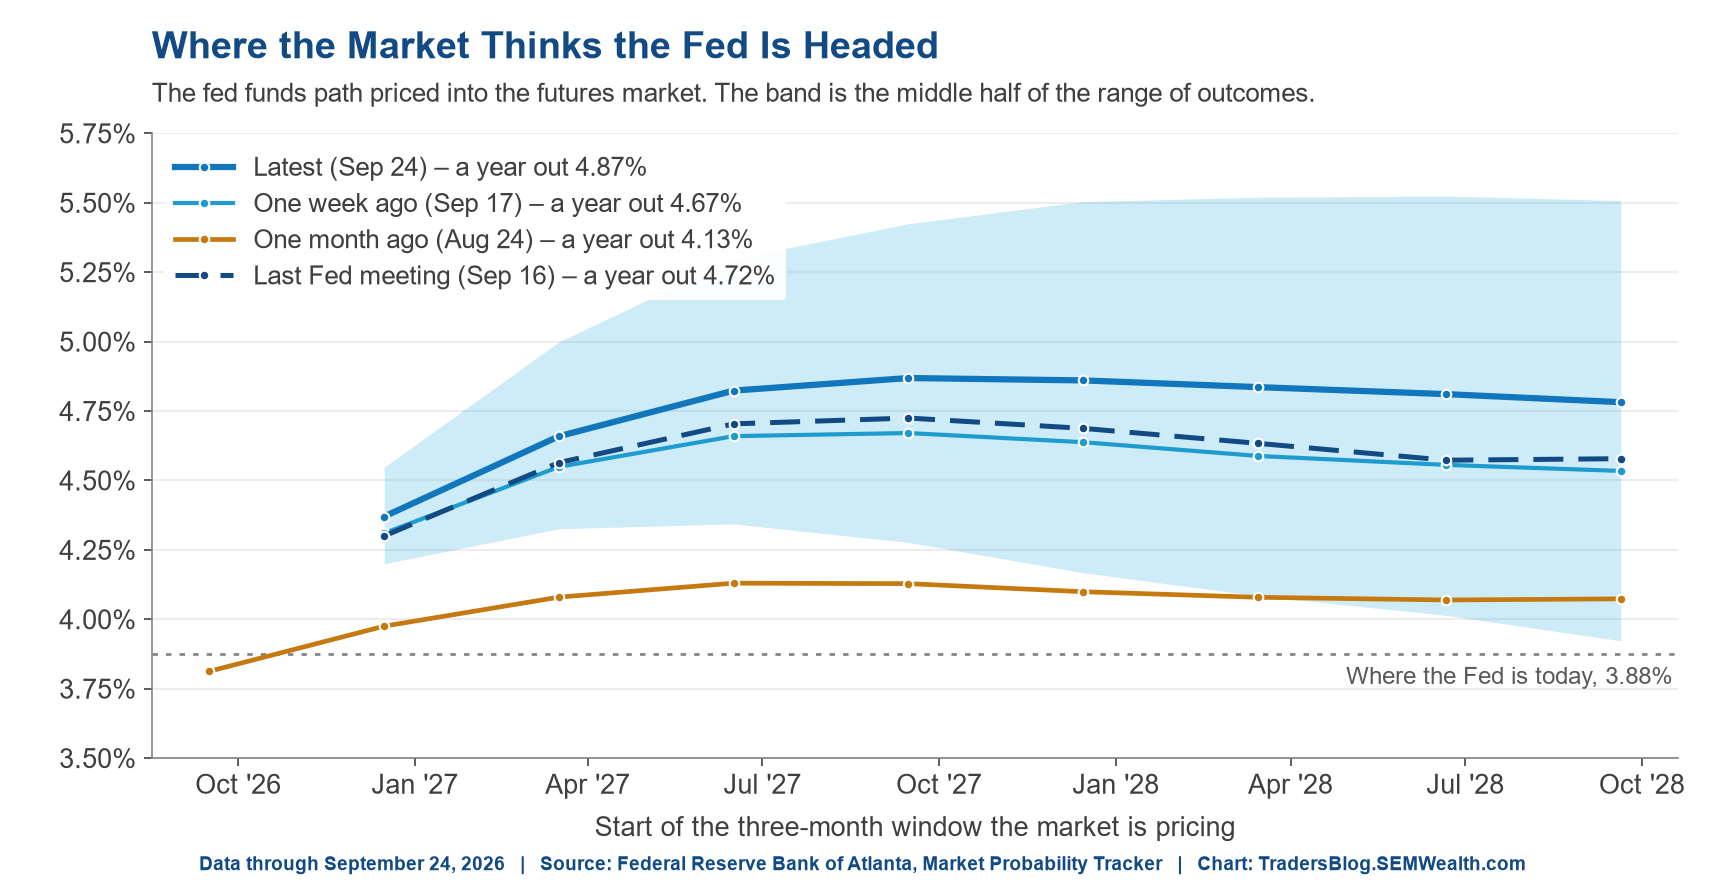
Economic data released during the week showed a gap between business activity and consumer sentiment. S&P Global's Flash U.S. Composite PMI rose to 58.4 in September from 56.0 in August, a 62-month high and fourth straight month of accelerating growth, led by services.
University of Michigan's final September index came in at 48.1, its lowest reading in four months and 15% below January. Year-end inflation expectations climbed to 4.6% from 4.0% in August, the highest since June.
These readings are paramount for policy decisions the Federal Reserve will consider as we close in on mid-term elections.
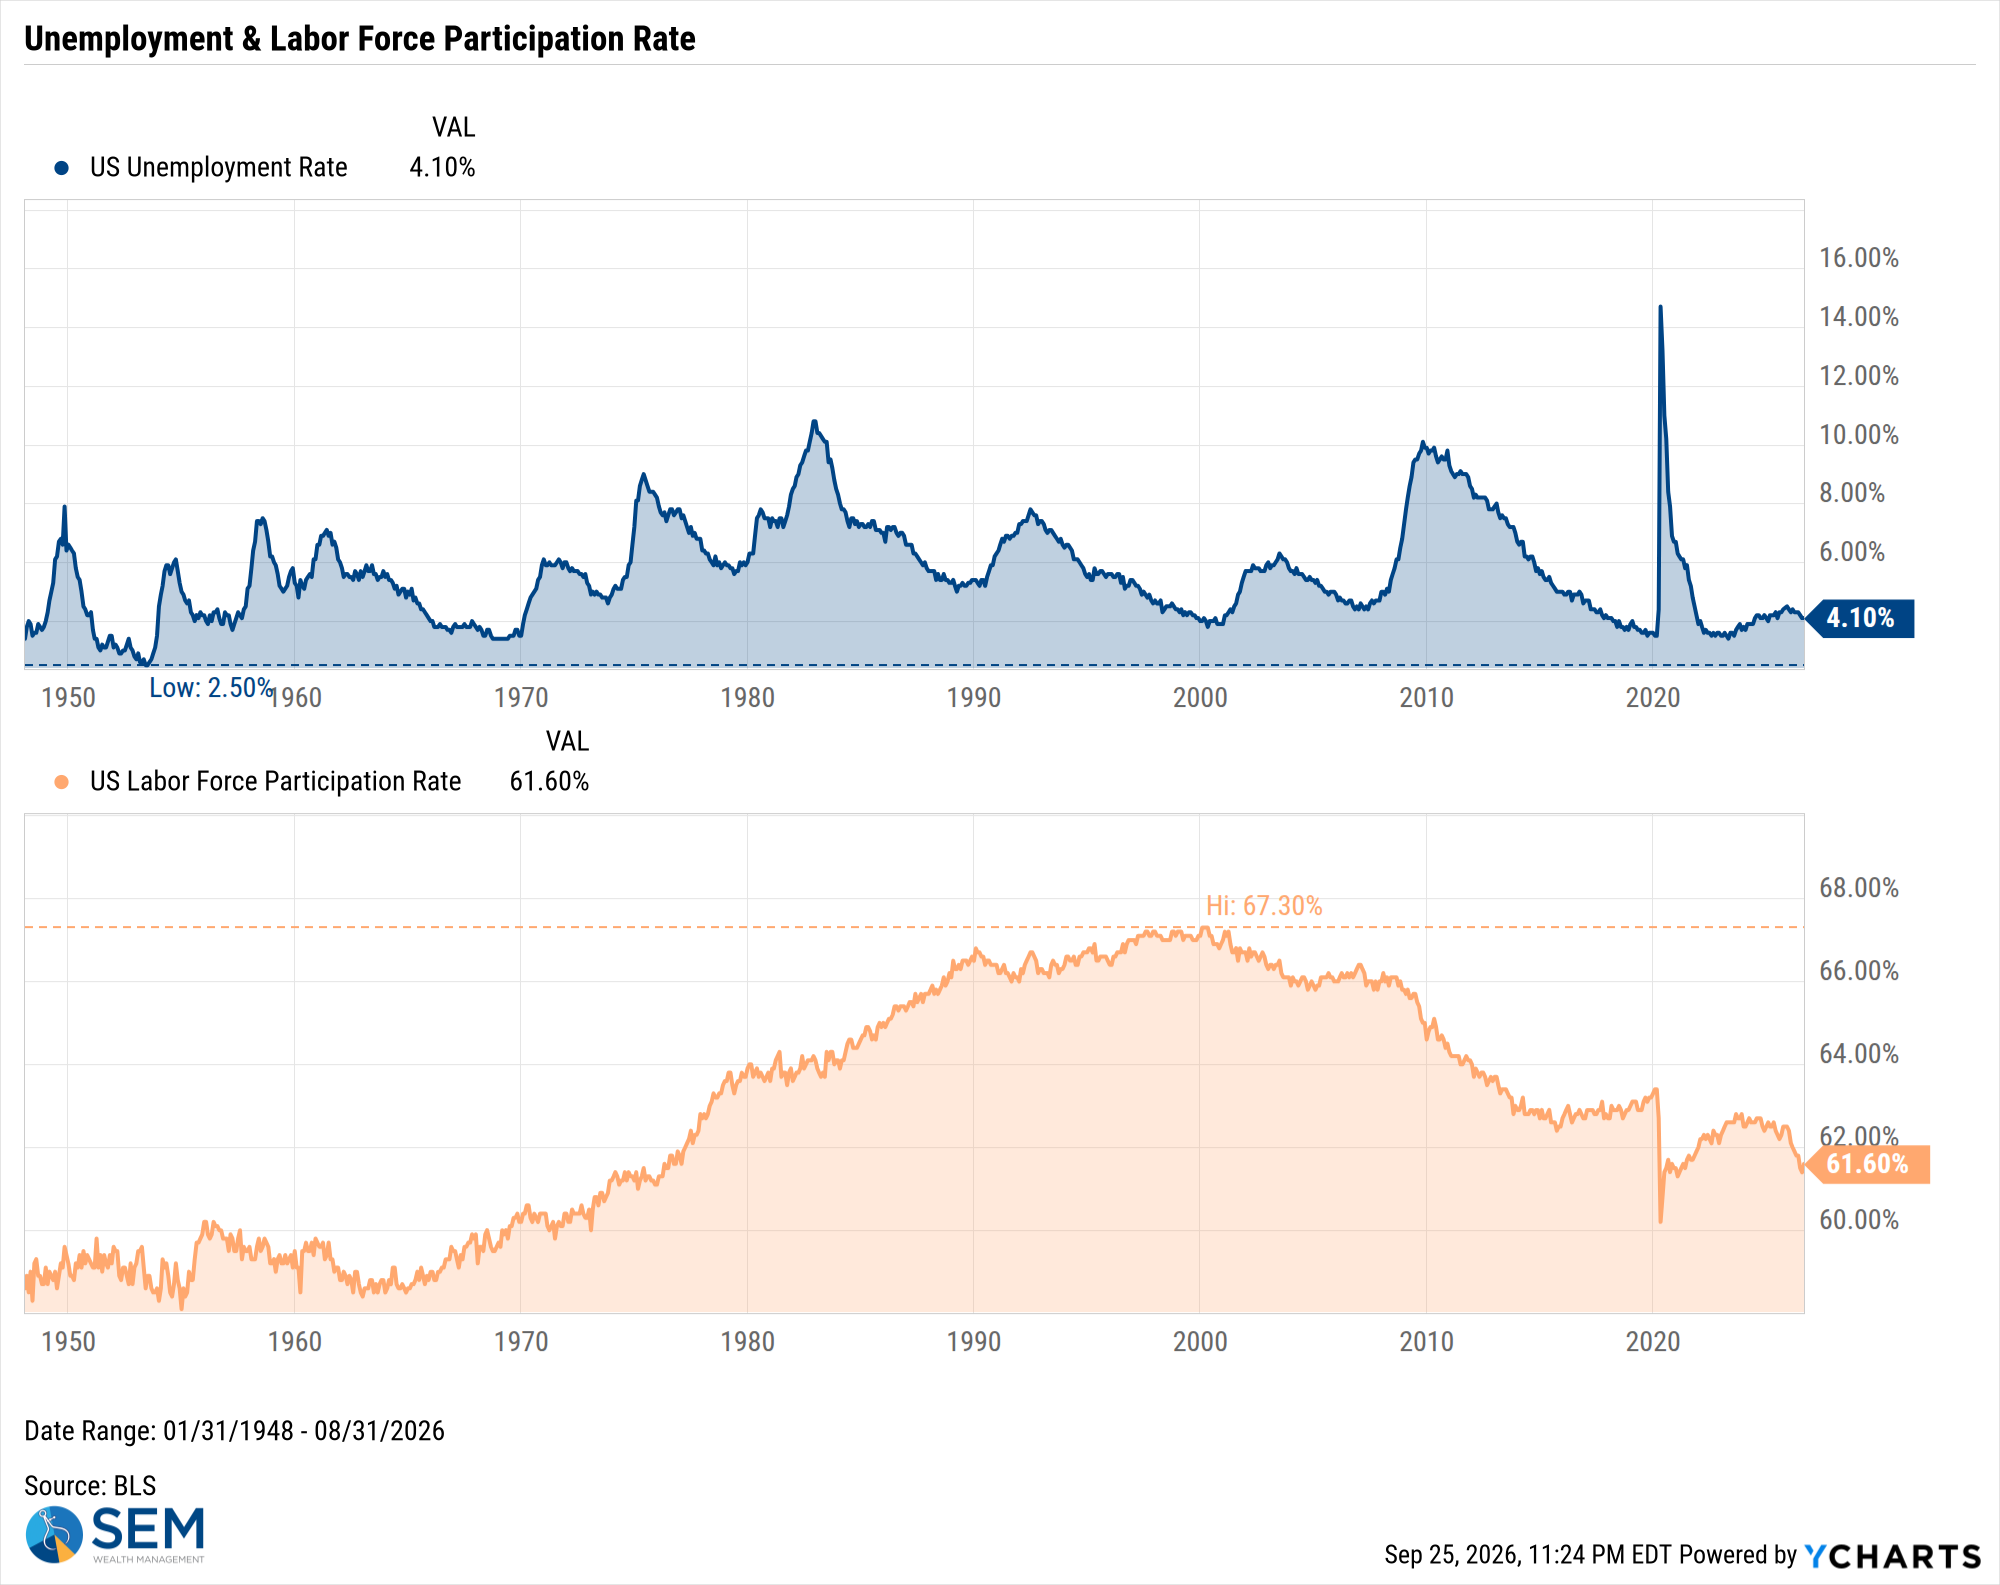
US Unemployment Rate data by YCharts
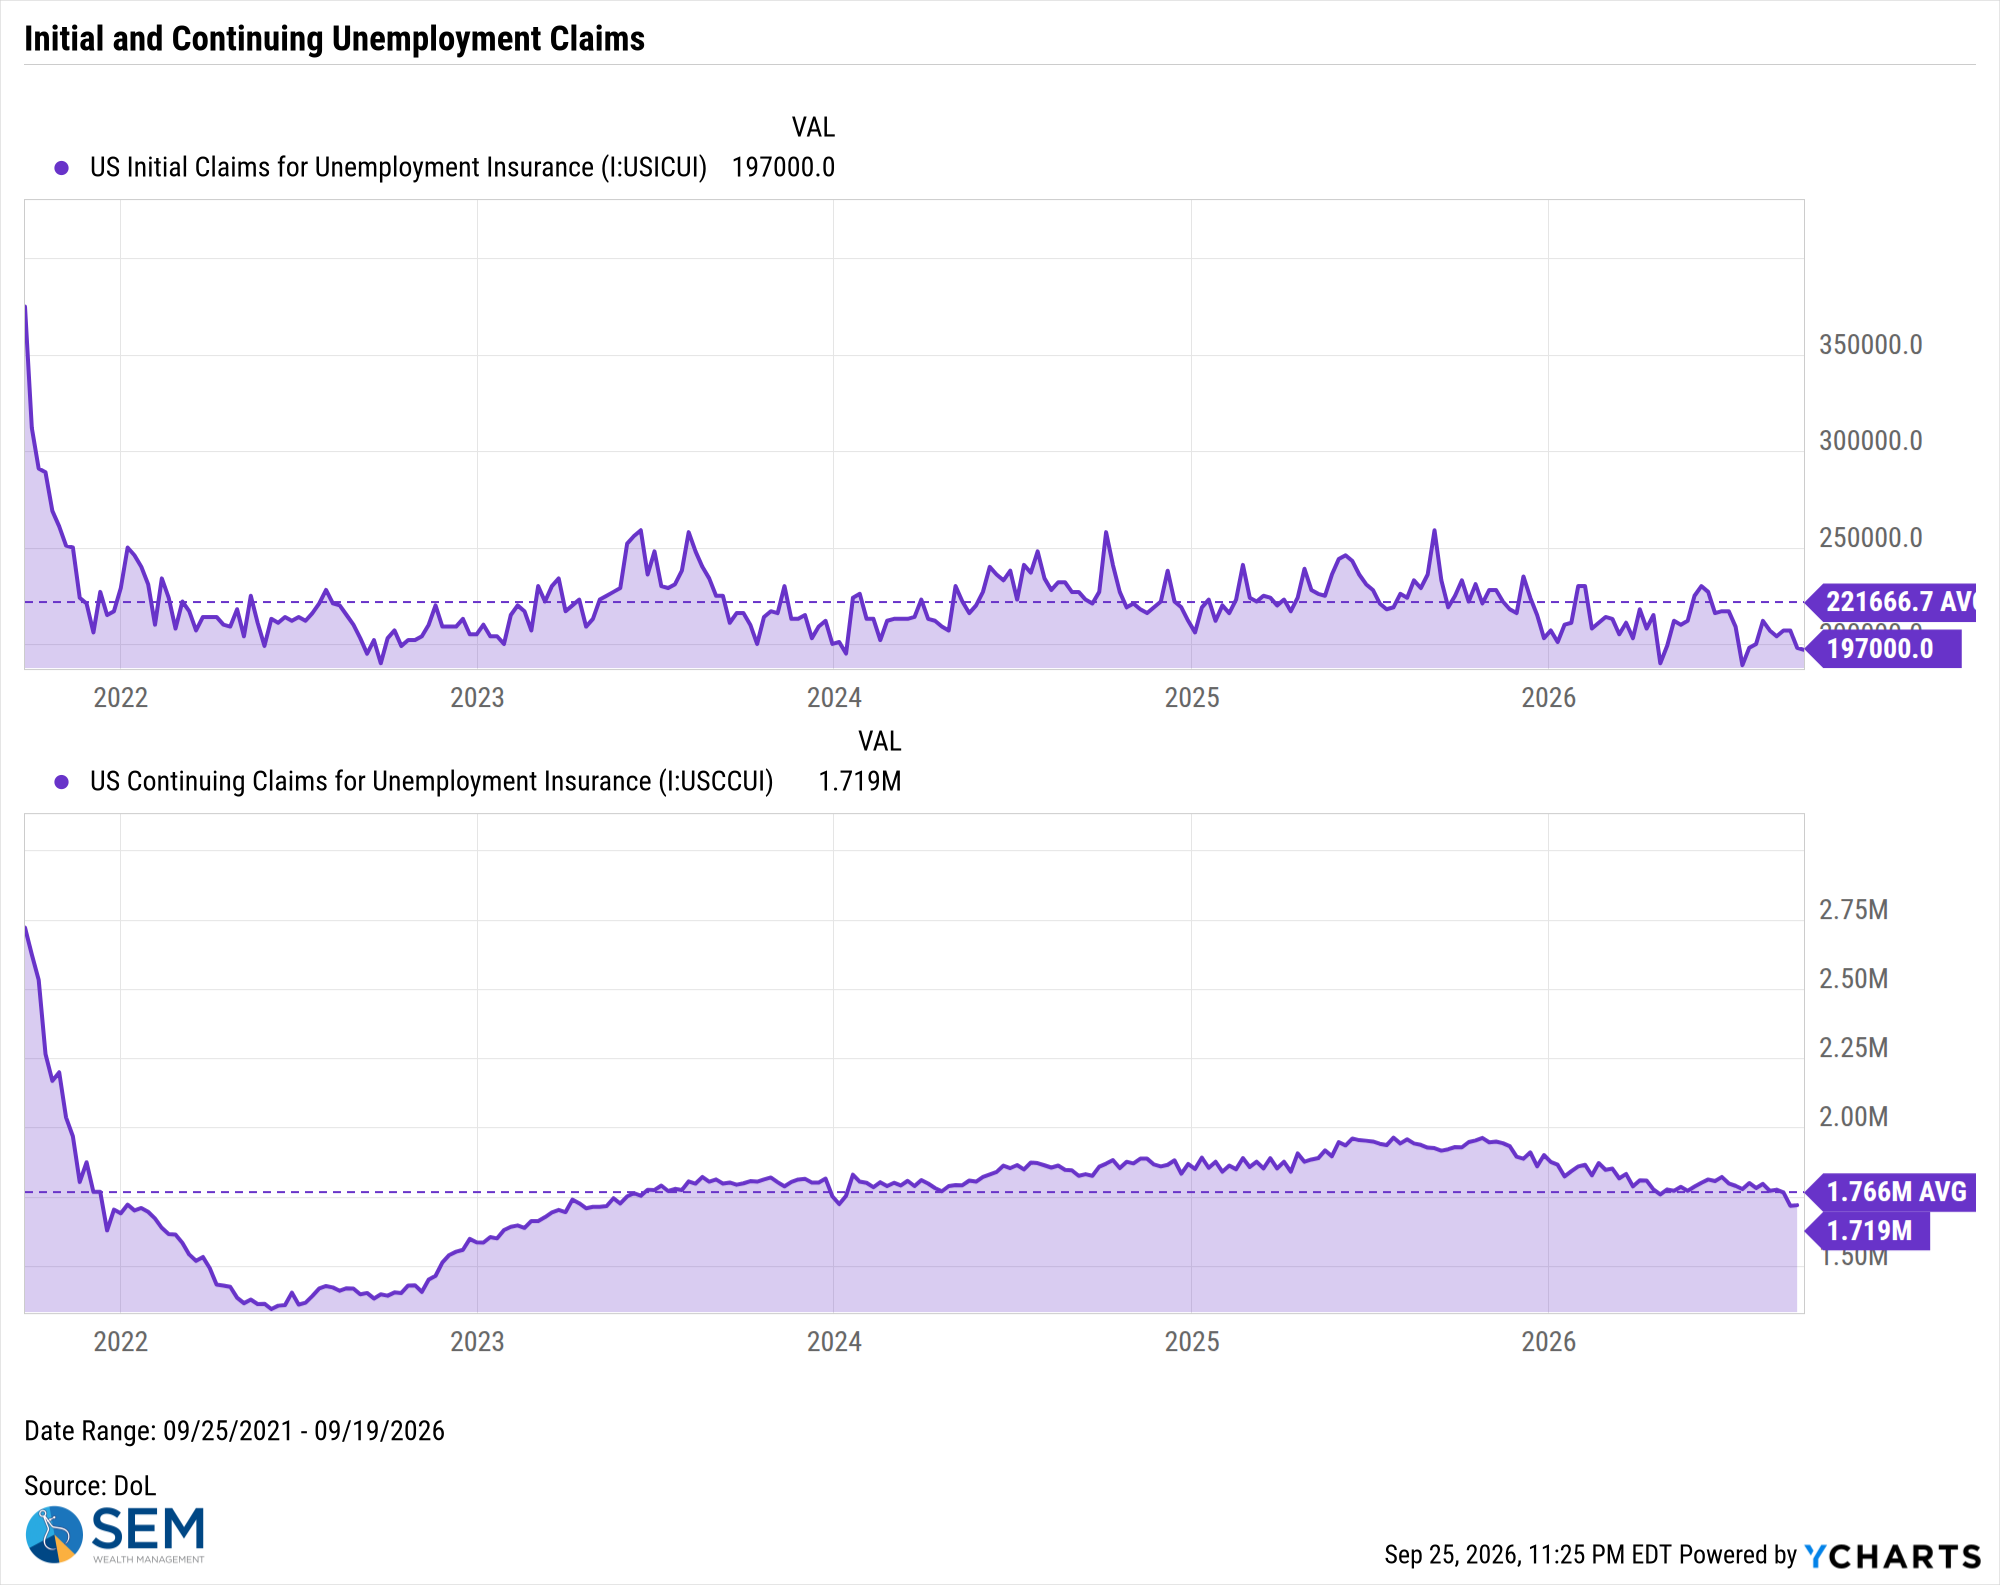
US Initial Claims for Unemployment Insurance data by YCharts
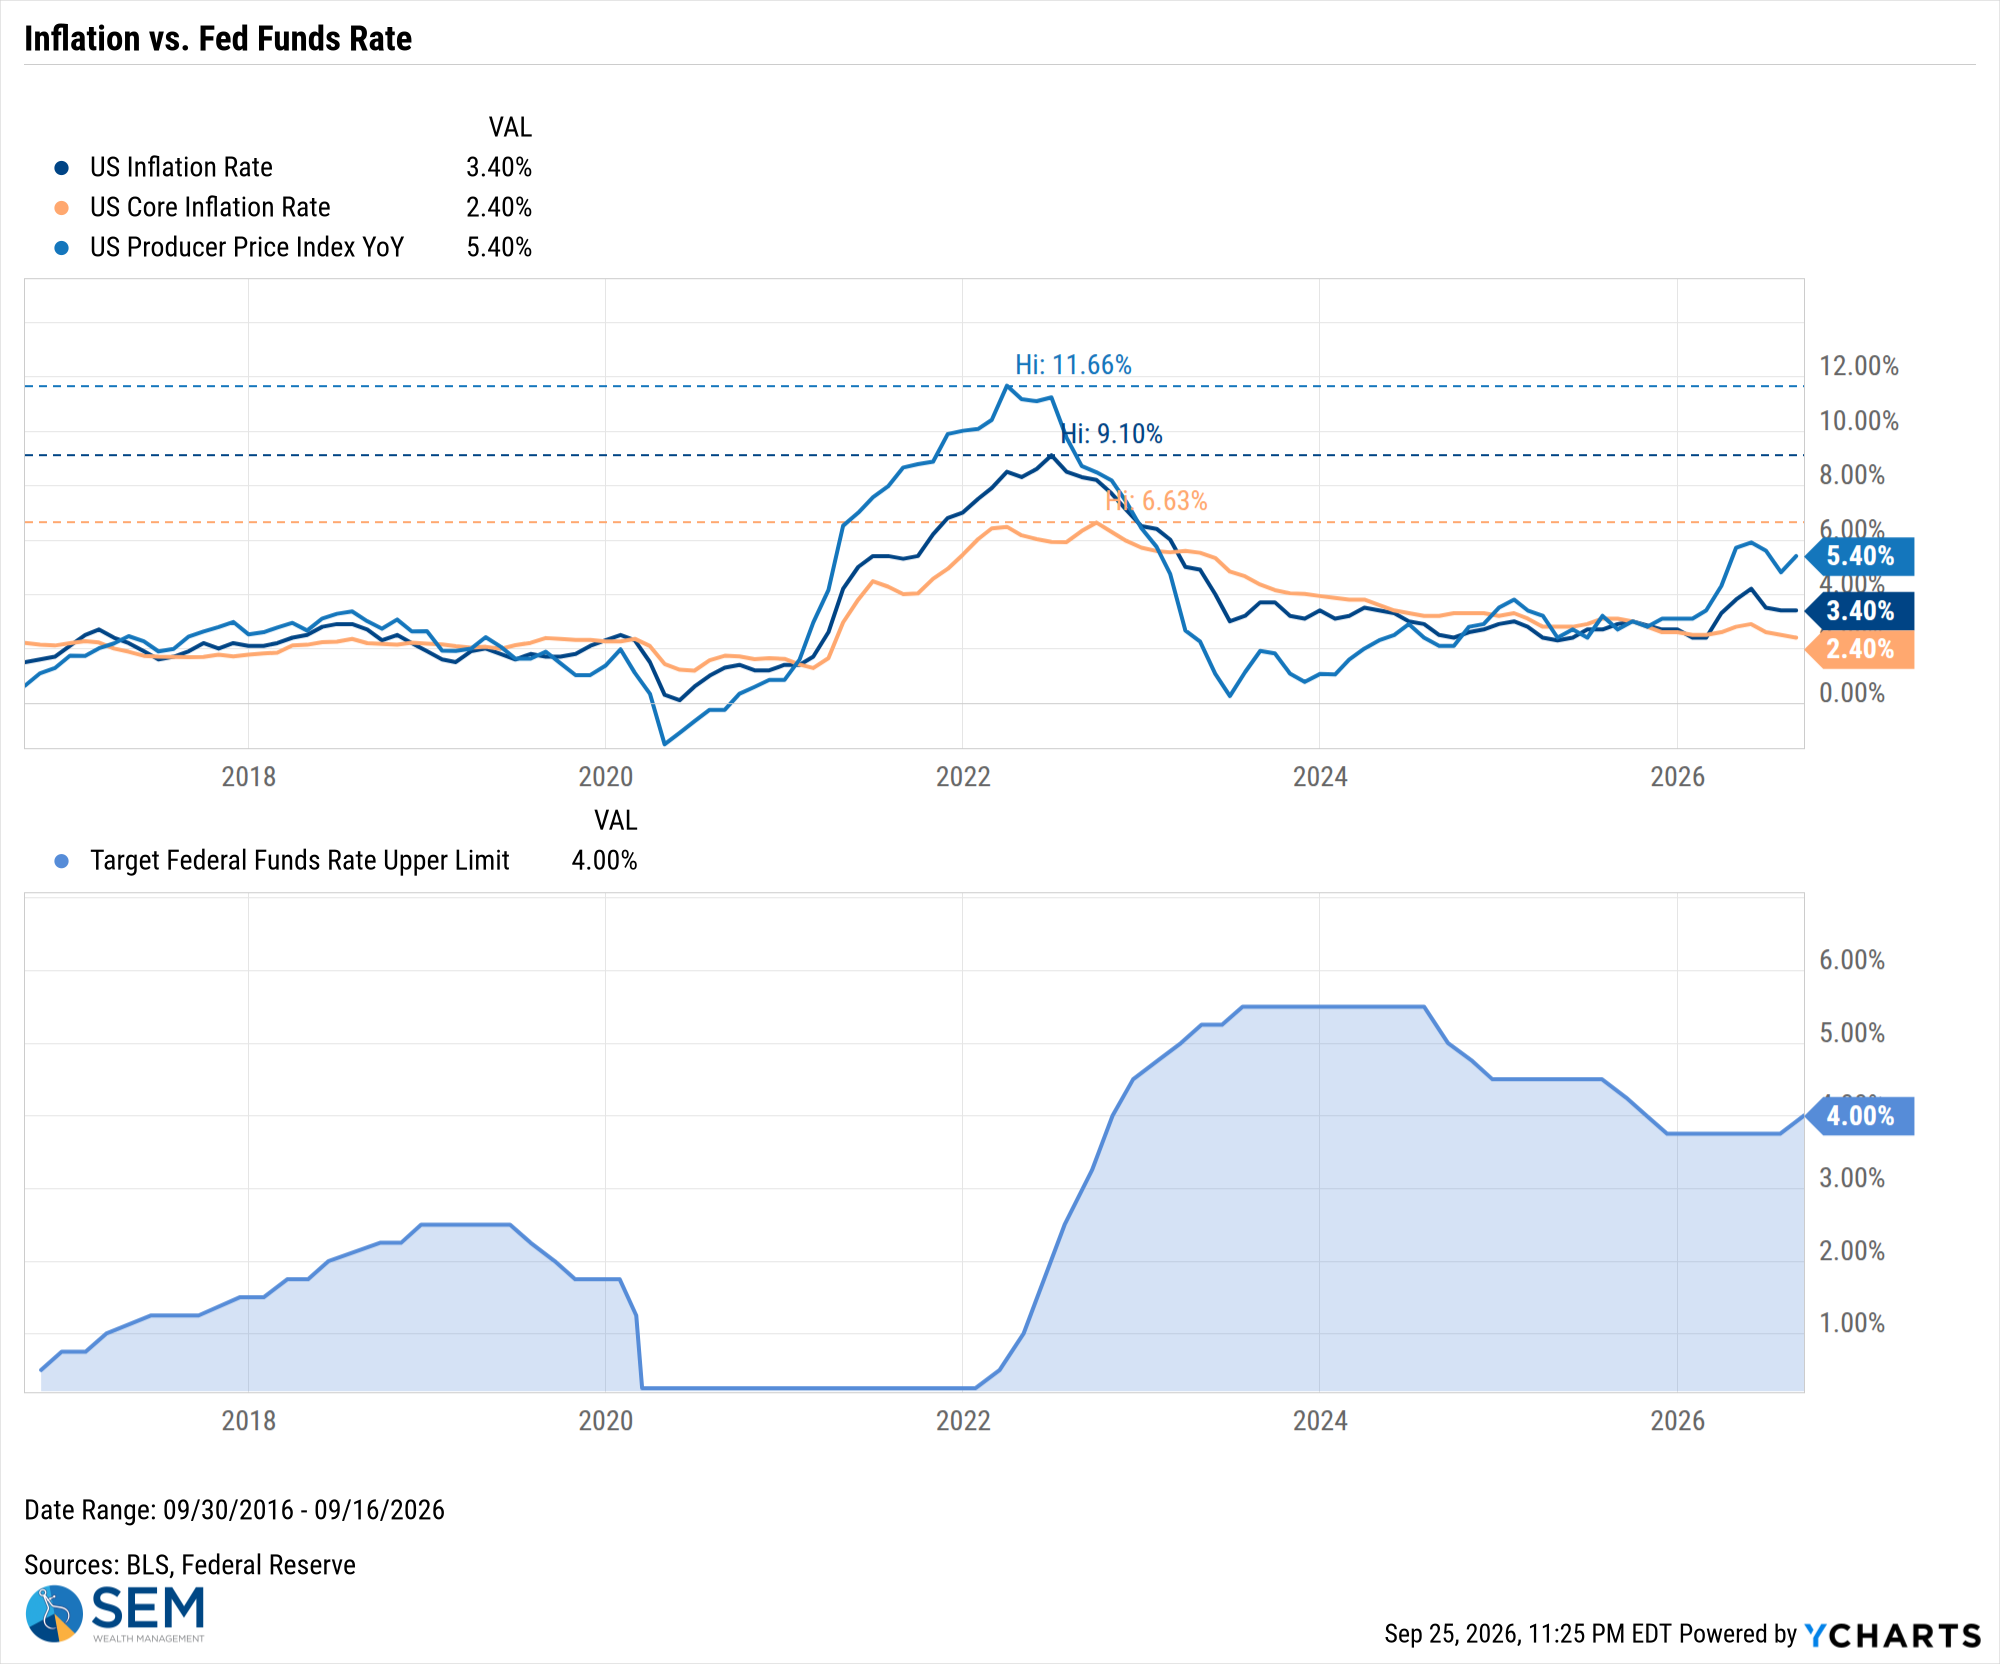
US Inflation Rate data by YCharts
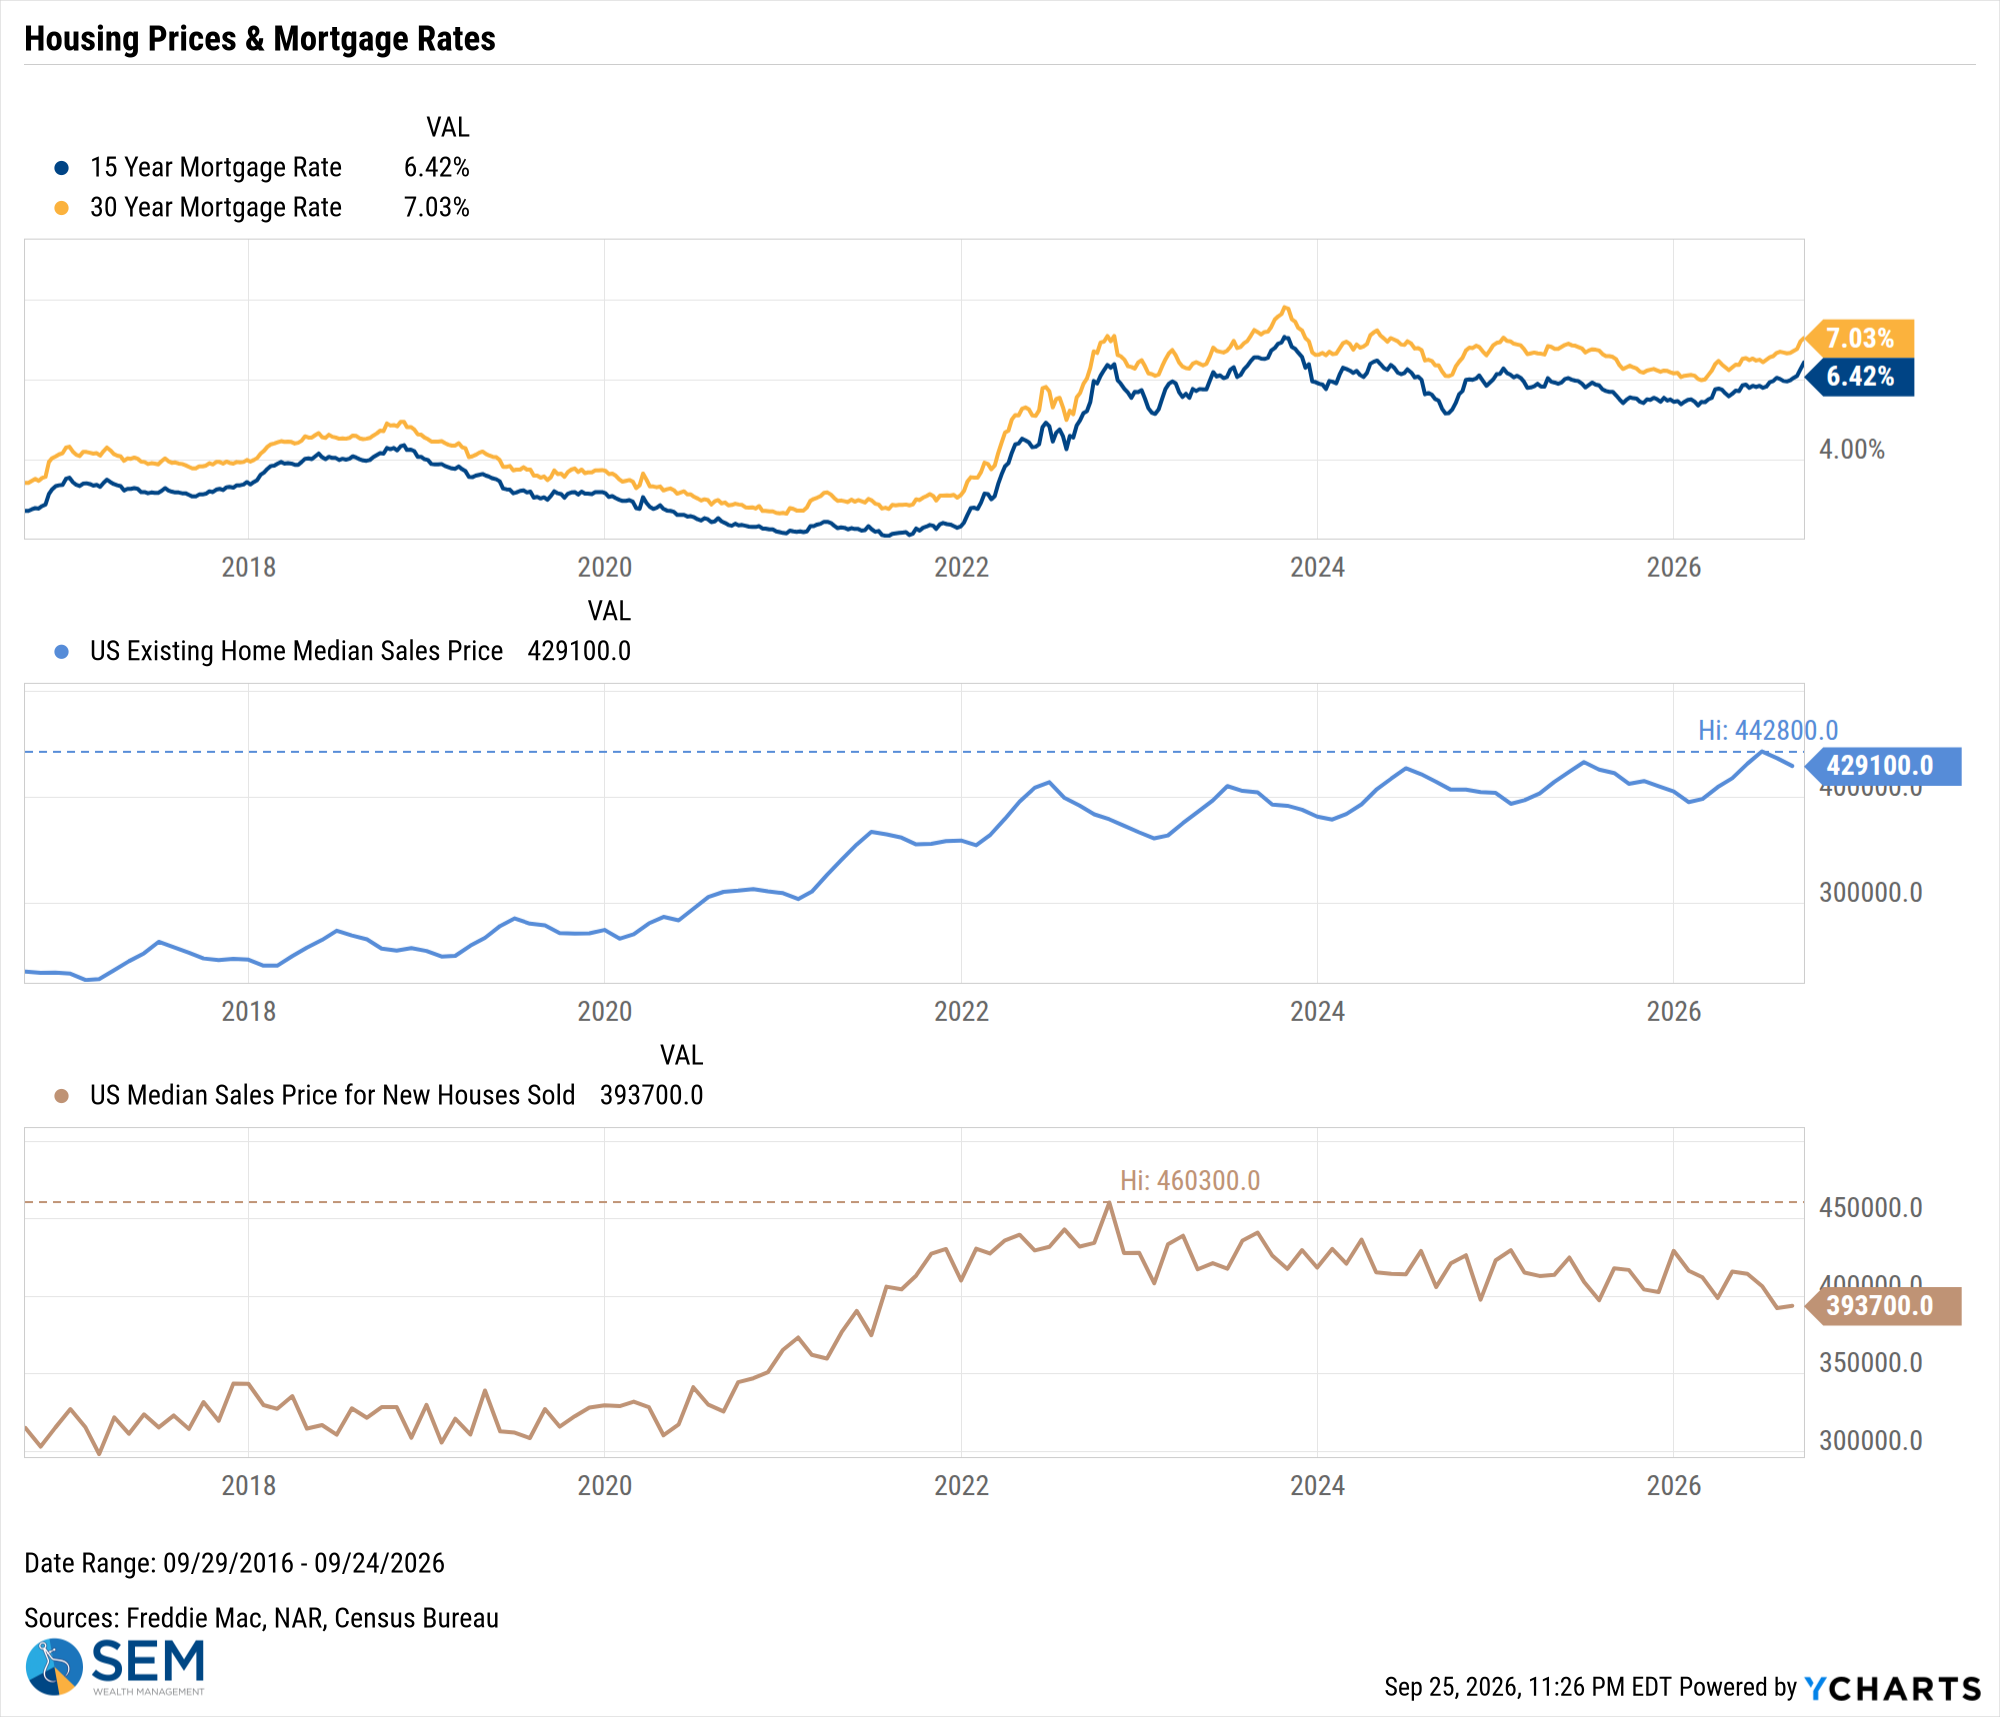
US Existing Home Median Sales Price data by YCharts
SEM Market Positioning
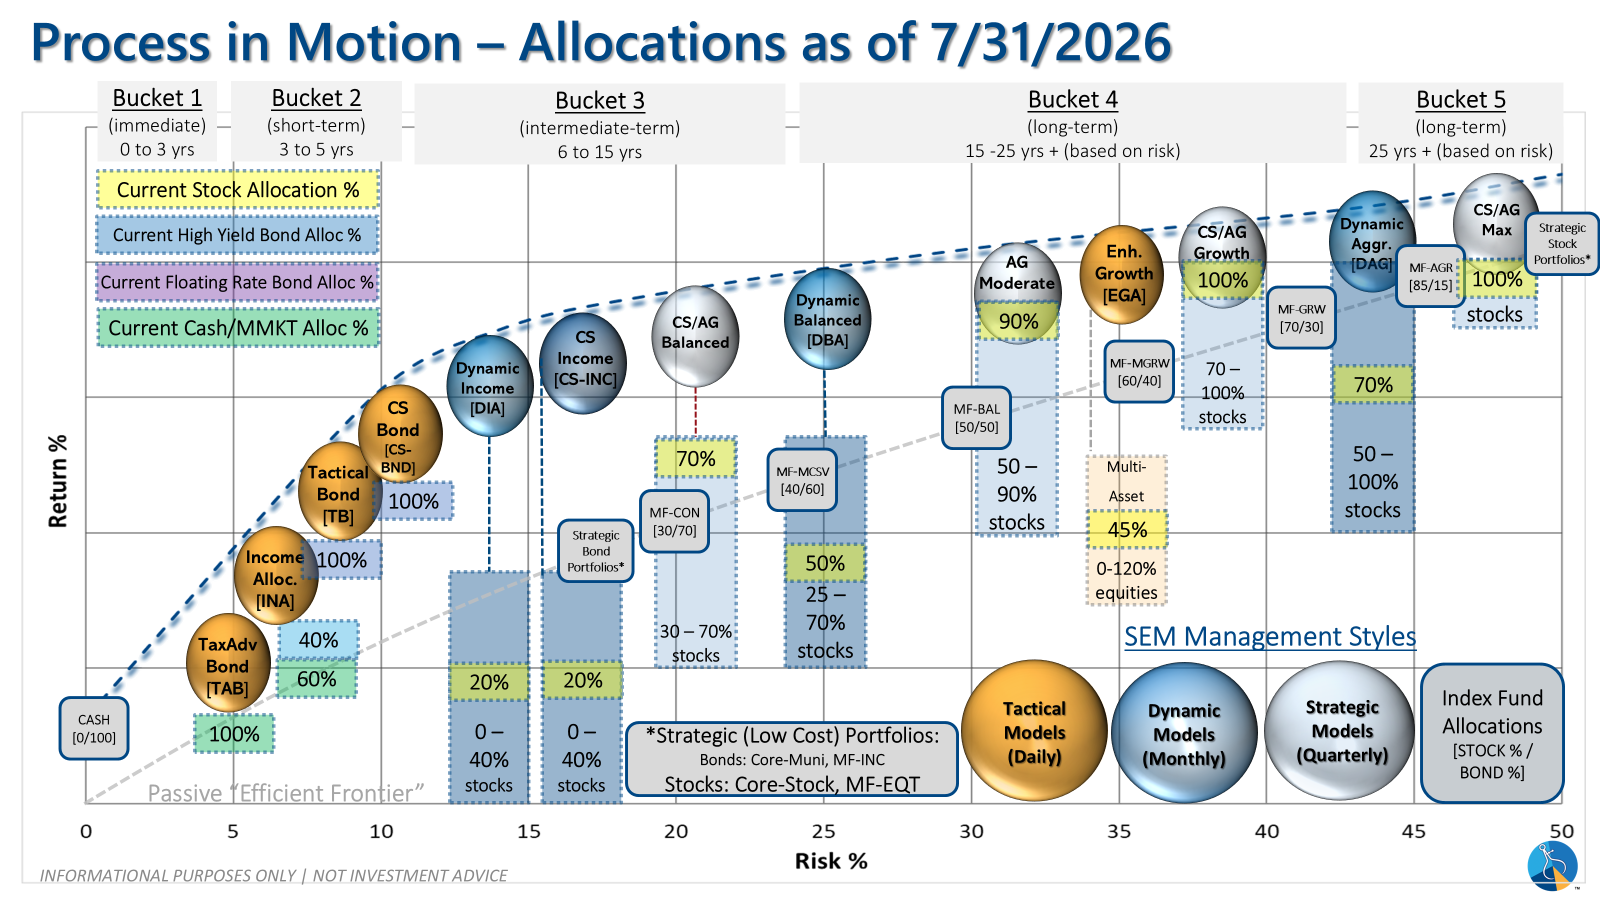
SEM deploys 3 distinct approaches – Tactical, Dynamic, and Strategic. These systems have been described as 'daily, monthly, quarterly' given how often they may make adjustments. Here is where they each stand.
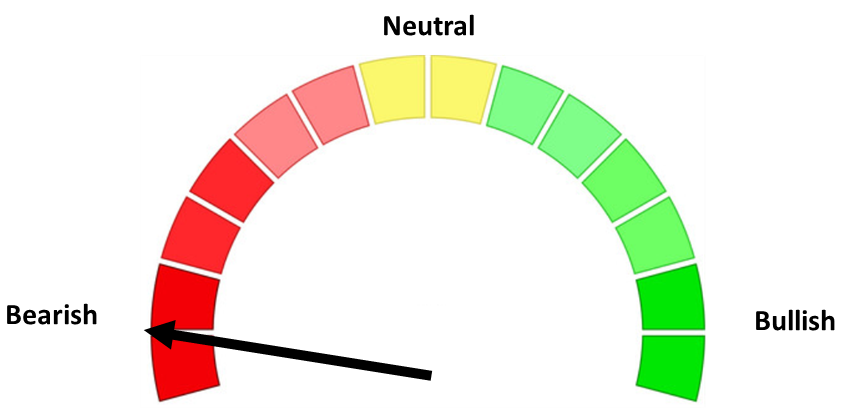
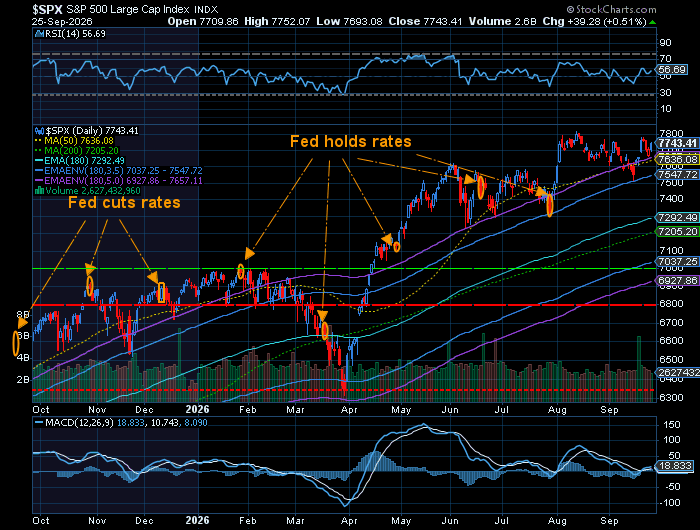
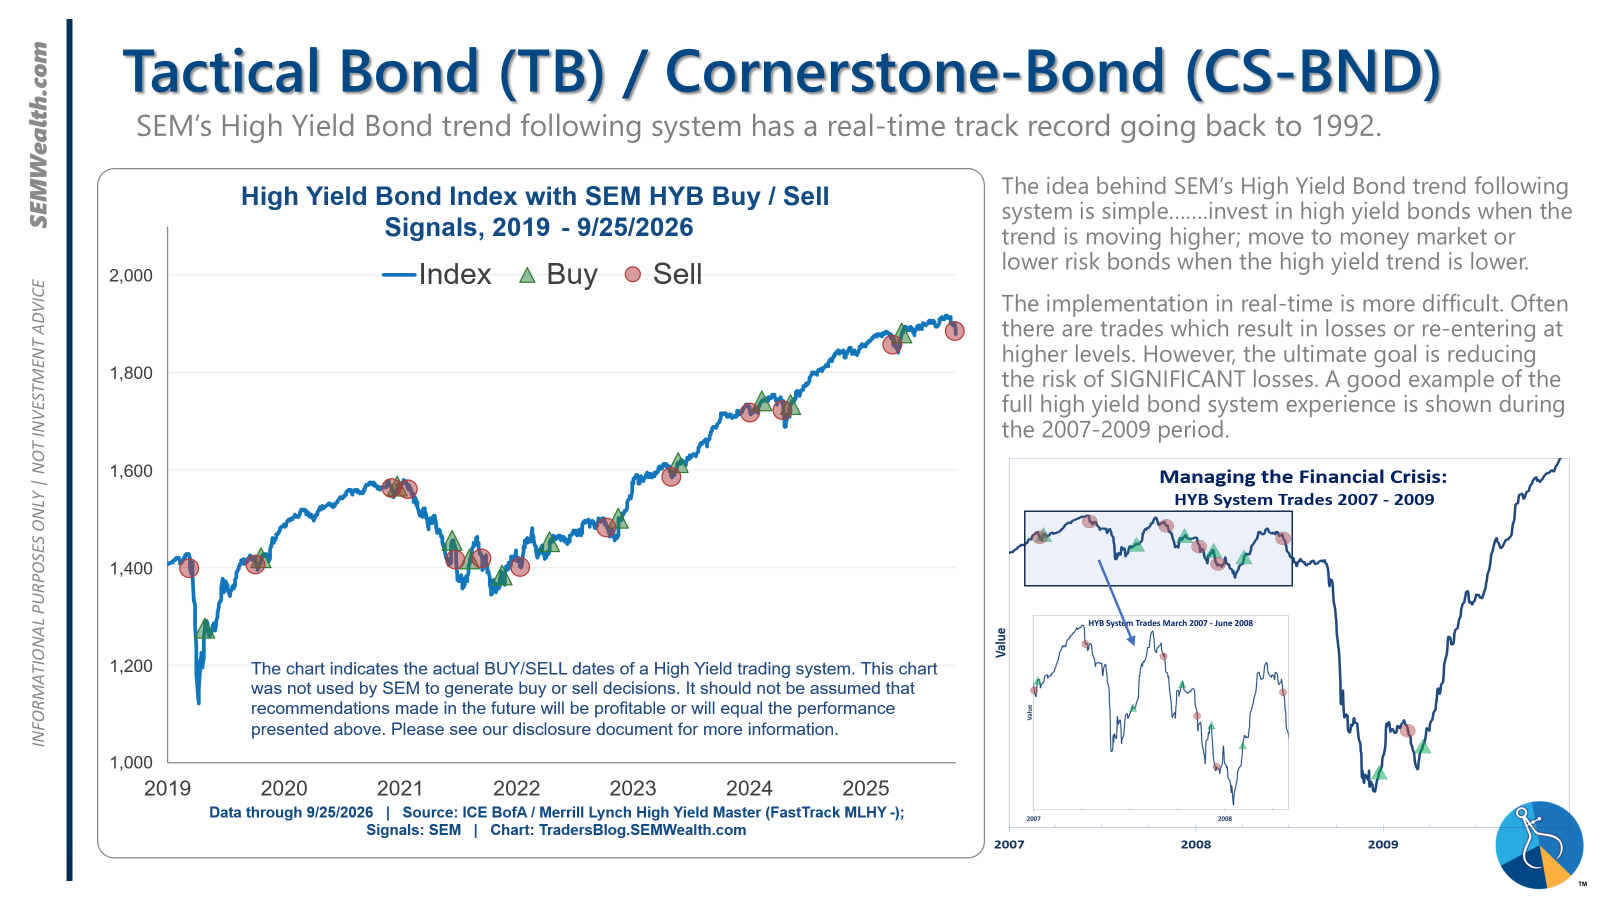
- Tactical = BEARISH (9/24/26) | 100% Money Market / Short Term Bonds (9/24/26) | High-yield trends reversed lower with spreads near historic lows.
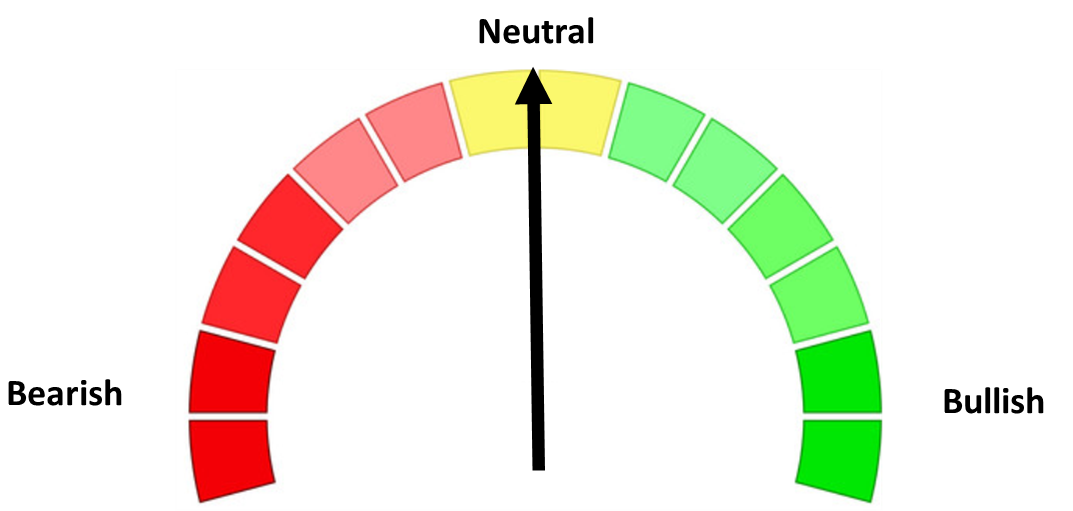
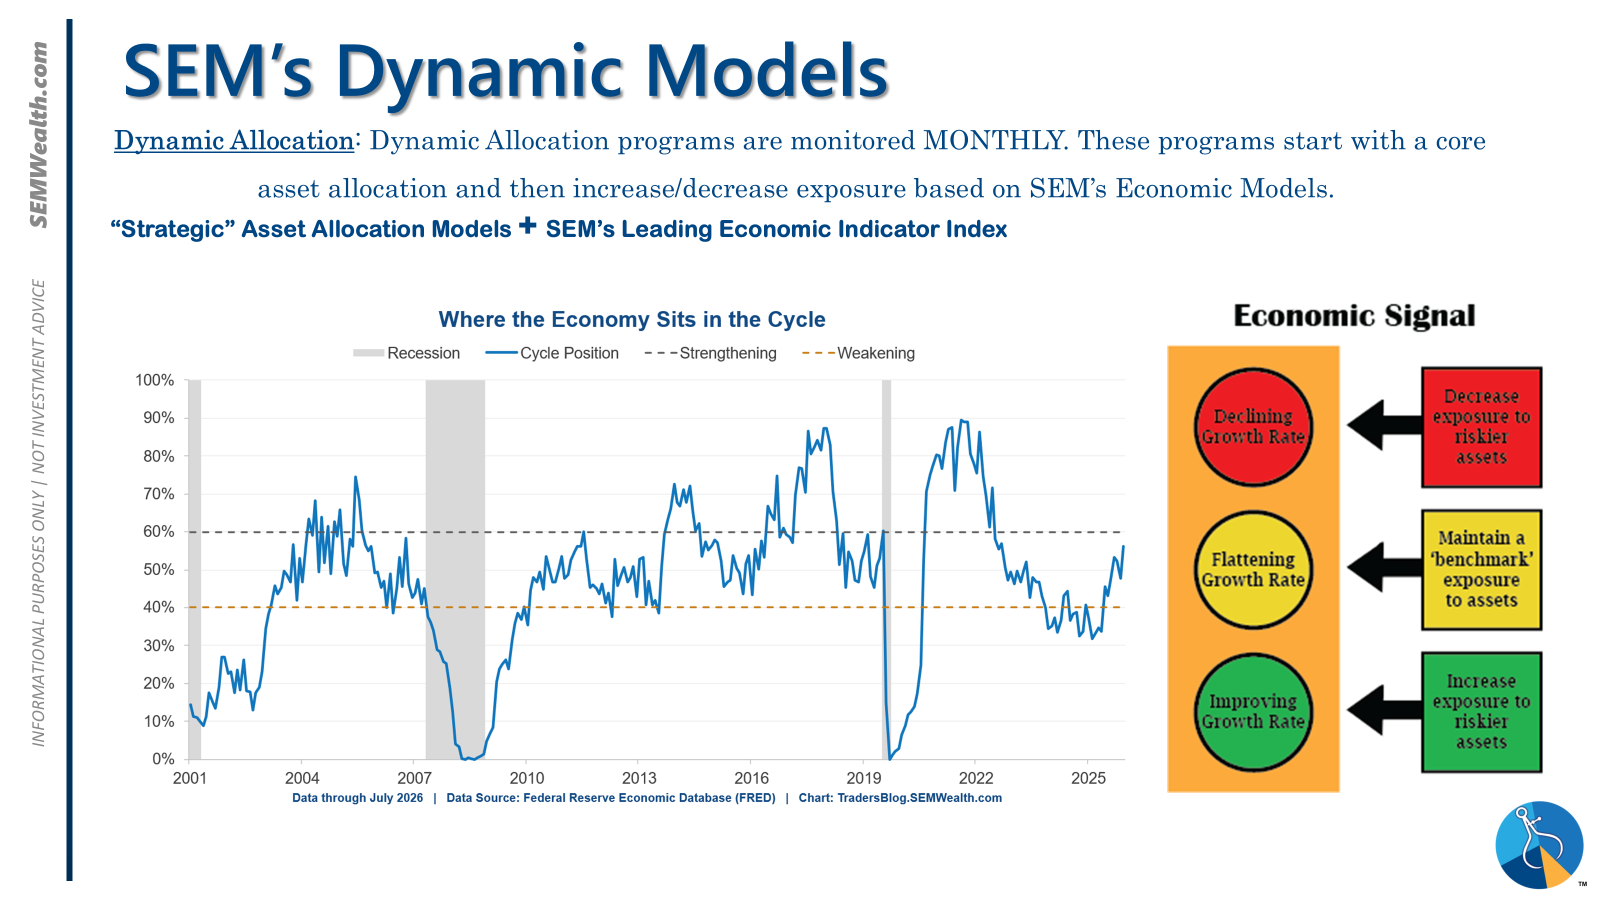
- Dynamic = NEUTRAL (2/15/2026) | "Benchmark" Allocation | Economic model inconclusive
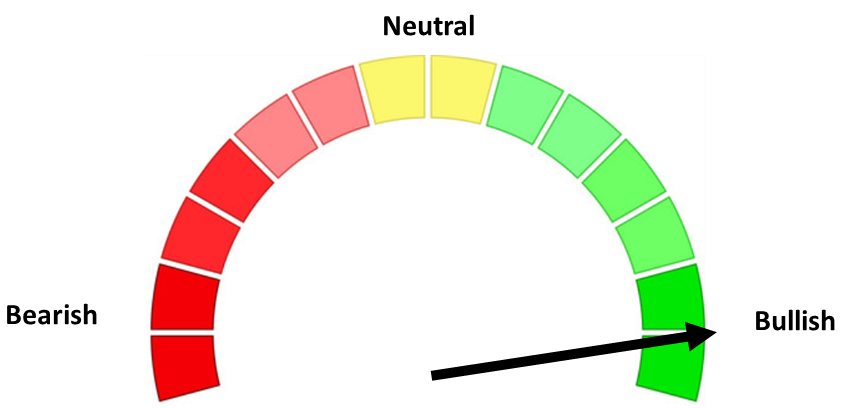
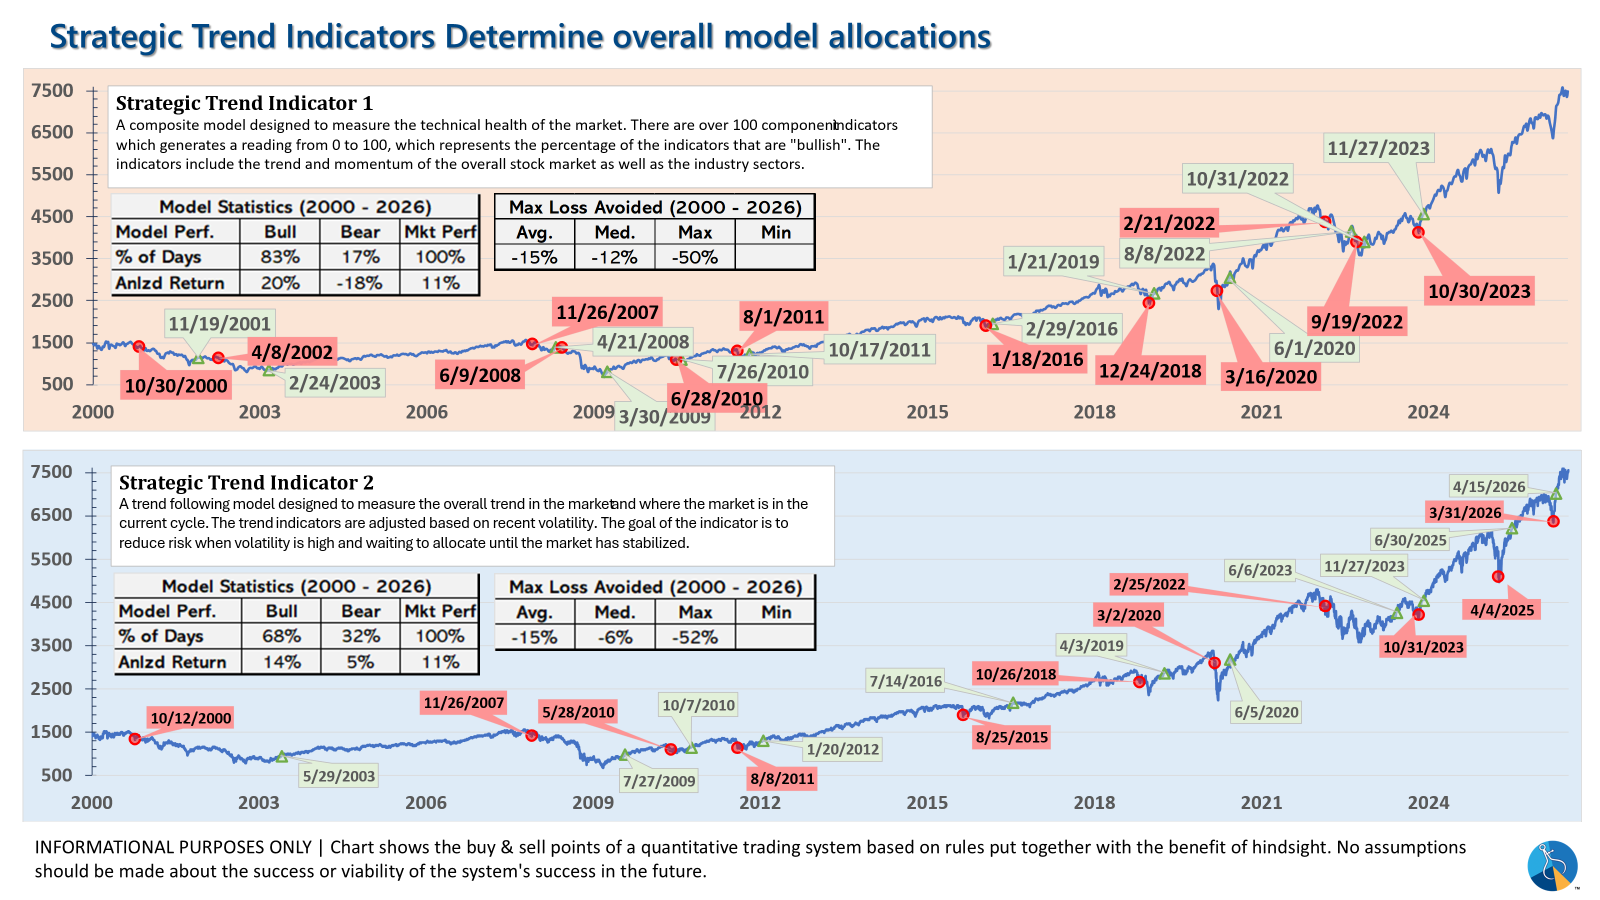
- Strategic = BULLISH (4/15/2026) | V-Bottom projecting "end" of Iran War
Tactical (daily):
- Monitored DAILY
- Models: Tactical Bond, Cornerstone Bond, Income Allocator, Tax Advantaged Bond
- Designed to follow the trends for use in our lower risk models
- SELL Signal issued September 24, 2026 (exiting the buy from April 8, 2026)
Dynamic (monthly):
- Monitored MONTHLY
- Models: All "Dynamic" Models (Income, Balanced, Growth, and Asset Allocator)
- Uses SEM's Quantitative Economic Model
- Designed to overweight riskier assets if economic trend is higher & underweight those assets if economic trend is lower.
- NEUTRAL signal issued February 15, 2026 (following BEARISH signal from July 2025)
Strategic (quarterly)*:
- Monitored QUARTERLY
- Models: AmeriGuard (Balanced, Moderate, & Growth) and Cornerstone (Balanced & Growth)
- Core Component: Quantitative Filter using 4 different time horizons across universe of asset classes
- Trend Indicator: Two different Quantitative Systems monitoring the intermediate-term trend, health of the market, and volatility
- CORE has been overweight small cap and international since October 2025 – overweight increased slightly in January
- Both TREND INDICATORS are BULLISH following 10% drop and "V-Bottom" reversal in early April
- AmeriGuard & Cornerstone Max DO NOT use the Trend indicator and are always 100% invested in stocks using our CORE rotation model.
The core rotation is adjusted quarterly. This quarter we saw half of our international positions reduced (we sold developed markets and kept our emerging markets exposure). We also saw the remaining share of mid-cap reduced in favor of more small cap exposure. We remain with a "barbell" core portfolio – about half in large cap and half in small cap as the models expect the market to "broaden".
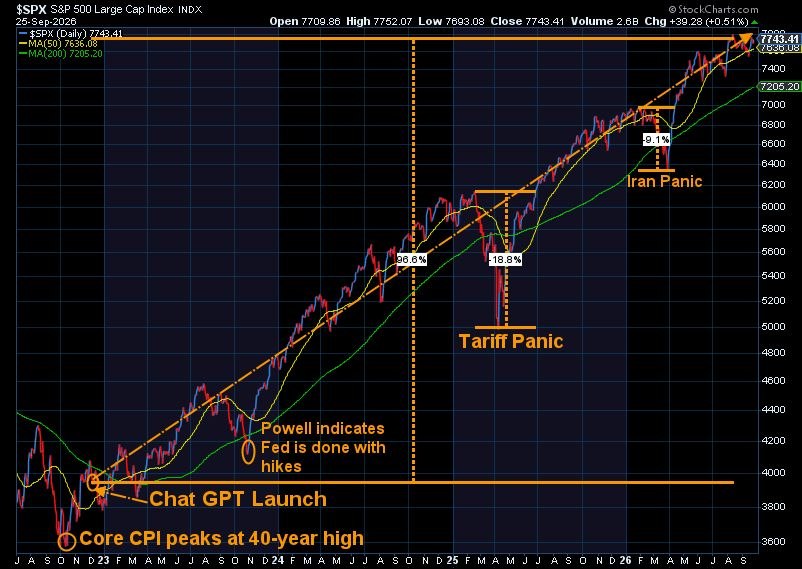
The * in quarterly is for the trend models. These models are watched daily but they trade infrequently based on readings of where each believe we are in the cycle. The trend systems can be susceptible to "whipsaws" as we saw with the recent sell and buy signals at the end of October and November. The goal of the systems is to miss major downturns in the market. Risks are high when the market has been stampeding higher as it has for most of 2023. This means sometimes selling too soon. As we saw with the recent trade, the systems can quickly reverse if they are wrong.
Overall, this is how our various models stack up based on the last allocation change:
Curious if your current investment allocation aligns with your overall objectives and risk tolerance?