I turned 30 recently, and while I didn’t feel any differences in turning 30, I noticed that there were things that 20s Cody wouldn’t recognize in me. The greatest change that’s taken place in the past year or so is that I took up a new hobby. As one does when they start to age, you pick a hobby that is slower-paced and more relaxing than the fast-paced, adrenaline-packed hobbies of your teens and twenties. That’s what I did when I started gardening.
This started out as a birthday present to my wife, who has many, many strengths but one is not patience. So, while she was frustrated with the amount of time it takes to see results in her backyard garden, I told her I can do the daily work and she can simply enjoy the results. Well, as it turns out, that was rewarding for me as well.
Gardening in Arizona can be difficult, because the summer doesn’t allow you to do very much before the sun torches everything you grow to ash. While most of the gardeners across the country and world can take advantage of the heavy sunlight hours of summer, Arizona is all about patiently waiting for the cooler weather to expand your options. September is important in getting ahead of the winter growing months to make sure you can actually harvest stuff later on. So, if you want a successful fall, winter, and spring in the garden here, you have to start all of that in the summer so you hit the ground running in September.
Well, I didn’t quite do that. It only took a couple of weeks to get a couple weeks behind schedule on our fall garden, but at least I got a hole dug out for our orange tree we planted. If you are used to real soil that your local area has this might not sound like a big deal, but the extremely rocky Arizona soil isn’t exactly workable. I still need to dig a hole for our lime tree. At least it isn’t 100 degrees anymore.
In a lot of ways, the Federal Reserve has had to act like an Arizona gardener in the summer. You can’t really grow anything right now, all you can do is try and prep what you can grow in the future. It is my opinion that the best way to get that done is to try and curb inflation now, sacrificing whatever short-term economic benefits letting inflation run hot might bring, and set yourself up for a more stable economy in the medium and long-term.
Yes, that means hiking rates. Short-term, this could lead to more expensive borrowing, lower earnings, slower growth, and perhaps some changes to the labor markets. But would people rather sacrifice those things to get ahead of the affordability concerns we have? I understand why presidents don’t want to see rate hikes under their watch, because it is easier to let the future politicians deal with the short-term consequences rather than themselves. All pushing off these hikes would do is creates a more unstable future for us. Could you fix inflation without hiking rates? Yes. The Iran war ending would be a great place to start, with oil prices being one of the big culprits of why inflation is what it is. But it would be a solution, perhaps the easiest solution.
Another solution would be perhaps worse news for the economy than rate hikes: stopping the AI boom. This is because it has been shown that the AI boom has contributed to inflation in a number of ways. While this may be part of the gripe that the population has with AI, it seems many people have decided they are out on AI as it is.
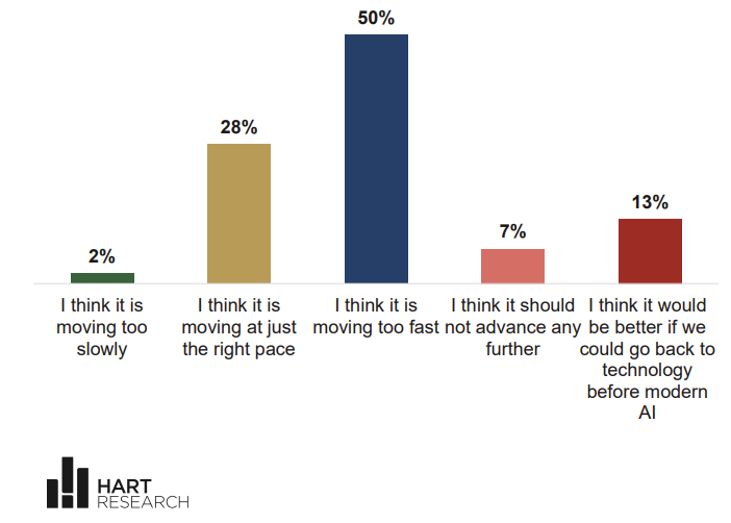
While you can chalk up this grievance with a general aversion to change, that doesn’t seem to be the case. It’s simply the rapidness of the change itself, and more specifically, the lack of regulation that has come with the AI boom. People’s concerns for AI include things like elimination of jobs and industries, environmental concerns, and government spending. One point to make is that maybe people are anti-AI for political reasons; the president is currently championing AI and whenever the president gets involved the subject turns political. However, there isn’t currently a “winner” in the AI debate:
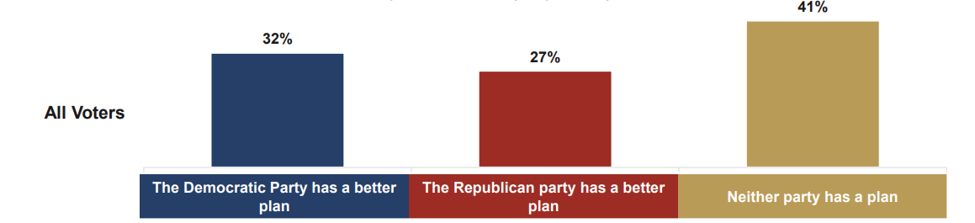
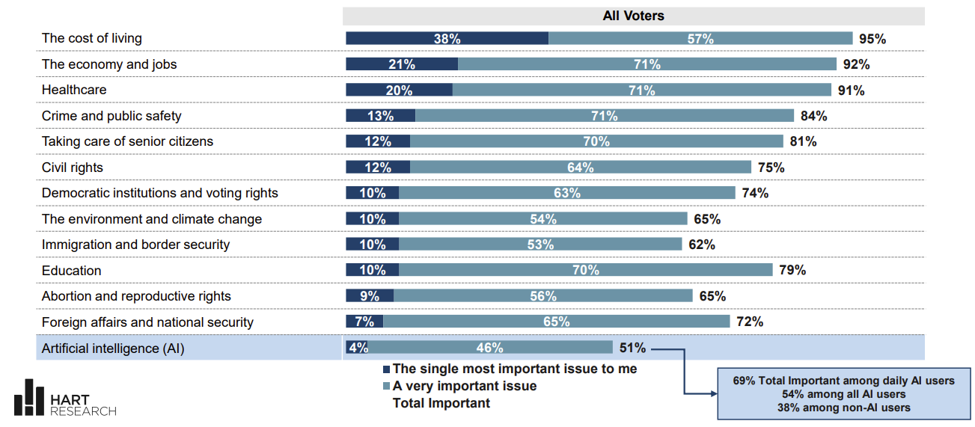
The winning strategy in the short-term when it comes to the AI debate may be to stay on the sidelines (of the debate), or at least consider the concerns that Americans have and try to tide those concerns. It should be stated, though, that AI is far down the line on the priority list when it comes to voters this November:
Jamie Dimon listed a number of factors contributing to inflation outside of AI. These included global deficits, and enormous demand for capital, remilitarization, and other infrastructure buildouts. AI is the hot button topic, but these other concerns aren’t really being addressed currently. While Trump’s tariffs have been an attempt to combat global deficits, the short-term effect has led to increased inflation, and the attempt to build American has created more infrastructure buildouts, with increased government spending. Government spending in of itself is inflationary, and government spending hasn’t been higher than what it currently is (outside of 2020 and 2021 during Covid) for quite some time. The intertwined nature of our complex economy likely won’t lead to a single fix without affecting other areas 2 or 3 links away. It’s a tough problem to deal with. But one that people are expected to solve.
Virtually every election can come down to the same messaging: it’s the economy, it’s the economy, it’s the economy. The sentiment is that the economy is NOT healthy currently, for a number of reasons, and the ECONOMY will be the referendum the voters will use to show their pleasure or displeasure of the current administration. While the polling trends have been going against Republicans, and the updated prediction markets show a losing battle in Congress in a couple months, these correlate directly with how the economy is performing. As it stands, Democrats are expected to be clear of the 50/50 tie in the Senate, but there is still the possibility of being up by a couple votes clear of a rogue vote within their chamber (hello Fetterman). If there can be signs of improvement within the economy, these polls will be correct. The problem is how late will be too late to show progress. As far as I understand it, it’s still legal to vote early by mail. I will wait for updates on that.
Getting behind on my wife’s gardening checklist this month didn’t mean I was too late to grow anything at all. We are just going to be a couple weeks away from having home-grown kale and broccoli. The “damage” I had given myself wasn’t permanent, but the longer I waited to fix the problem, the worse the result would’ve been. This should be a good lesson for those putting off their goals (you don’t need to wait for New Year’s Day to start making positive changes!) In SEM’s terms, it means that if you find yourself uneasy with where your investments are, you can have a conversation with your advisor to make sure things are where they need to be. If you’re unsure if things need adjusted, the best place to start would be to take our risk tolerance questionnaire. As it stands, we all have time on our sides, but the longer we wait, the less that is the case. I think our government officials feel that’s the case, but there is still A LOT of time before change needs to be made. The question is whether those changes will be for our short-term benefit or long-term. As always, we will be here keeping track of it all and trying to make sense of it all.
Jeff GPT
Jeff is off this week, but he wanted to share a very early output from a project he's been working on over the summer.....JeffGPT. The ultimate goal is to provide a resource to the internal SEM team and possibly our financial advisors to be able to ask, "what would Jeff say about this." Thus far, all of Jeff's blogs going back to 2016 have been fully archived along with transcripts from advisor presentations the past 4 months. There is a lot more to go, but last week, Tim McCain, our Business Development Consultant had fielded several questions about how the Fed's rate hike would impact our Tactical Bond allocation. Tim's question:
"So with the rate hike is it likely TB will move out of high yield bonds?"
So Jeff put that question into JeffGPT and this is what it said (note this was as of Thursday, September 17 – our positions may have changed by the time you are reading this.)
The short answer is the rate hike by ITSELF doesn't move Tactical Bond. The model doesn't know the Fed met. It asks one question every day: are high-yield bonds trending up or not? If they are, we own high yield, and if the trend breaks, we go to money market.
High yield doesn't necessarily move on what the Fed does, it moves on what the economy is doing (or where the market thinks it's headed). High yields are more credit sensitive than Treasuries, so a weaker or stronger economy changes the risk of getting paid back, and THAT is what shows up in the trend. A quarter point from the Fed doesn't change whether a company can make its interest payment, but a recession does.
On the hike, I've been asking for it for over a year. A Fed that's serious about inflation isn't automatically bad for high yield. Compared to what, a Fed that lets inflation run? The bond market is smarter than the stock market because they care about getting paid back, not about a quarter point. My theory is long-term rates actually come DOWN when the Fed gets credible on inflation. That's a test, and the verdict isn't in (day one was the right direction but too small to count). The thing that could mess it up is Treasury supply.
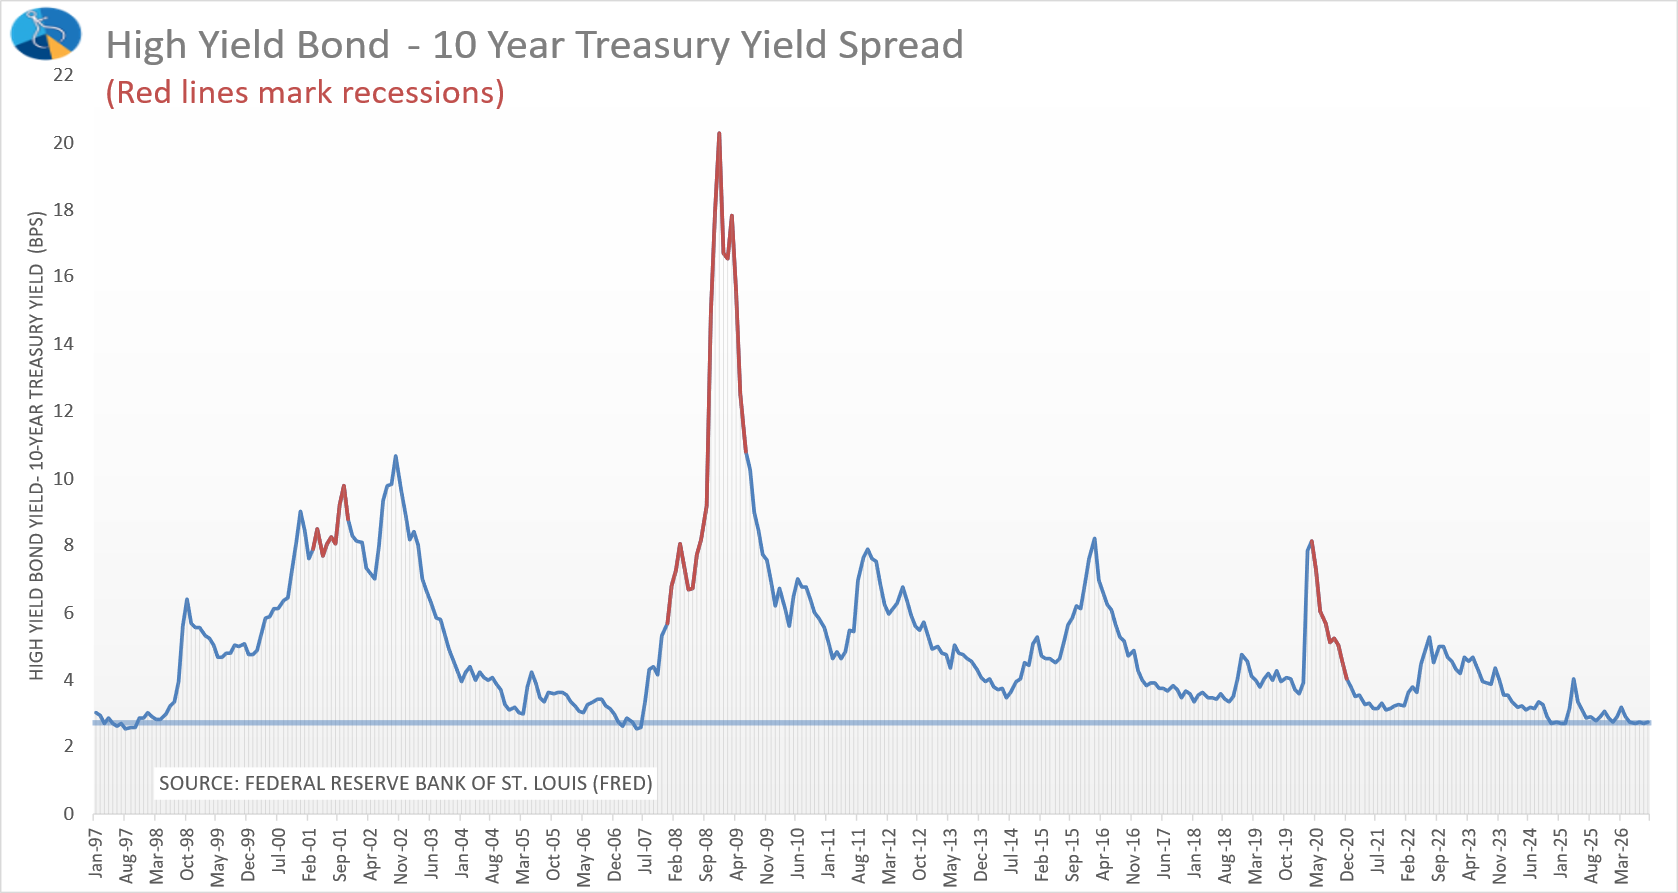
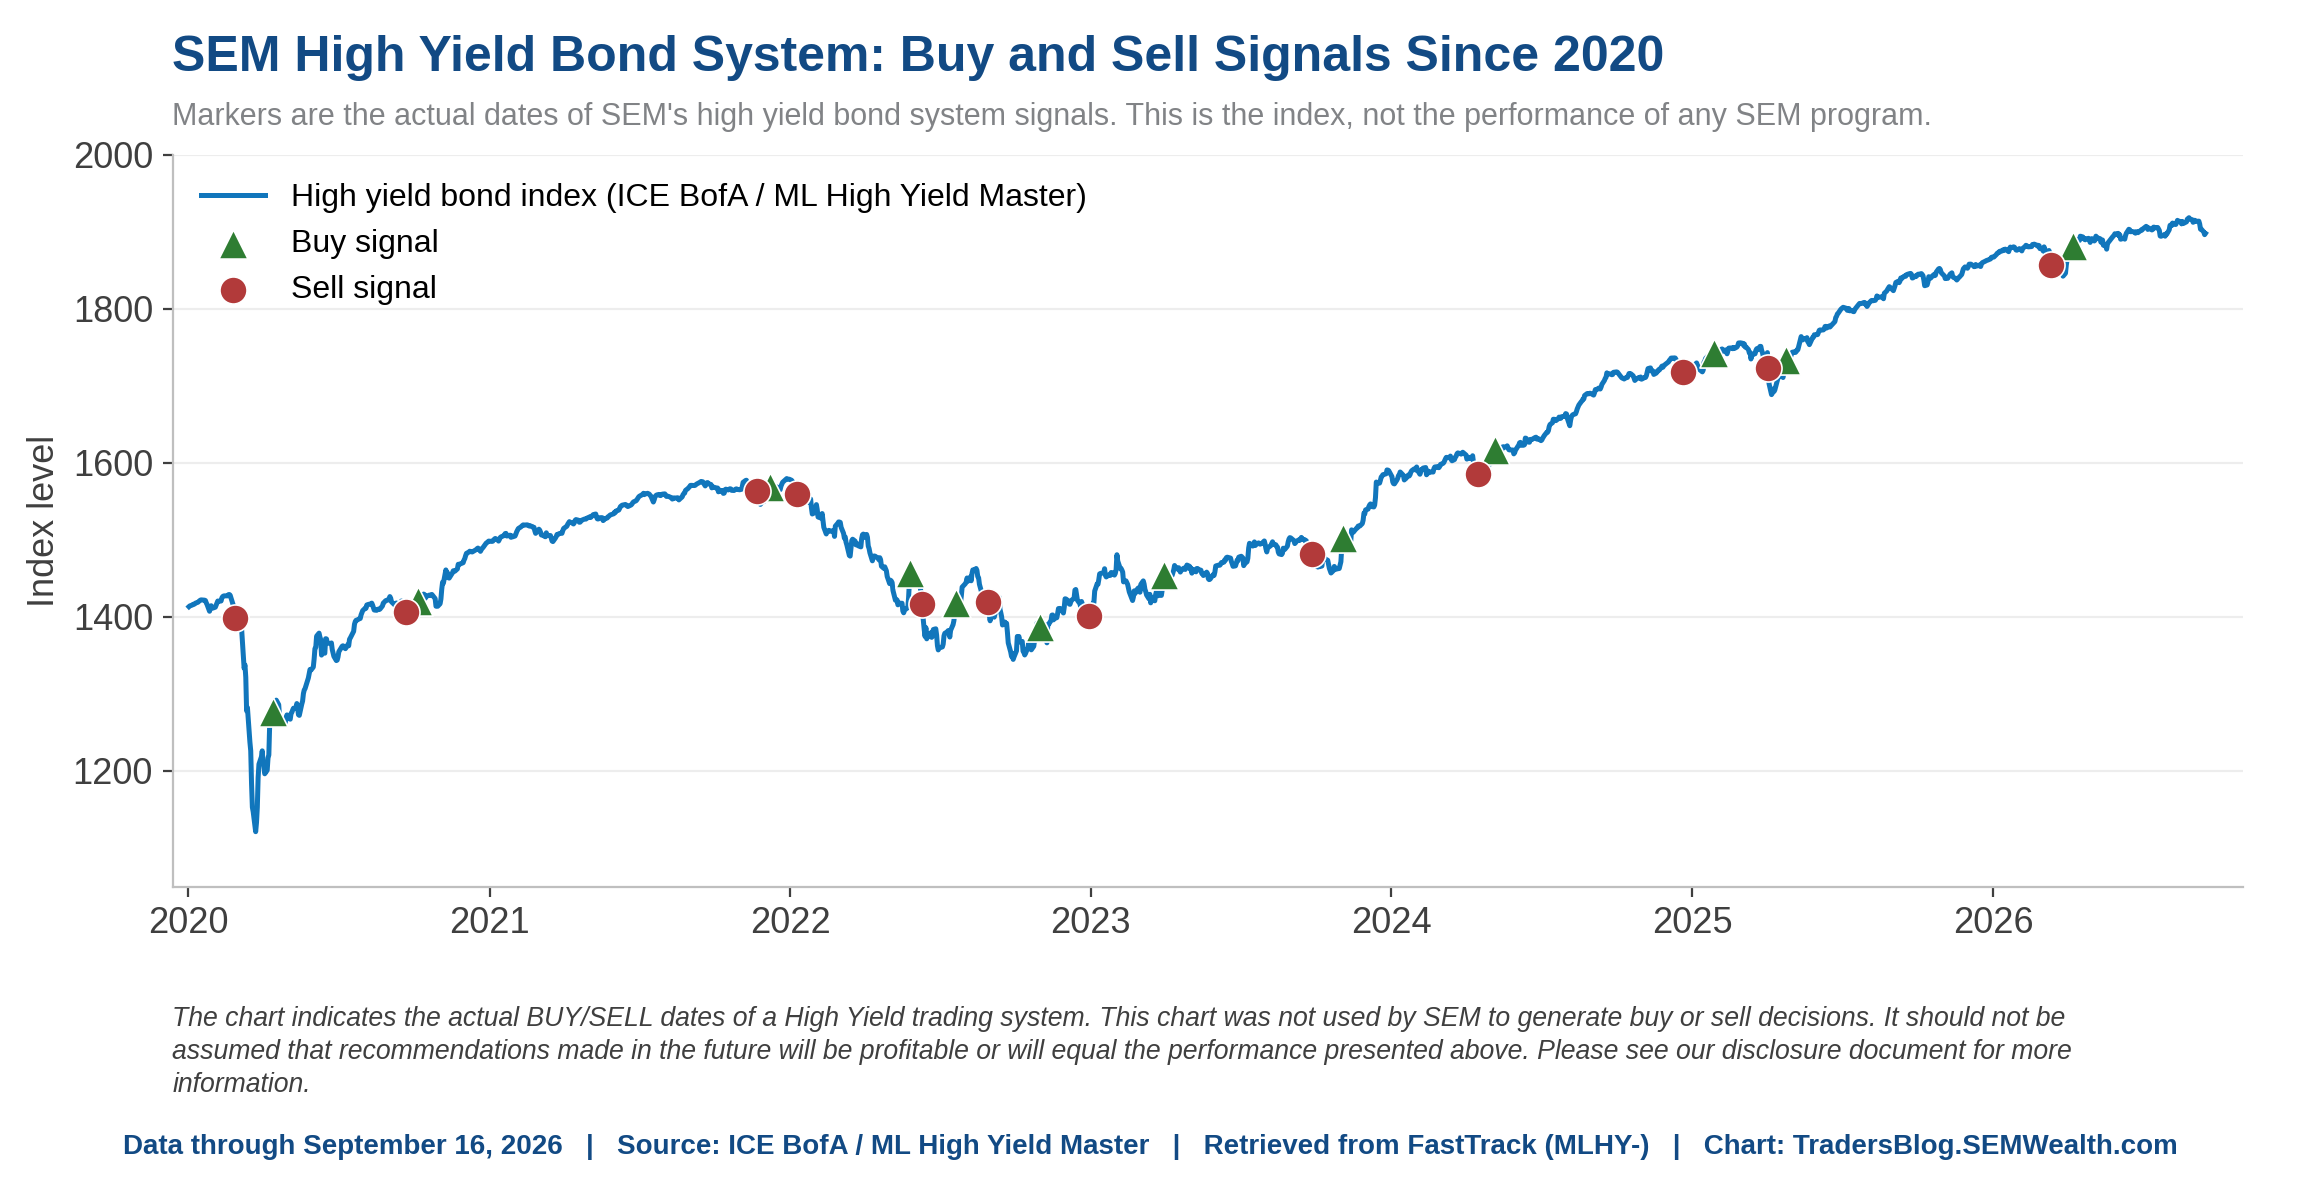
If we do get the sell, remind advisors what it looks like. 2007 is the template, with a bunch of whipsaw trades before the real one showed up. This year we sold March 13 and bought back April 8 (see HYB system trade chart below), and nobody had to make a call. It's been crawling along since then. It might get out early, but it can jump right back in. With spreads this tight (see chart below) we're just earning the yield minus our fees anyway, and the bigger returns come AFTER a spike in spreads we rode out in money market.
The sequence if the trends turn lower is high yield sells first, the Dynamic models are already neutral, and AmeriGuard and Cornerstone would be the last to take money off the table. We don't know, and we don't have to know. That's what the system is for.
[Jeff's Note: This isn't exactly HOW I would say it, but the answer is pretty good. It was probably helped by the fact I literally answered that question during an Advisor Update earlier that day. We have a lot of work to do, but this does show some of the potential to utilize the thousands of things I've written/said over the past 28 years with SEM.]
The Debasement Trade Index
Before Jeff left, he wanted to introduce something he's promised for the past month – an index to track the "Debasement Trade" (first written about here).
A few weeks back I mentioned an index from Ned Davis Research (NDR) that I wanted to start sharing, and they've given us permission to post it. So here it is, and it'll be a semi-regular feature going forward. First, the term. The "debasement trade" is Wall Street's name for what investors buy when they're worried the government's only real way out of $40 trillion in debt is to let inflation quietly shrink it. I've written about this before. A country with too much debt has 4 exits (grow our way out of it, tax and cut, default, or inflate it away). Three of those aren't happening. Everybody watches gold and Bitcoin as the scorecard for that worry. The problem is those two move for a lot of reasons that have nothing to do with the dollar. NDR's index fixes that by putting 13 different investments in one basket – gold and silver, the miners, industrial metals, energy, materials, infrastructure, crypto, and a bet against the dollar. All are equal weighted and reset each quarter. If the whole basket is moving together, that's a signal to us that markets are worried about the stability of the dollar, not just that gold had a good week.
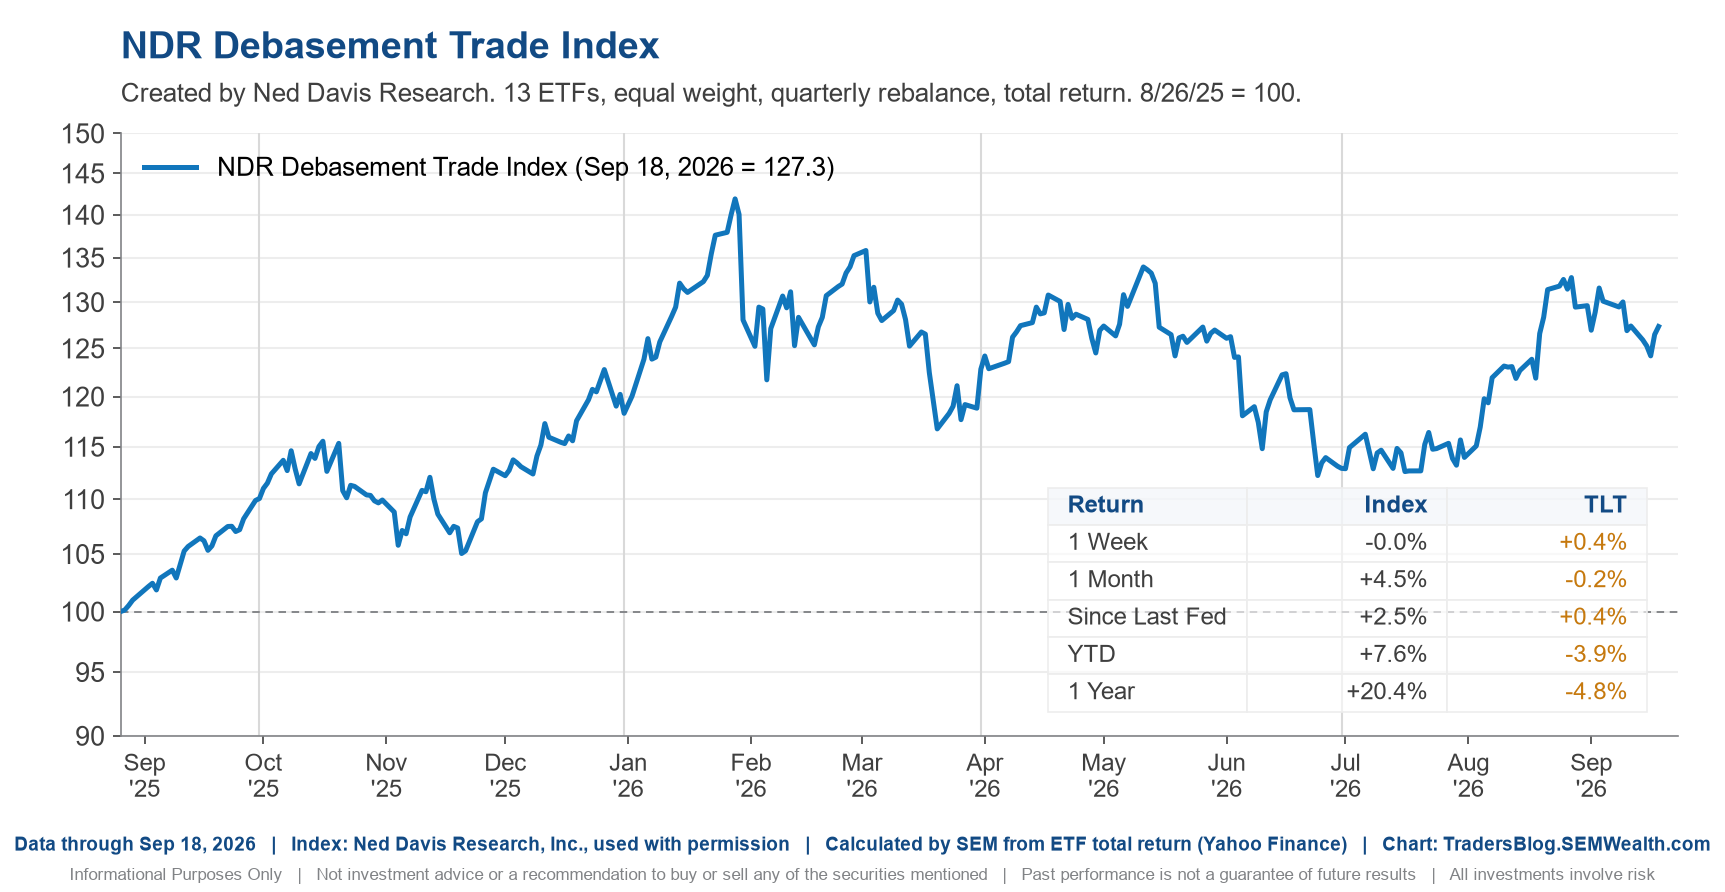
What it says right now: the index finished the week basically flat, but it is up about 20% over the past year. It topped out in February, gave most of that back by July, and has bounced hard since. The big swings show us how the market sentiment has changed over the year. The second thing to watch is the small table on the chart. We put long-term Treasuries (TLT) next to the index on purpose. A true debasement week is when the basket goes UP and Treasuries go DOWN (money leaving fixed dollars for things that can't be printed). When both fall together, that's something else (usually everybody selling everything), and we don't want to confuse the two.
My favorite part is the "since last Fed" column. Since Wednesday we can see even though the Fed confirmed they are worried about inflation, NDR's Debasement Trade Index is up 2.5%, but Treasuries also rallied. That's not a "debasement" week by my definition. It also is the first test of my theory that long-term rates would go DOWN if the market was convinced the Fed was getting serious about inflation (first mentioned here). It's too early to tell if that is the right call, but both Treasuries and the NDR Debasement Index may give us a clue going forward.
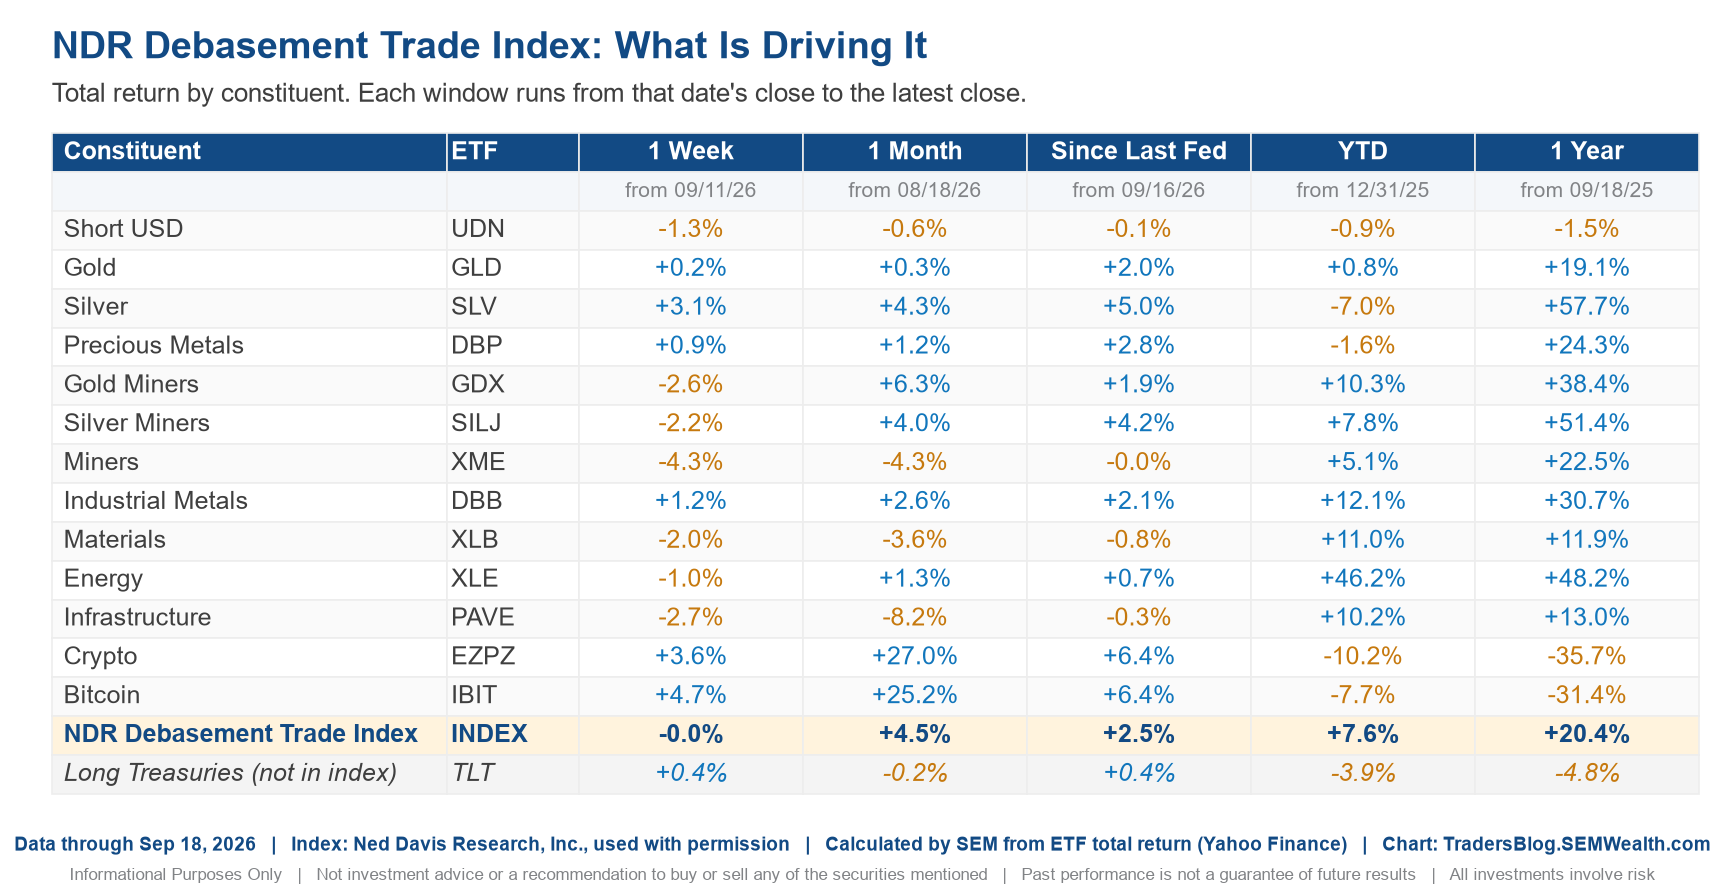
It's important to note this isn't a trading signal, but more informational to watch whether the market is concerned about the stability of the dollar, which could impact the bond market. We'll keep you posted when we see big moves or divergences in a given week.
First Hike Since 2023
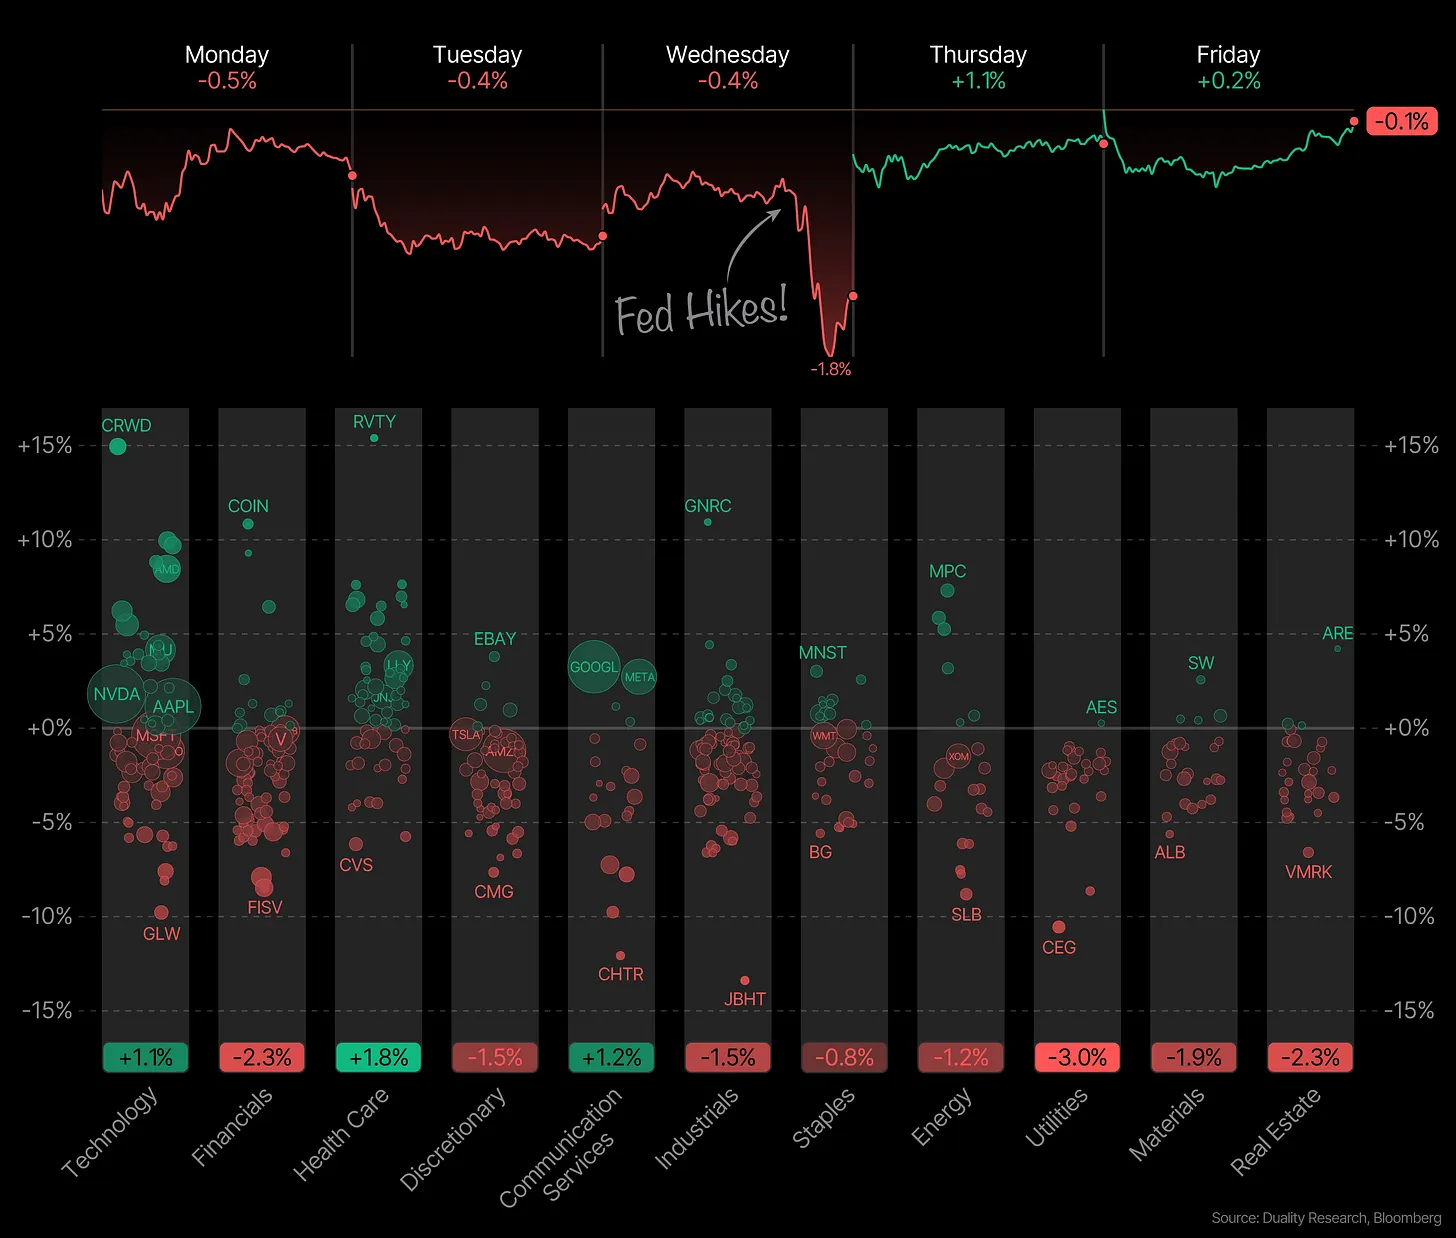
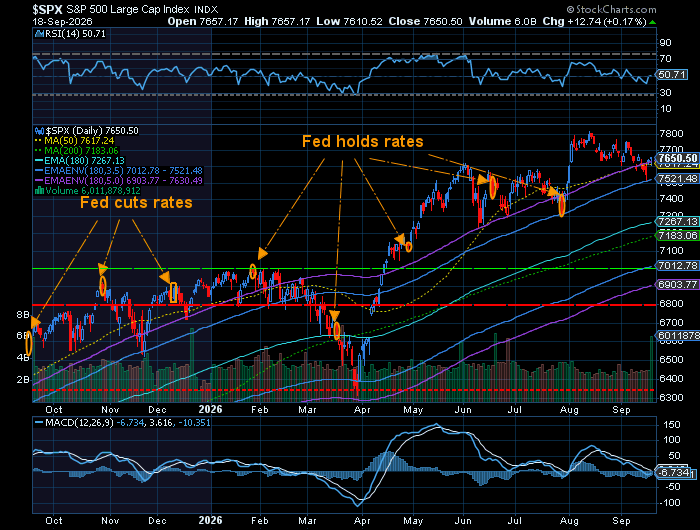
On September 16, the Fed's rate-setting committee voted unanimously to raise its benchmark rate by a quarter point, to a range of 3.75%–4.00%. It's a small move in absolute terms, but a big one symbolically: it's the first rate hike since July 2023, and it comes barely nine months after the Fed had been cutting rates to support the economy.
In short, a brief easing cycle that ran from September through December of last year, three quarter-point cuts, has now been undone in a single meeting.
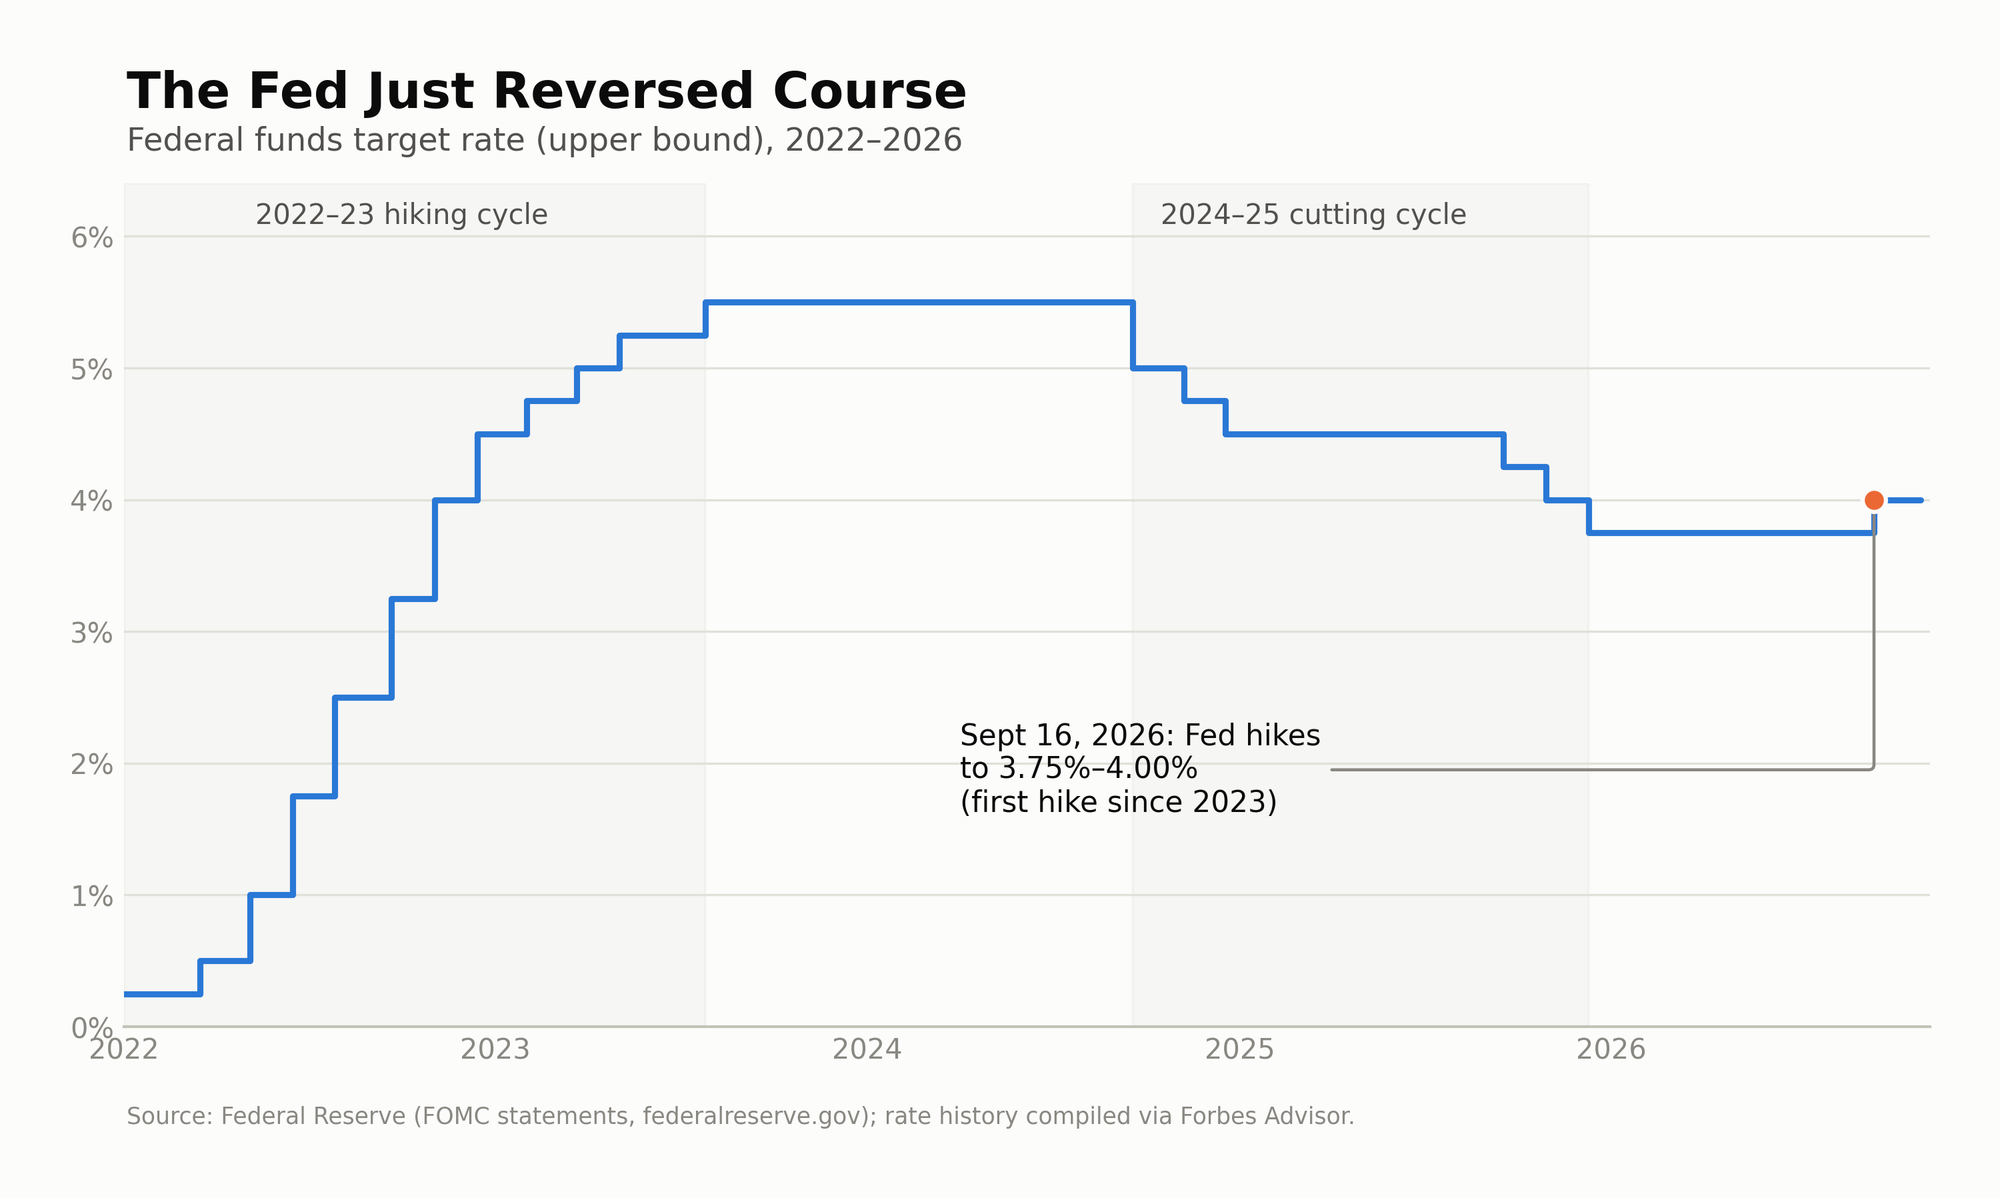
The reversal reflects a shift in the Fed's read on the economy under new Chair Kevin Warsh, who took the helm in May. The committee's statement described growth as "expanding at a solid pace," while inflation remains "elevated" and running above the Fed's 2% target. Rather than staying patient, the Fed opted to act, language in the statement pointed to a desire for a "timelier return" to that target. The committee's updated projections, also called the "dot plot", suggested officials see room for at least one more quarter-point increase before year-end, putting the funds rate around 4.1%–4.4% by December.
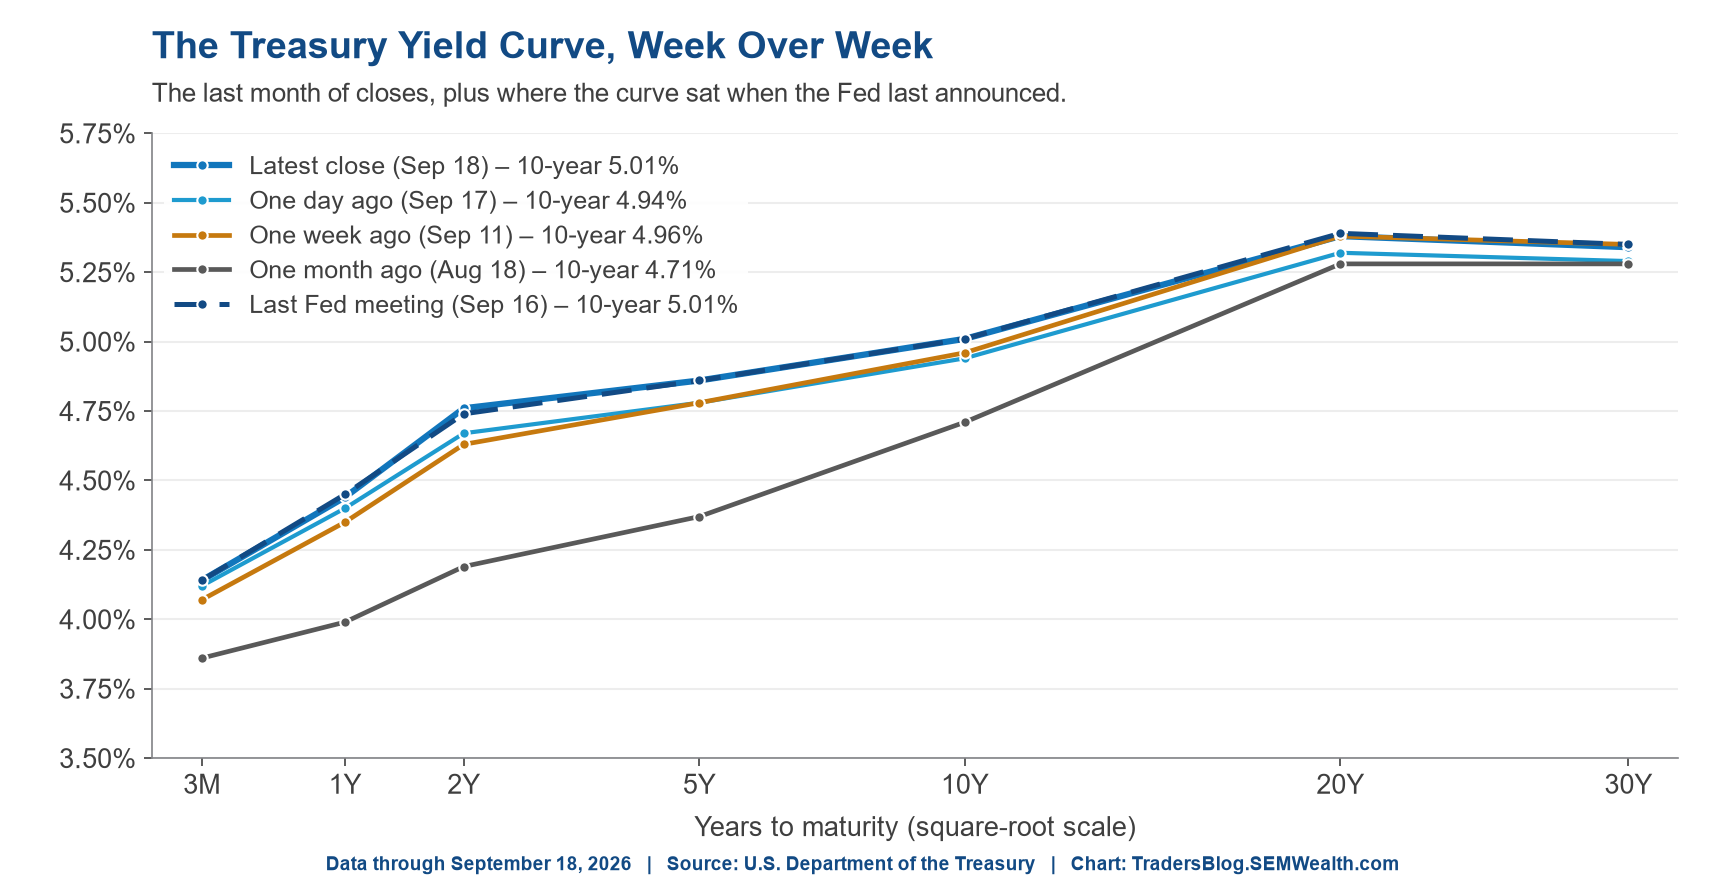
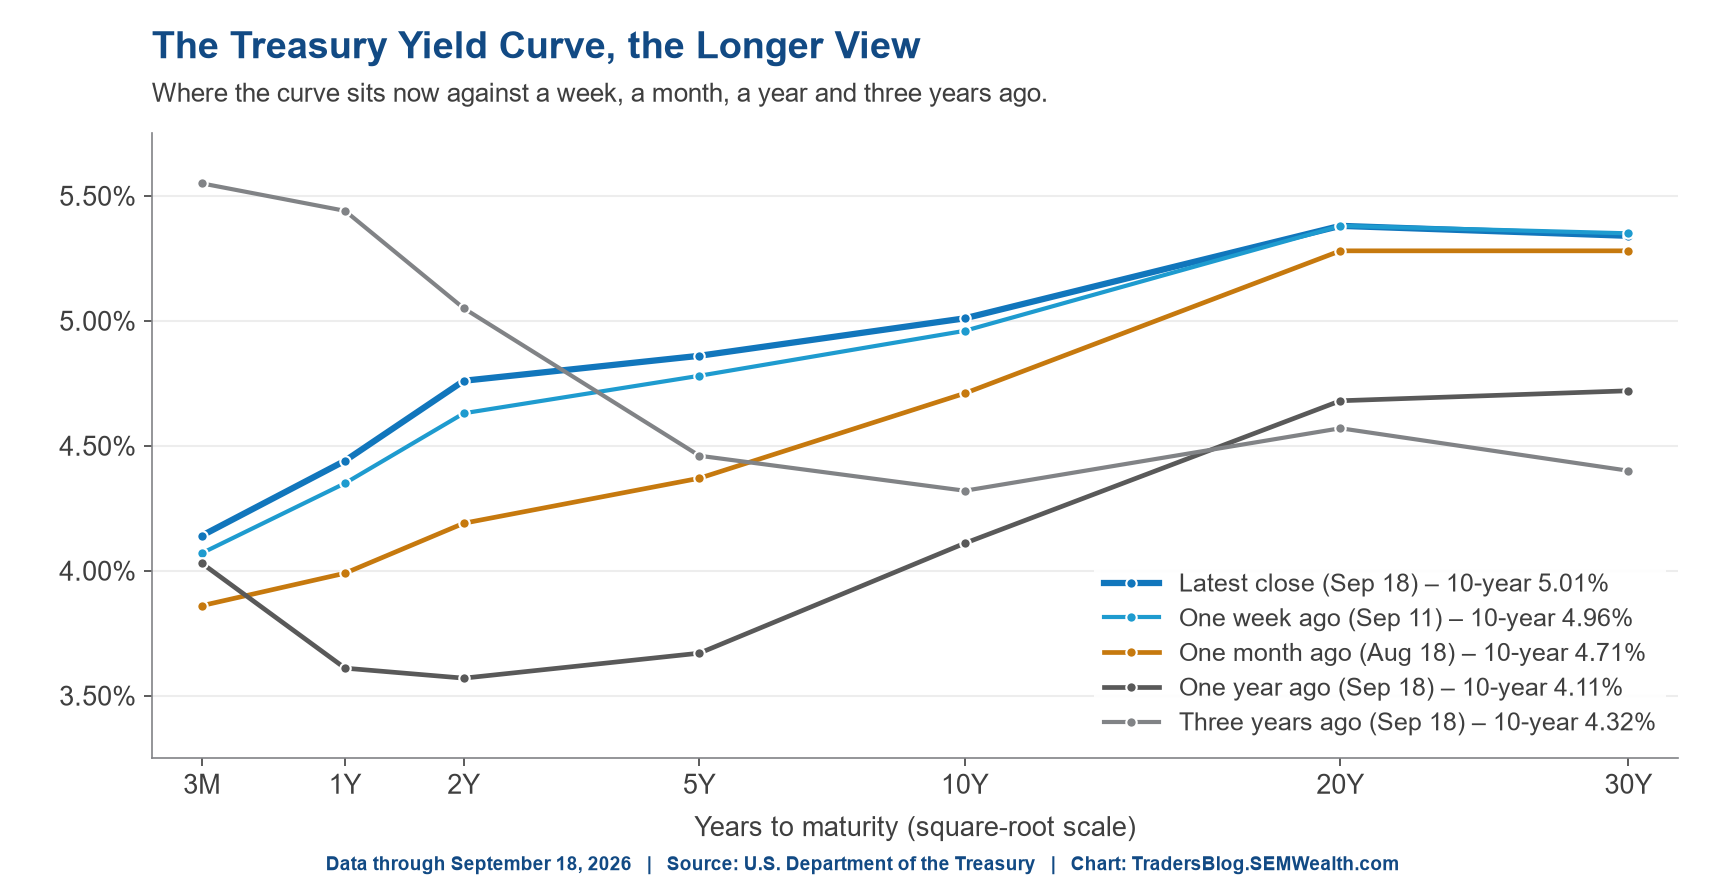
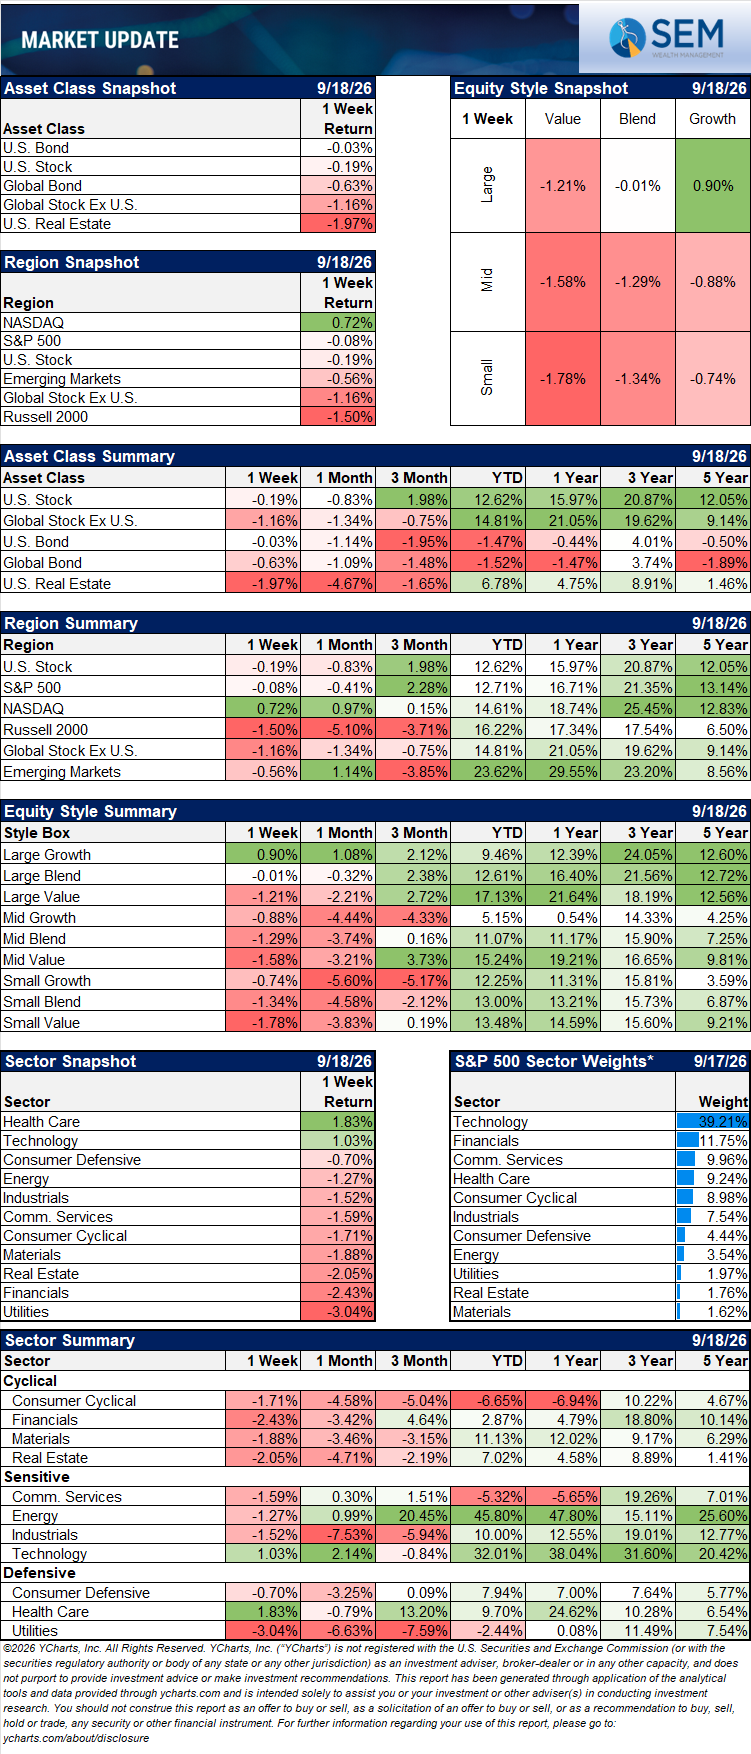
For client portfolios, the practical implications are worth watching closely. Higher policy rates tend to keep borrowing costs elevated for longer, a headwind for rate-sensitive areas like housing, small-cap equities, and highly leveraged companies, while offering a modest silver lining for savers and short-duration fixed income, where yields should stay attractive a while longer. It's also a reminder that the path of rates is rarely a straight line, and that positioning built around "cuts are coming" assumptions may need a second look.
We'll continue to track how markets digest this shift and will flag any follow-through, including whether the Fed does in fact follow through on a second hike at its next meeting in late October.
At SEM, we believe your time is best spent focused on what matters most to you, not on keeping up with the complexities, evolving regulations, and latest trends shaping the financial markets. With SEM as your trusted advisor, we take on that responsibility through a disciplined, research-driven investment process designed to identify opportunities, manage risks, and adapt to changing market conditions.
Thank you to all of the visitors who read last week's "Chart of the Week". I hope to continue sharing these talking points about markets, investing, etc., for you to share with family, friends, coworkers, or anyone along the way.
See you next time!
Market and Economic Data
[text]
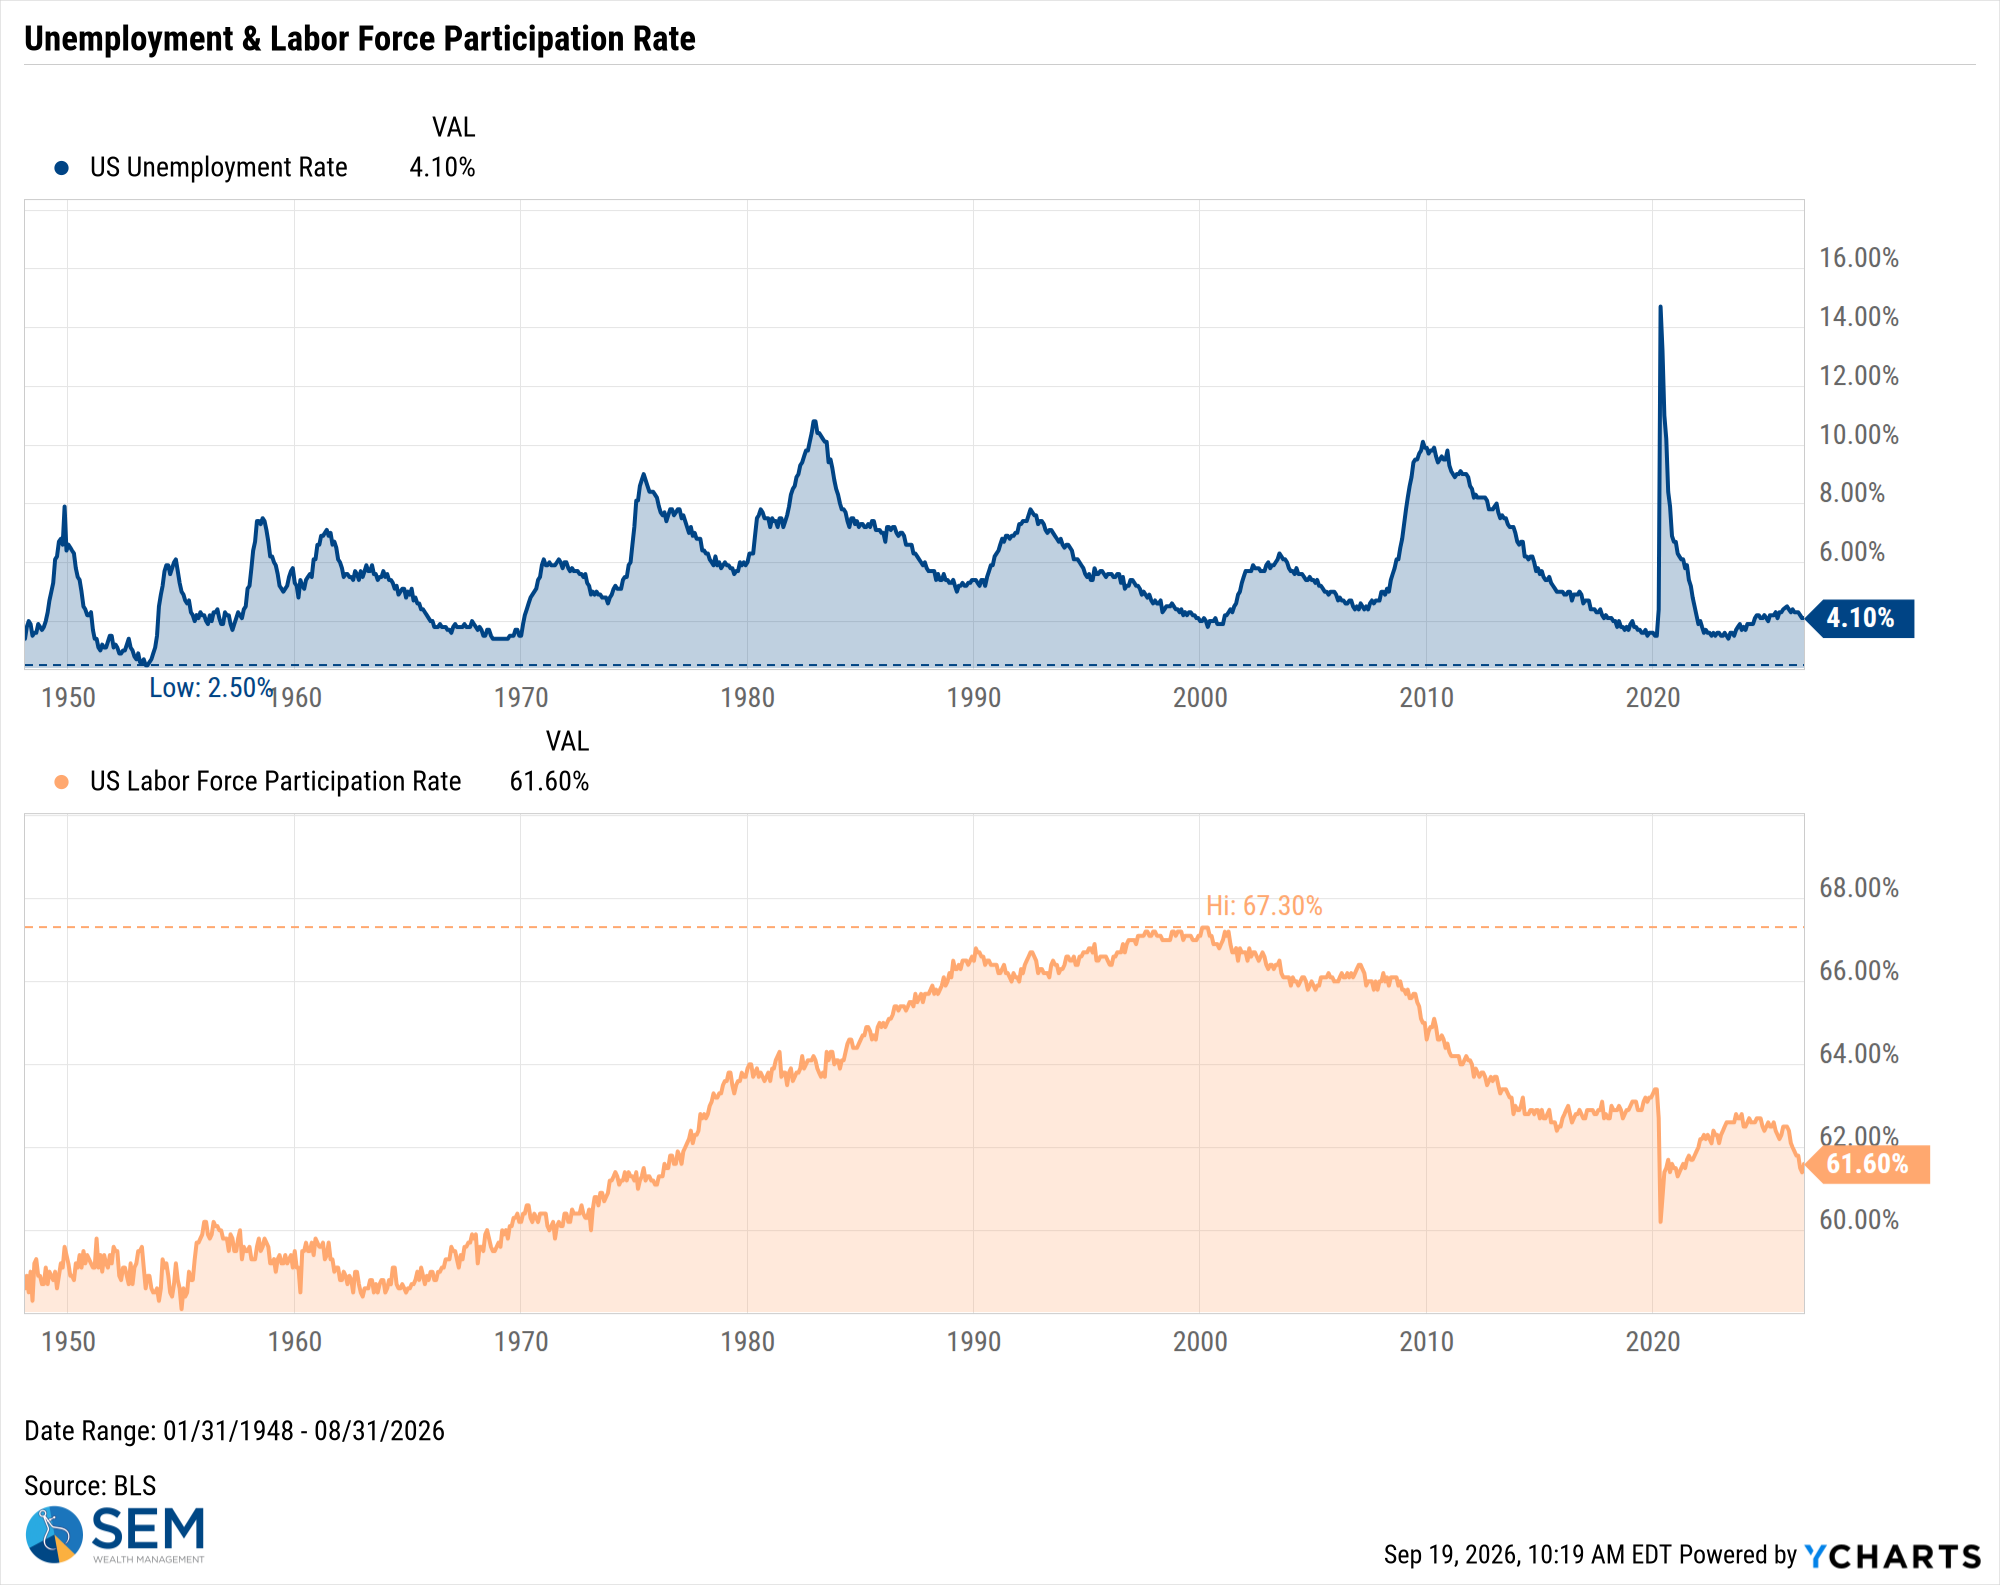
US Unemployment Rate data by YCharts
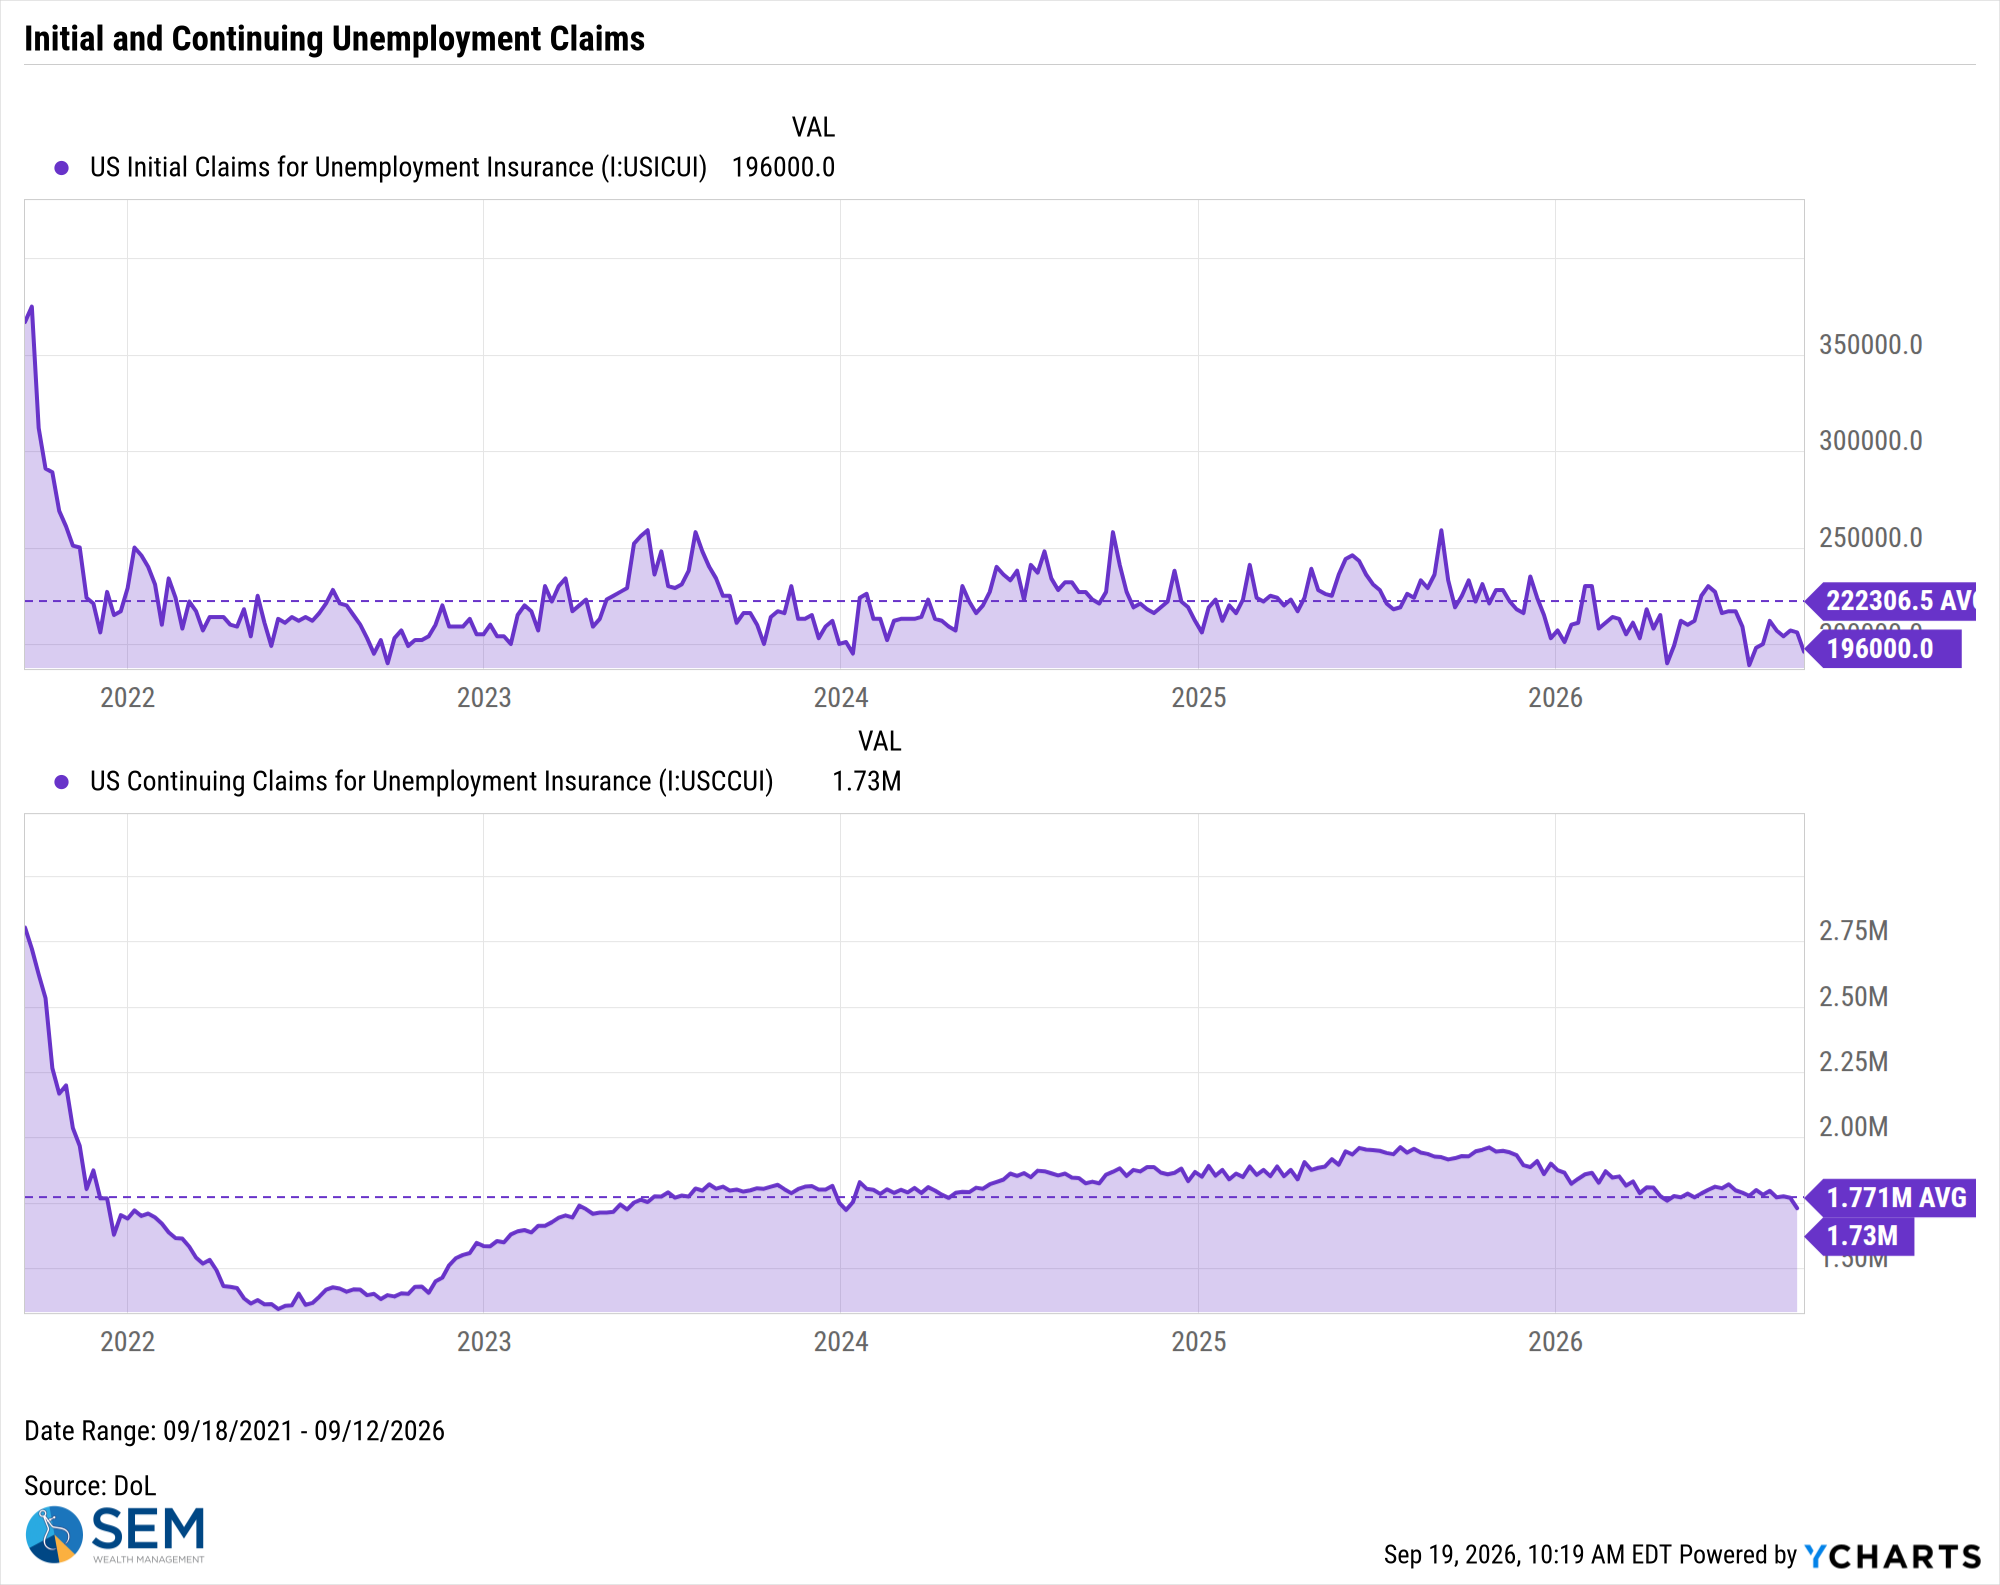
US Initial Claims for Unemployment Insurance data by YCharts
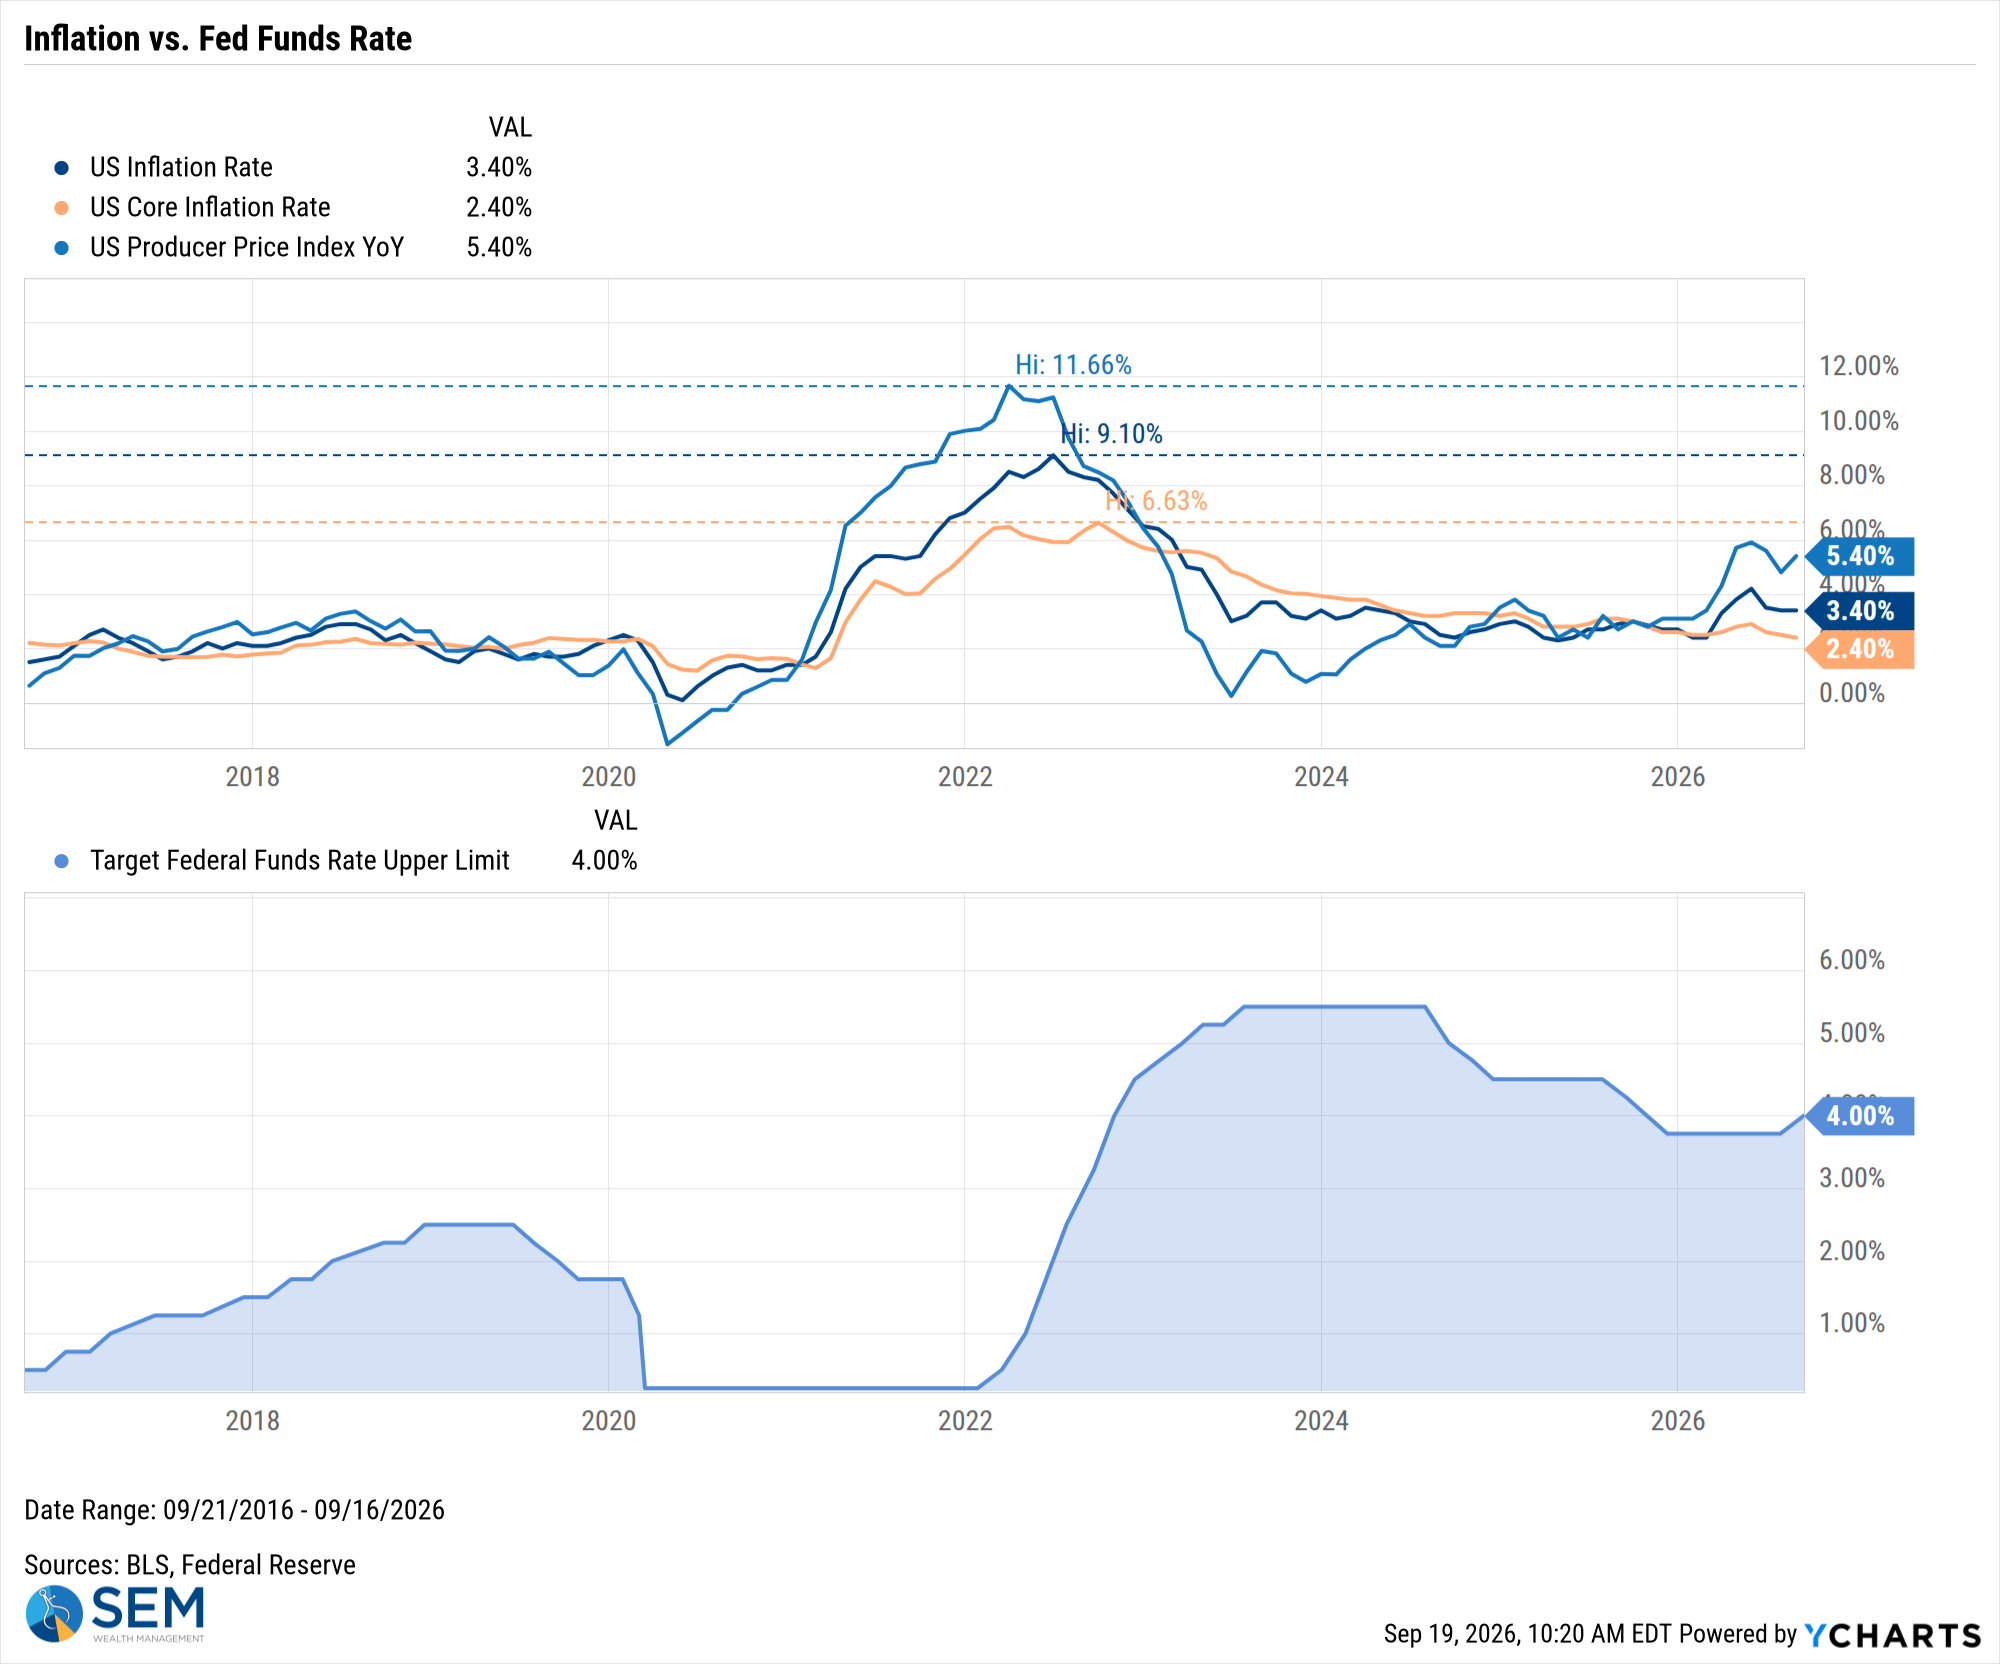
US Inflation Rate data by YCharts
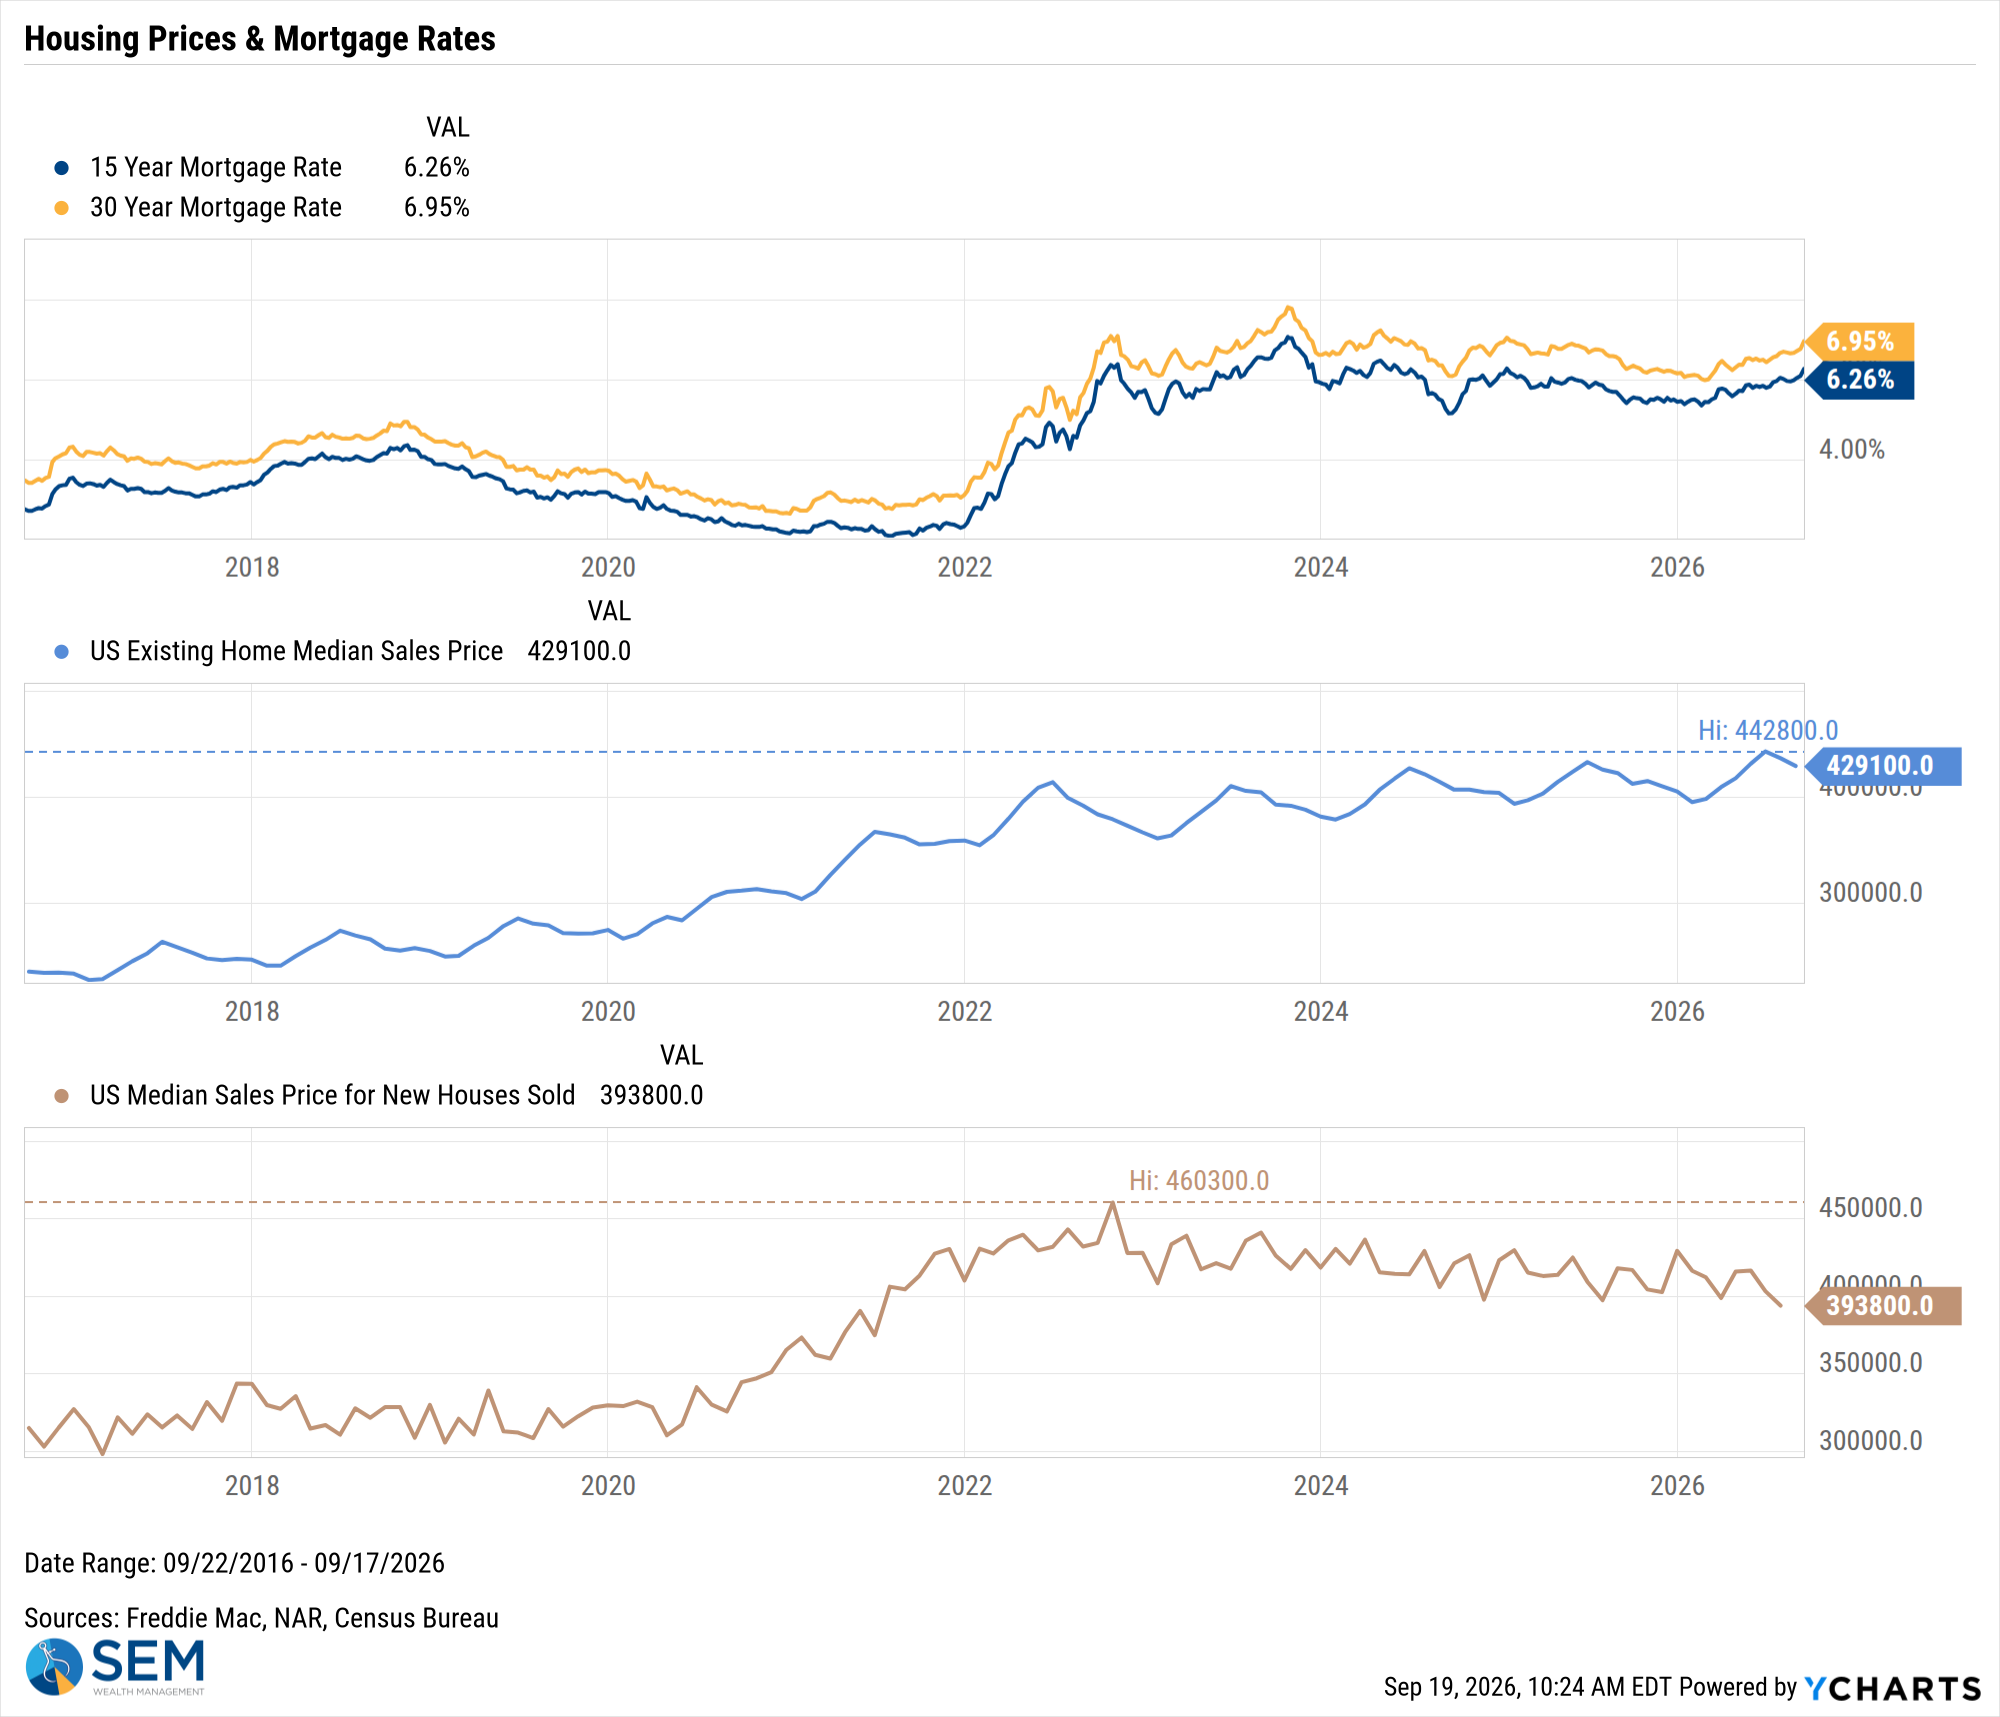
US Existing Home Median Sales Price data by YCharts
SEM Market Positioning
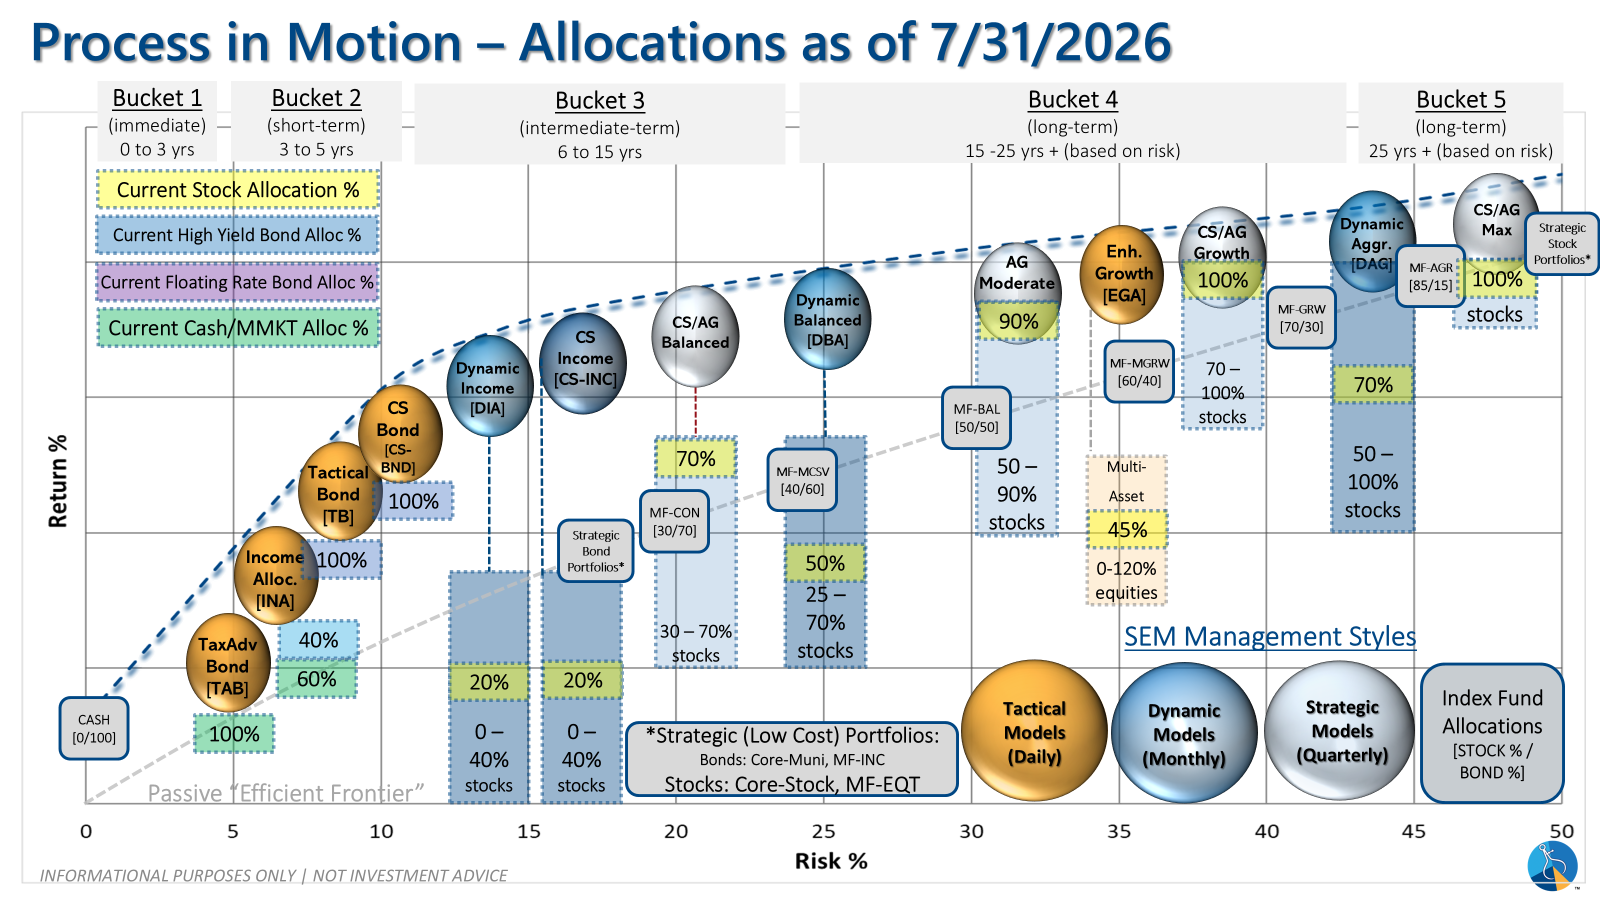
SEM deploys 3 distinct approaches – Tactical, Dynamic, and Strategic. These systems have been described as 'daily, monthly, quarterly' given how often they may make adjustments. Here is where they each stand.
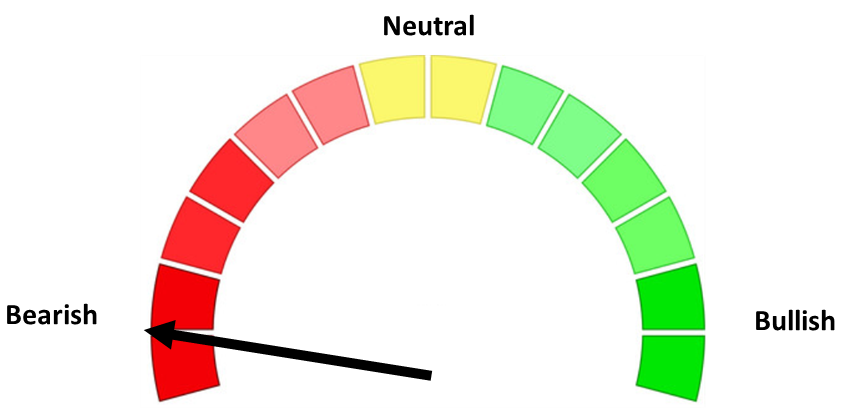
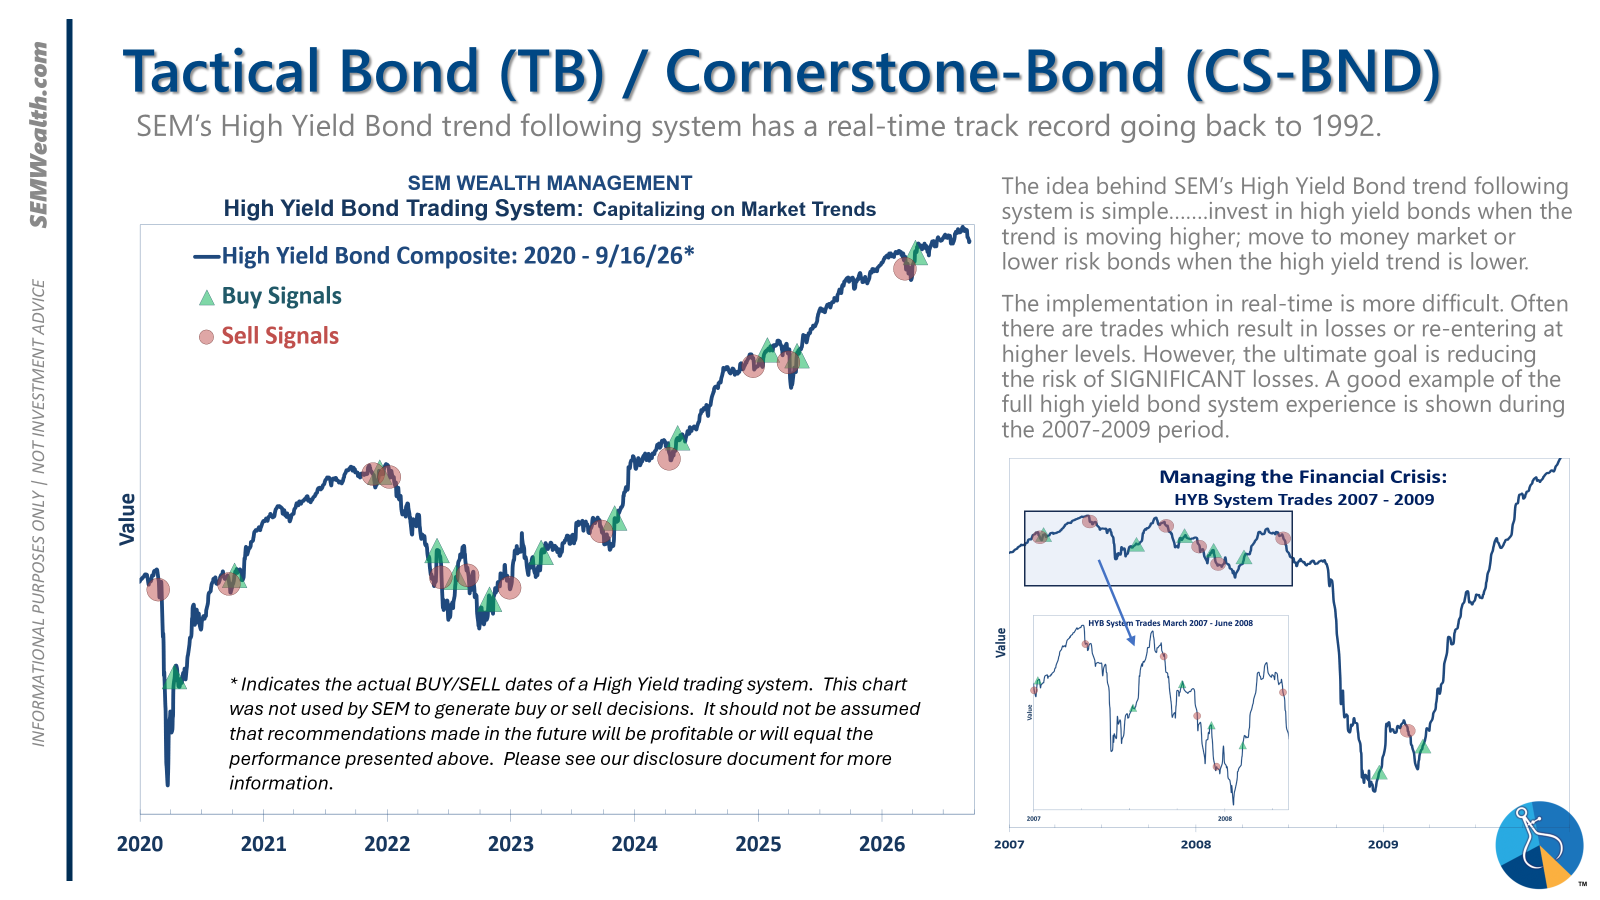
- Tactical = BULLISH | 100% High Yield Bond (4/8/2026) | High-yield spreads remain narrow but trend is slightly higher
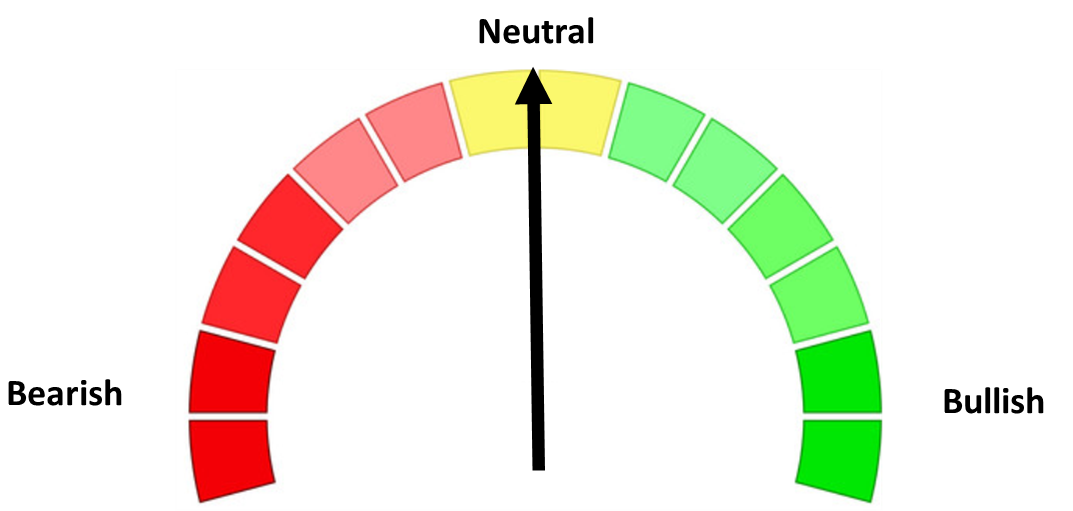
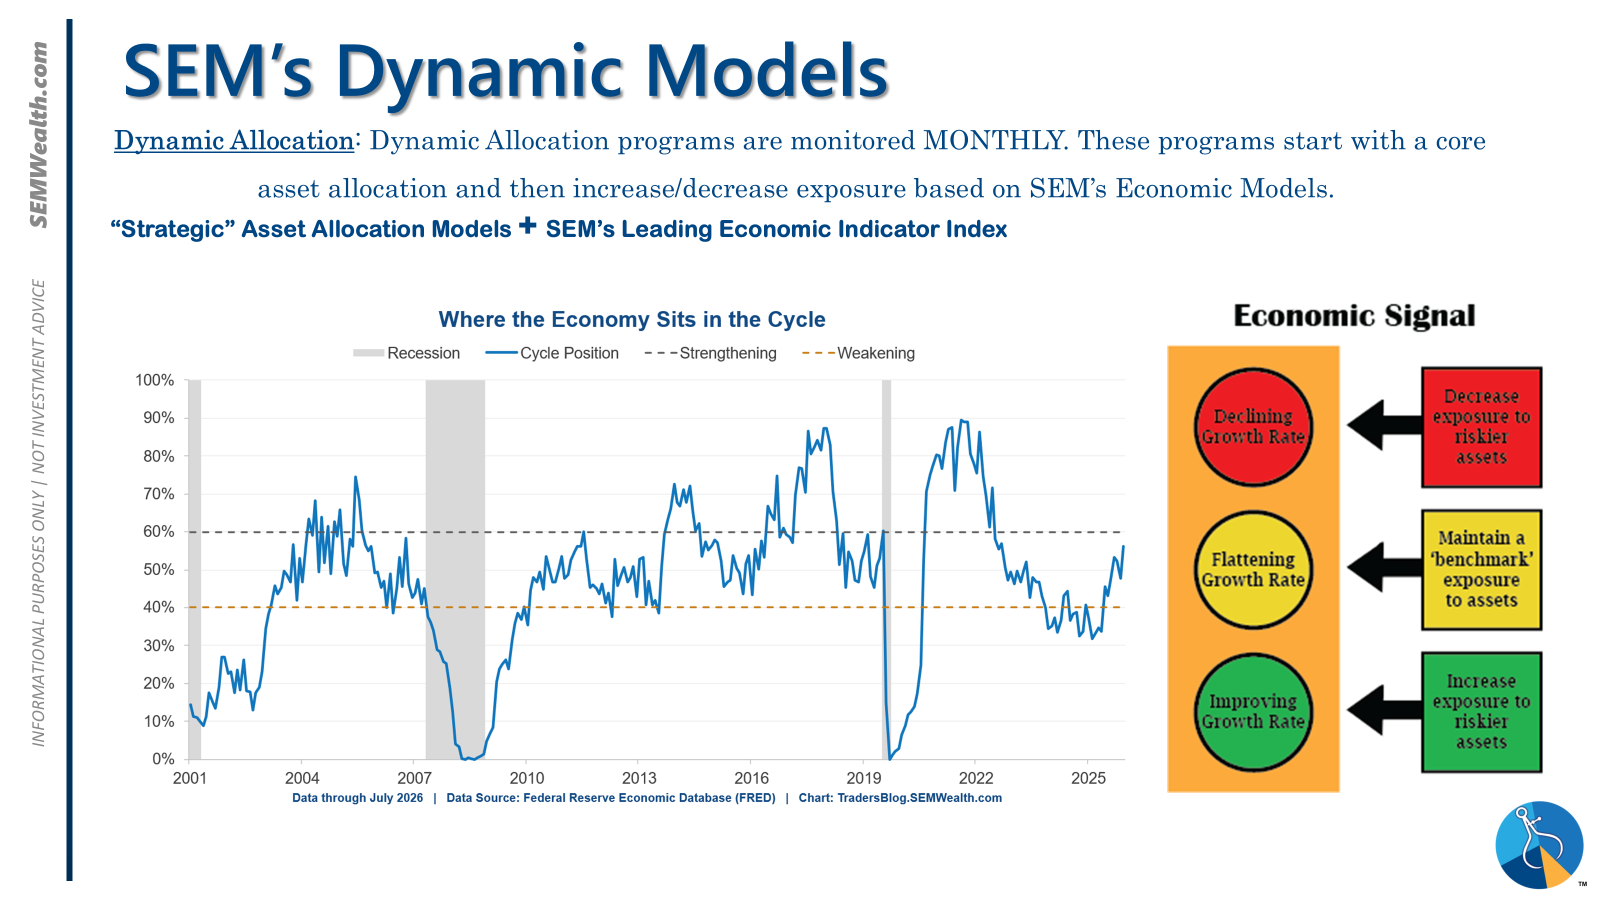
- Dynamic = NEUTRAL (2/15/2026) | "Benchmark" Allocation | Economic model inconclusive
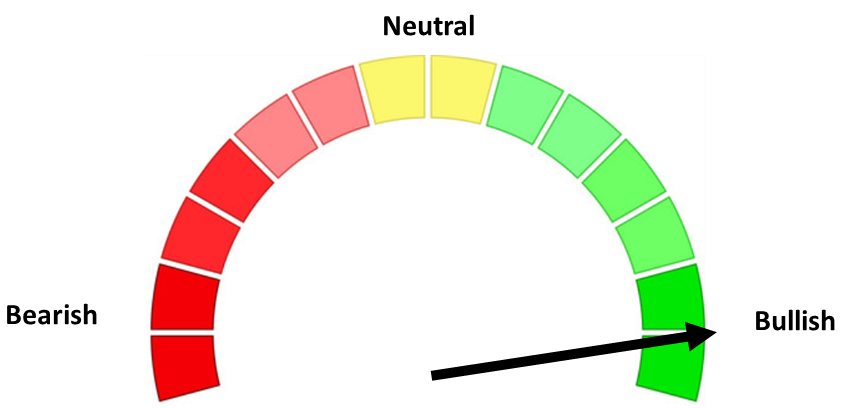
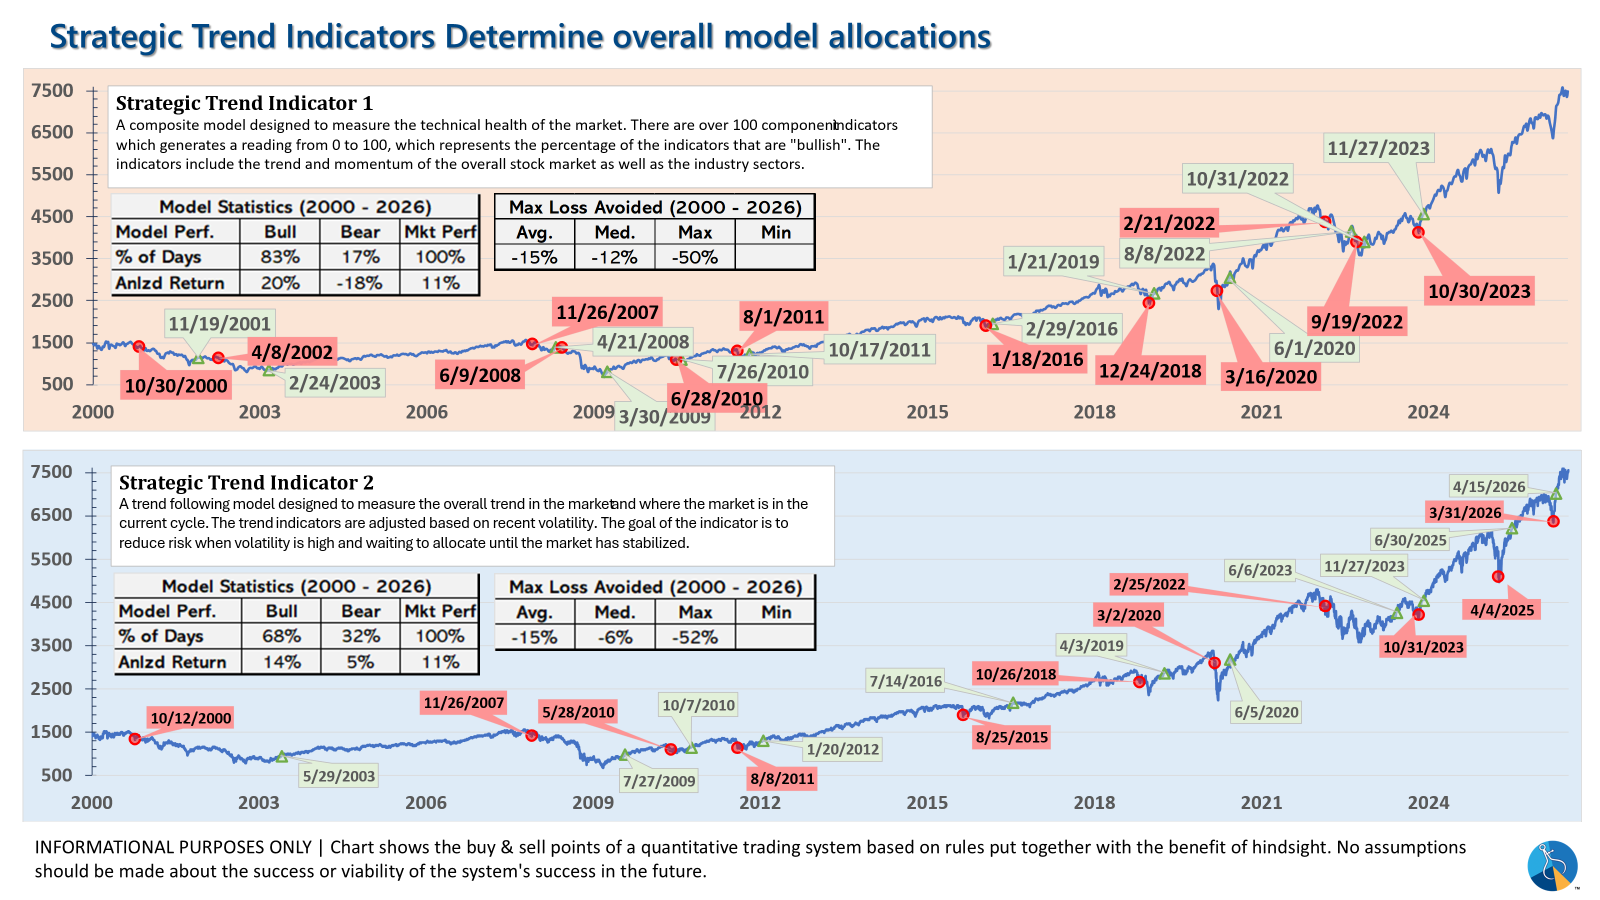
- Strategic = BULLISH (4/15/2026) | V-Bottom projecting "end" of Iran War
Tactical (daily):
- Monitored DAILY
- Models: Tactical Bond, Cornerstone Bond, Income Allocator, Tax Advantaged Bond
- Designed to follow the trends for use in our lower risk models
- BUY Signal issued April 8, 2026 (exiting the sell from March 13)
Dynamic (monthly):
- Monitored MONTHLY
- Models: All "Dynamic" Models (Income, Balanced, Growth, and Asset Allocator)
- Uses SEM's Quantitative Economic Model
- Designed to overweight riskier assets if economic trend is higher & underweight those assets if economic trend is lower.
- NEUTRAL signal issued February 15, 2026 (following BEARISH signal from July 2025)
Strategic (quarterly)*:
- Monitored QUARTERLY
- Models: AmeriGuard (Balanced, Moderate, & Growth) and Cornerstone (Balanced & Growth)
- Core Component: Quantitative Filter using 4 different time horizons across universe of asset classes
- Trend Indicator: Two different Quantitative Systems monitoring the intermediate-term trend, health of the market, and volatility
- CORE has been overweight small cap and international since October 2025 – overweight increased slightly in January
- Both TREND INDICATORS are BULLISH following 10% drop and "V-Bottom" reversal in early April
- AmeriGuard & Cornerstone Max DO NOT use the Trend indicator and are always 100% invested in stocks using our CORE rotation model.
The core rotation is adjusted quarterly. This quarter we saw half of our international positions reduced (we sold developed markets and kept our emerging markets exposure). We also saw the remaining share of mid-cap reduced in favor of more small cap exposure. We remain with a "barbell" core portfolio – about half in large cap and half in small cap as the models expect the market to "broaden".
The * in quarterly is for the trend models. These models are watched daily but they trade infrequently based on readings of where each believe we are in the cycle. The trend systems can be susceptible to "whipsaws" as we saw with the recent sell and buy signals at the end of October and November. The goal of the systems is to miss major downturns in the market. Risks are high when the market has been stampeding higher as it has for most of 2023. This means sometimes selling too soon. As we saw with the recent trade, the systems can quickly reverse if they are wrong.
Overall, this is how our various models stack up based on the last allocation change:
Curious if your current investment allocation aligns with your overall objectives and risk tolerance?