When we started Monday Morning Musings during COVID, the idea was simple: a quick rundown of everything on my mind during a busy time, usually a sentence or two and a chart. I was away from the office at a conference last week, so I am also playing catch-up on everything that happened. This feels like one of those weeks where there is too much to talk about (AI, bonds, oil, housing, private credit and a Fed meeting on deck), so I'm going back to the original format this week. Each item could be a post by itself, but this week we'll hit just the highlights.
1.) Tech sold off. Most of the market didn't.
Thursday looked ugly on the headlines (the Nasdaq fell 2.6%, its worst day since June, and the semiconductor index fell almost 7%), but under the surface it was a rotation, not a crash. The "average" stock in the S&P 500 (the equal-weighted version) actually was UP on the day, more stocks went up than down on the NYSE, and 6 of the 11 sectors finished higher.
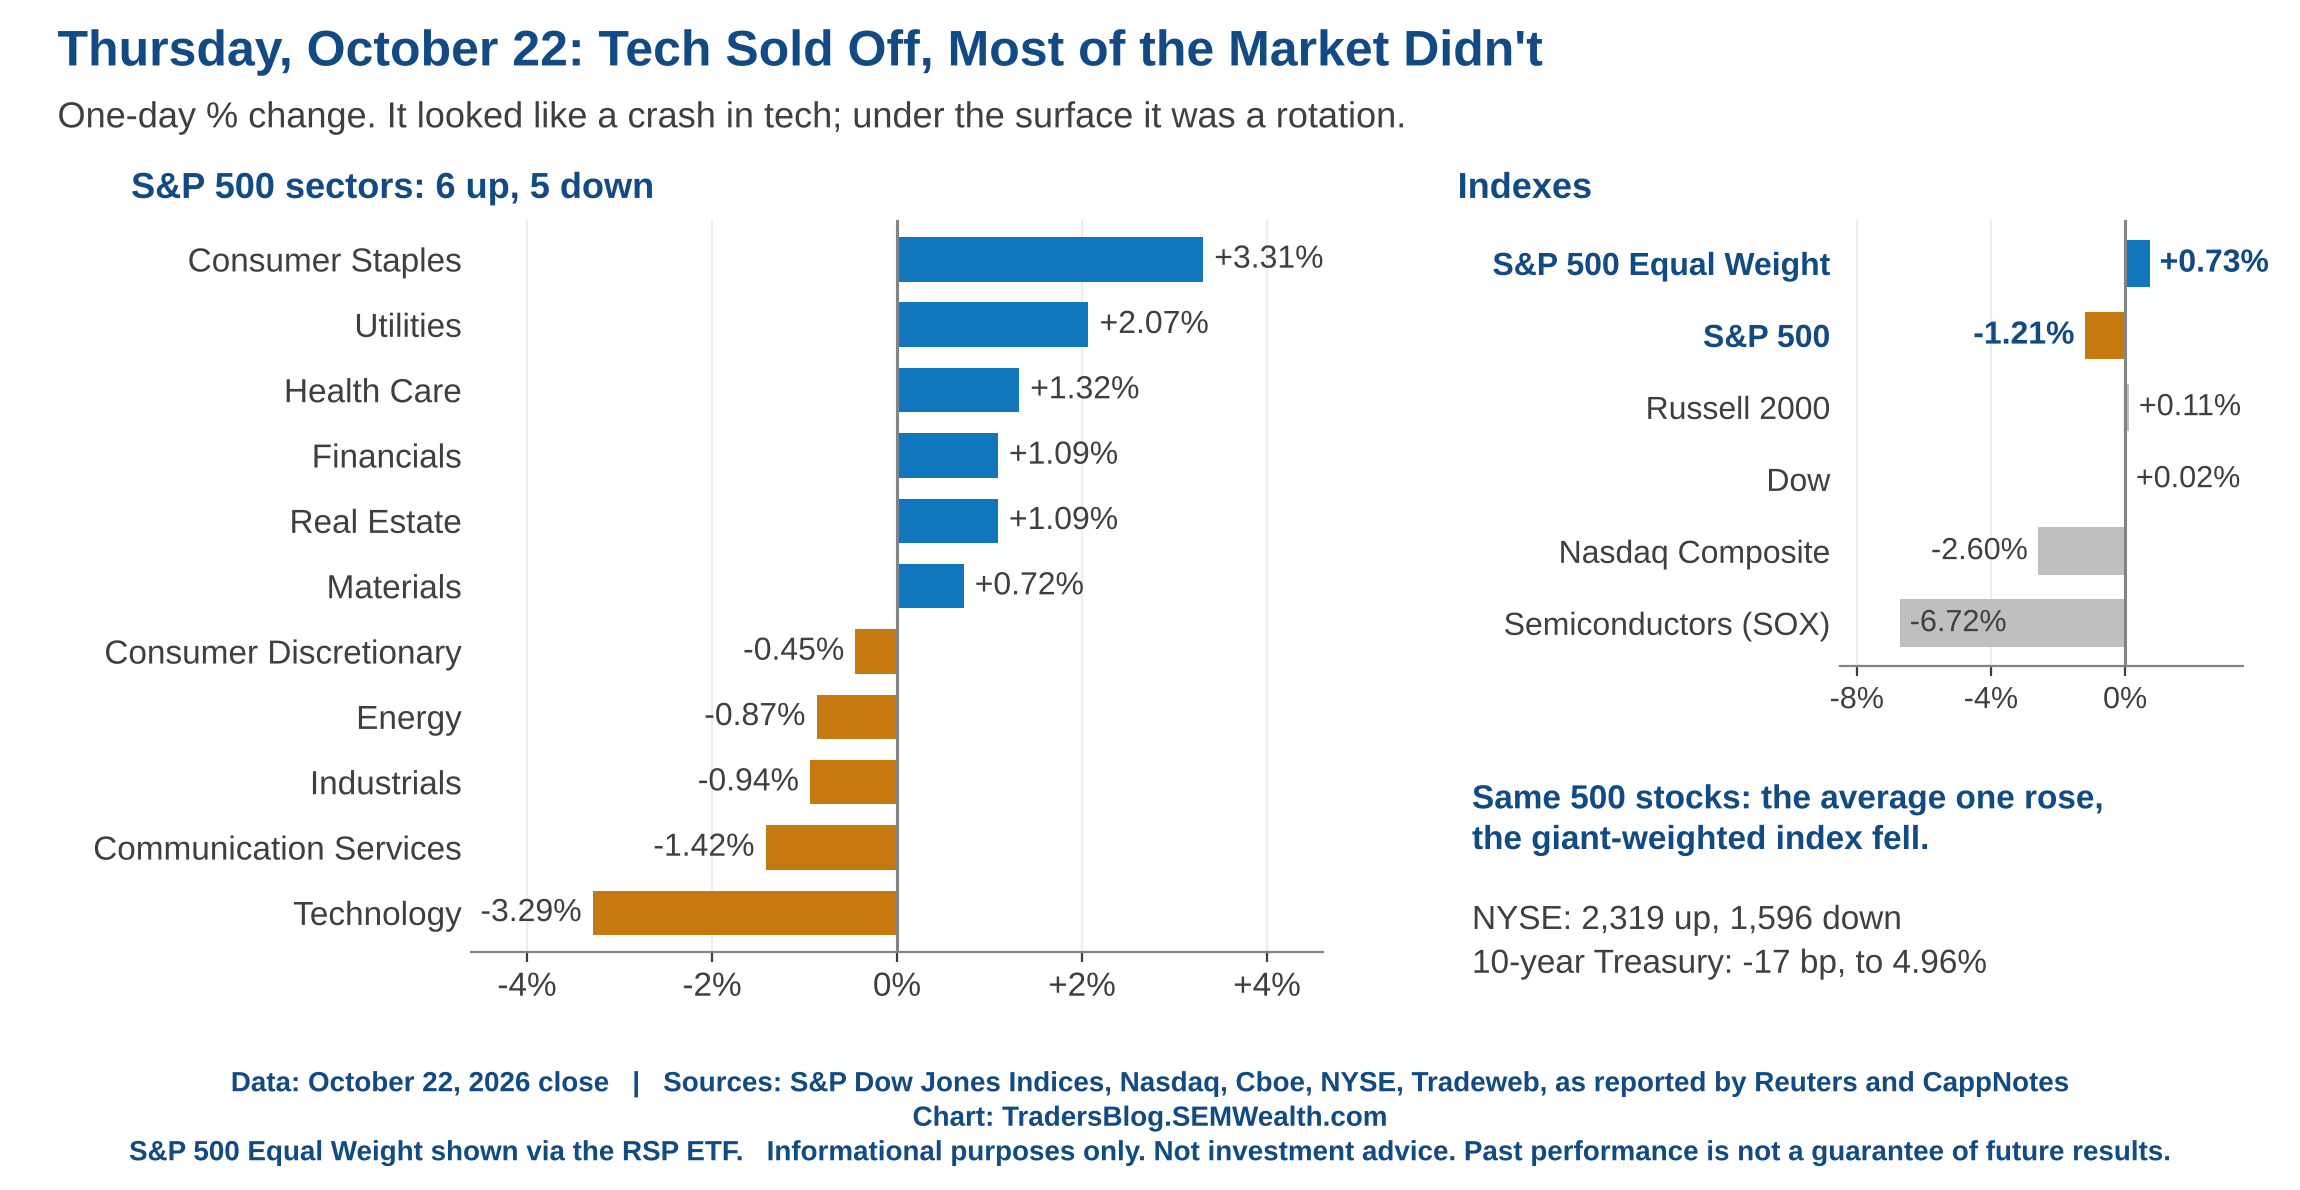
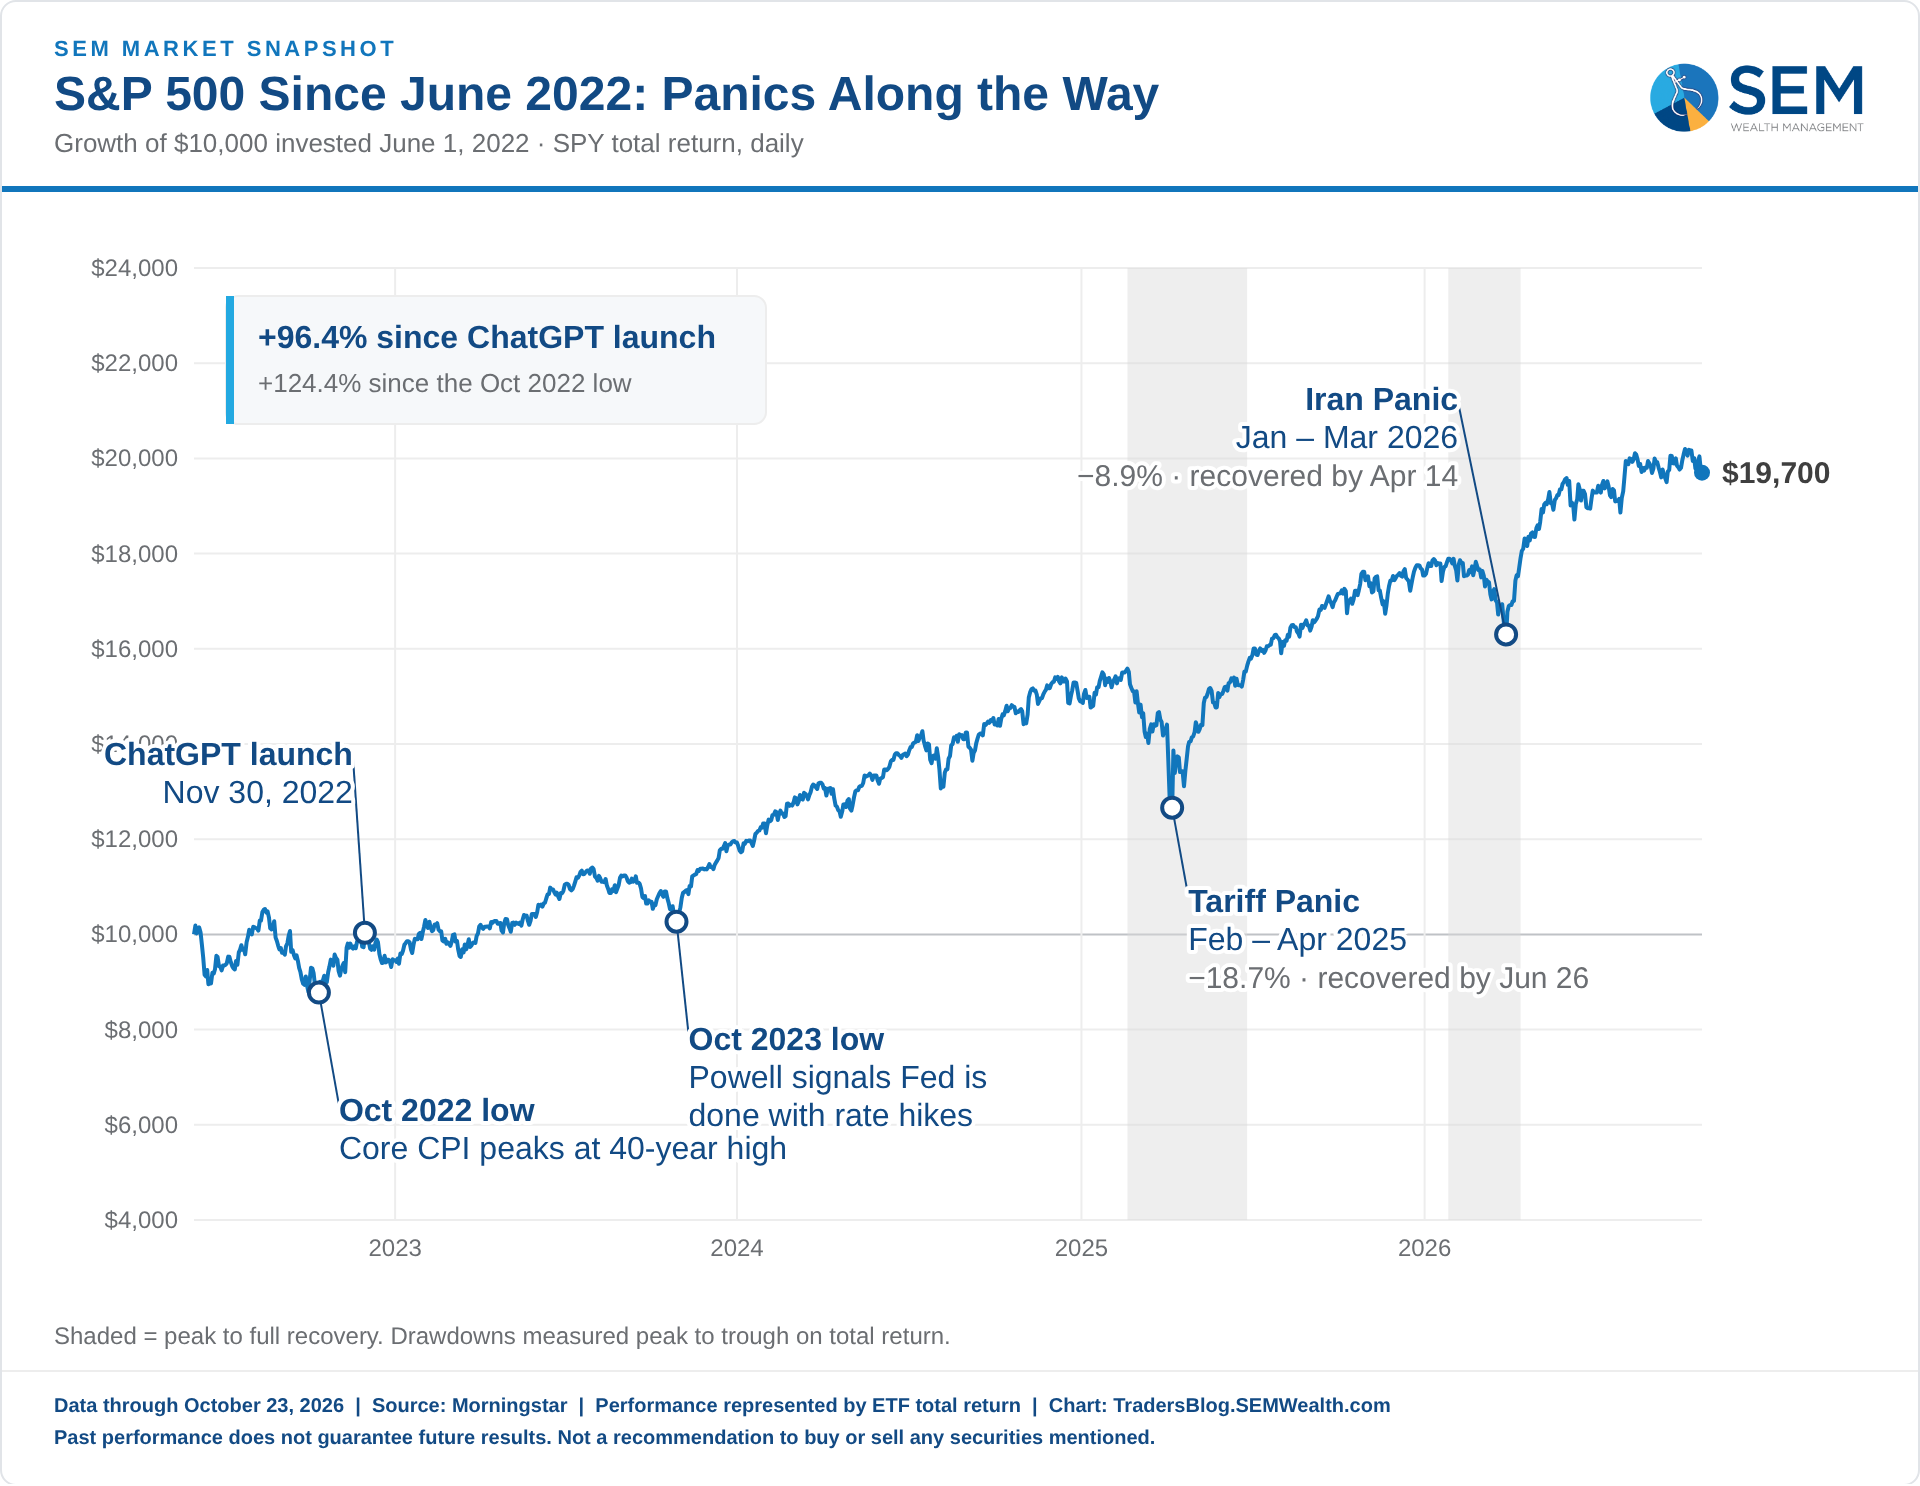
For the week, the S&P 500 fell about half a percent, the Dow rose slightly, and small caps gained about 2%.
(Side note: according to Goldman Sachs (via Reuters) hedge funds had their worst day since COVID on Thursday, with all three major strategy types losing more than 1%. When this many people own the same stocks with borrowed money, the selling feeds on itself.)
2.) Meta spent more than it brought in
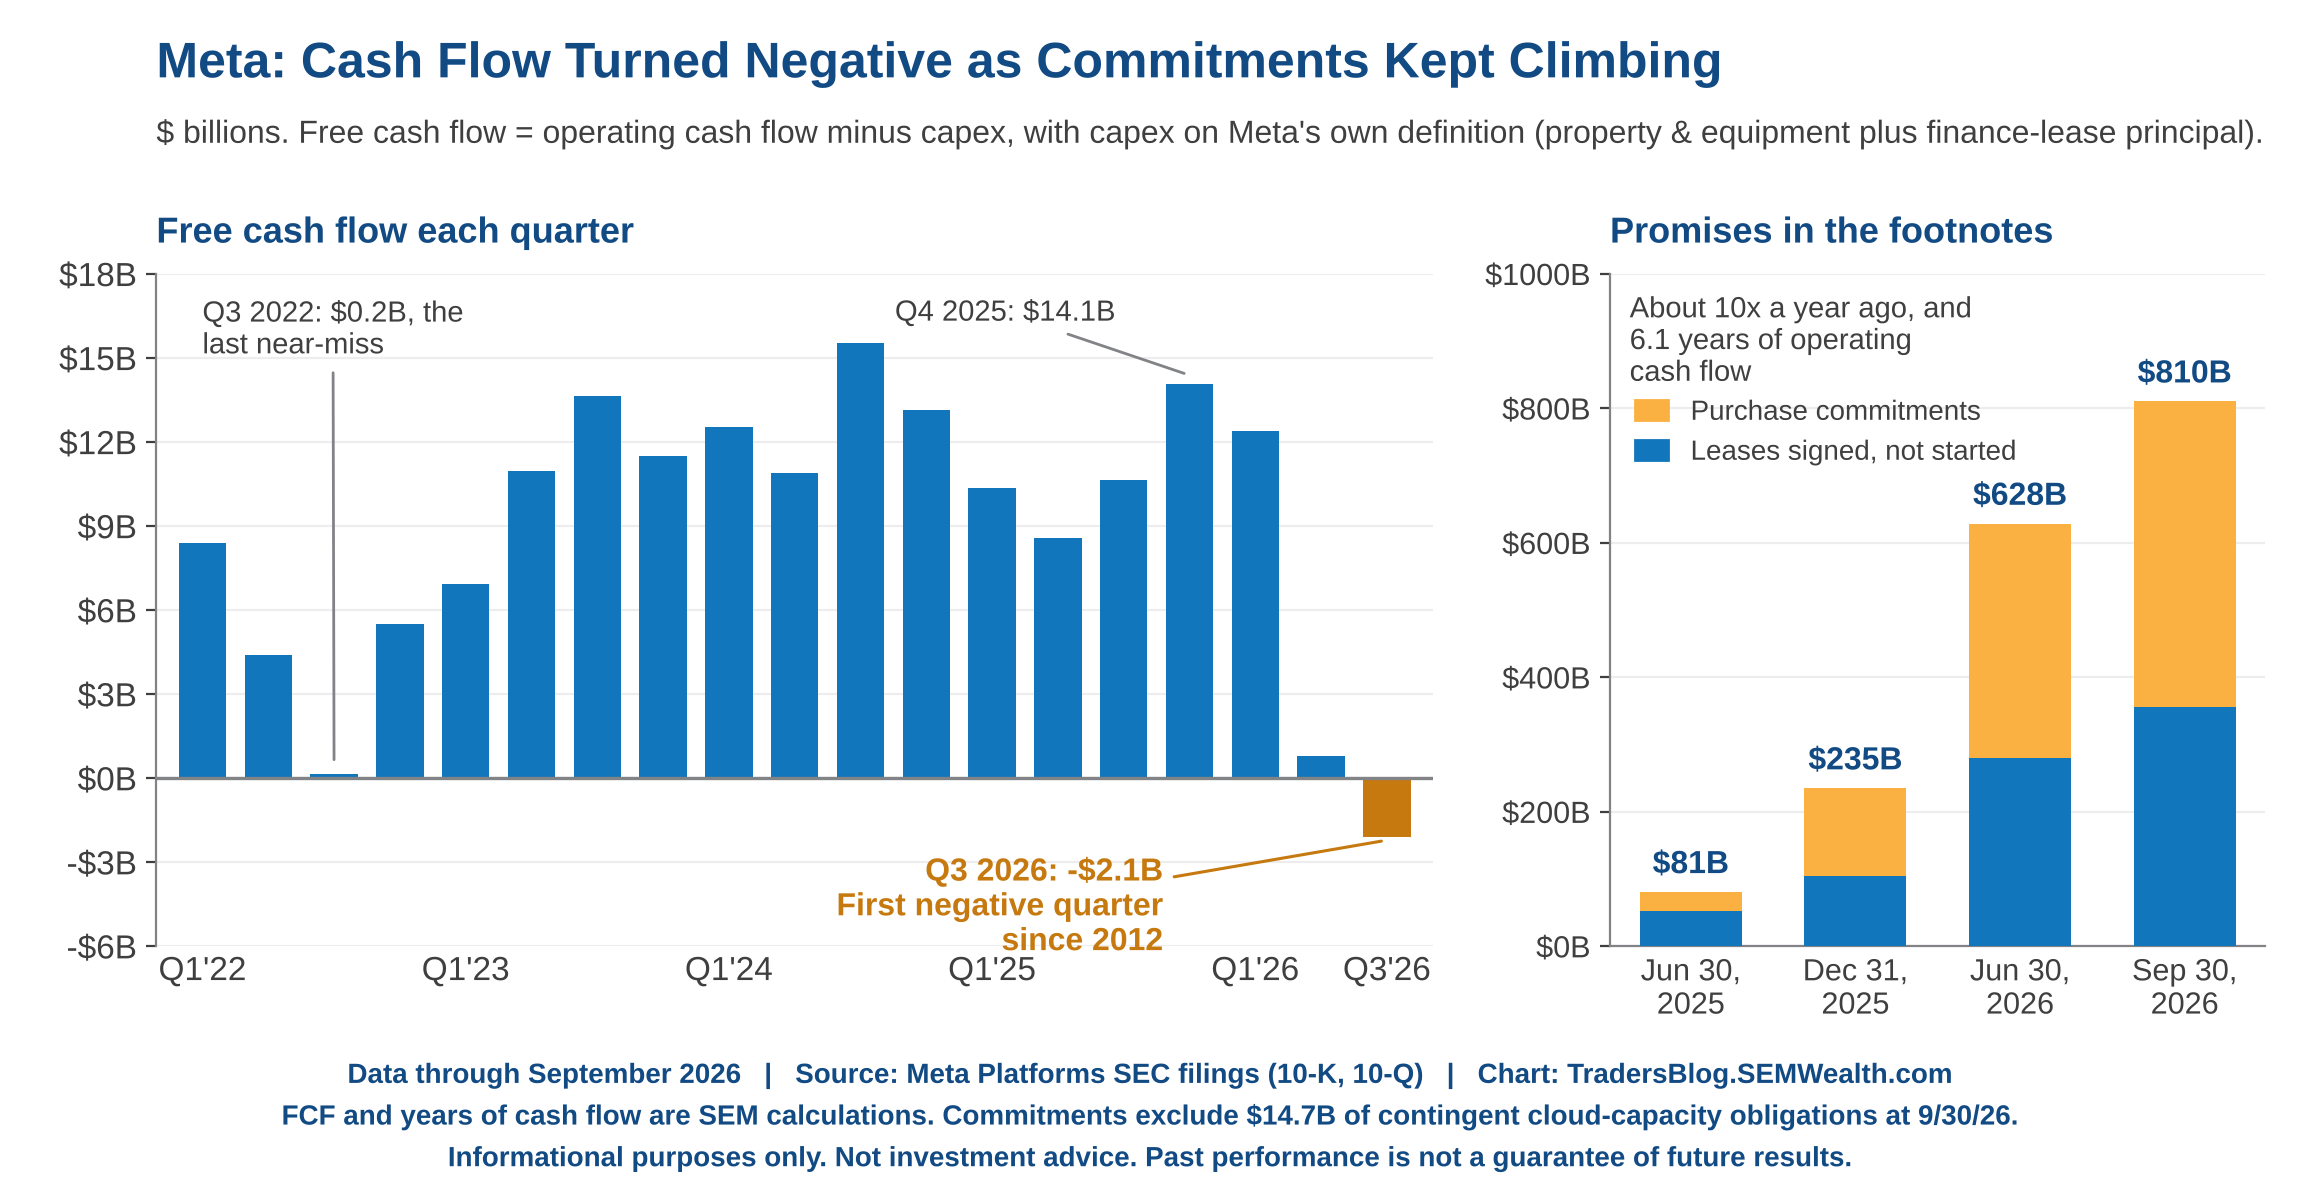
Meta beat on revenue, but for the first time since 2012 it spent more on capital expenditures than it brought in from operations (free cash flow of about -$2 billion). Its footnote commitments (leases signed but not yet started plus purchases it can't cancel) jumped to about $810 billion, nearly 10 times what they were a year ago and about 6 years of operating cash flow.
Meta also announced a new class of non-voting stock (issued as a one-time stock dividend in January, so it works like a 2-for-1 split), which gives it a way to sell shares in the future without giving up control (because the shares received are a NEW share class with no voting rights). That is NOT a stock sale yet, but it's another sign the biggest spenders are lining up outside money, something I've said historically happens late in a cycle.
What really got the market's attention was WHY. In the proxy filing for the new shares, Meta's board committee pointed to "an increasingly challenging environment for raising capital," named Alphabet, SpaceX, Anthropic and OpenAI as companies raising money "to fund the same AI growth," and said it would be prudent to raise funds "before even more companies have absorbed available capital in the market." In other words, one of the richest companies in the world is worried about getting to the front of the line before the money runs out. That (plus a record high cost to insure Meta's debt) is a big reason Thursday was so ugly.
To be fair to Meta, it fell to nearly zero free cash flow in 2022 and bounced right back the next quarter. We'll update the AI Buildout Dashboard after the other three report this week (our first quarterly read is planned for the 11/2 blog).
3.) Who pays for the neoclouds?
The quote of the week came from Nvidia CEO Jensen Huang, who said demand from the "neoclouds" (the companies that rent AI computing power, like CoreWeave) is "off the charts," but they don't have the capital to keep growing. That's the vendor-financing loop I've been writing about since the summer, and now confirmed out loud by the vendor. Gartner put a number on the risk last week, estimating more than 80% of neoclouds won't be operating independently by 2030.
So what happens if one fails? That's why we built the AI Network Stress Test. Click on CoreWeave and the damage is pretty limited (one knock-on failure, and some 'minor' losses). The one I'd continue to watch is Oracle as that more than triples the economic damage AND it starts hitting some of the largest annuity issuers with some losses. (The real one to watch in terms of private credit/annuity exposure is SpaceX).
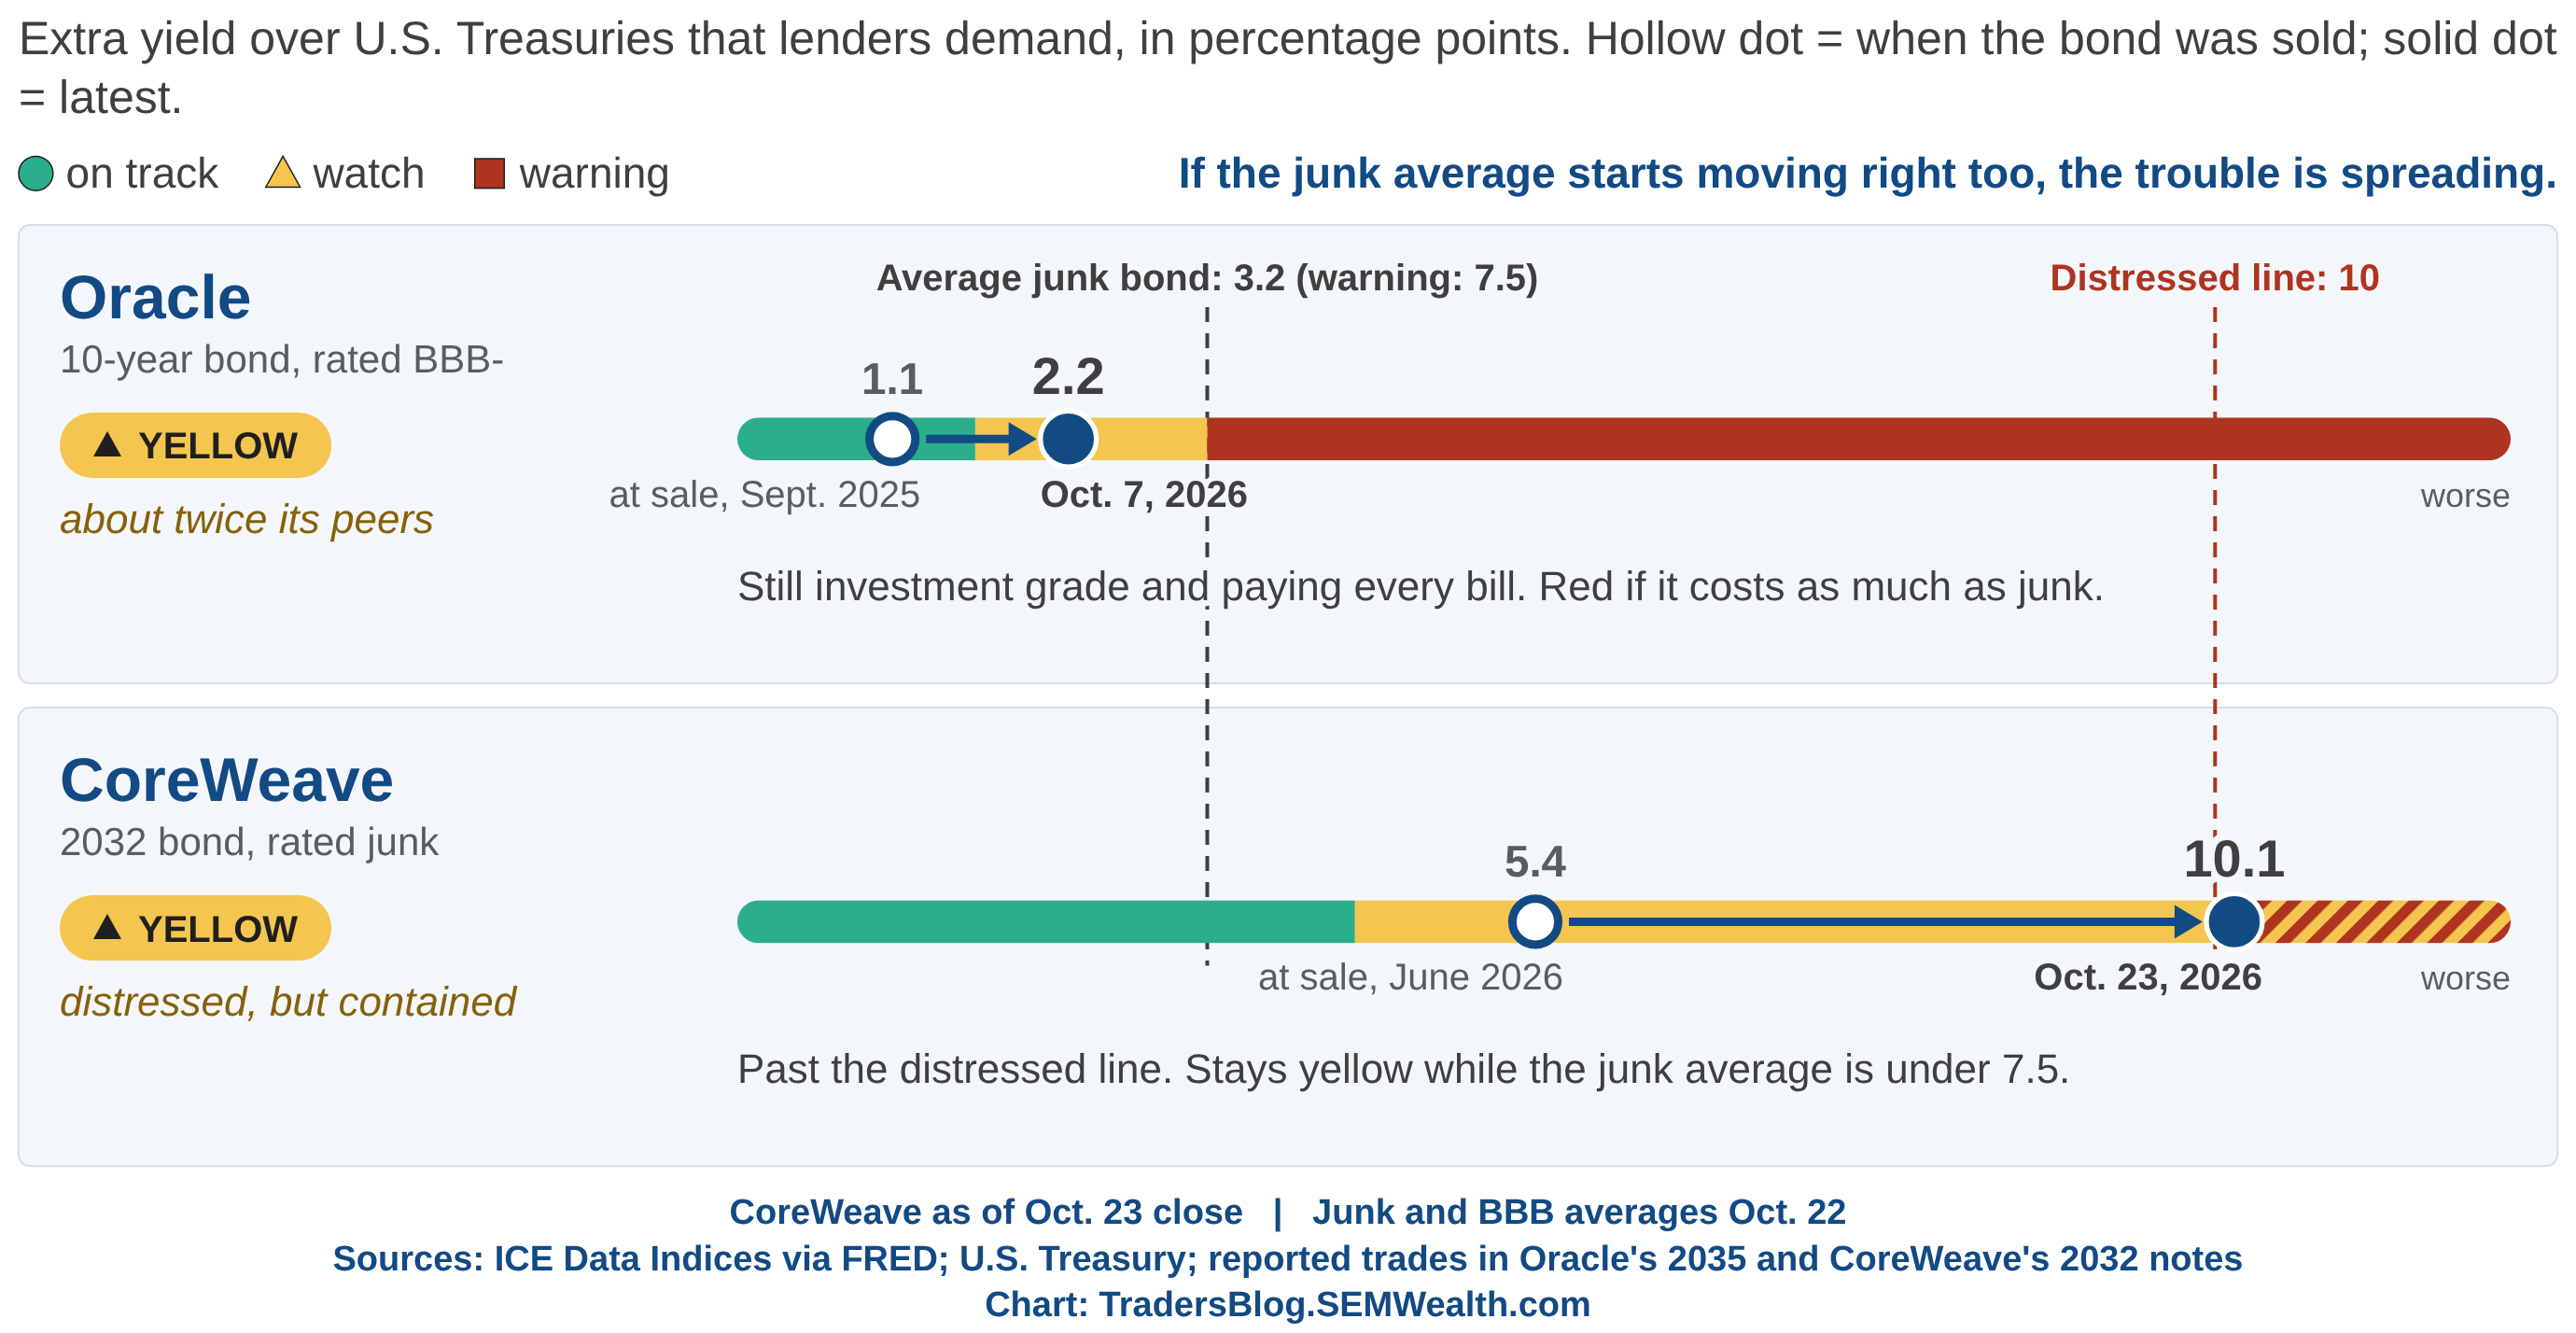
CoreWeave's 2032 bonds closed Friday just under 80 cents on the dollar, about a 15% yield and 10.1 percentage points over Treasuries, which puts them back past the "distressed" line (they briefly crossed it the week before, as I wrote last Monday). Under our dashboard rules it stays yellow ("distressed, but contained") because the average junk bond hasn't followed (3.2 points against a warning level of 7.5). Unlike the week before, most of this week's move came from the bond itself (lenders demanding more), not from Treasury yields falling.
4.) The gap is the bet
Gartner also estimated that the AI data centers being built need about $8.5 trillion in revenue by 2030 to earn a reasonable return, against at most $3.6 trillion they can actually claim. That's a different way of measuring the same thing I've been showing in my presentations, which led to a fun 90+ minute discussion at our booth last week:
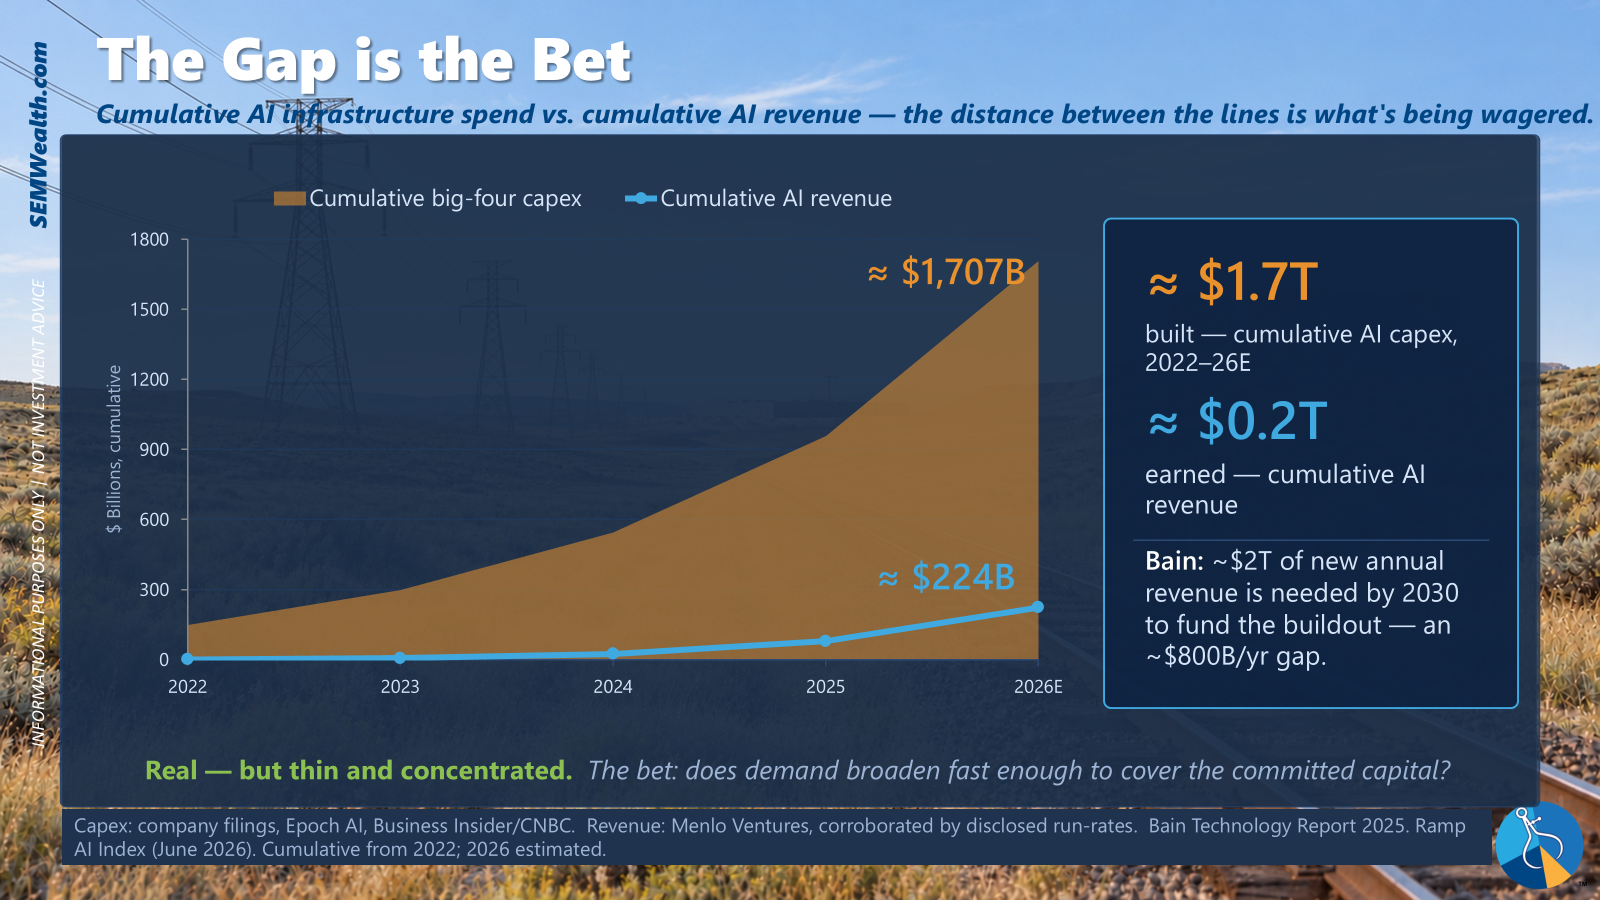
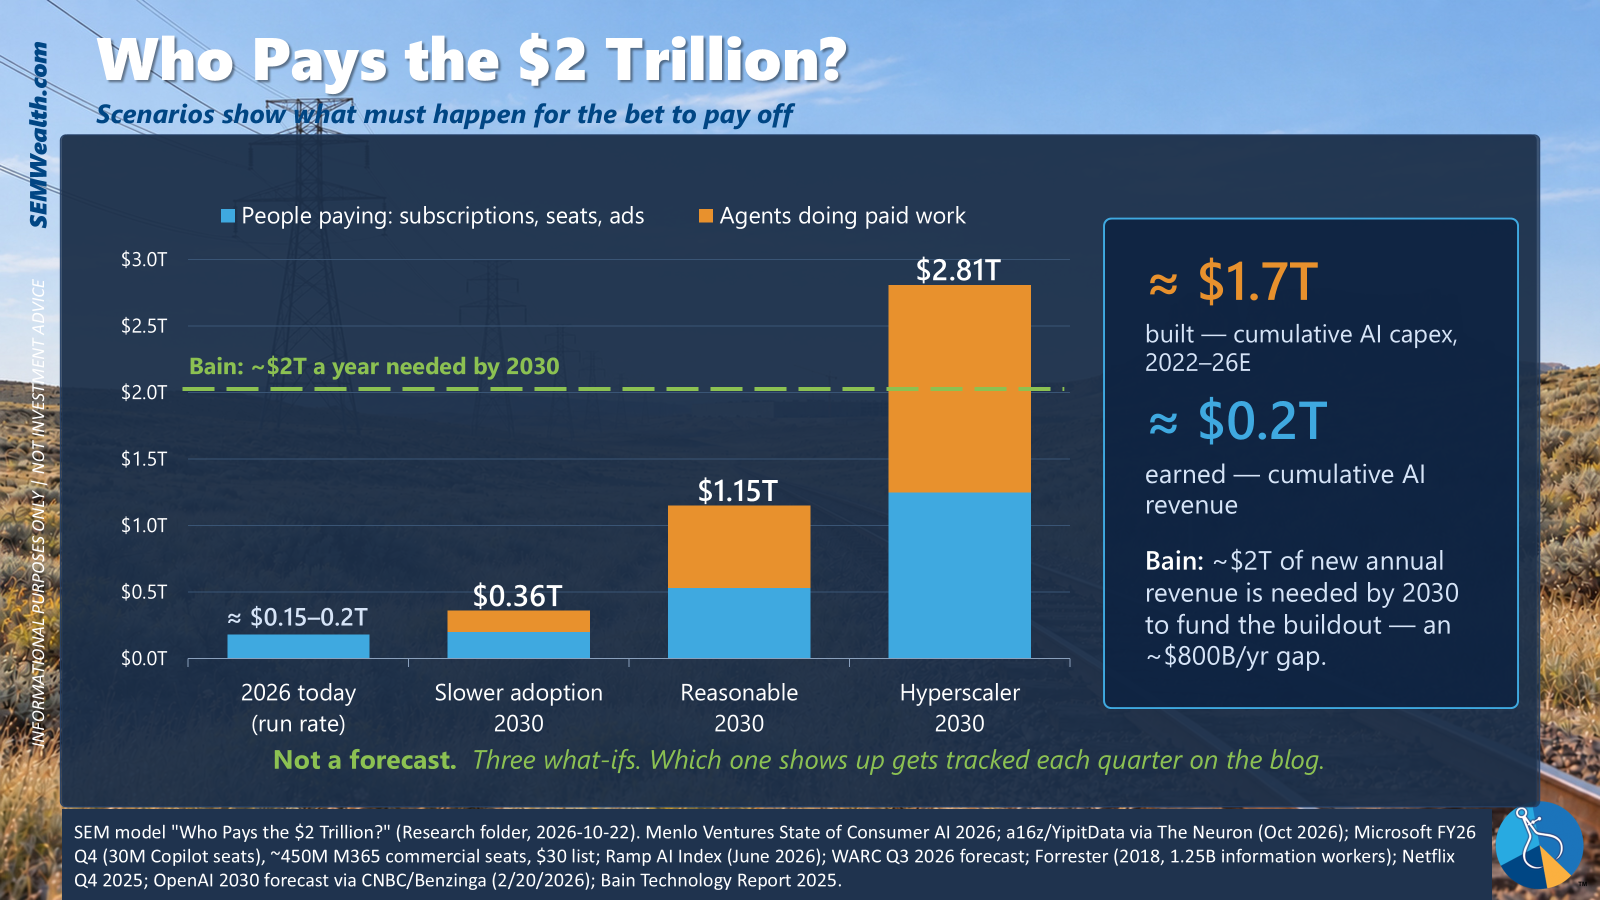
The revenue is most certainly real and it took off this year (the two biggest AI model companies alone are running well over $100 billion a year), but about $1.7 trillion has been built so far against about $0.2 trillion earned. The bet is whether demand broadens fast enough to cover the capital (and how quickly it does so.)
5.) Bonds did their job
On Thursday, while tech was selling off, the 10-year Treasury yield fell 0.17% to 4.96%, its biggest one-day drop in over two years. For the week it finished right at 5.00%, down from 5.09%. This is what bonds are supposed to do when stocks get scared (gold and bitcoin both FELL on Thursday, again).
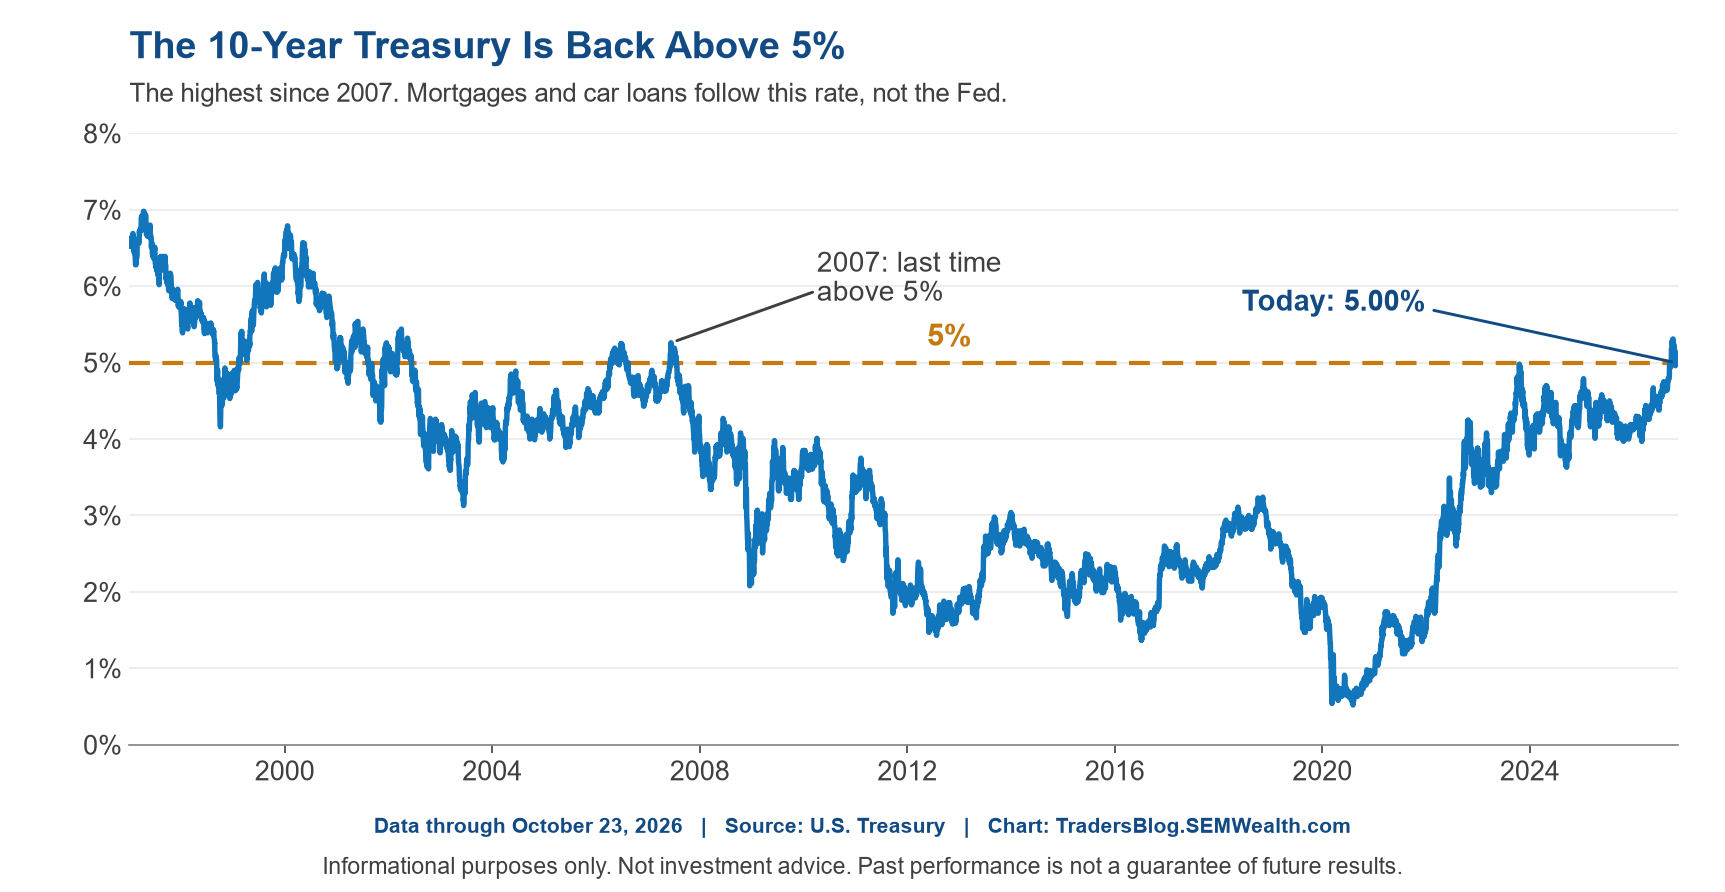
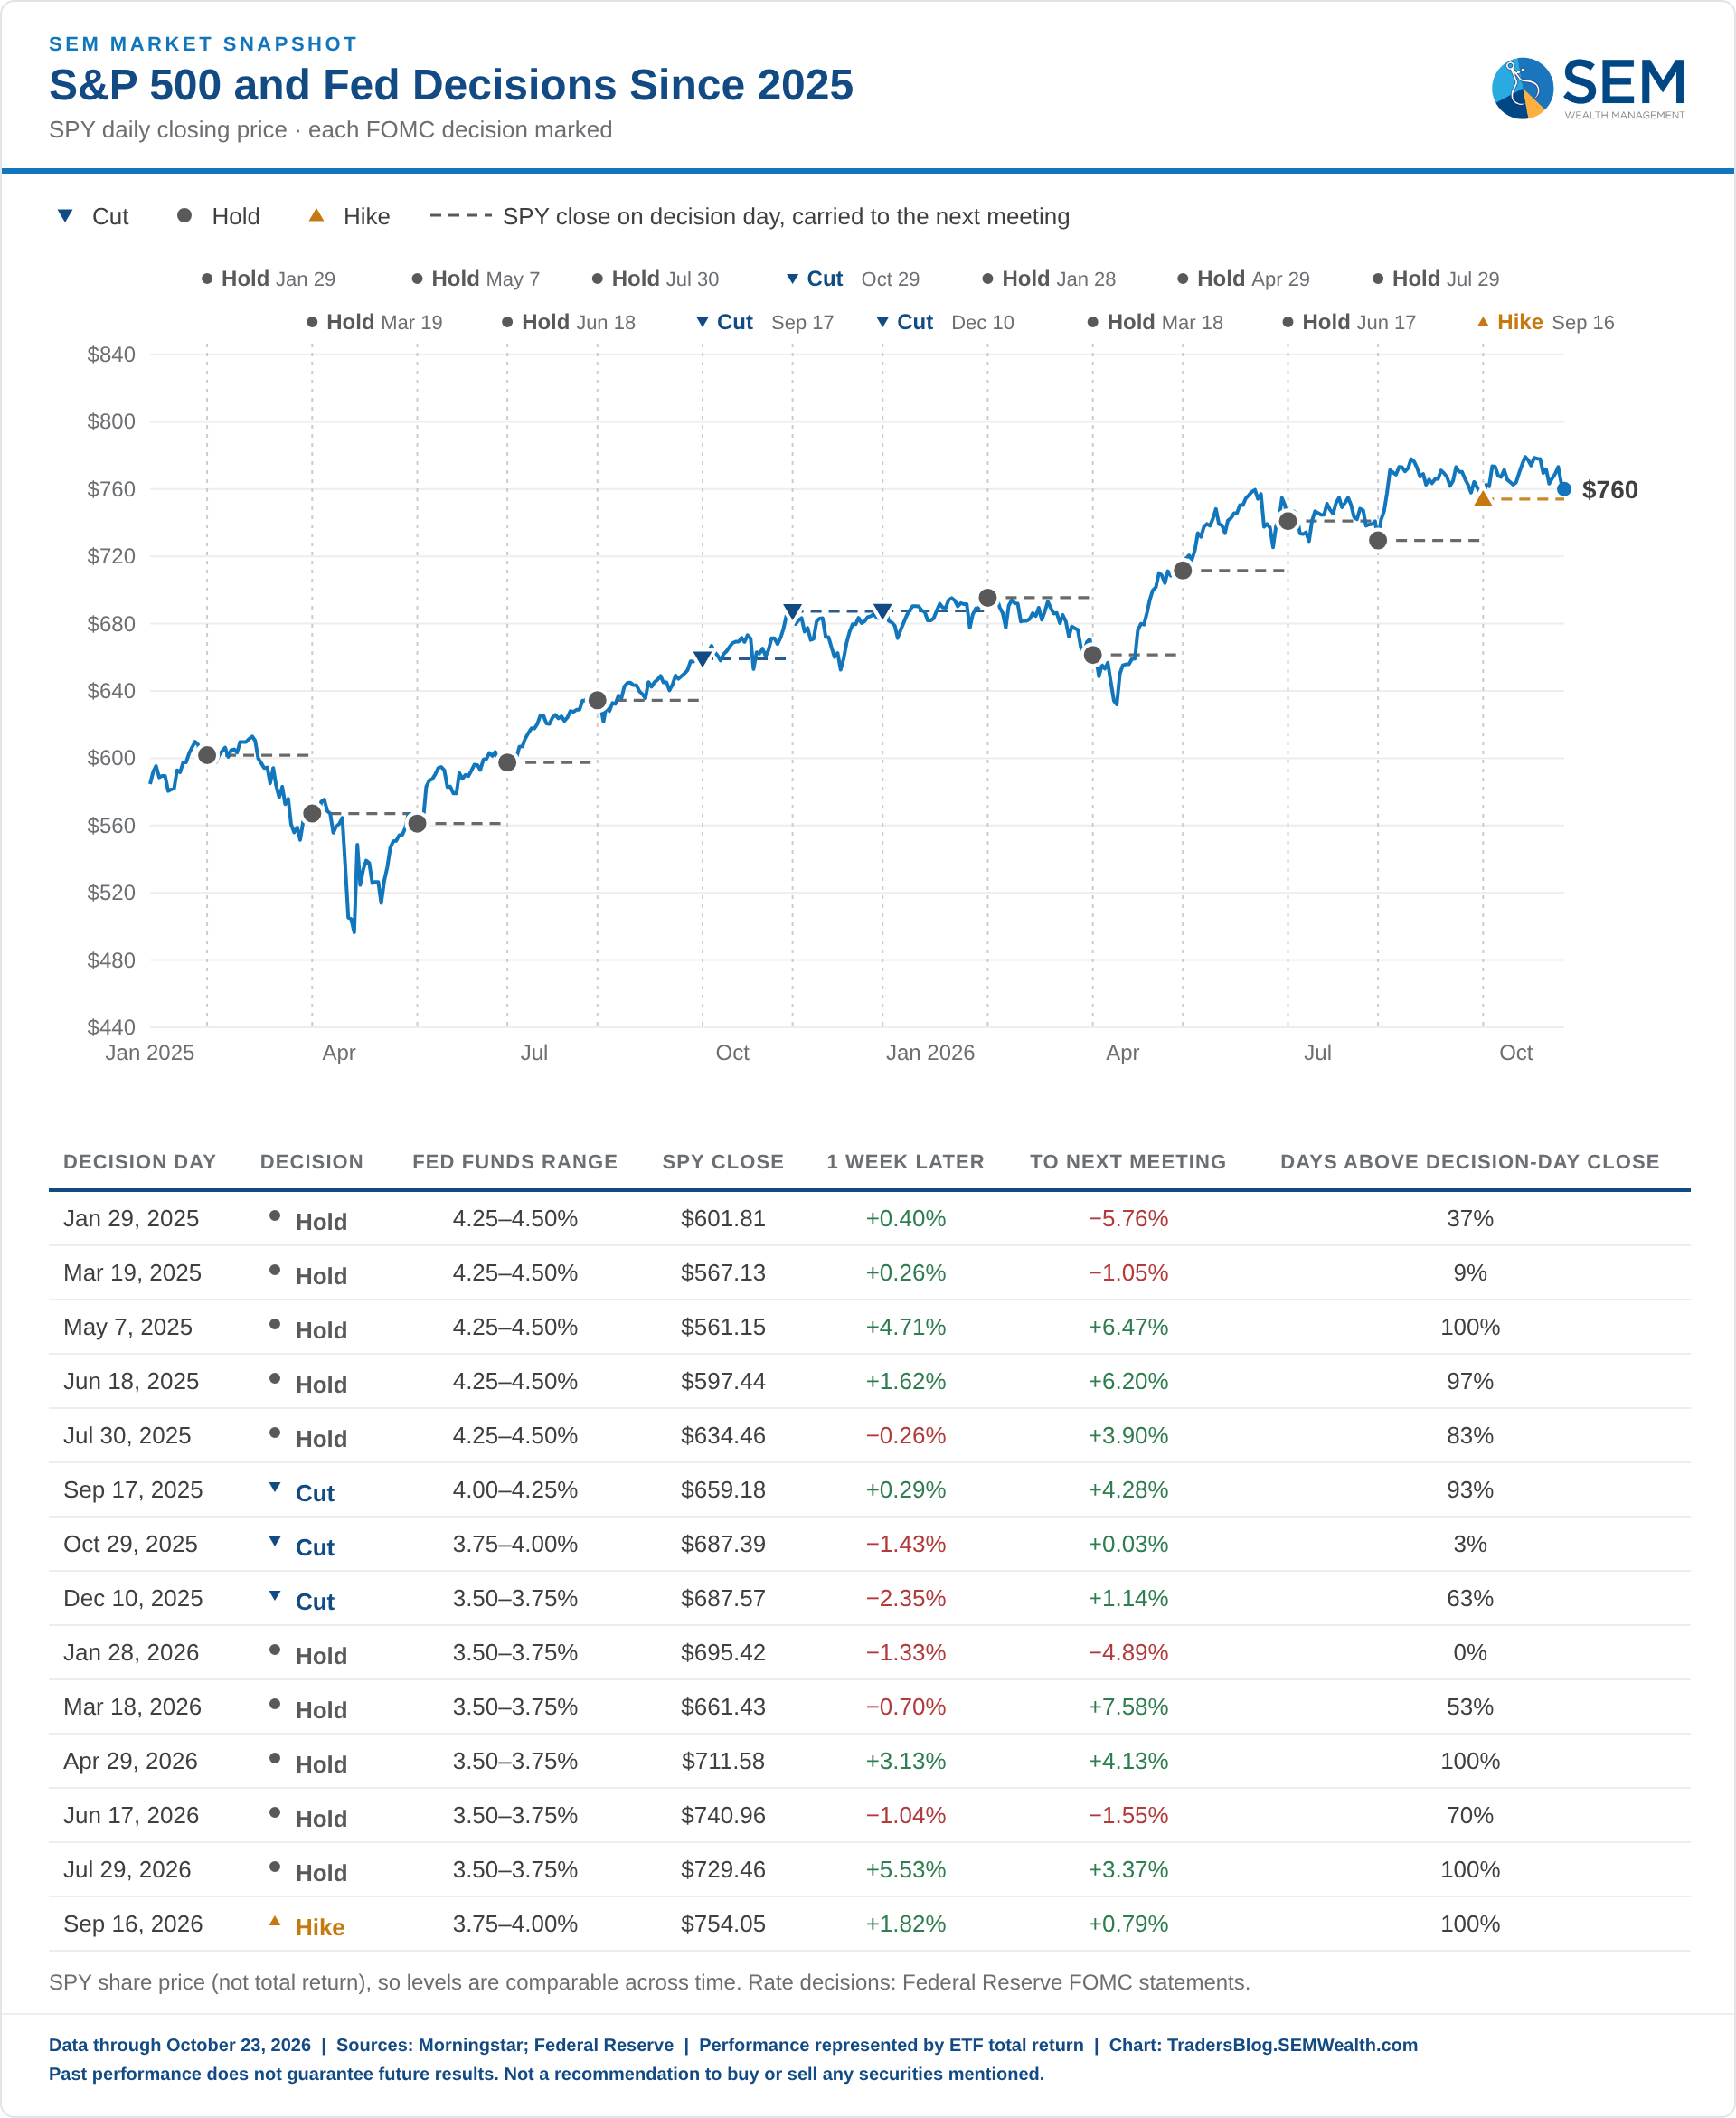
Before anyone asks: no, this is not my "the Fed gets serious and long-term rates fall" call coming true. Short-term rates fell just as much as long-term rates on Thursday, which tells me this was money looking for safety, not the bond market cheering the Fed. As I said last week, we'll grade that one after this Wednesday's meeting.
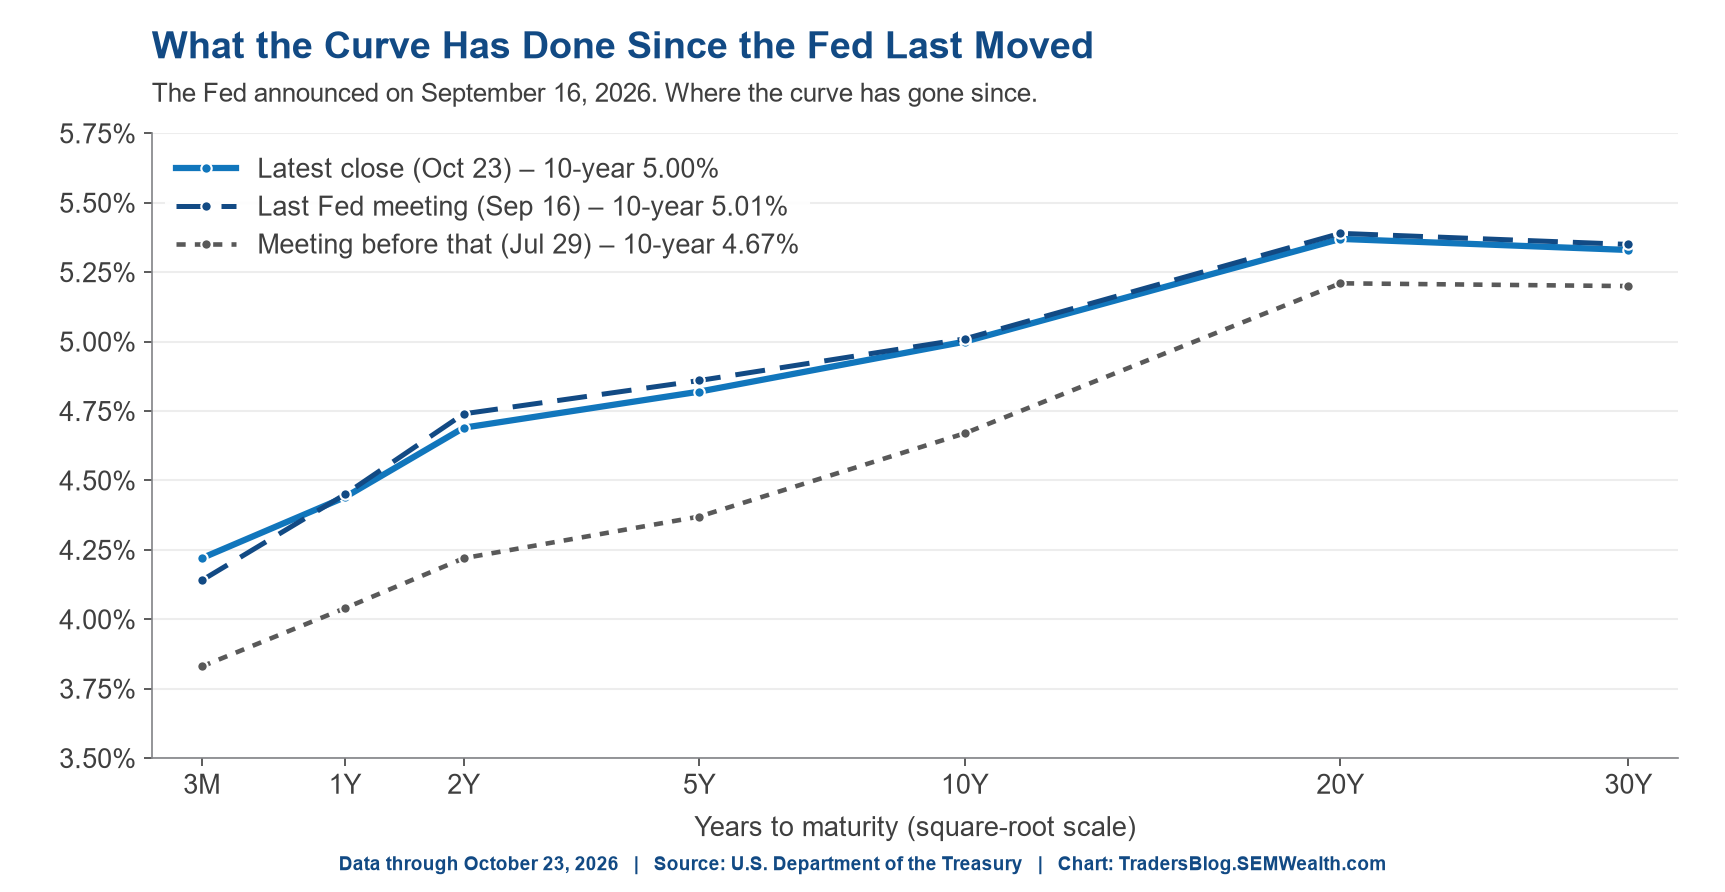
6.) The Fed meets Wednesday
The market expects no change this week. The odds of a rate HIKE by the December meeting fell from about 95% to about 87% after Thursday's bond rally (Atlanta Fed Market Probability Tracker, which is built from interest rate futures and options, not a betting site), but that's still a very high number.
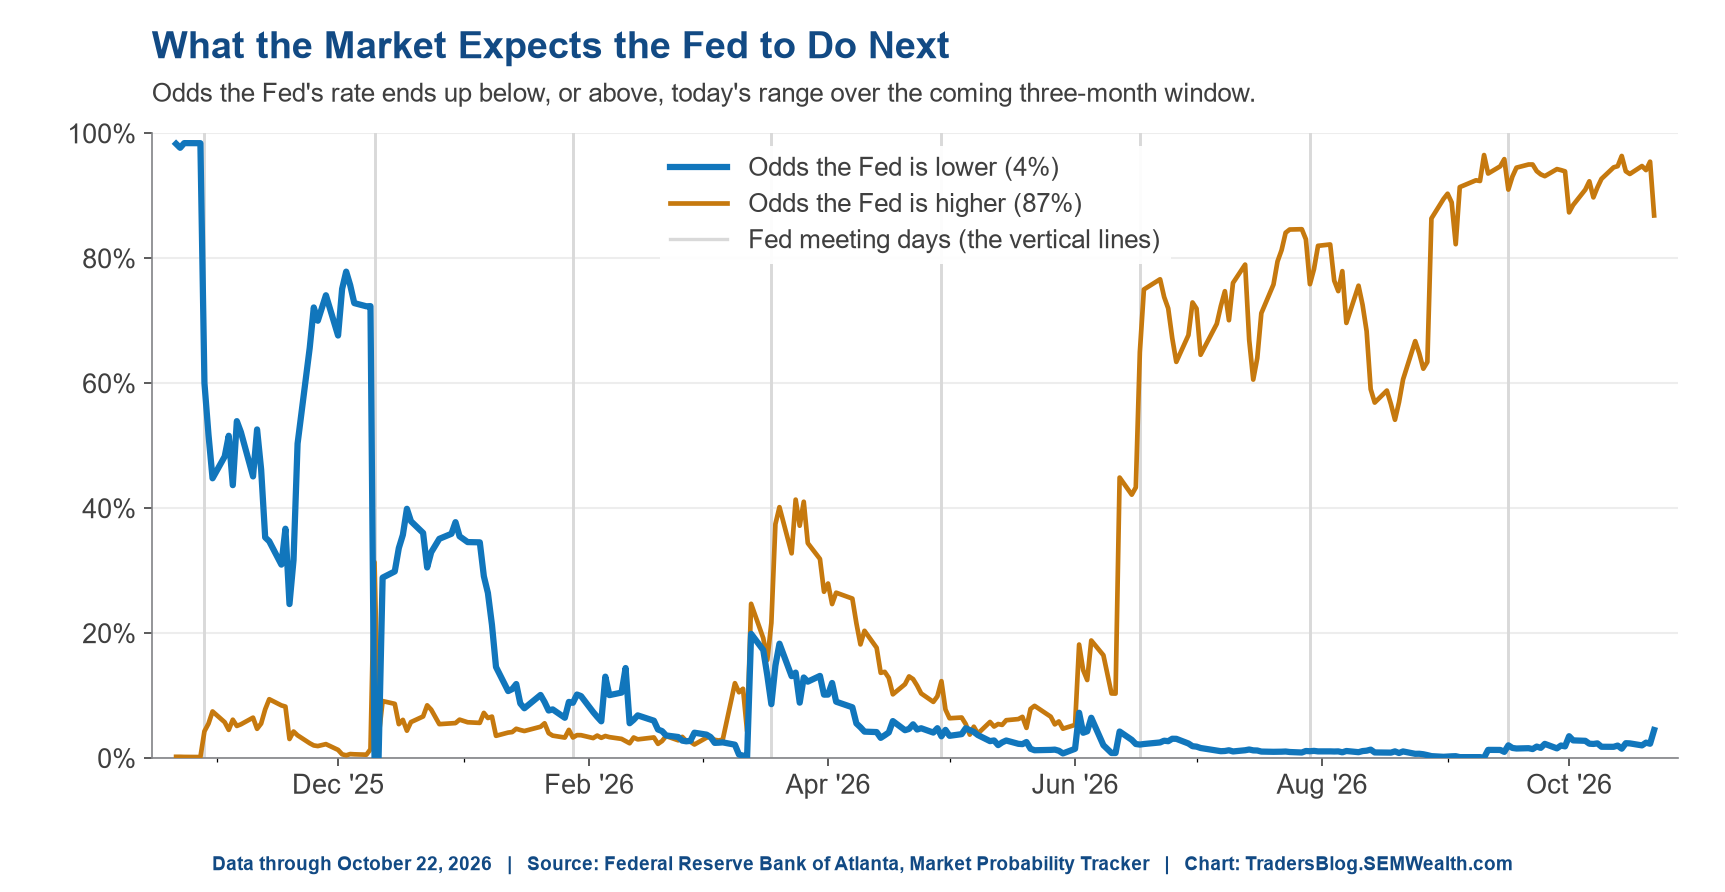
7.) Private credit: no panic, still bleeding
Private credit is one area I'd expect to show stress first, since those loans aren't priced every day, so the publicly traded business development companies (BDCs) and the firms that run them are the best read we have. On Thursday every one of them ROSE. But zoom out and the BDC index is down more than 7% in October, three BDCs have cut their dividends, and the big private credit managers are down 20-33% this year, while the S&P 500 is up 12%.
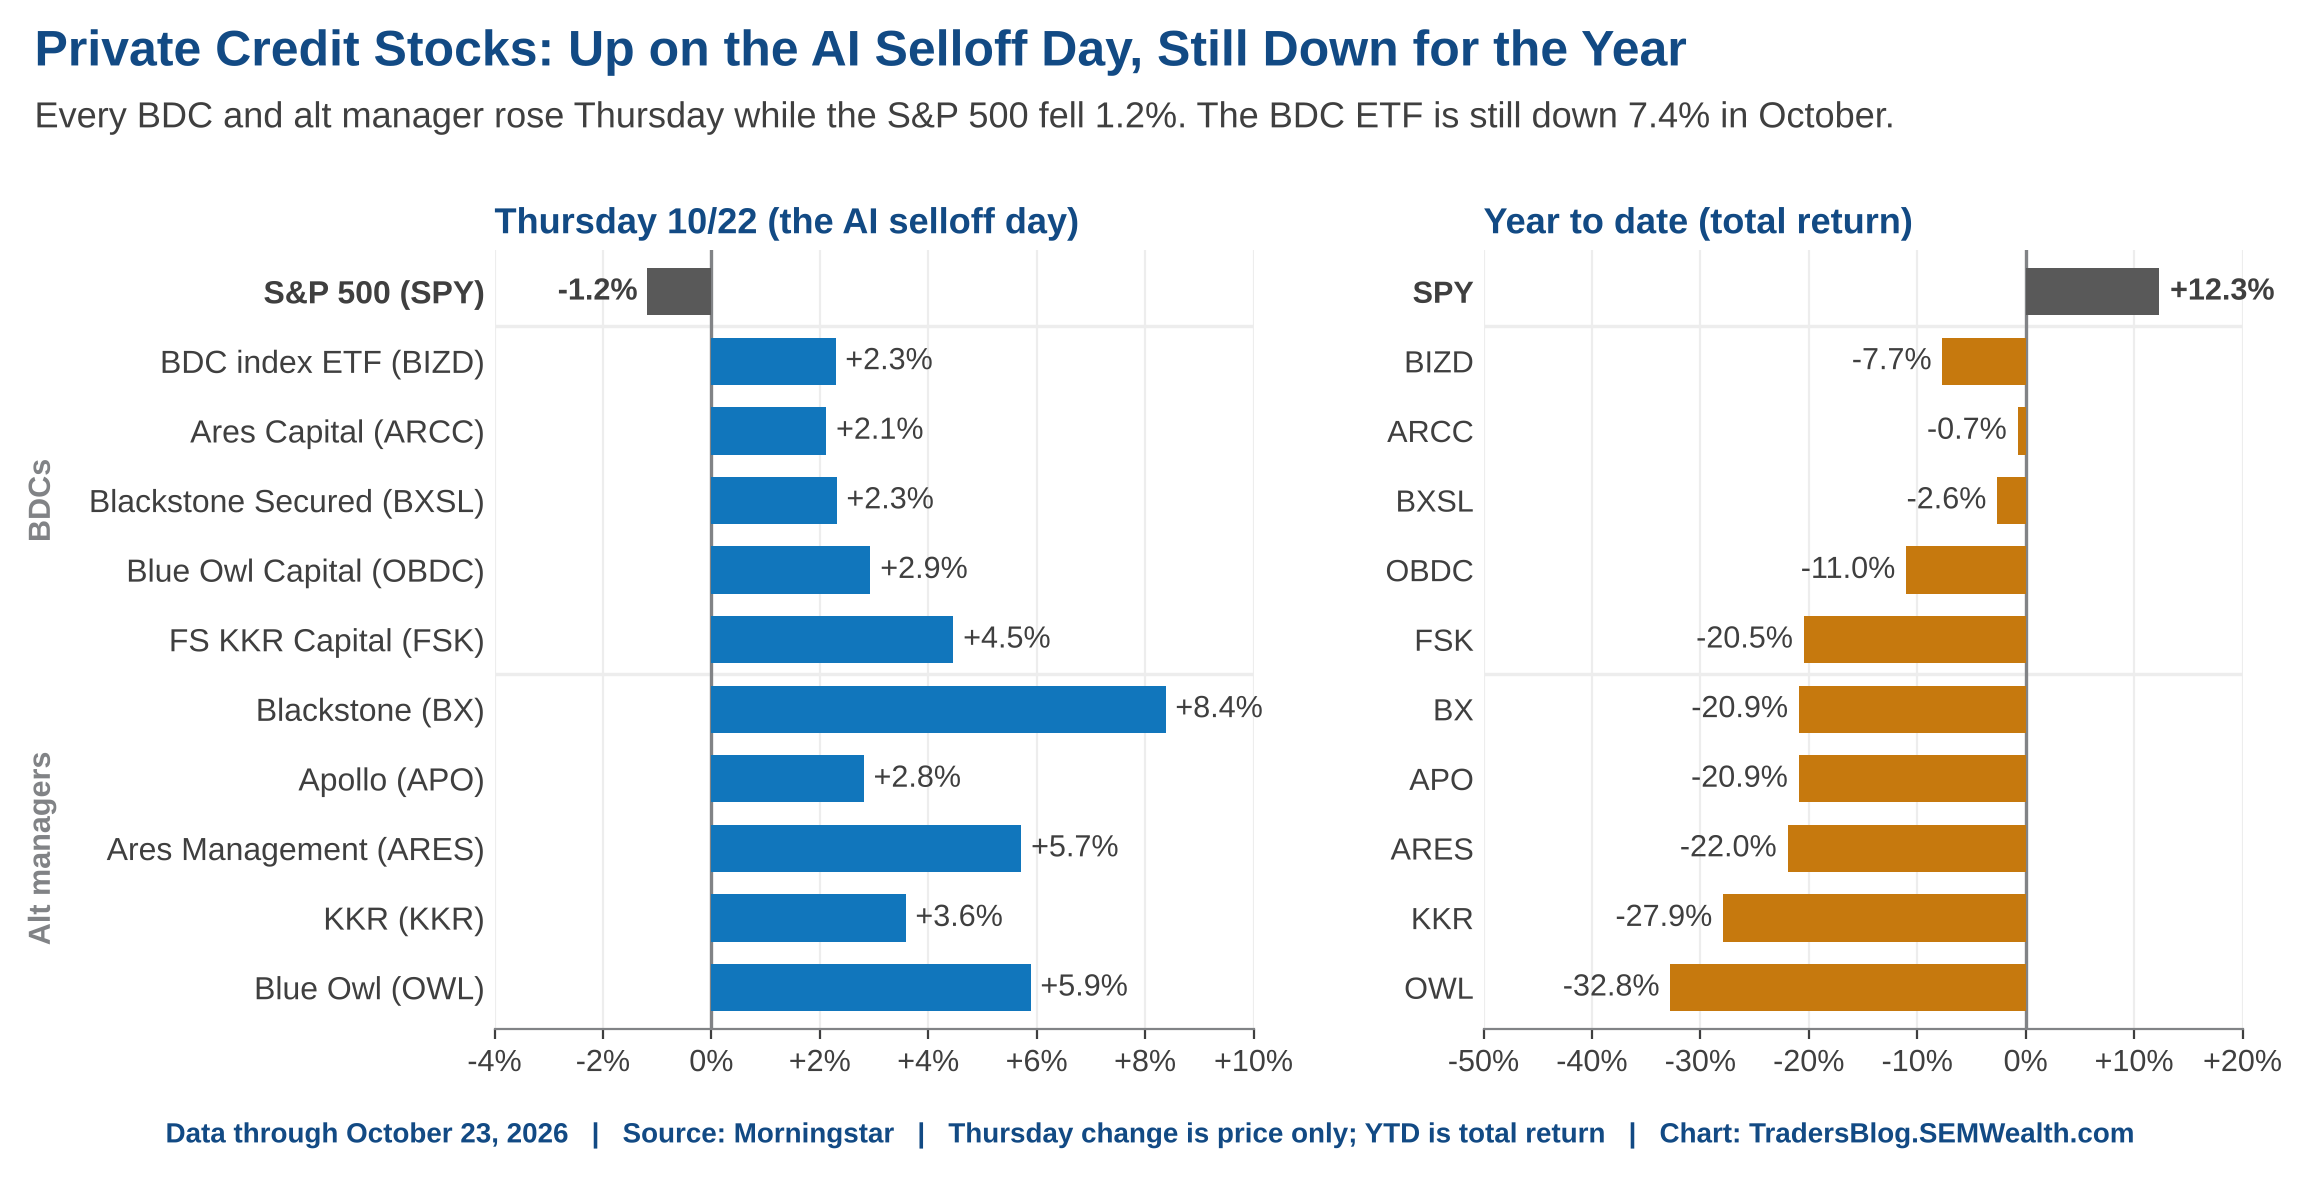
It's still the "fire in one room of the house." It hasn't spread, but it hasn't gone out either.
8.) Housing hits a wall
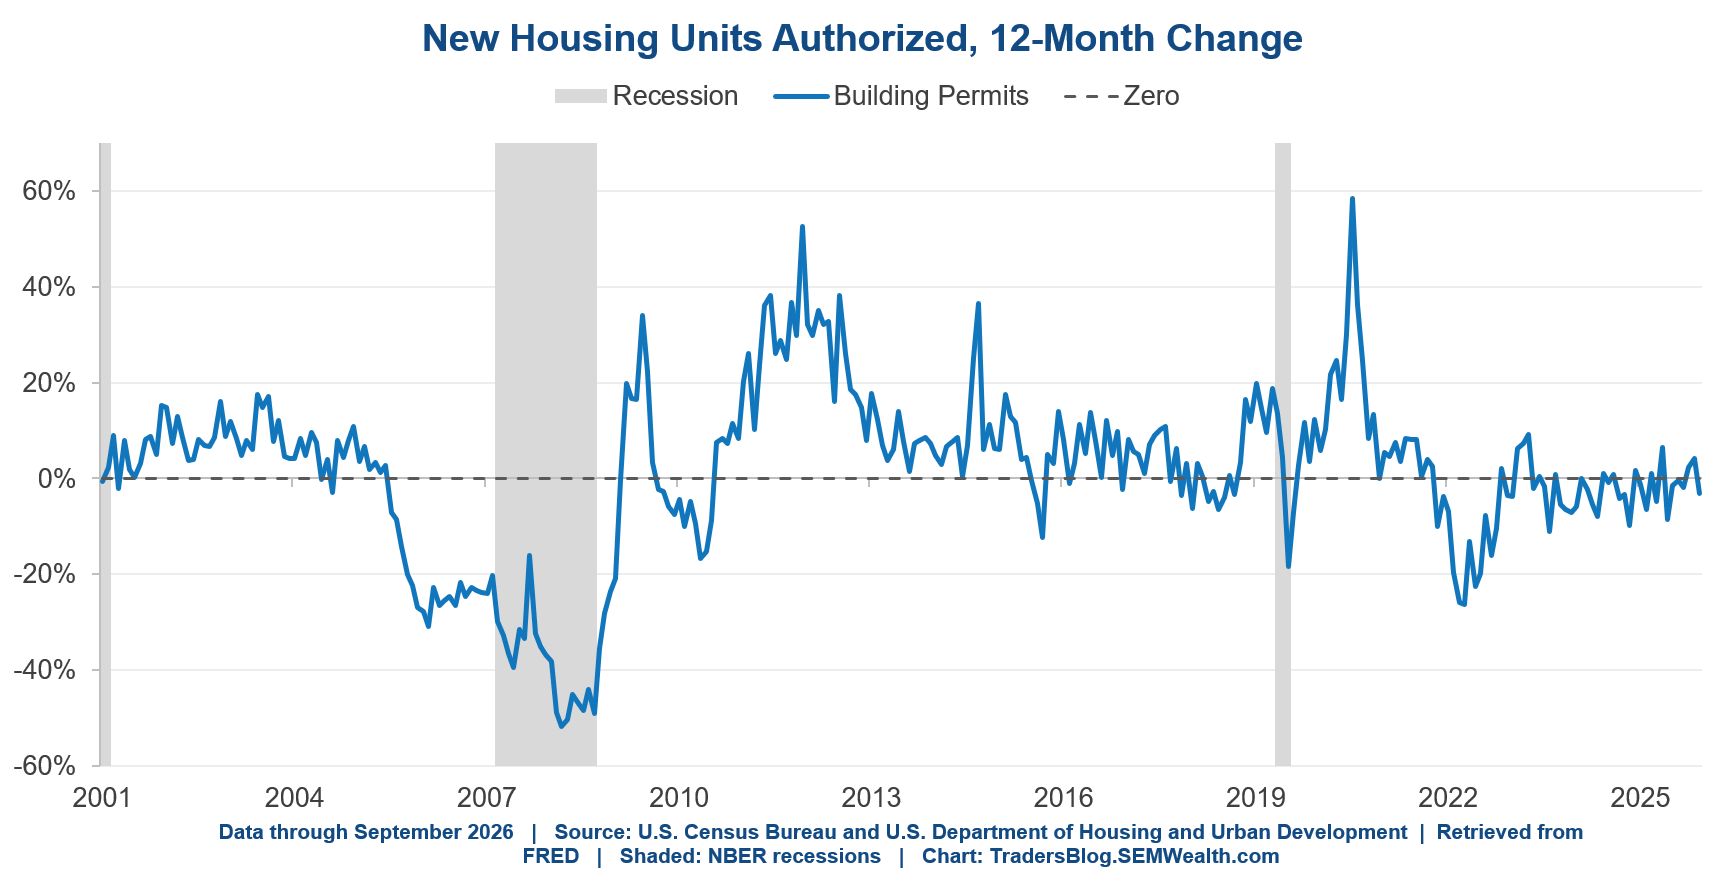
Pending home sales fell to the lowest level since the series began in 2001. Builder confidence is the lowest since 2012, and housing starts fell 5%. This is what a 5% 10-year Treasury (and 7%+ mortgage rates) does. Meanwhile, weekly jobless claims fell to 194,000, near multi-decade lows, so the labor market is not giving the Fed a reason to back off.
9.) Oil, consumers, and the rest
Brent crude hit $116, its highest level since spring, after more attacks on tankers in the Strait of Hormuz and on Saudi energy facilities. Consumer sentiment came in at 48, the second-lowest reading on record, and people expect 4.7% inflation over the next year. That's the tug-of-war going into the Fed meeting: a stock market worried about AI spending, and an inflation picture that isn't cooperating.
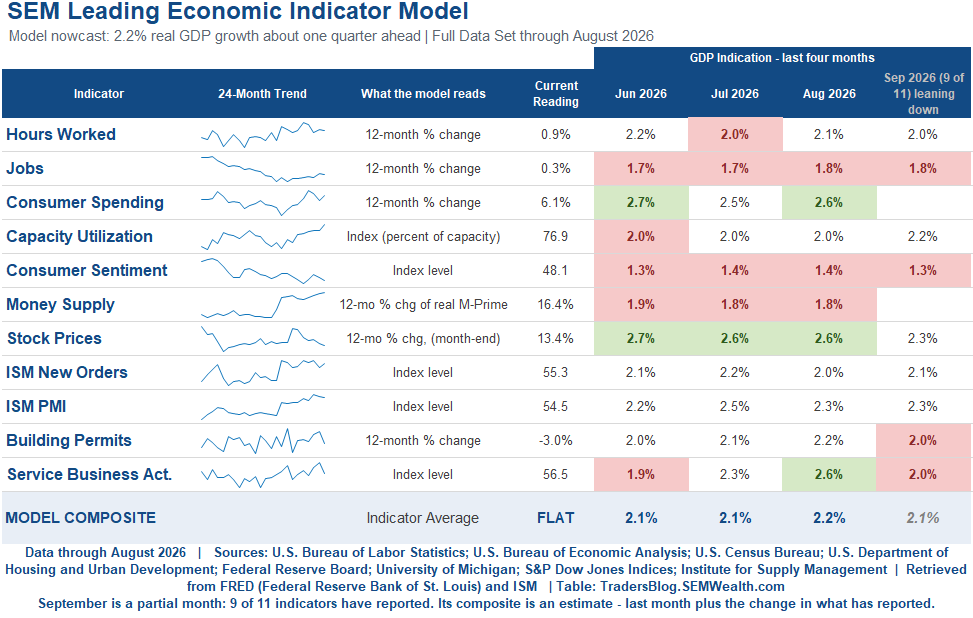
The current snapshot of our Economic Model Dashboard shows a slight slowdown in September, but still stuck in "neutral".
10.) GDP this week – don't be fooled by the big number
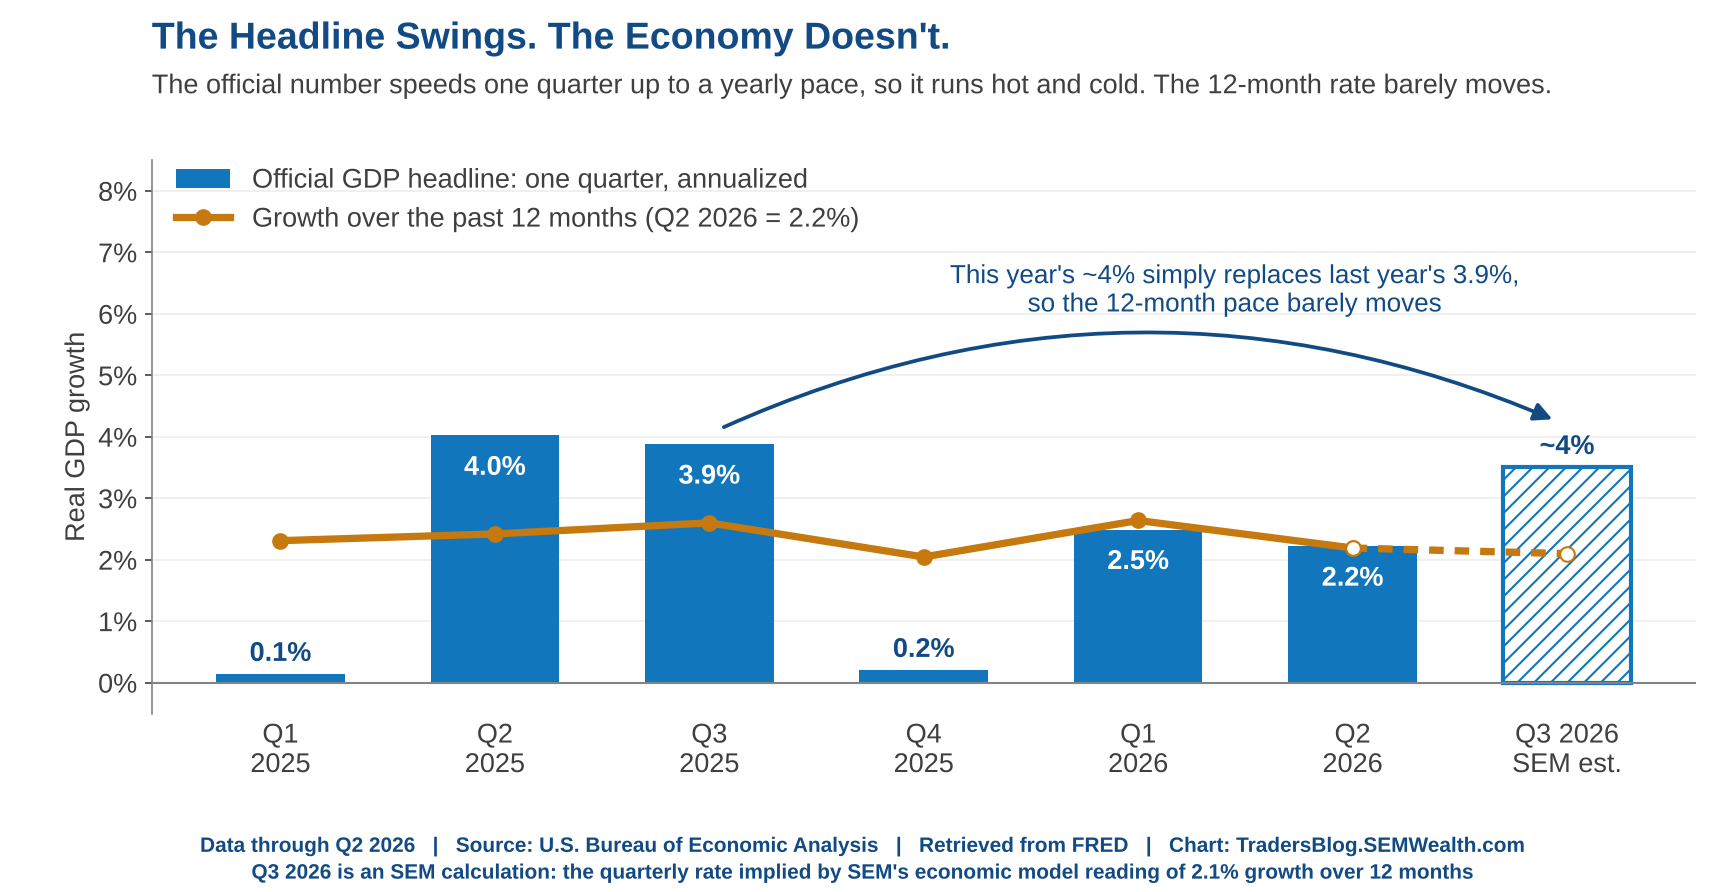
I want to get ahead of the first estimate of Q3 GDP because it's likely to be a big one and cause some confusion. Note our model is saying 2.1-2.2% GDP growth. This is year-over-year growth, which is different than the "official" number. The official "headline" number takes just ONE quarter and speeds it up to a yearly pace, so if our model is right the headline should print somewhere between 3.5% and 4%. That would simply replace last year's 3.9%, which is why the 12-month pace barely moves. When you see a big number Thursday, remember the economy isn't suddenly booming.
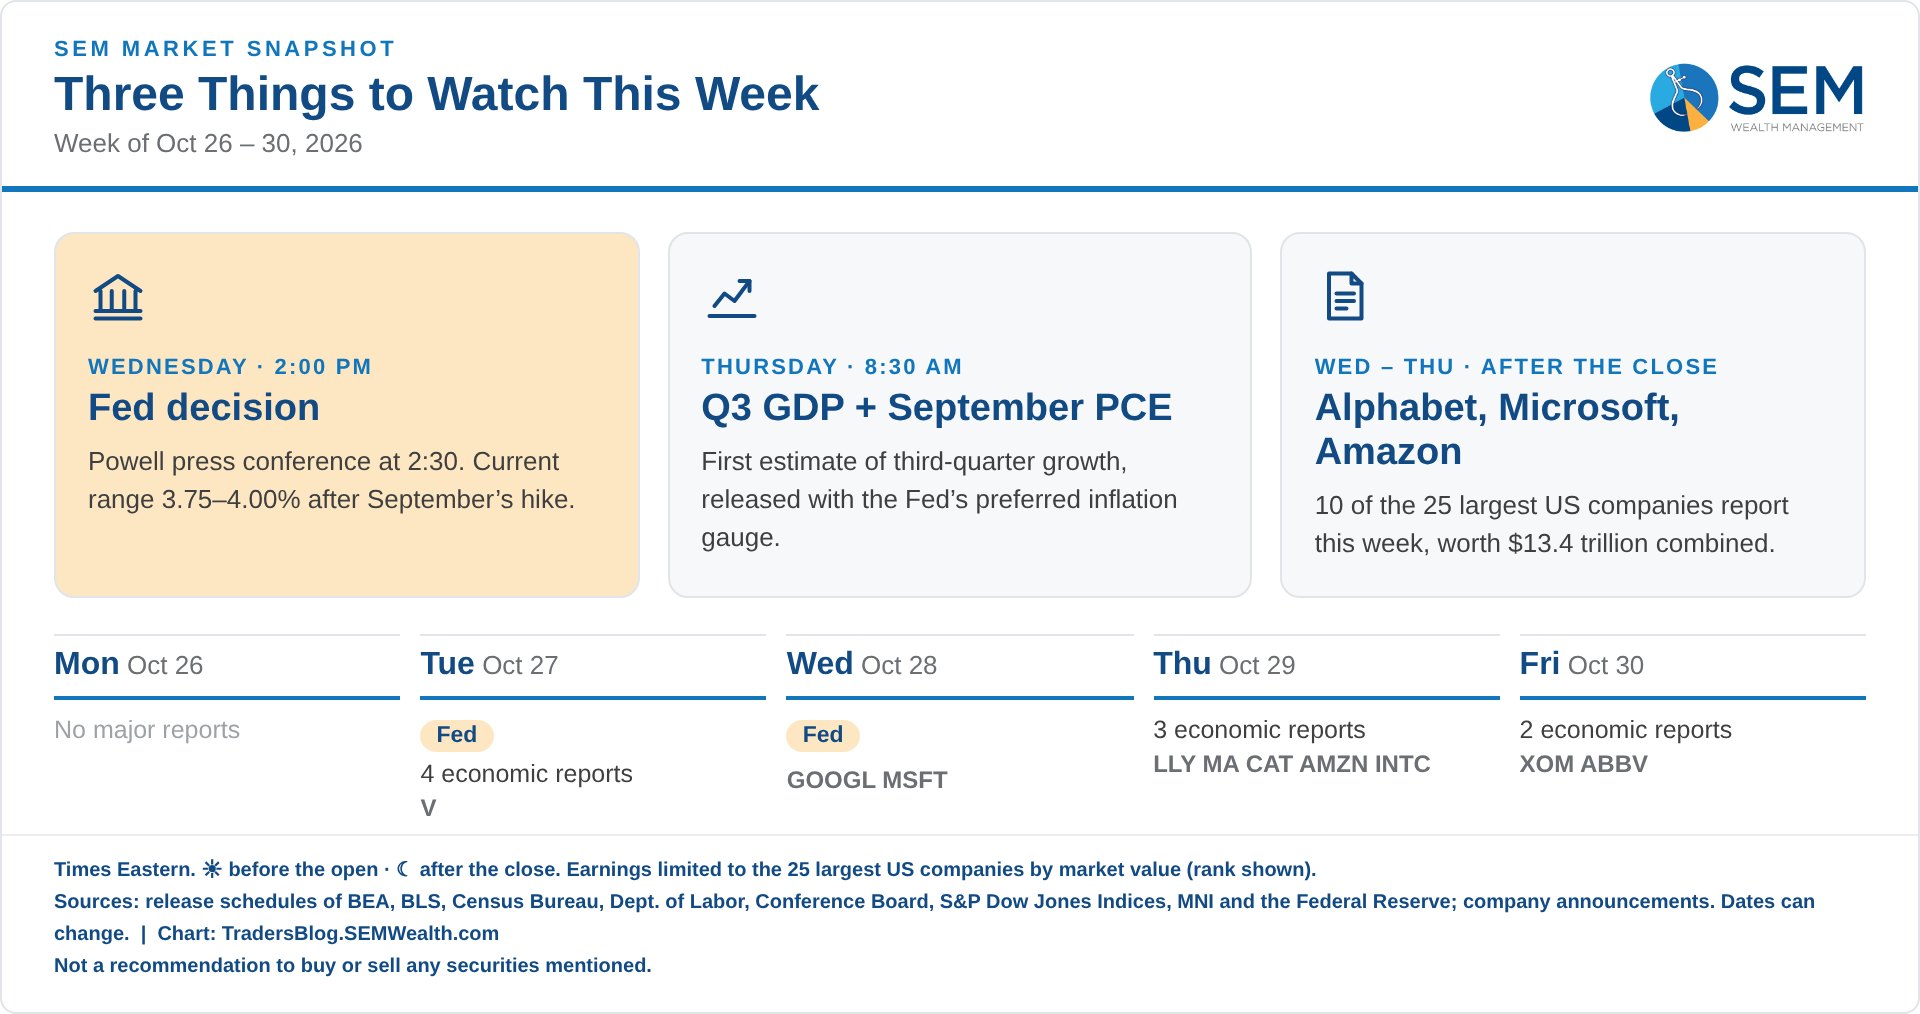
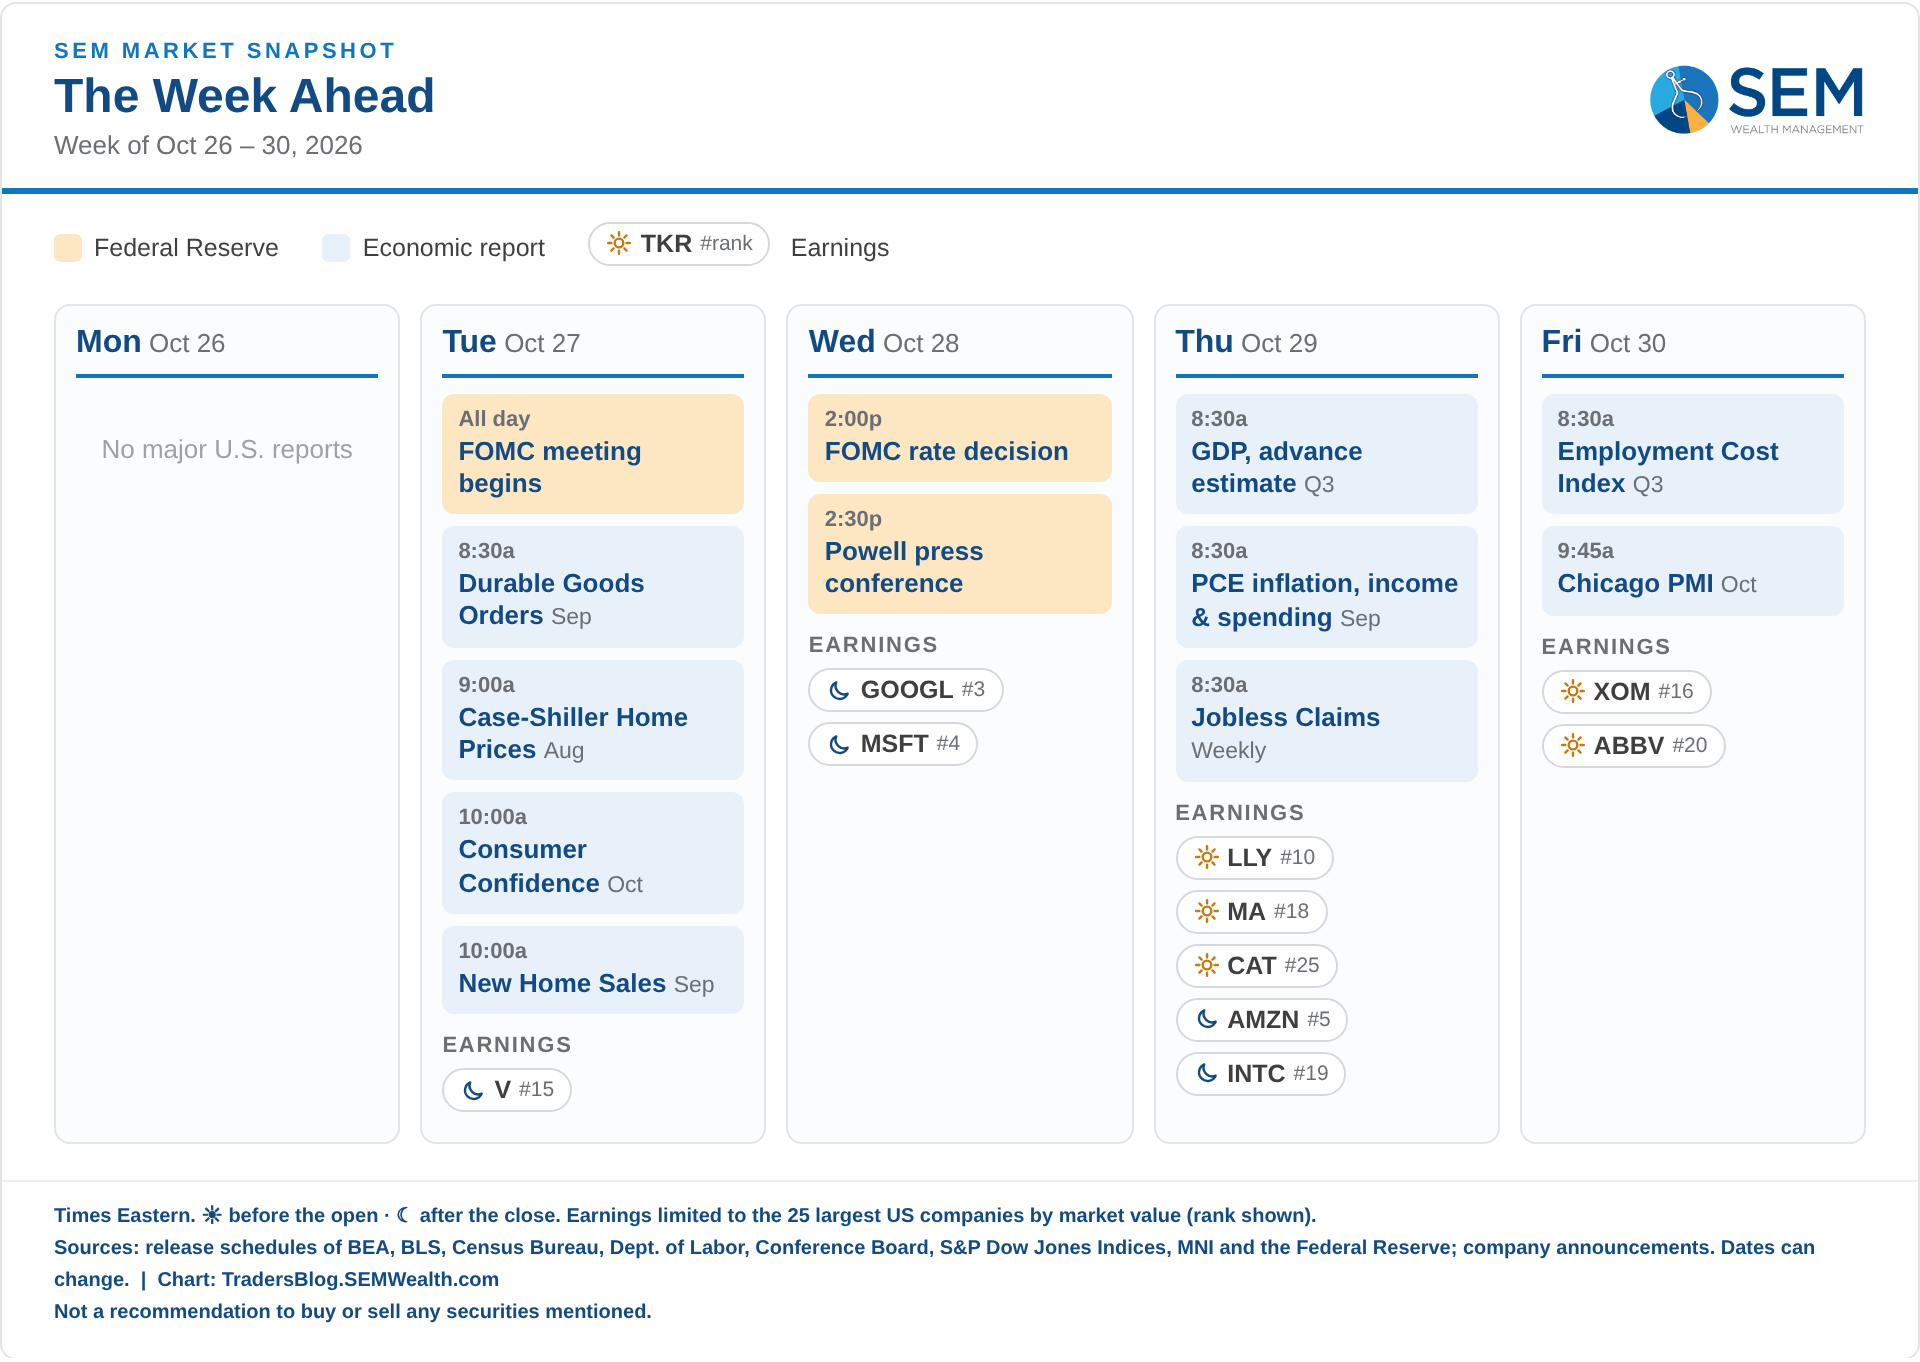
Finally, here's a new image designed to give us a quick synopsis of what we're watching this week. It's going to be a busy one.
As always, we'll be ready no matter what is thrown our way.
Election Update
By: Cody Hybiak
We have now reached the point in the election cycle where we can start to see real results. While we don’t have actual numbers about votes received by the candidates, we can see some of the data when it comes to the raw count on early votes.
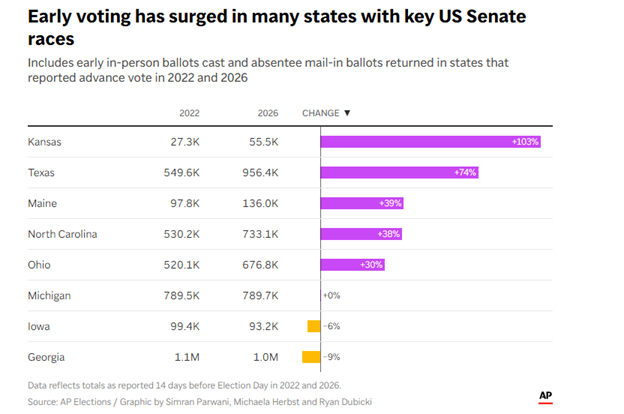
Pretty big surges in key states like Kansas and Texas, and the history since 2020 has shown a split in party vote totals in regards to early and mail-in ballots, and election day voting, with Democrats more likely to vote early, and Republicans more likely to vote in person on election day. Of course, this is just a hypothesis, and there is nothing that says that trend can’t revert. The issue with this chart is it simply shows the change of early ballots counted, and not the percentage of votes that are expected to be early. For example, in Texas, 550k early votes represented a very small percentage of the about 8 million votes counted in 2022 in the state, or about 6% of the total vote. Kansas had about a million counted votes in 2022, so that is an even smaller percentage of the total count, less than 3%. So while Democrats can look at the results in Kansas and Texas and say that they’ve motivated a base to come out and vote for them, we are talking about big gains in a very small percentage of the total vote. Maybe those increase in votes are enough to get them over the edge in those states, but there is nothing that I’ve seen that changes the outlook on the results in those states yet.
We’re still seeing some new polling activity come out, which could tell us how things may be swinging in these last few weeks. Unfortunately for the ease of the tension, the recent polls haven’t done anything to clear up that uncertainty. Emerson and Fox News released polls in the state of Texas that essentially showed the same thing; the state is looking like a tossup, with both results coming within the margin of error for either candidate. This goes unchanged from the polls from a week ago. Fox News also released a poll from Maine that showed a tie. Other polls have been close enough that I don’t have a confident lean either way for Maine. The polling data leaves everything looking like this:
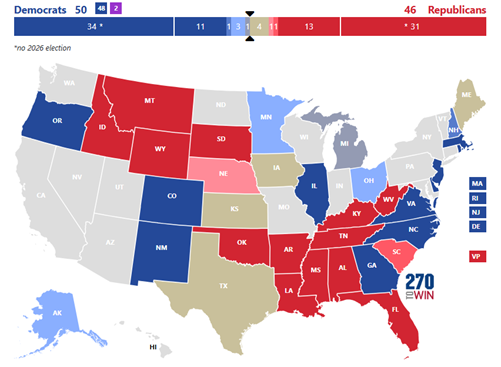
It should be noted that prediction markets still have Texas as leaning Democrat, but based on the polling data I don’t see enough to change that into that category, even with the early ballot data. Republicans can feel encouraged that there seems to be a clearer path to them holding the senate; if they win all the tossups, they get to the 50 seat threshold to maintain control of the Senate. It isn’t quite as likely as flipping a coin 4 times, needing tails every time, since these races will be at least a little bit correlated with one another, but they still need to have strong efforts in all 4 of these states, plus trying to remain competitive in the other less likely states to give them more of a realistic path.

No Pain, No Gain: 92% Have Been Cut In Half
Severe drawdowns are more common than investors might think, even among companies that ultimately survive and recover.
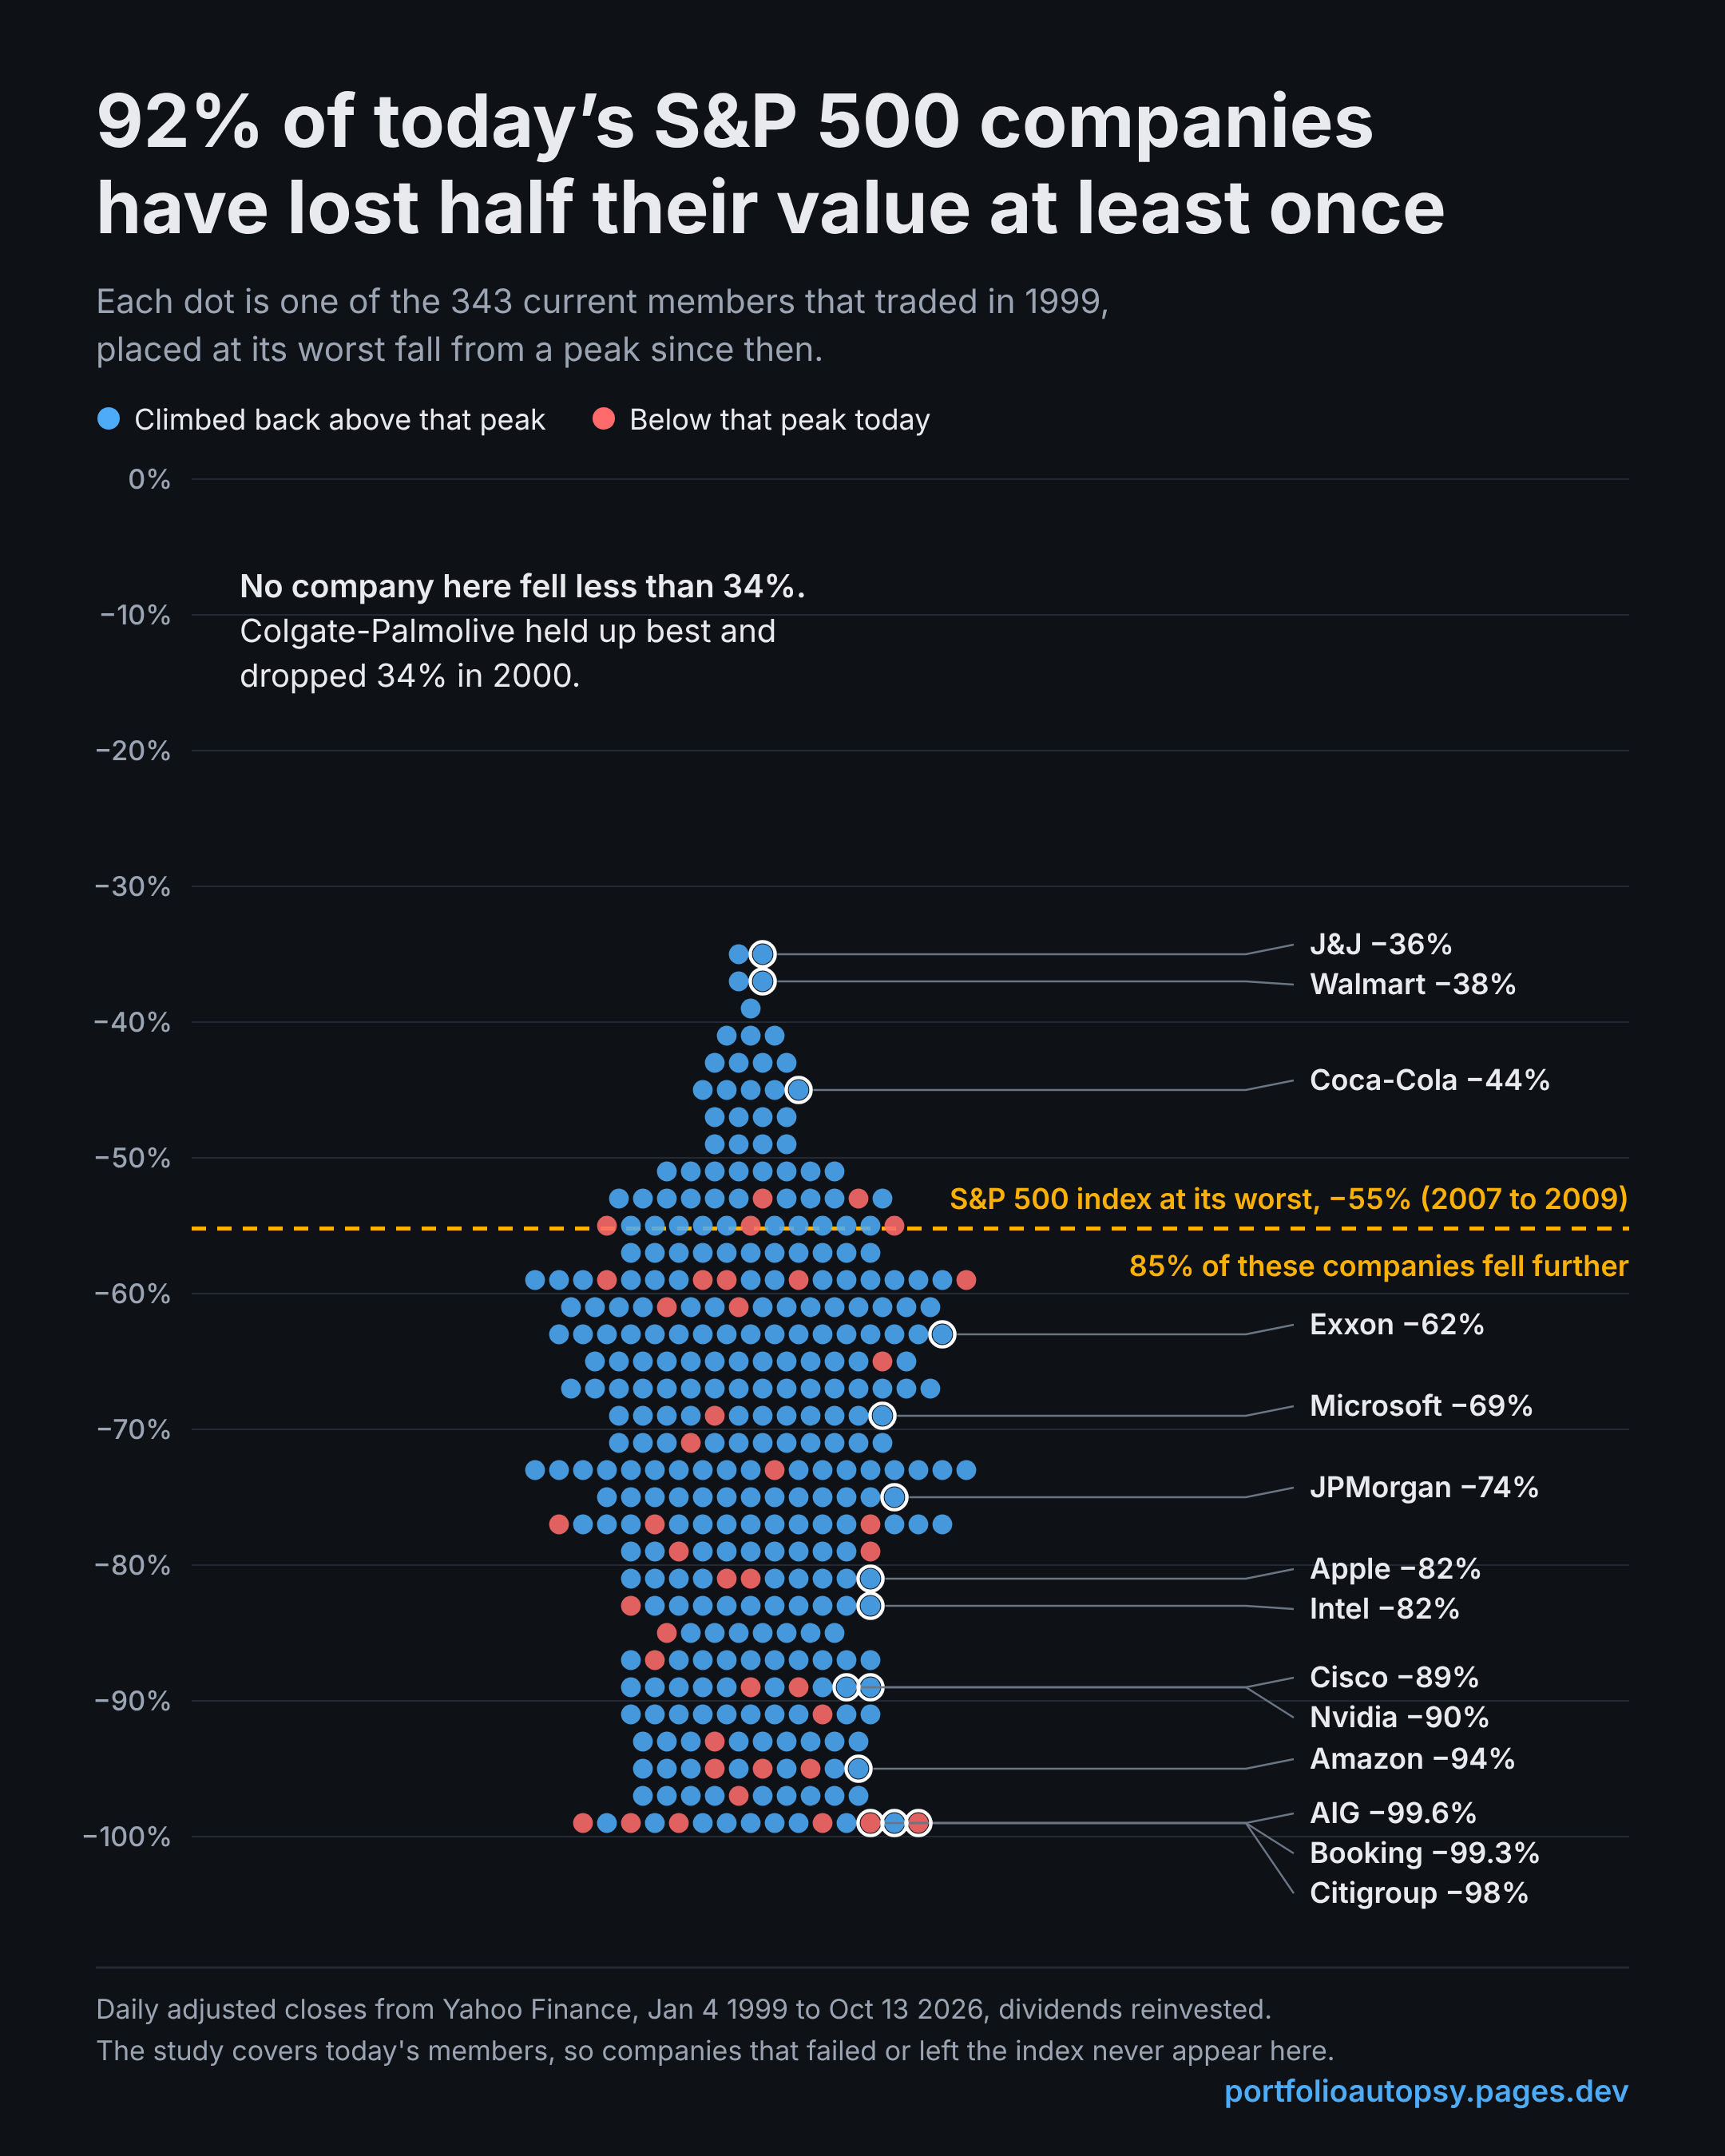
Jeff’s Note: This is one of many reason at SEM we do not pick or recommend individual stock holdings (other than our Momentum Stock Model and Patriot Portfolio, which are designed to be small “sleeves” in an otherwise diversified portfolio.) Even the “best” stock can lose half it’s value (or more).
Jeff’s Note 2: In our AI: Boom, Bubble, or Both, I highlight the losses the top 5 tech stocks at the end of 1999 struggled for a decade (or 2). Note the losses in Microsoft, Intel, Cisco in the chart above.
Market Data
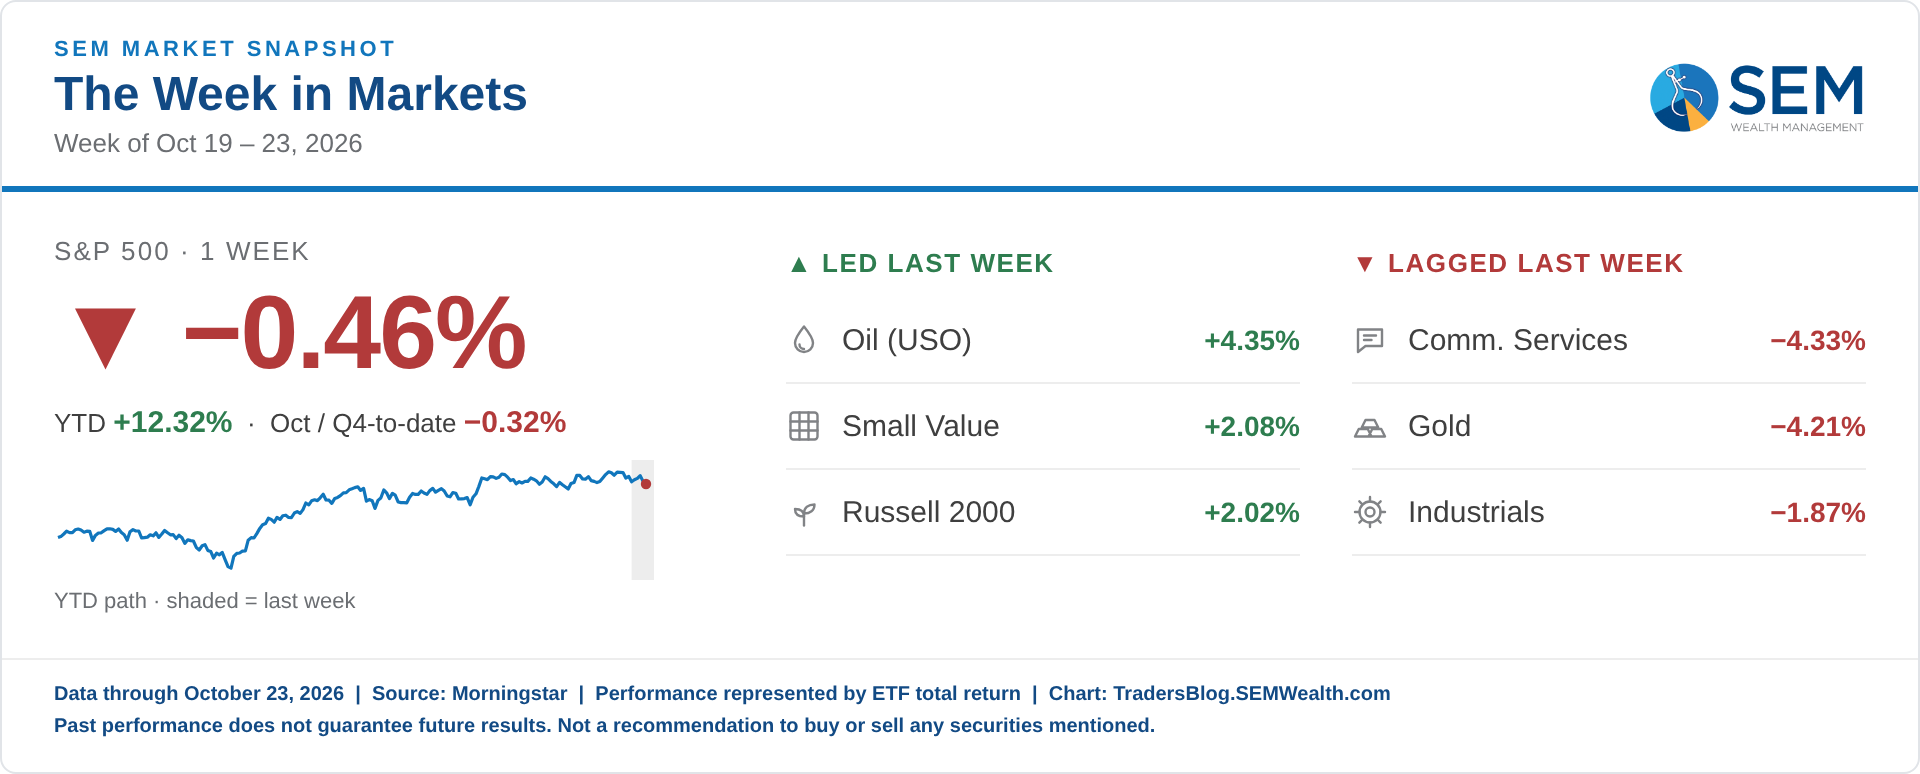
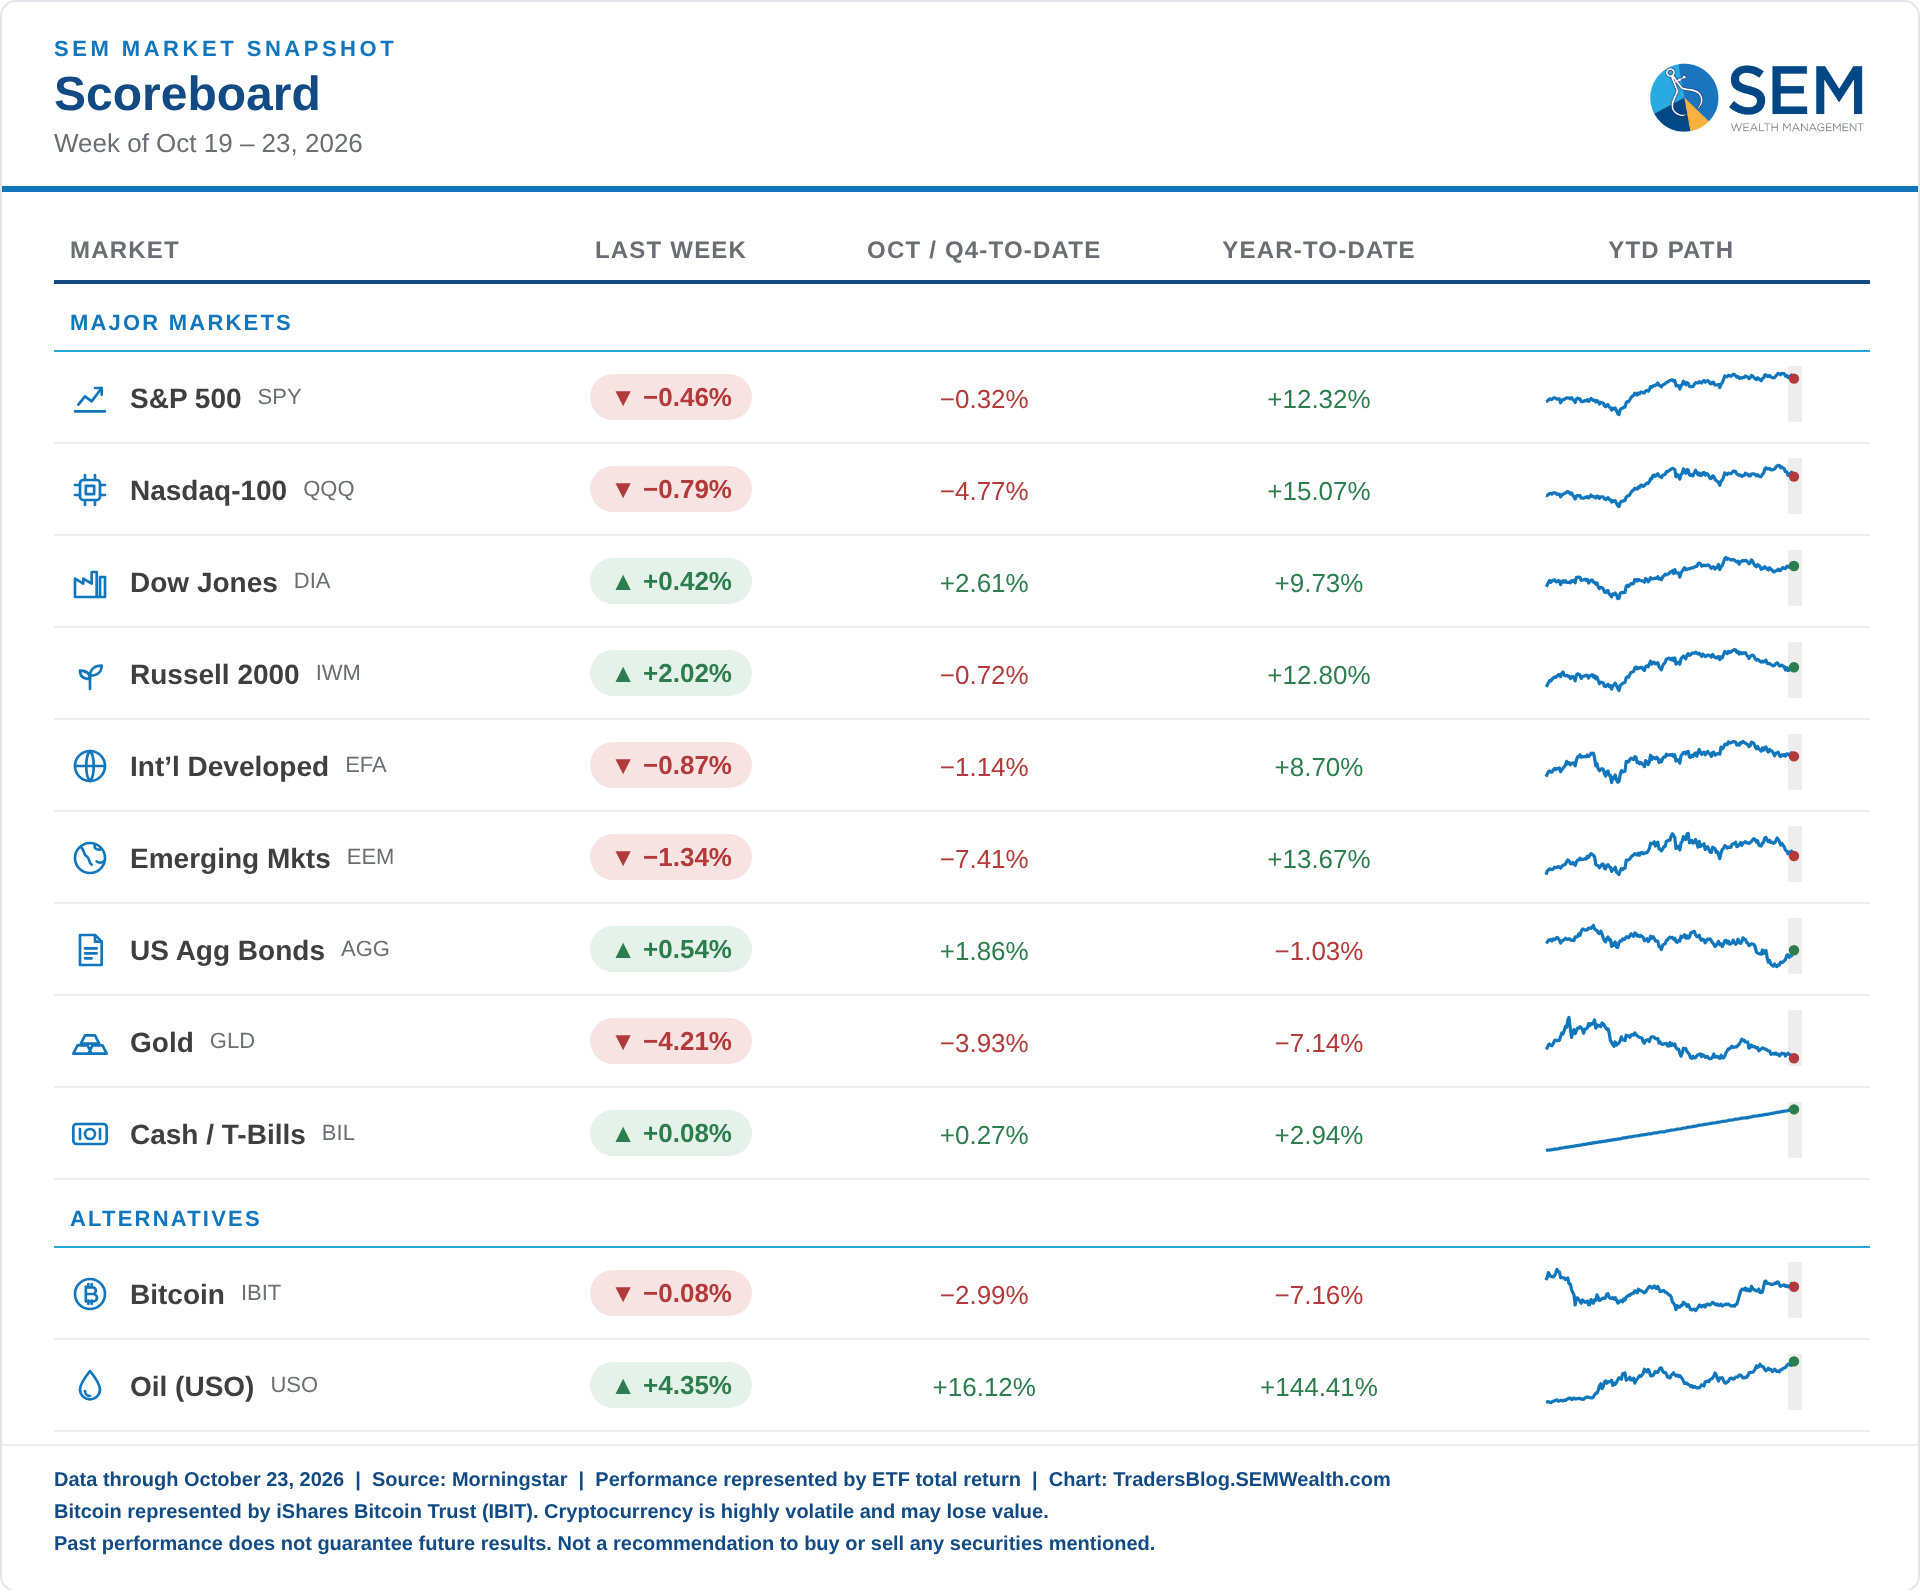
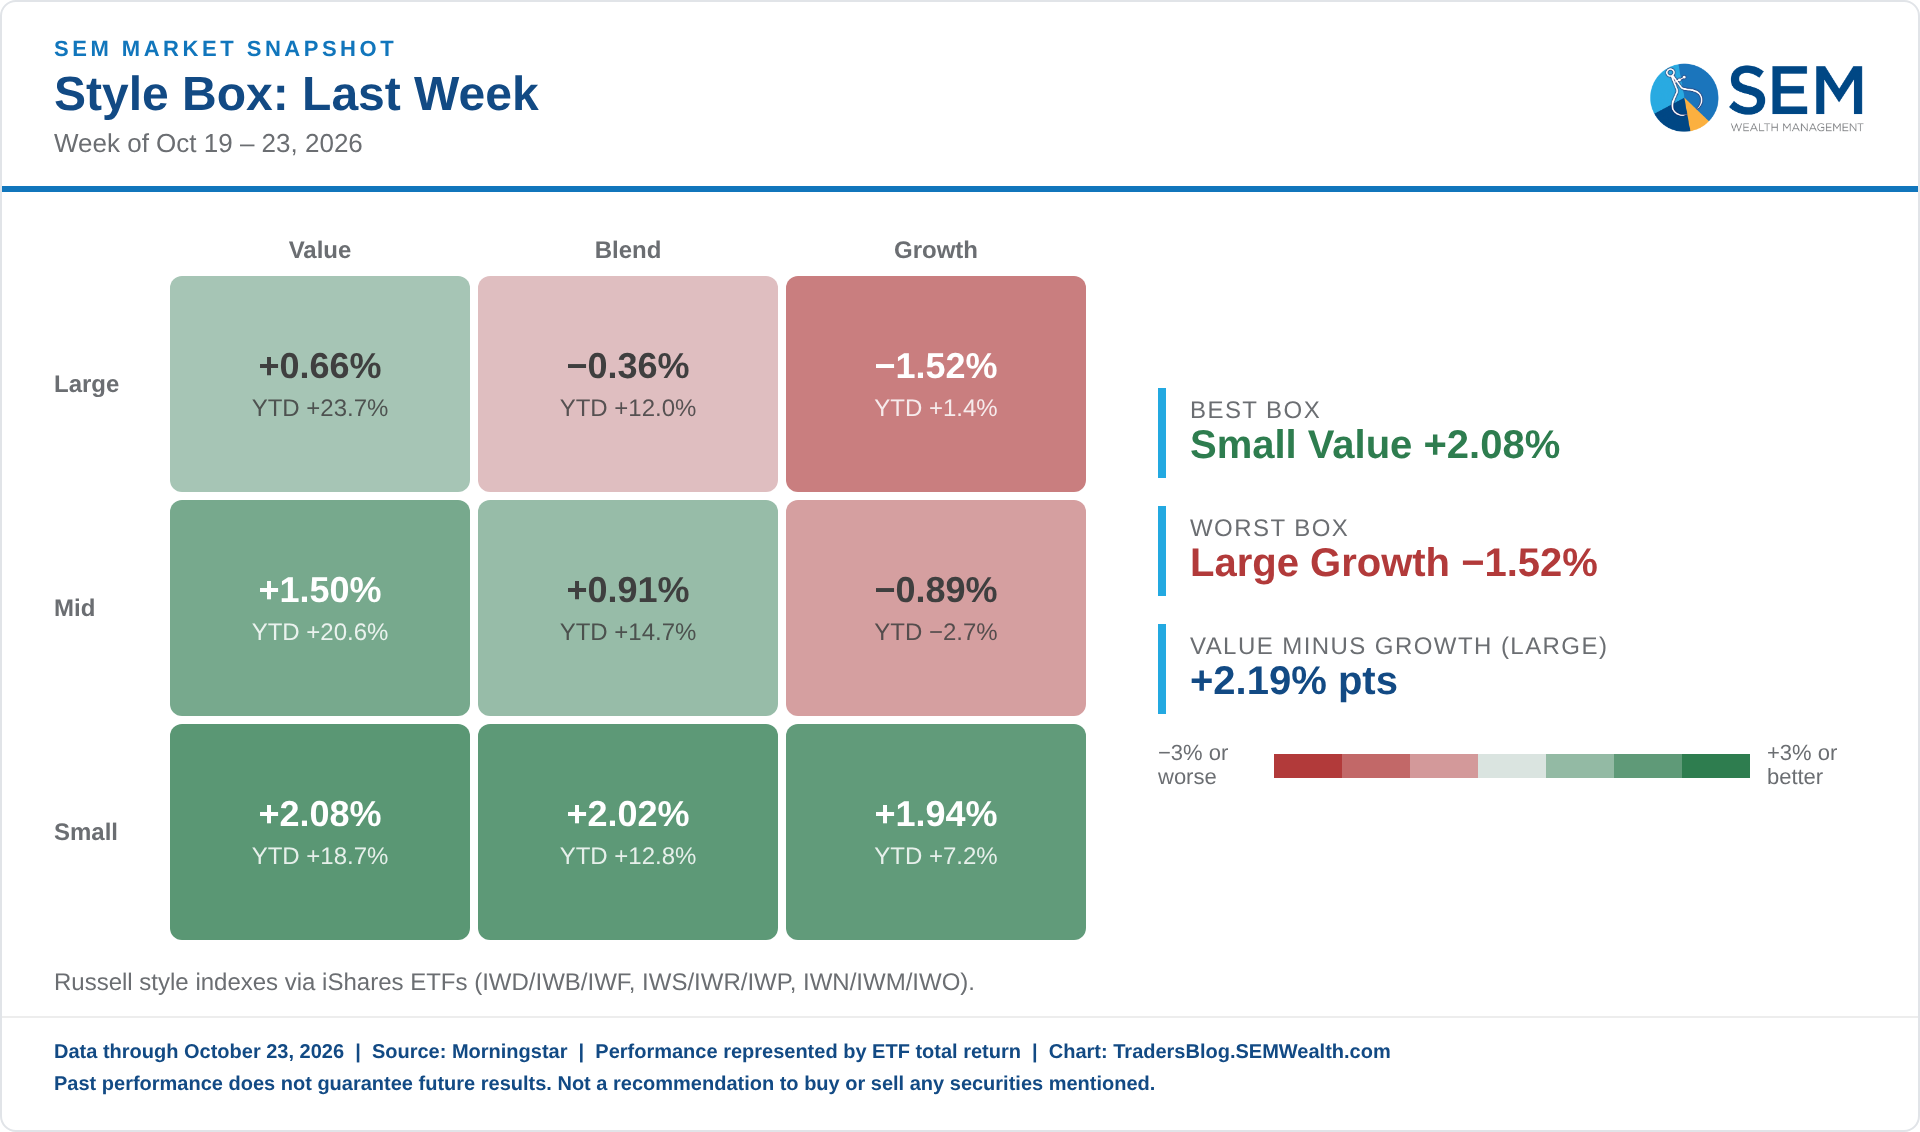
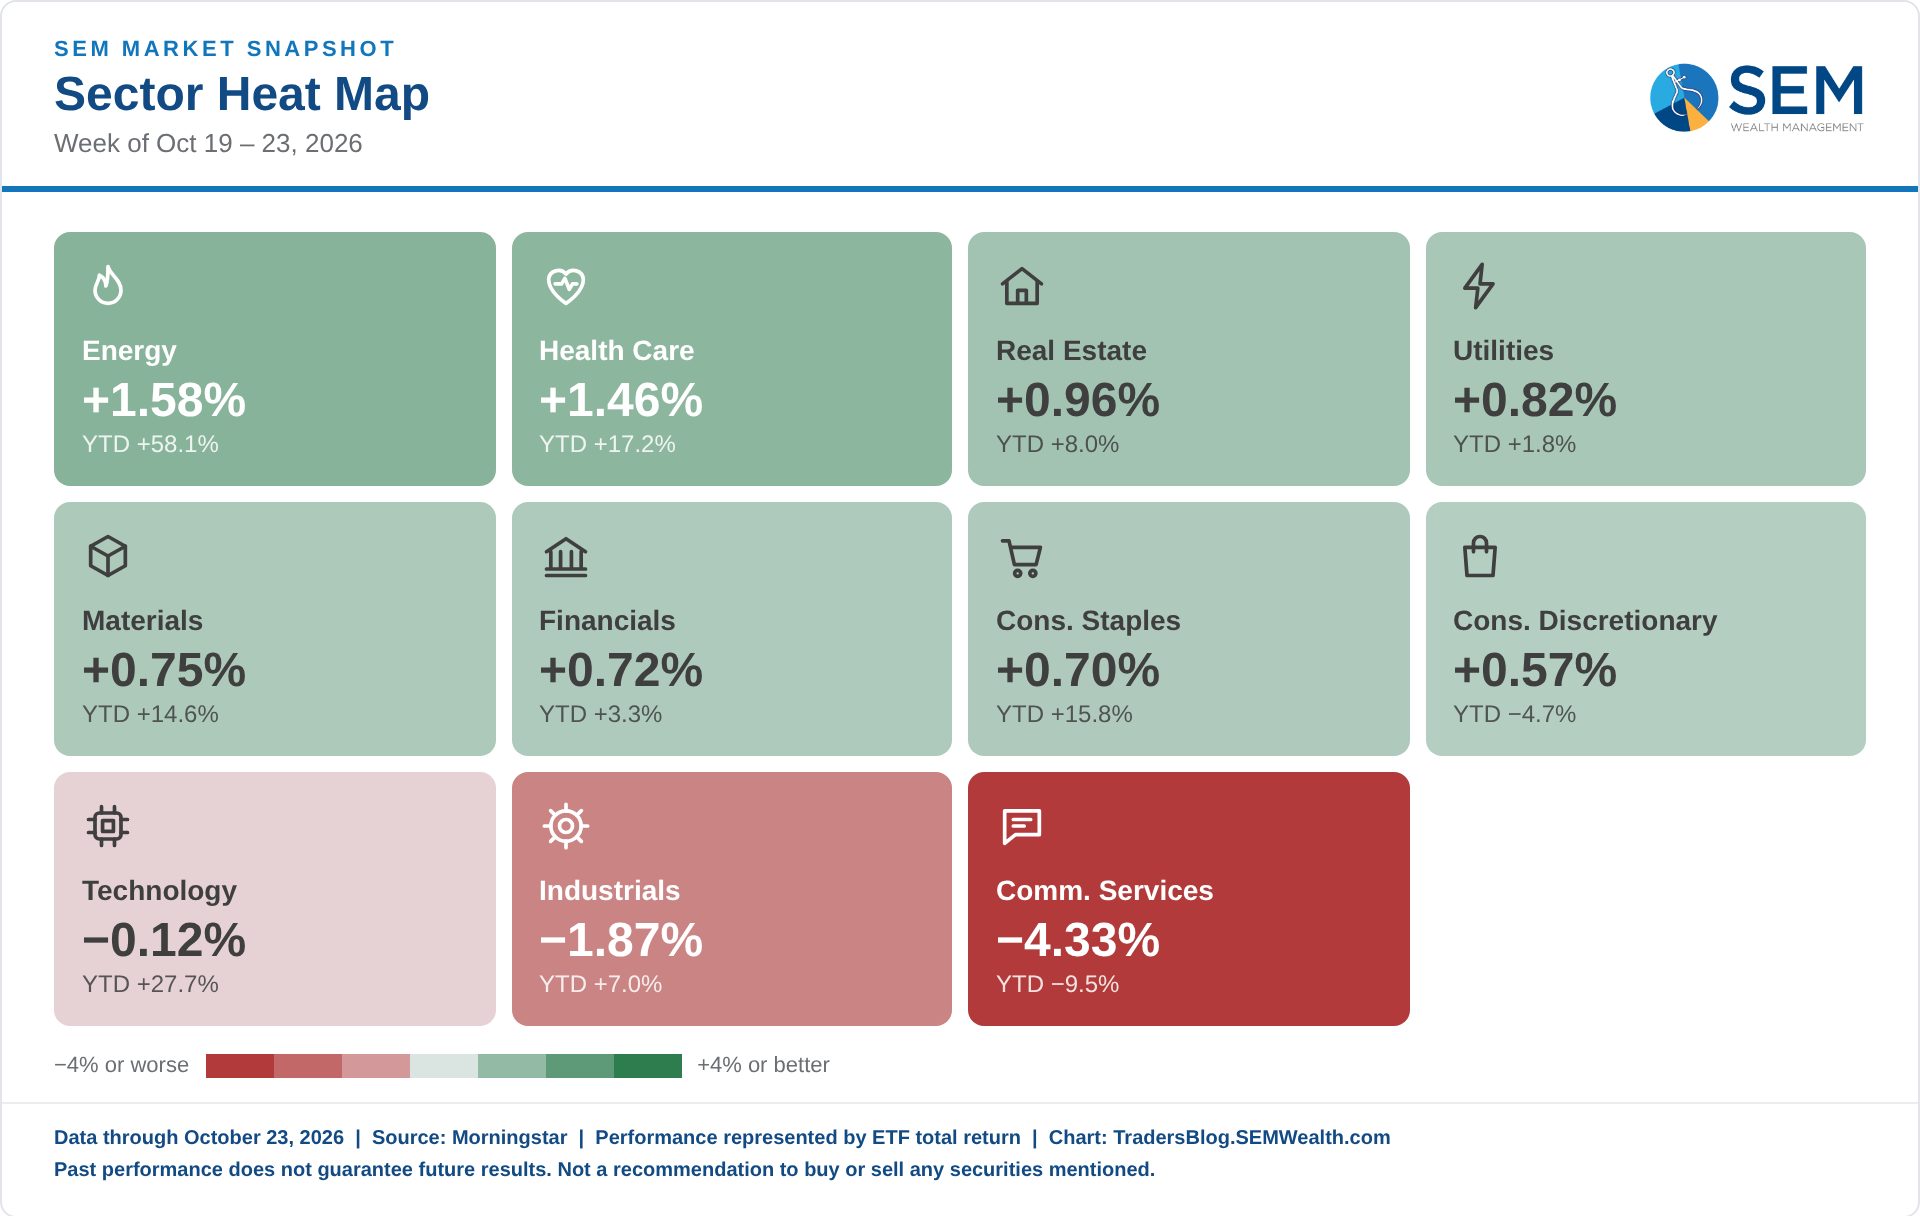
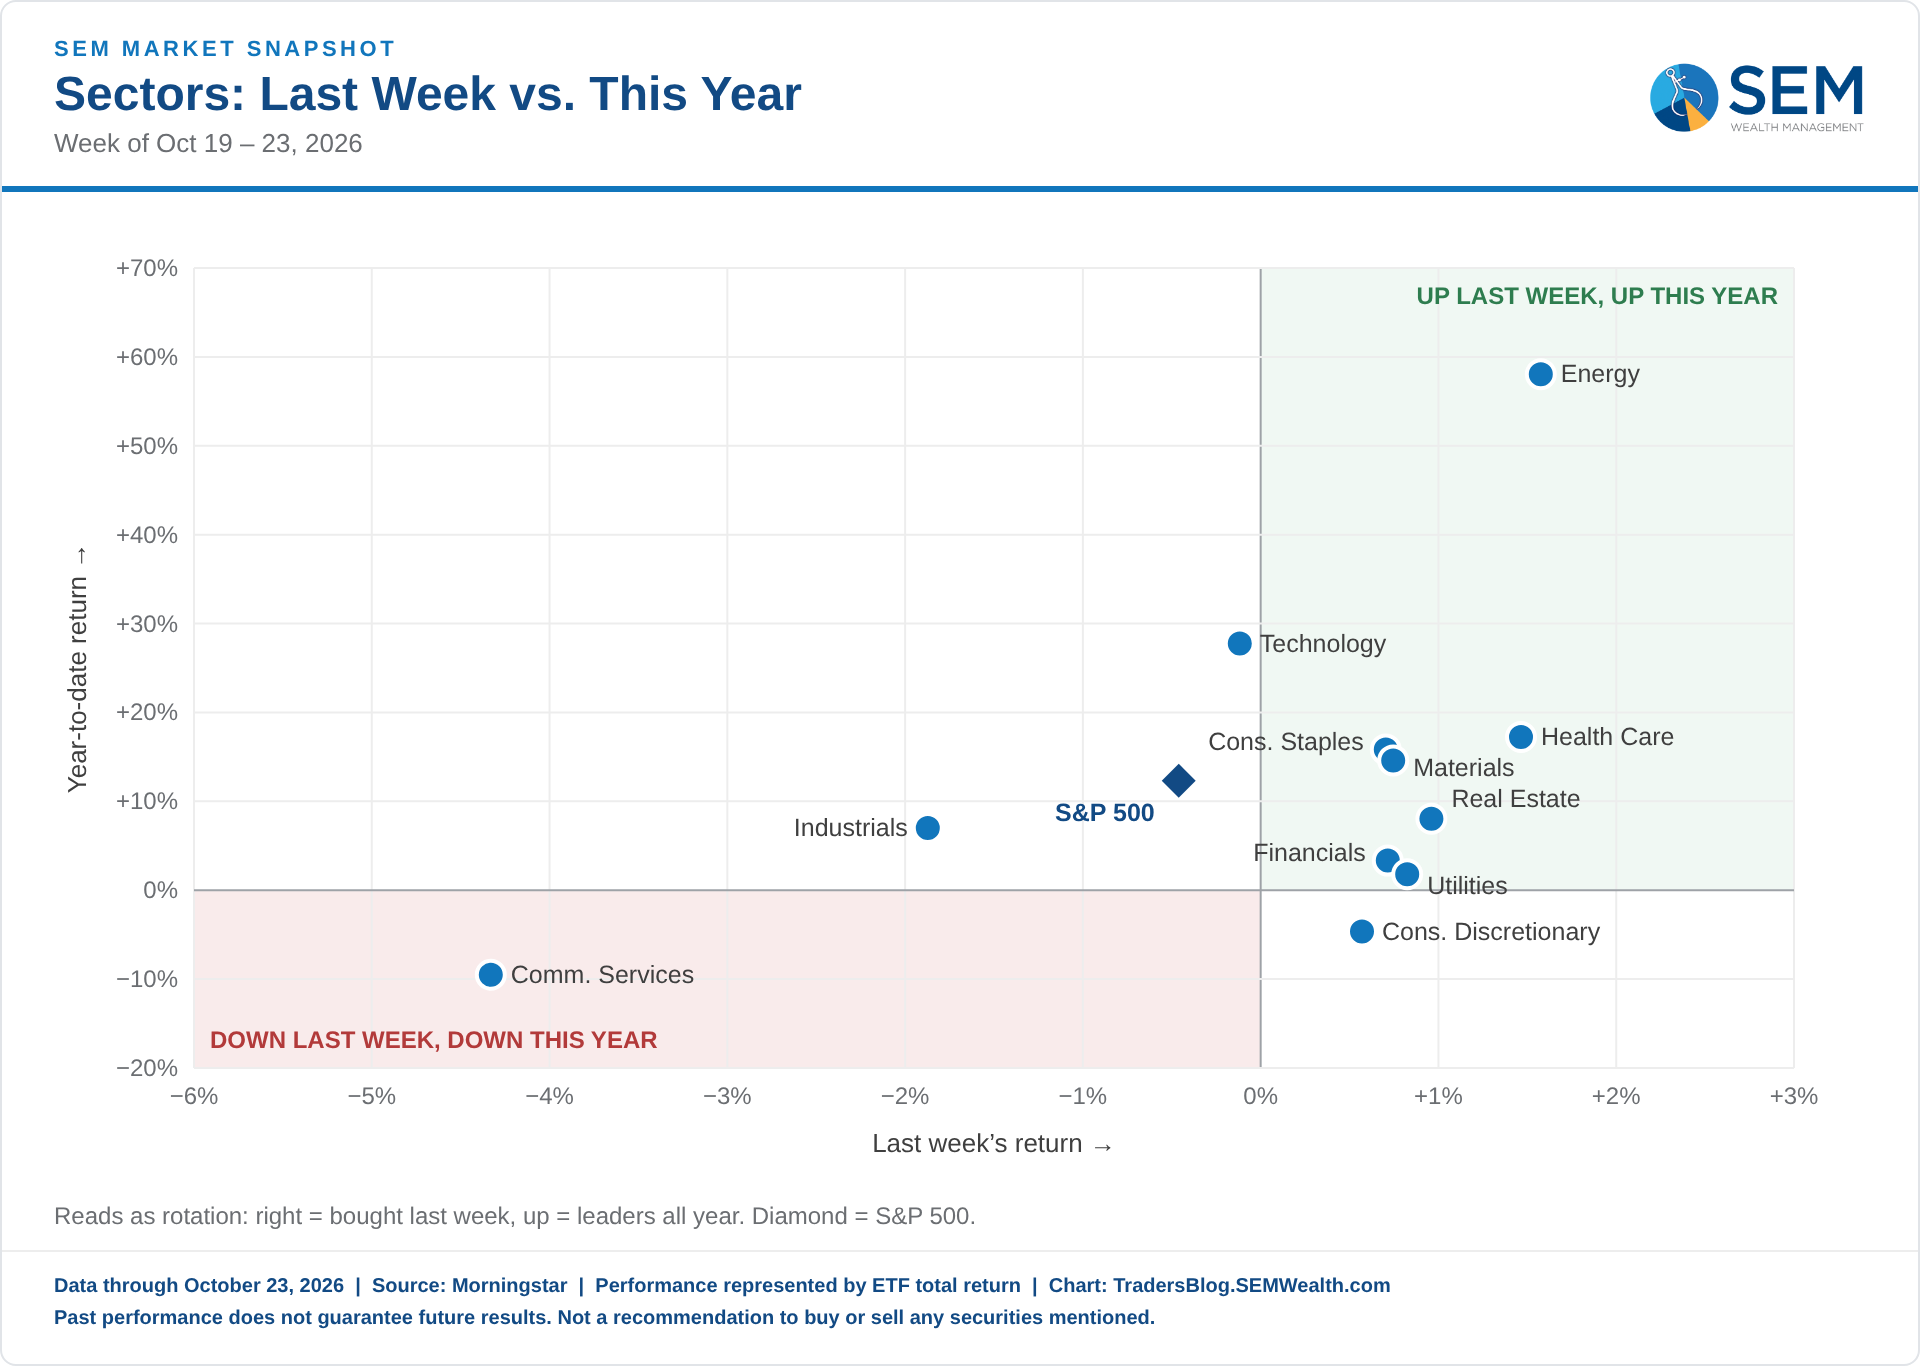
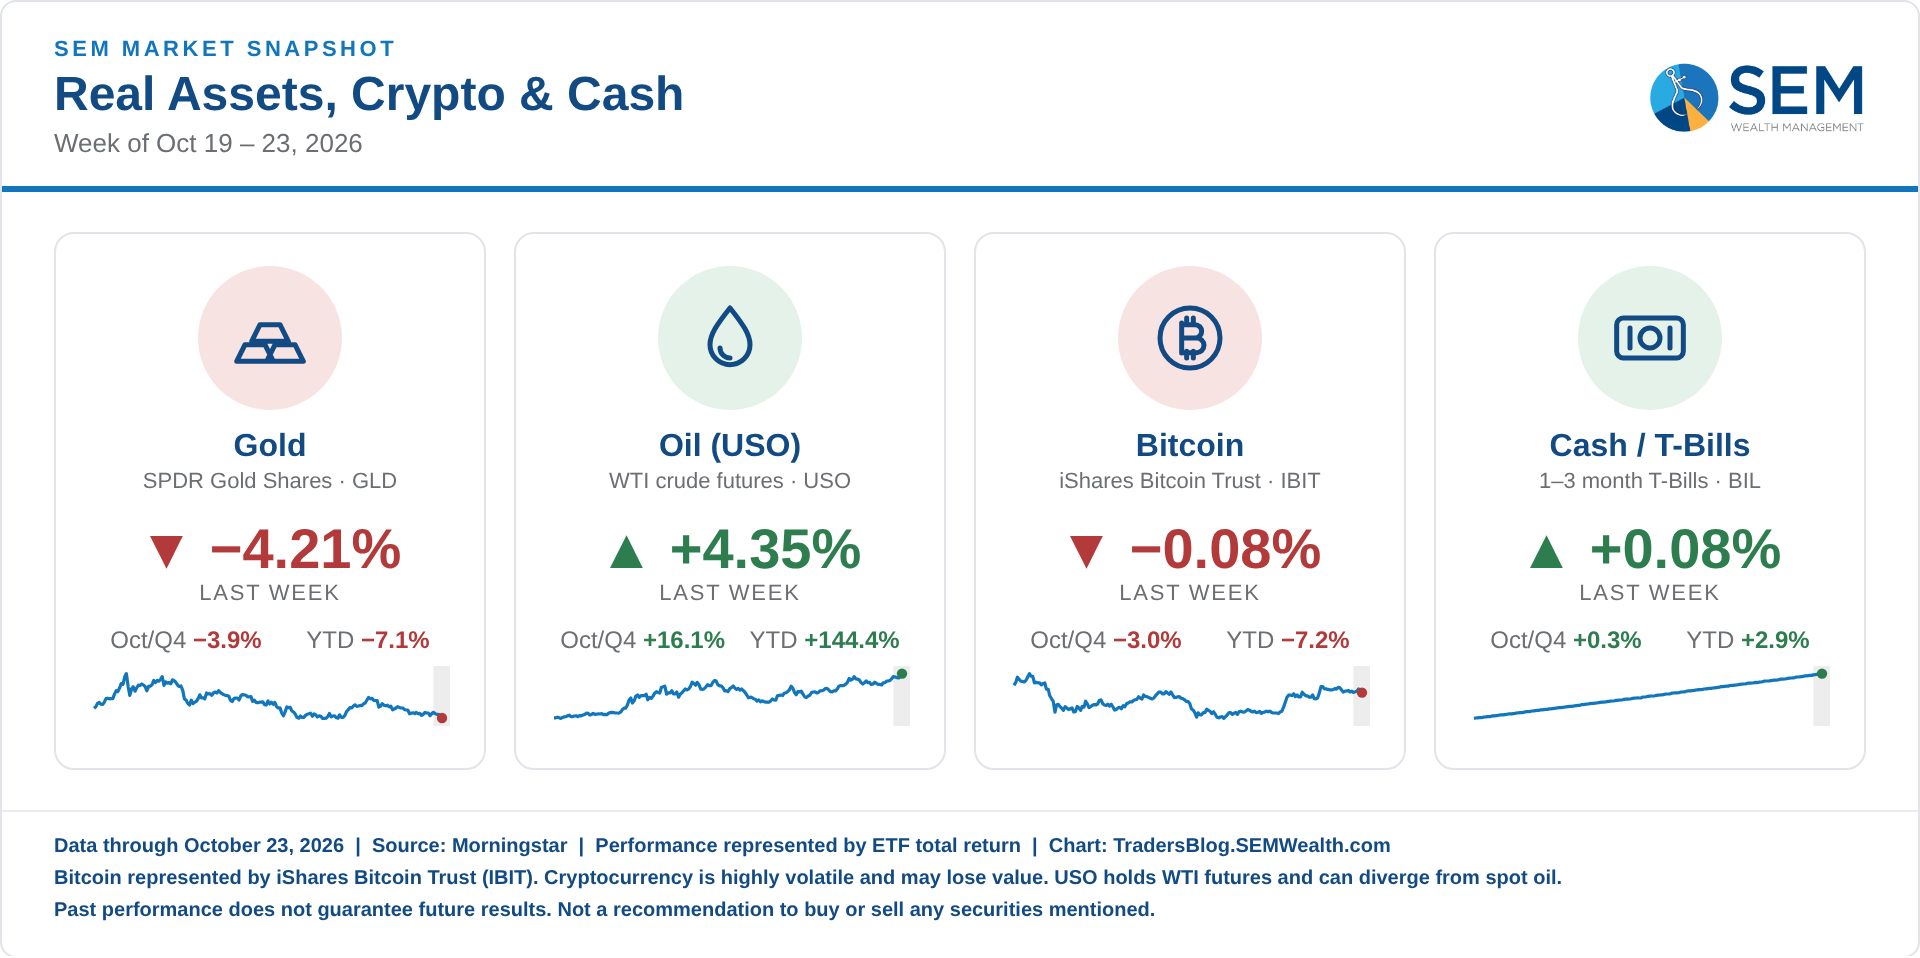
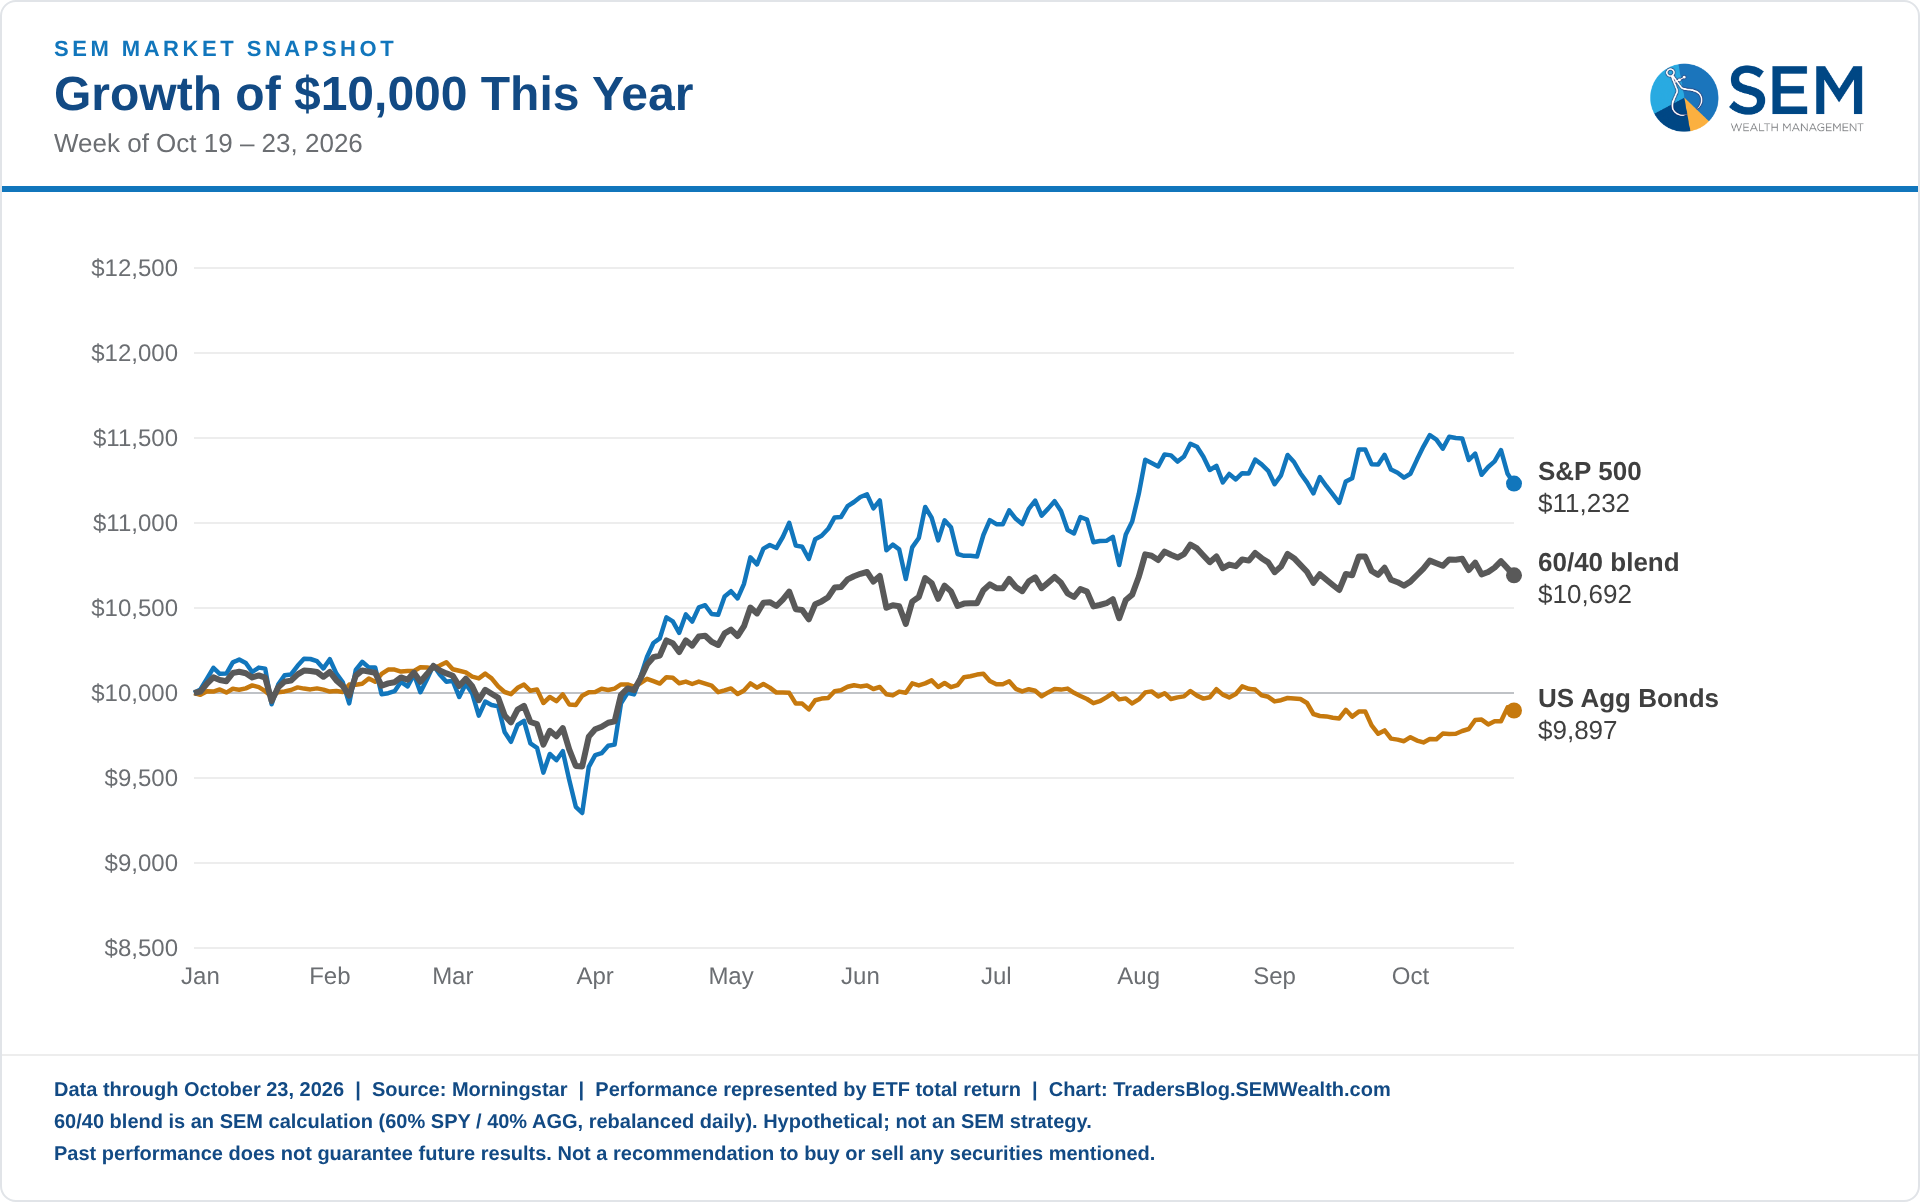
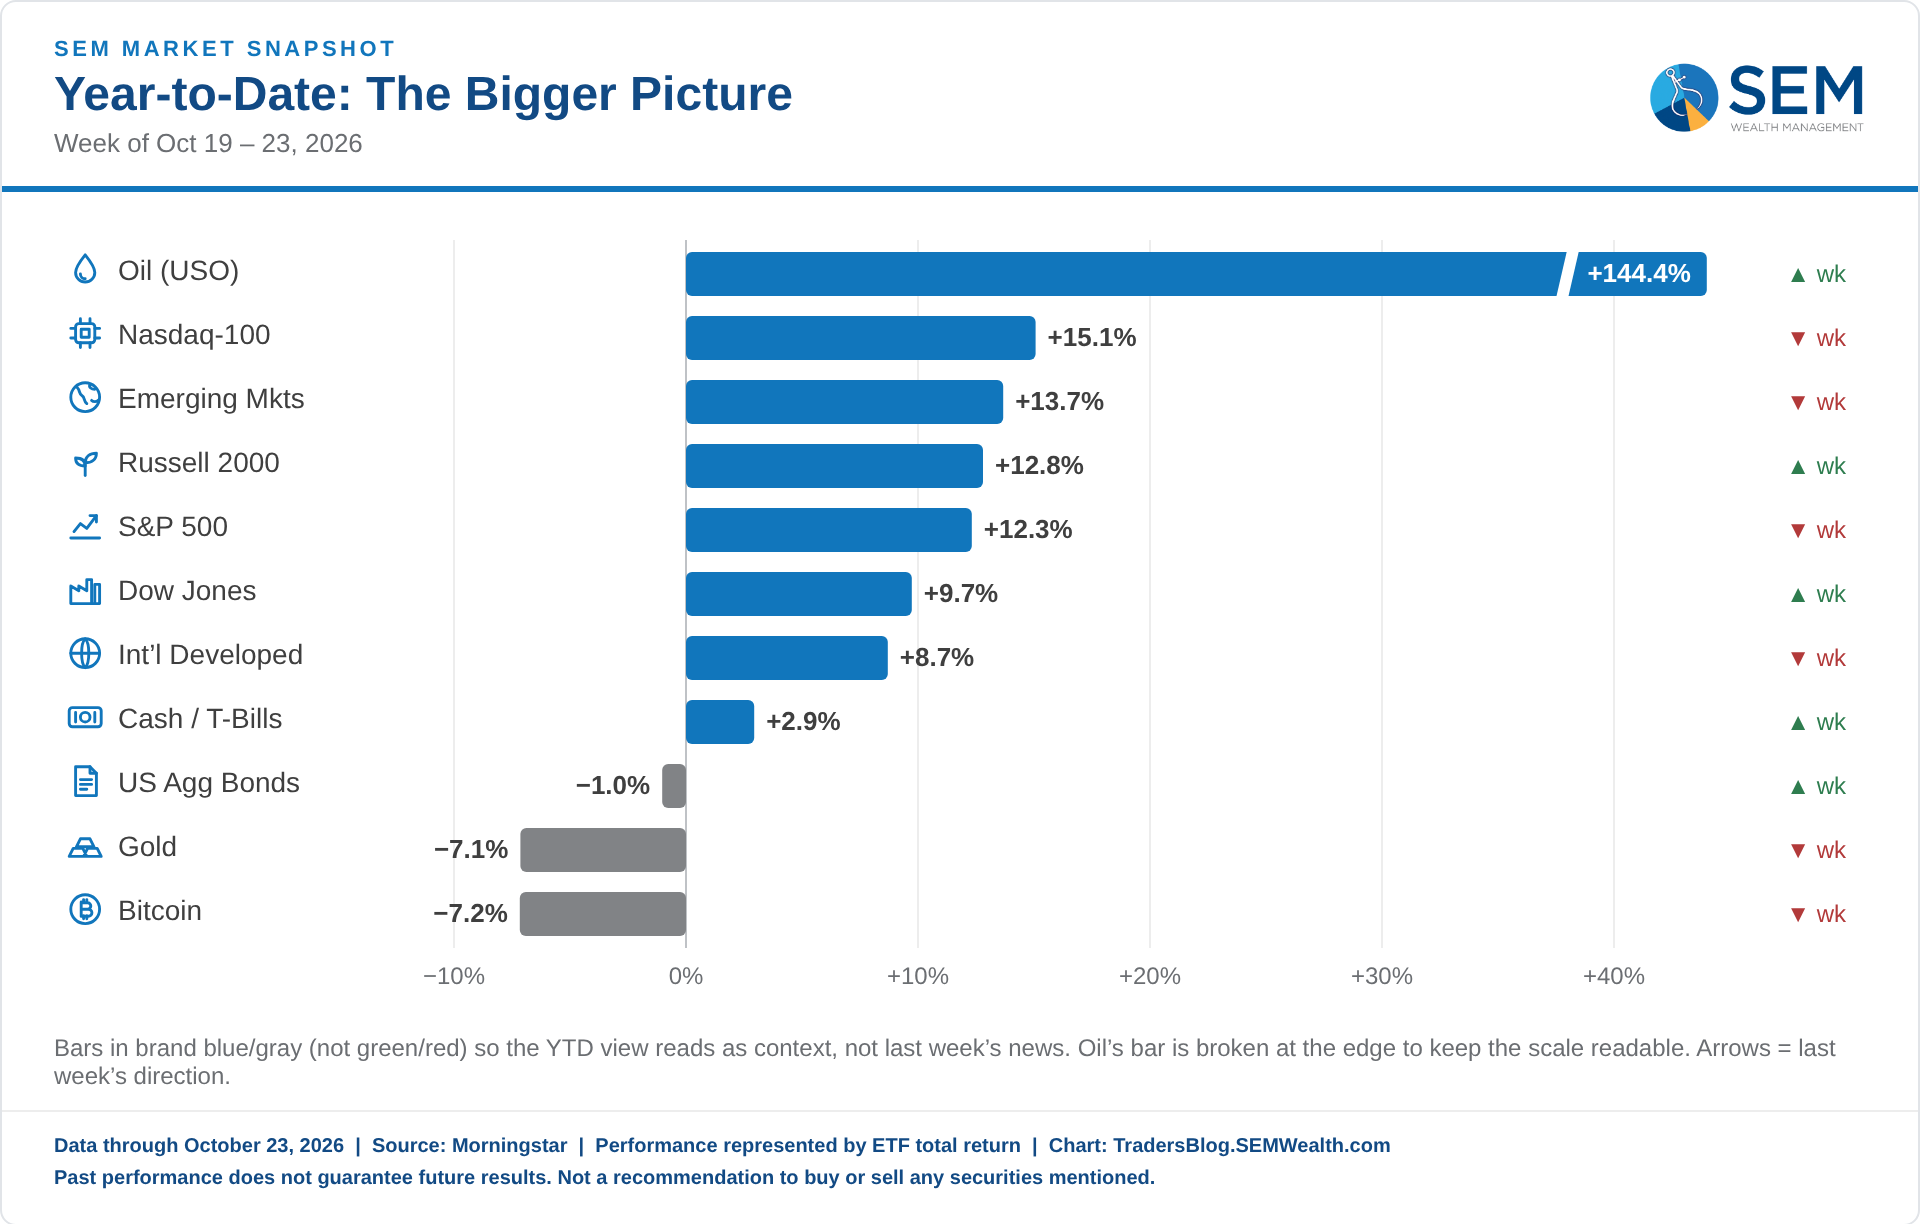
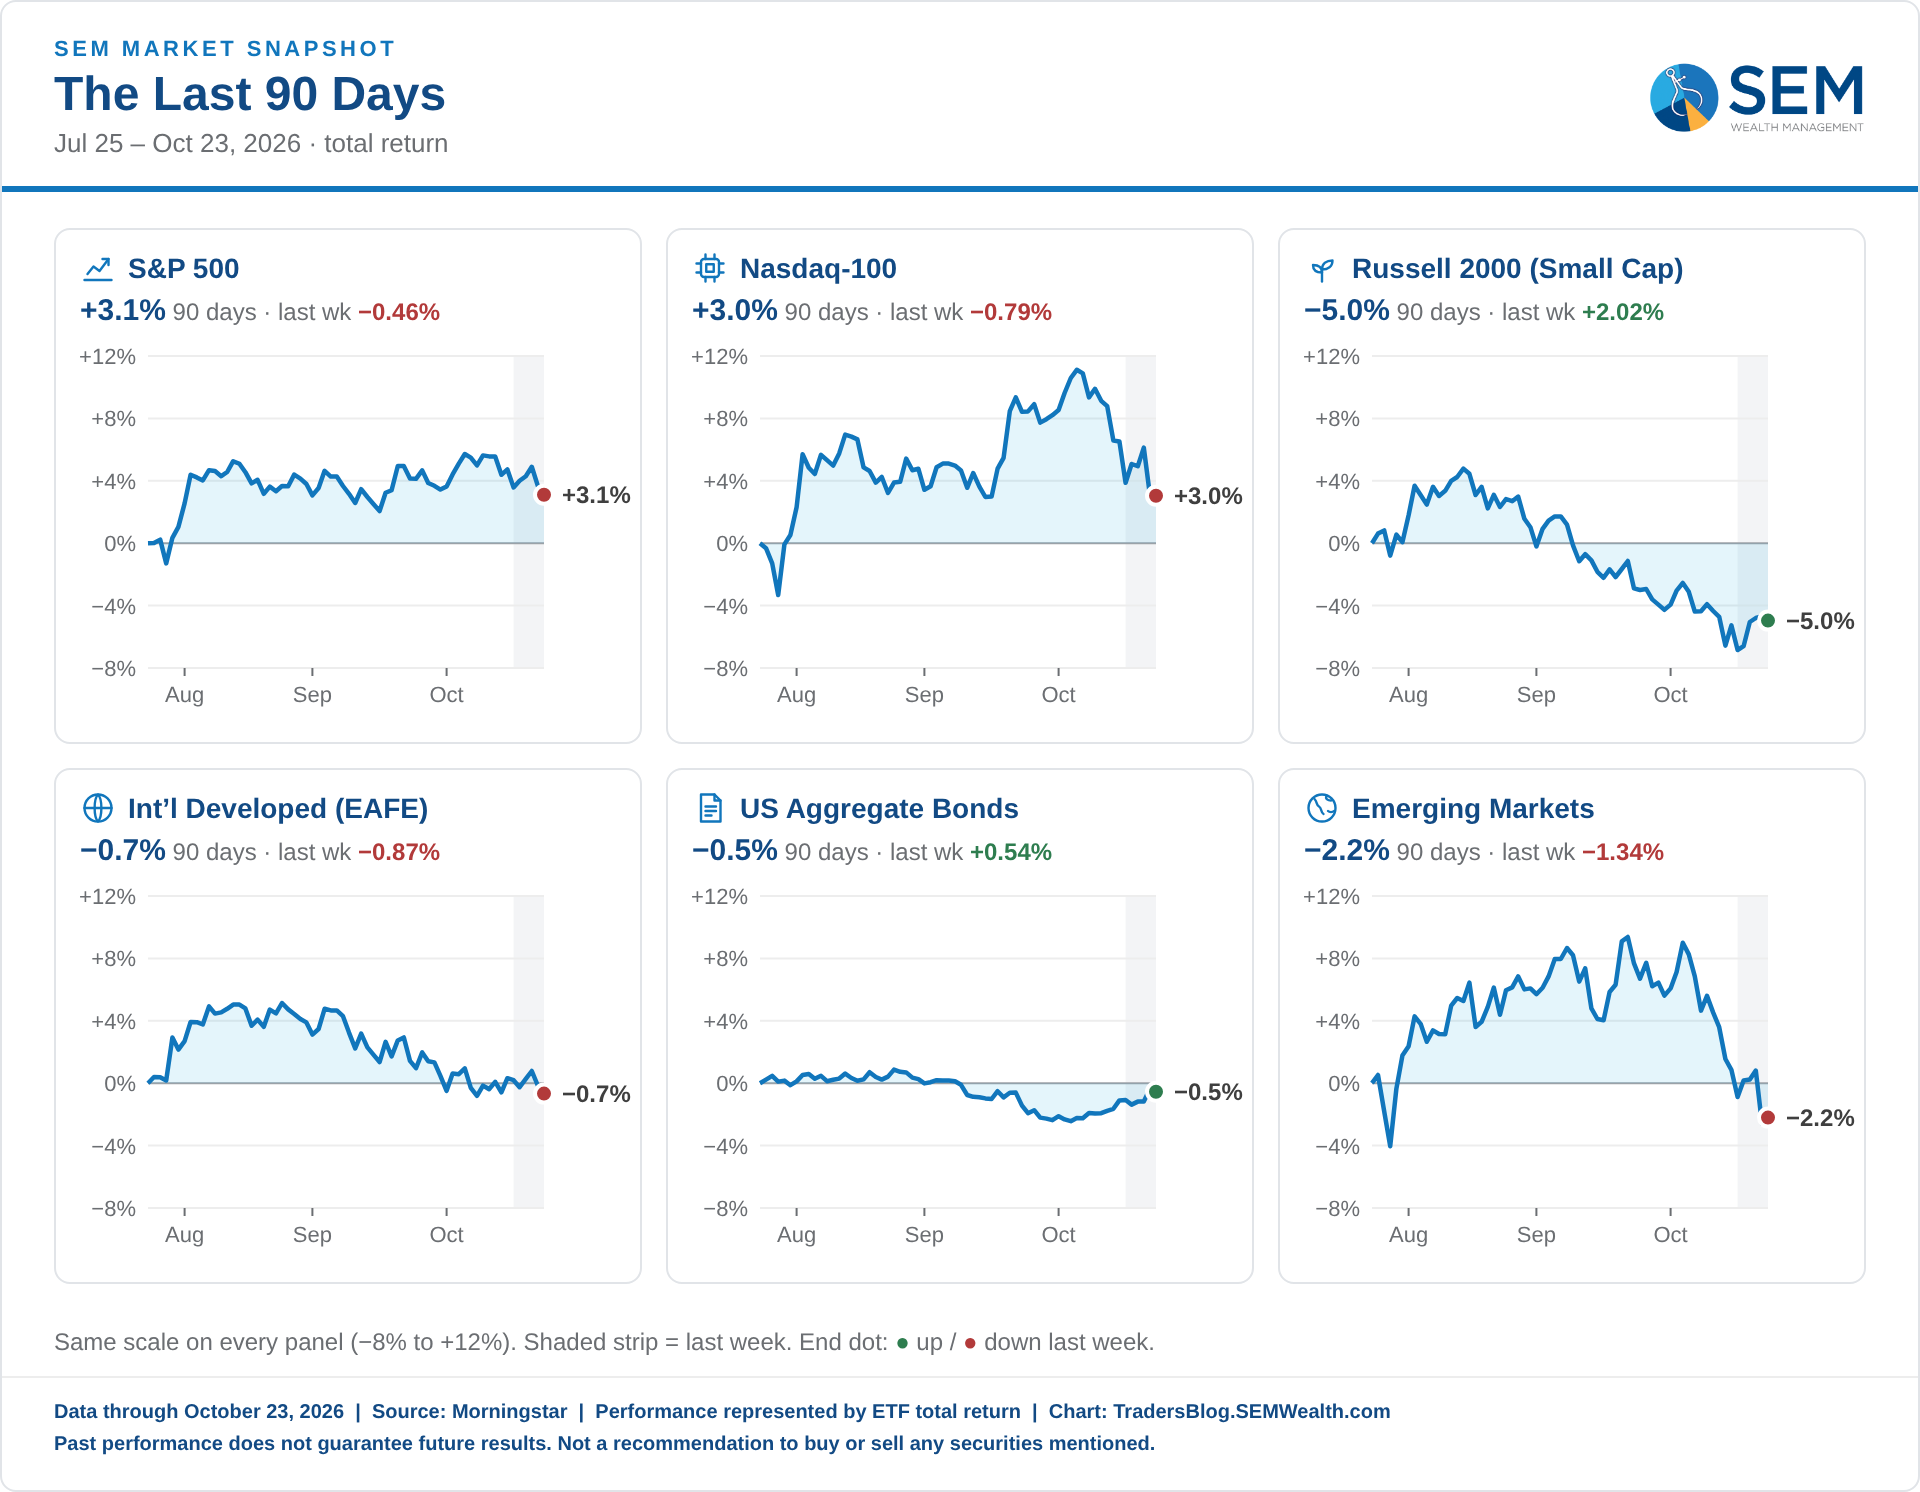
U.S. stocks were mixed last week, as the S&P 500 fell 0.5%, the Nasdaq-100 fell 0.8%, the Dow edged up 0.4% and small caps (Russell 2000) rose 2.0%. Value beat growth and small caps outpaced large caps, with small value best in the style box (+2.1%) and large growth worst (−1.5%); energy led the sectors (+1.6%) and communication services lagged (−4.3%). Elsewhere, bonds rose 0.5%, gold dropped 4.2%, oil jumped 4.4% and bitcoin was little changed; the S&P 500 is up 12.3% so far this year.
SEM Market Positioning
SEM deploys 3 distinct approaches – Tactical, Dynamic, and Strategic. These systems have been described as 'daily, monthly, quarterly' given how often they may make adjustments. Here is where they each stand.
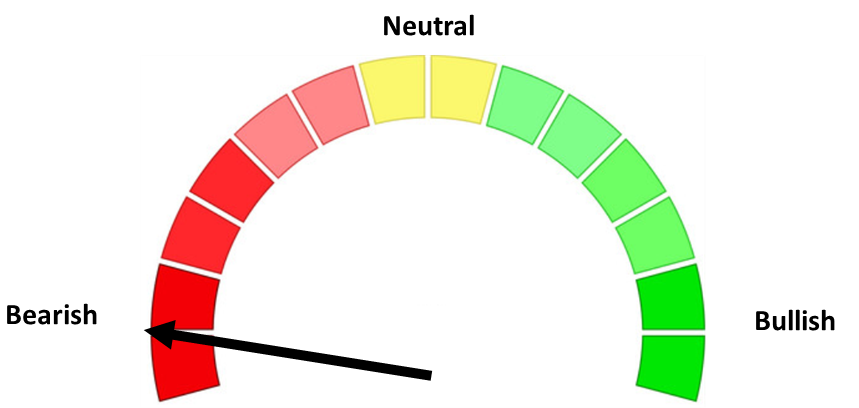
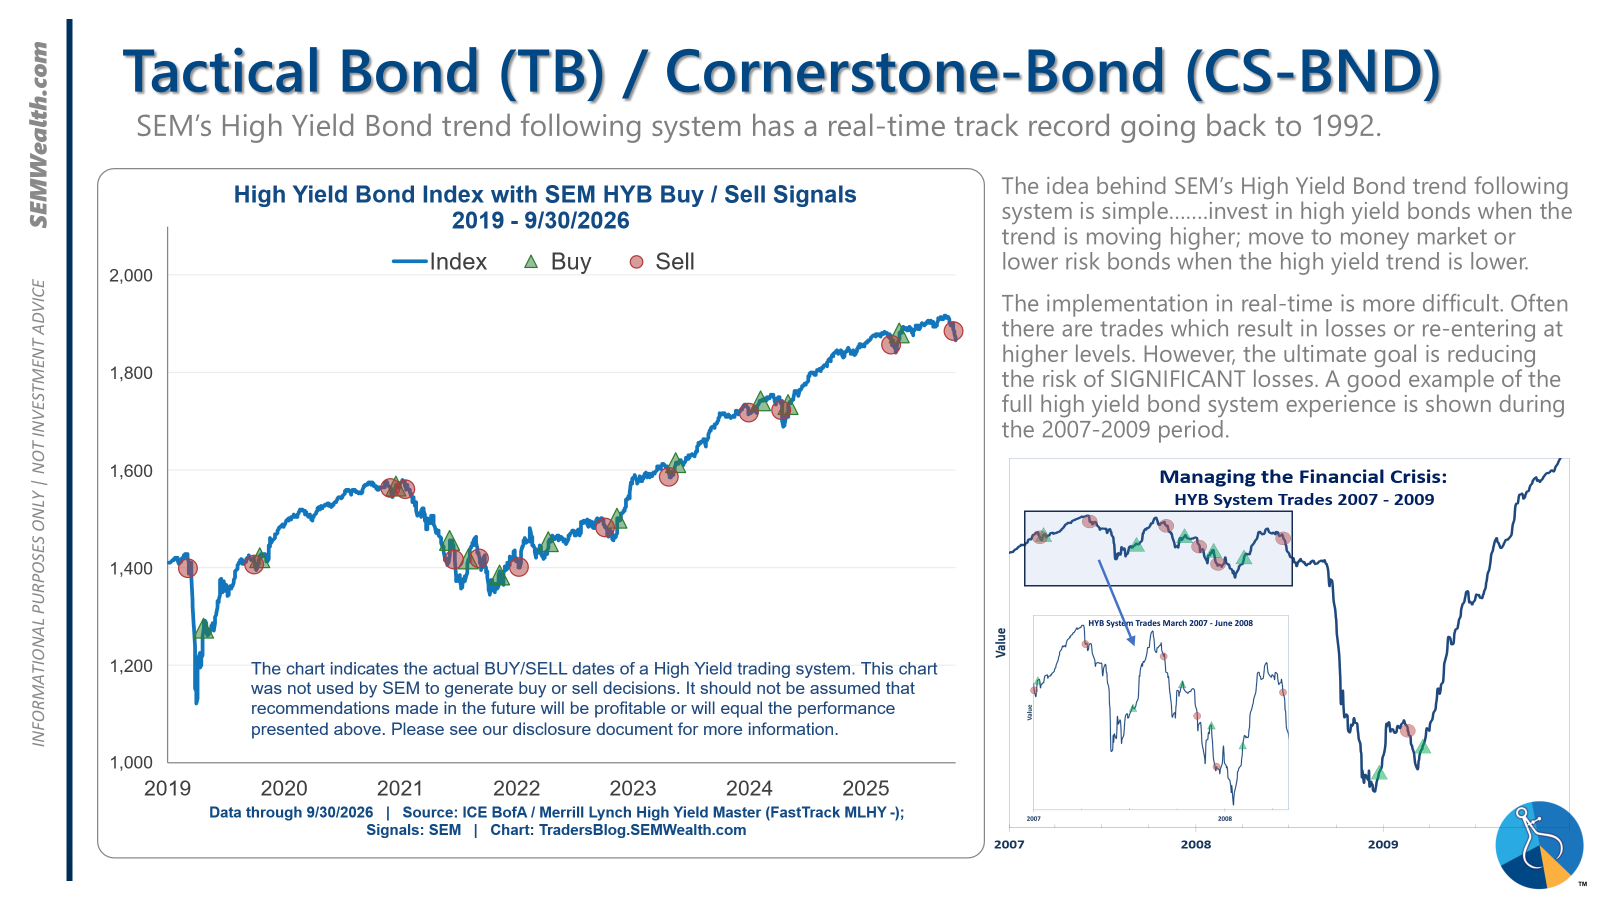
- Tactical = BEARISH (9/24/26) | 100% Money Market / Short Term Bonds (9/24/26) | High-yield trends reversed lower with spreads near historic lows.
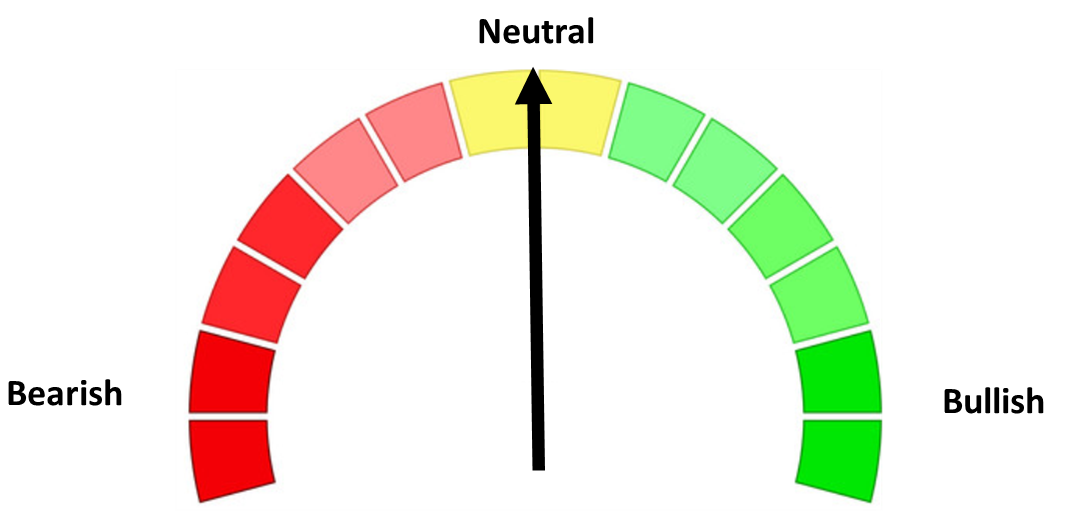
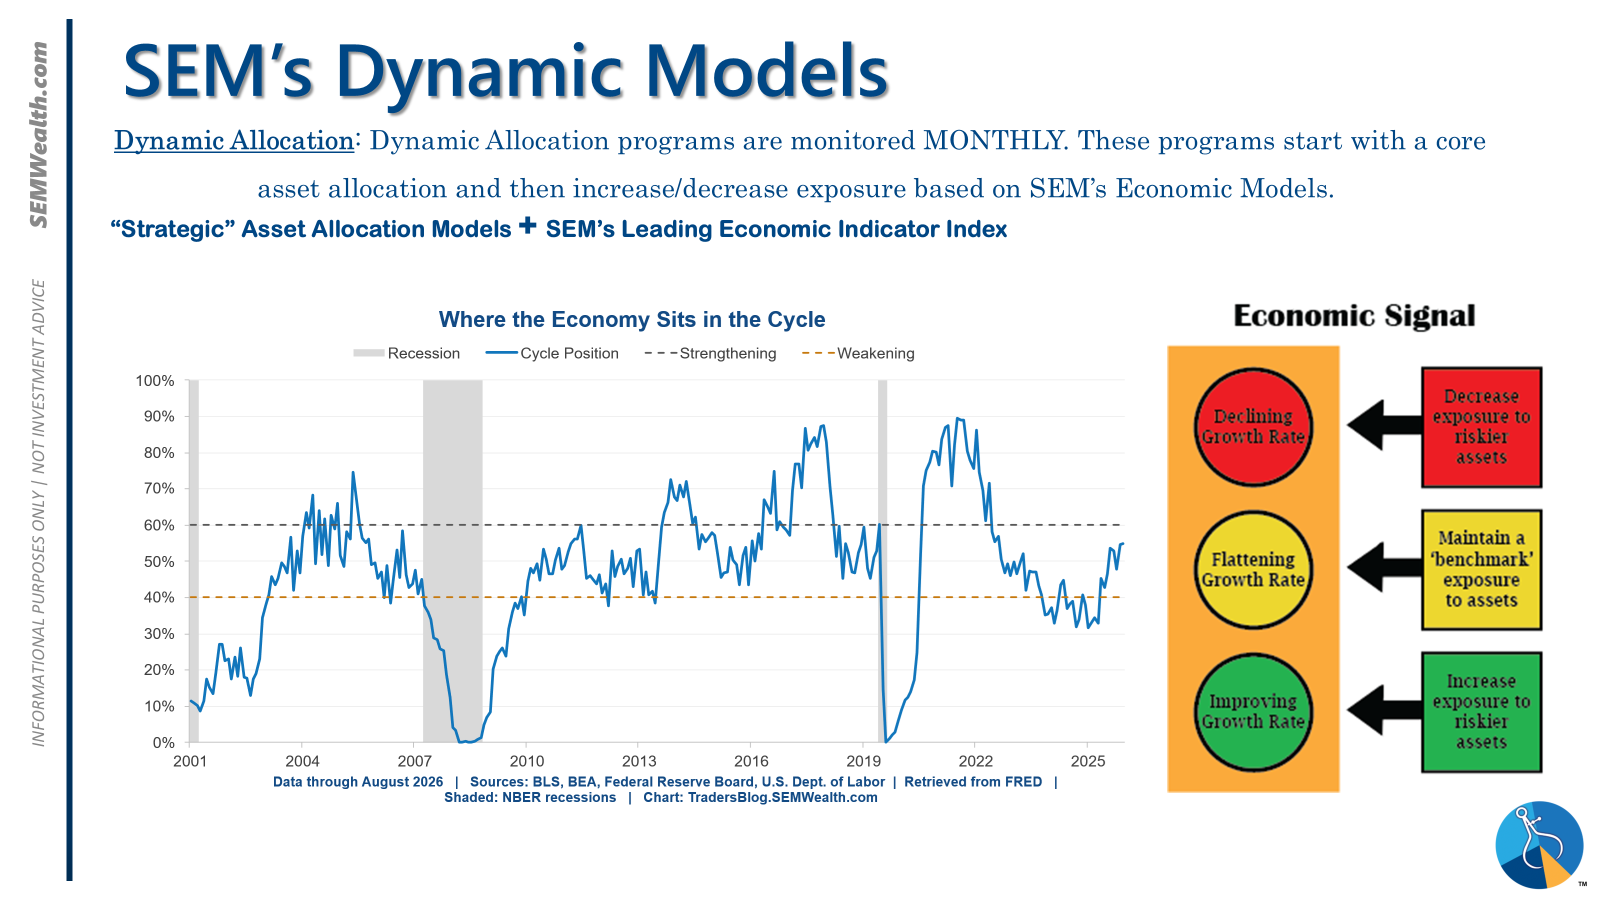
- Dynamic = NEUTRAL (2/15/2026) | "Benchmark" Allocation | Economic model inconclusive
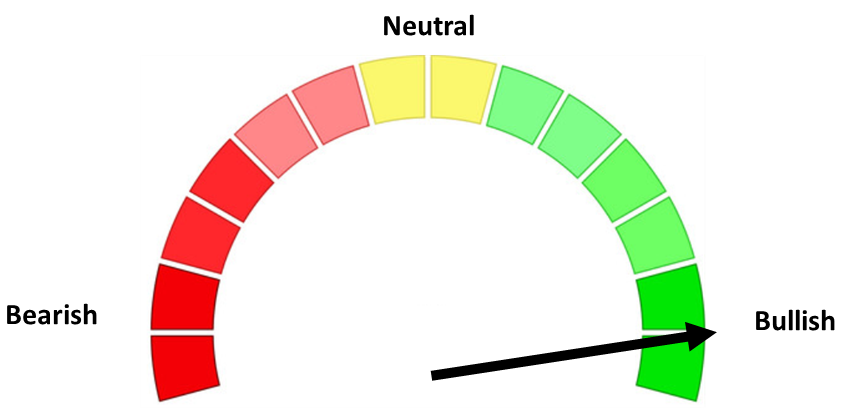
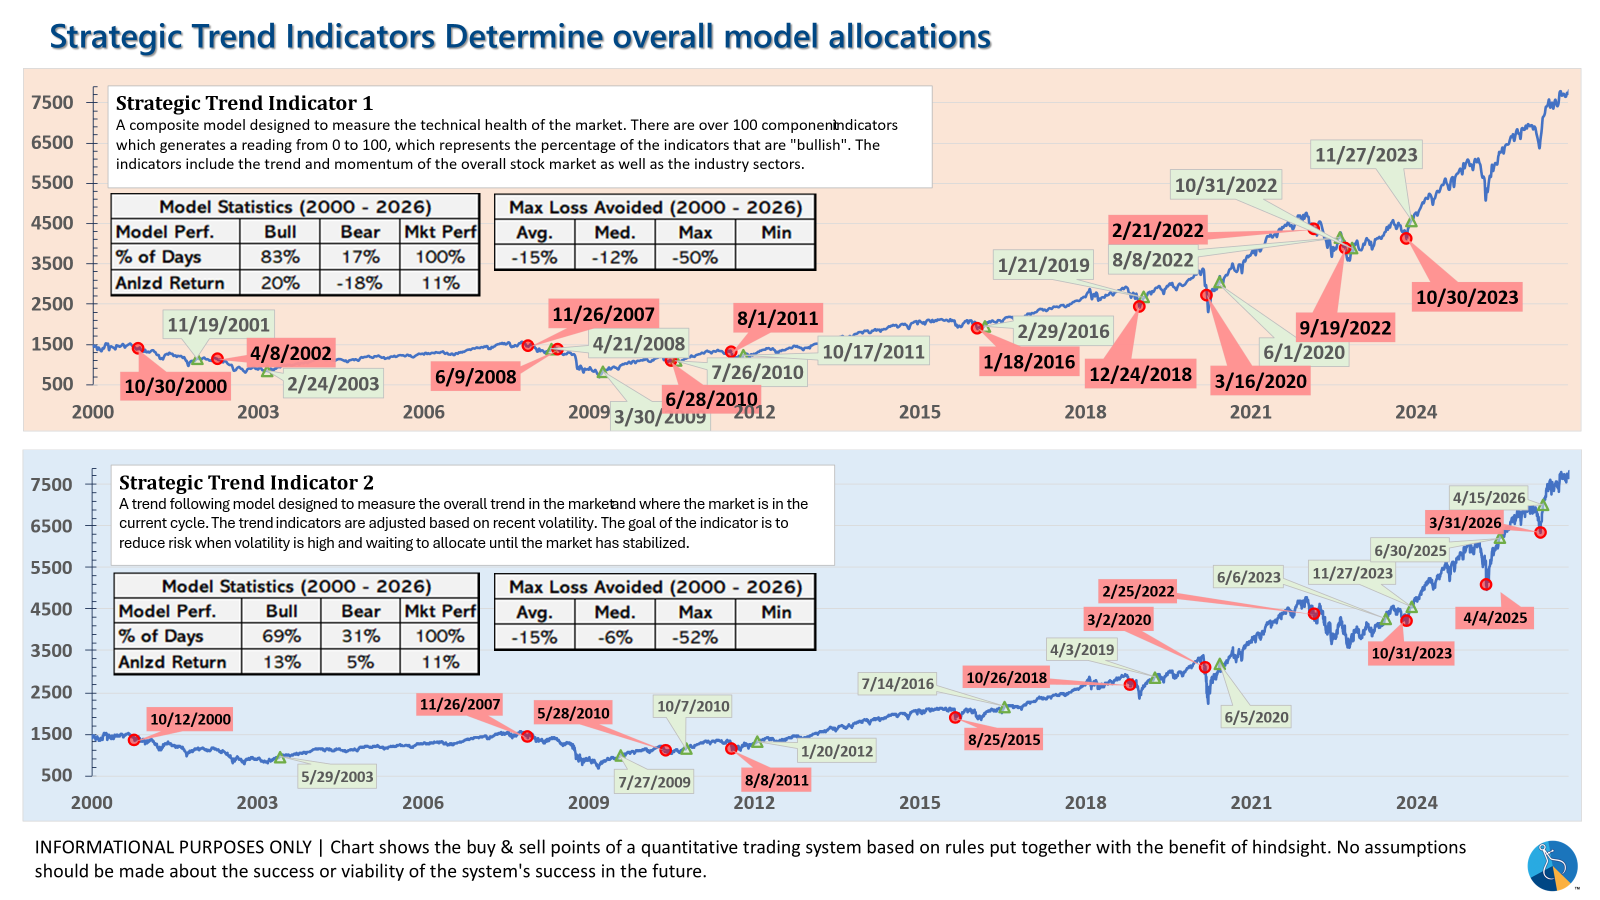
- Strategic = BULLISH (4/15/2026) | V-Bottom projecting "end" of Iran War
Tactical (daily):
- Monitored DAILY
- Models: Tactical Bond, Cornerstone Bond, Income Allocator, Tax Advantaged Bond
- Designed to follow the trends for use in our lower risk models
- SELL Signal issued September 24, 2026 (exiting the buy from April 8, 2026)
Dynamic (monthly):
- Monitored MONTHLY
- Models: All "Dynamic" Models (Income, Balanced, Growth, and Asset Allocator)
- Uses SEM's Quantitative Economic Model
- Designed to overweight riskier assets if economic trend is higher & underweight those assets if economic trend is lower.
- NEUTRAL signal issued February 15, 2026 (following BEARISH signal from July 2025)
Strategic (quarterly)*:
- Monitored QUARTERLY
- Models: AmeriGuard (Balanced, Moderate, & Growth) and Cornerstone (Balanced & Growth)
- Core Component: Quantitative Filter using 4 different time horizons across universe of asset classes
- Trend Indicator: Two different Quantitative Systems monitoring the intermediate-term trend, health of the market, and volatility
- CORE eliminated small cap in AmeriGuard and reduced it in Cornerstone in October 2026; overweight international since October 2025.
- Both TREND INDICATORS are BULLISH following 10% drop and "V-Bottom" reversal in early April
- AmeriGuard & Cornerstone Max DO NOT use the Trend indicator and are always 100% invested in stocks using our CORE rotation model.
The core rotation is adjusted quarterly. To start the 3rd quarter we saw all of our small cap position in AmeriGuard eliminated and the Cornerstone small cap position cut in half. We remain overweight international (at least for these models where the benchmark is 0% international).
The * in quarterly is for the trend models. These models are watched daily but they trade infrequently based on readings of where each believe we are in the cycle. The trend systems can be susceptible to "whipsaws" as we saw with the recent sell and buy signals at the end of October and November. The goal of the systems is to miss major downturns in the market. Risks are high when the market has been stampeding higher as it has for most of 2023. This means sometimes selling too soon. As we saw with the recent trade, the systems can quickly reverse if they are wrong.
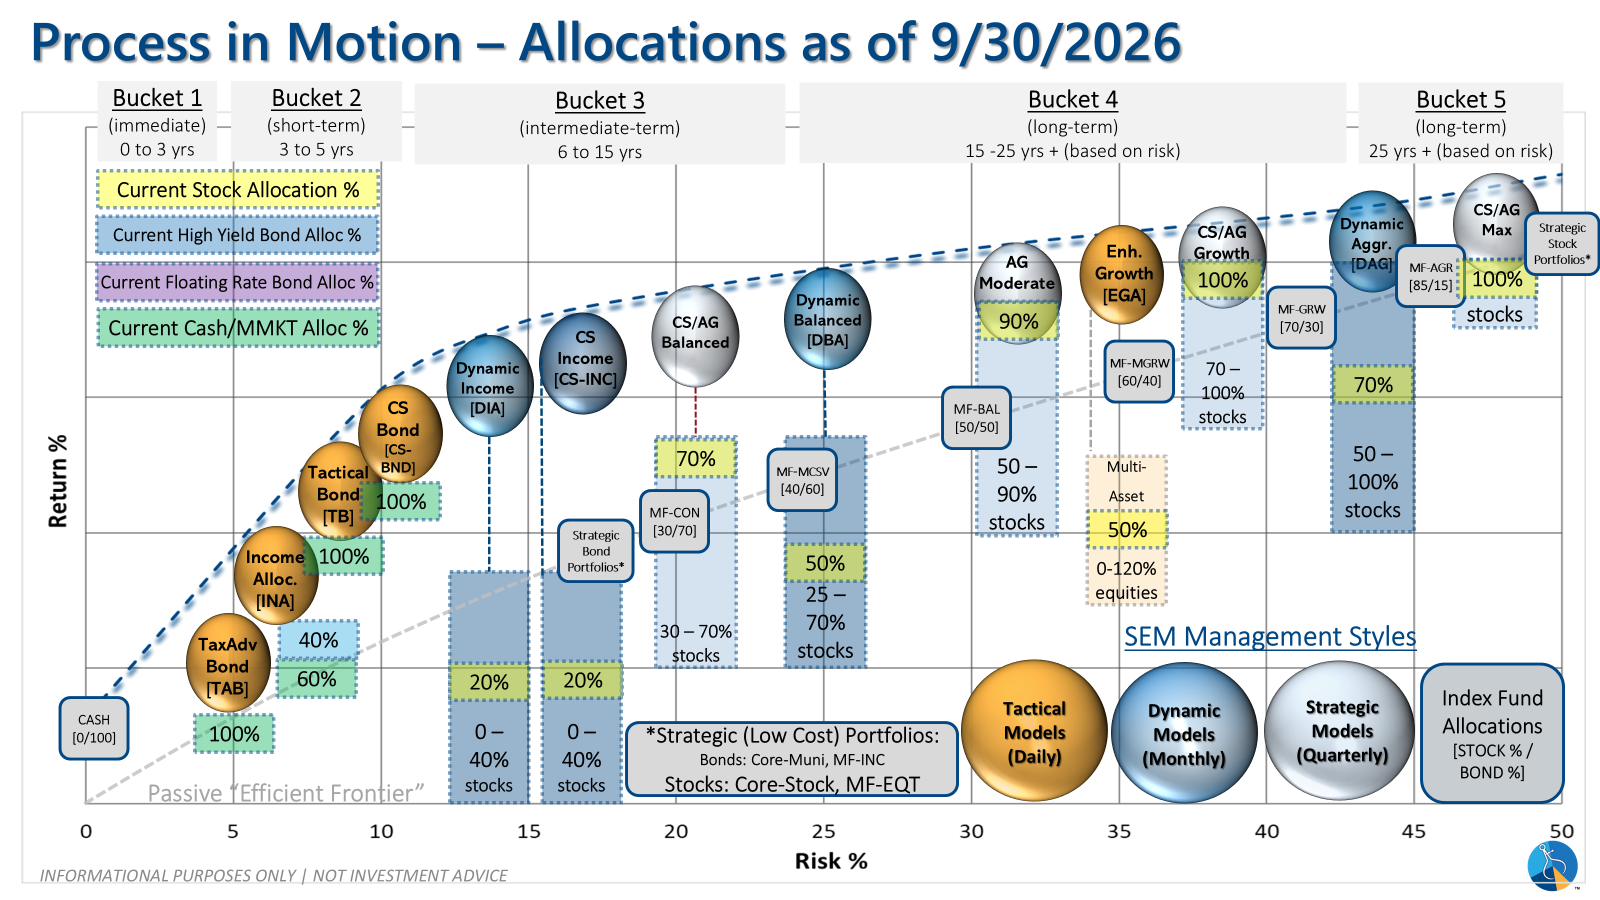
Overall, this is how our various models stack up based on the last allocation change:
Curious if your current investment allocation aligns with your overall objectives and risk tolerance?