I often say, "the market moves in cycles". That is certainly true of the news that drives the markets. When I wrote the newsletter at the end of September, I wrote a rough outline of the themes I wanted to cover each week of October in the blog. That draft seems like a waste of time, because we have so much happening every single week and it all seems important!
Last week had a little bit of everything. Inflation came in hotter than expected, diesel kept climbing, and AI debt worries knocked the stock market around. Something new, at least recently – Long-term interest rates fell! On the surface that doesn't make much sense, so this week I want to connect the dots today. We're also launching our AI Buildout Dashboard, which I've been promising since the summer (which was in my outline, so call that a win!) Here's my (updated) musings for this week:
1.) CPI
September CPI came in at 3.7%, hotter than expected and driven mostly by gasoline. Core inflation (which strips out food and energy) was 2.6%. You'll hear some people say "see, core is fine." Remember, core excludes the two things we all SEE and FEEL every week. Headline is what we pay.
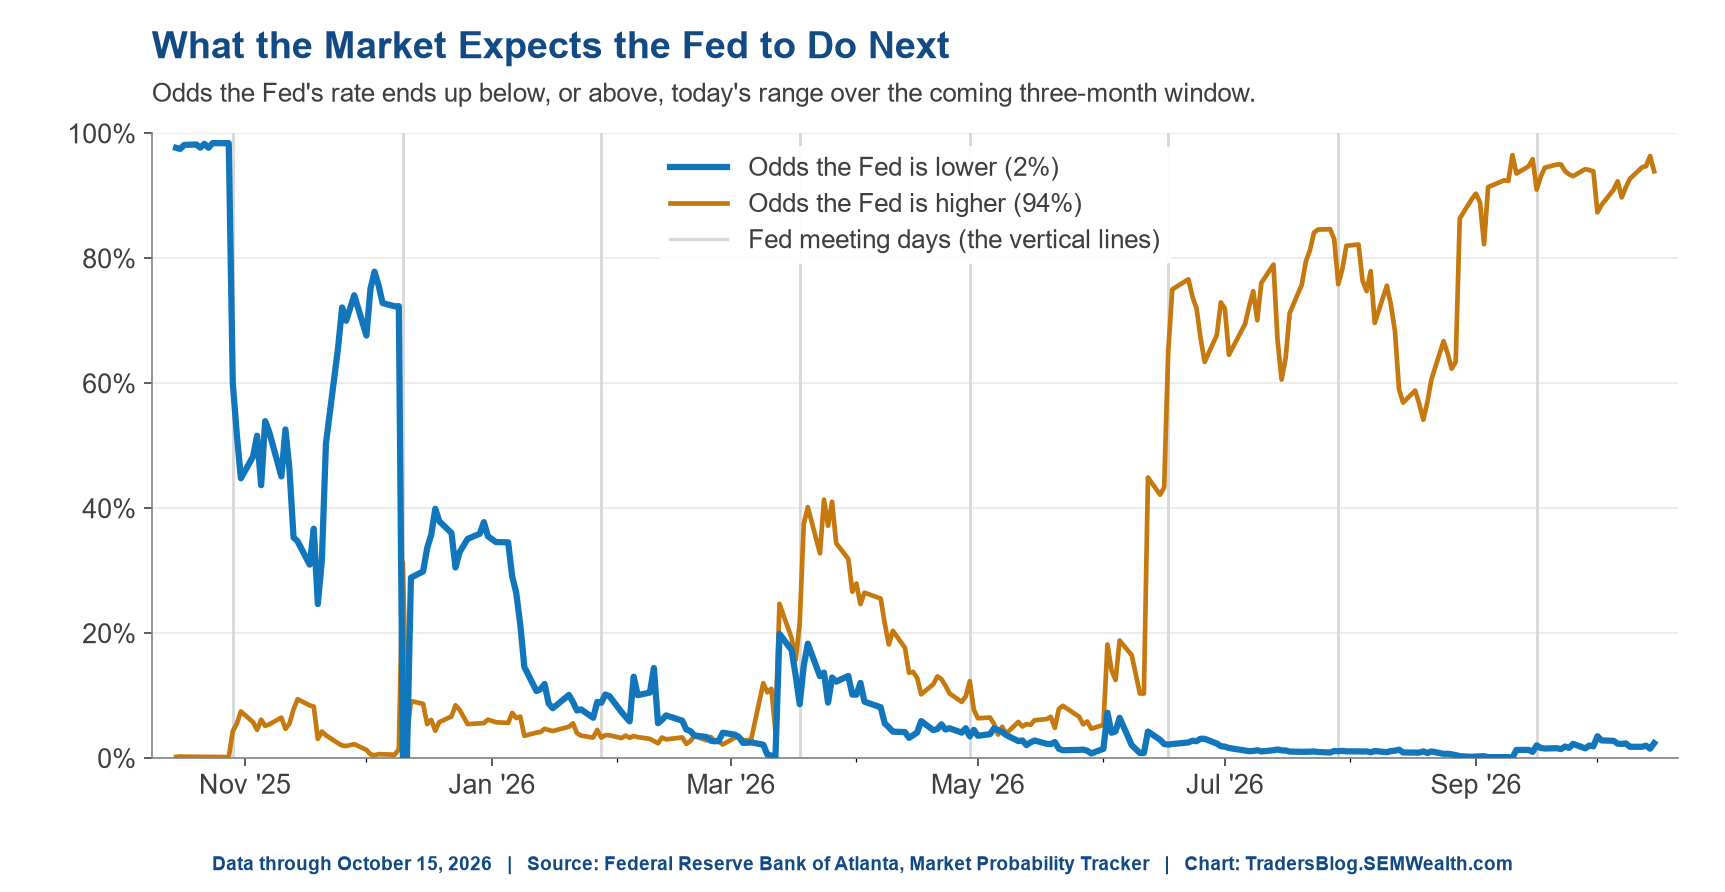
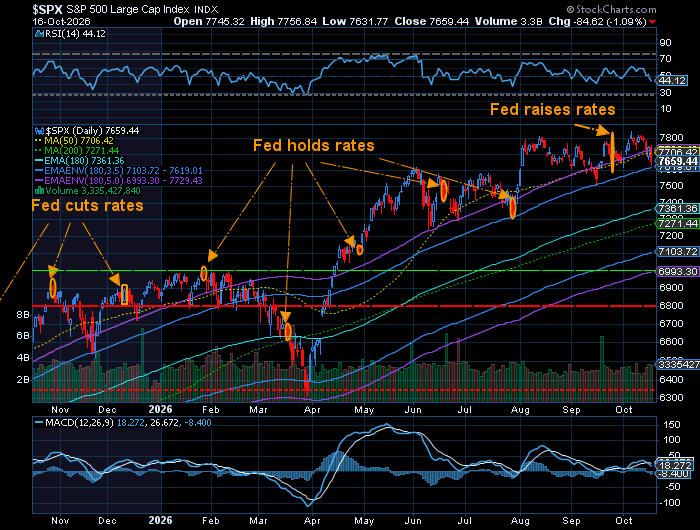
Going into the week, another Fed rate hike in October looked like a long shot. After CPI, we called it a toss-up on our advisor call. That was an over-reaction by the market as by the end of the week the market is still saying there's a 73% chance the Fed holds rates next week. The bigger call is for December, where the odds sill say there is a 90% chance the Fed moves rates higher.
2.) Energy Costs
At our advisor update last week, Josh asked a great question: why is diesel (and heating oil, which is pretty much the same thing) up SO much more than gasoline? Is someone gouging somebody? Given the impact this may have on the economy (and sentiment), it's worth looking into.
Put simply, the higher price of oil added about 80¢ to every gallon of both fuels. Gasoline added about another 60¢ on top of that. Diesel added about another $1.60.
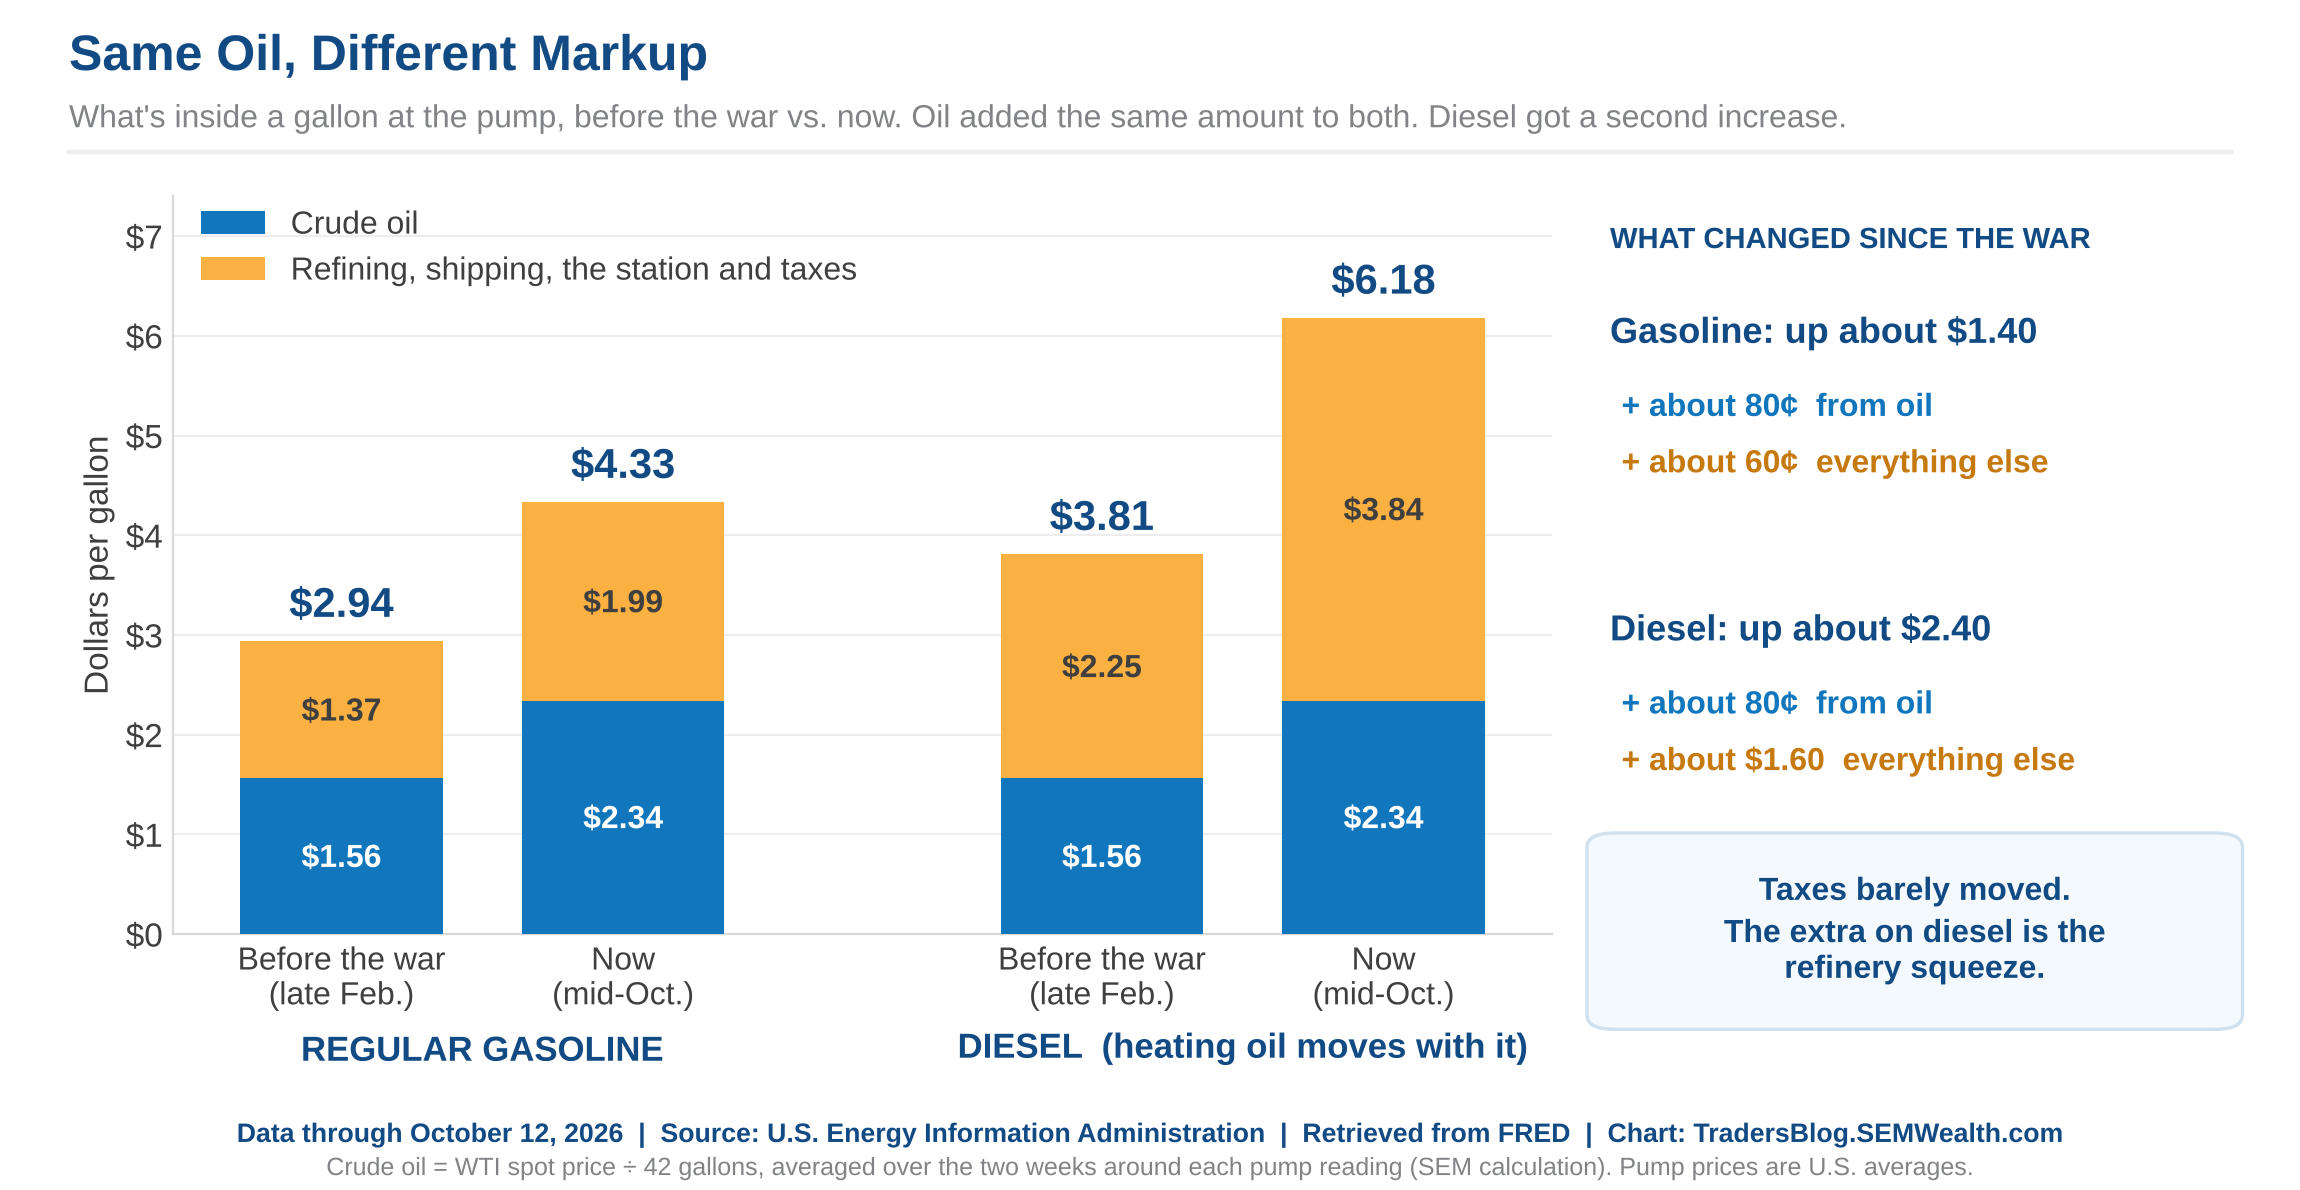
That extra mark-up on diesel is the refinery squeeze. A barrel of oil only makes so much diesel and heating oil (about 11 to 13 of its 42 gallons), and with distillate inventories at the lowest level for this time of year since 1982, refiners can charge a lot more for it. The diesel refining markup is running around $108 per barrel. The normal before COVID was about $23.
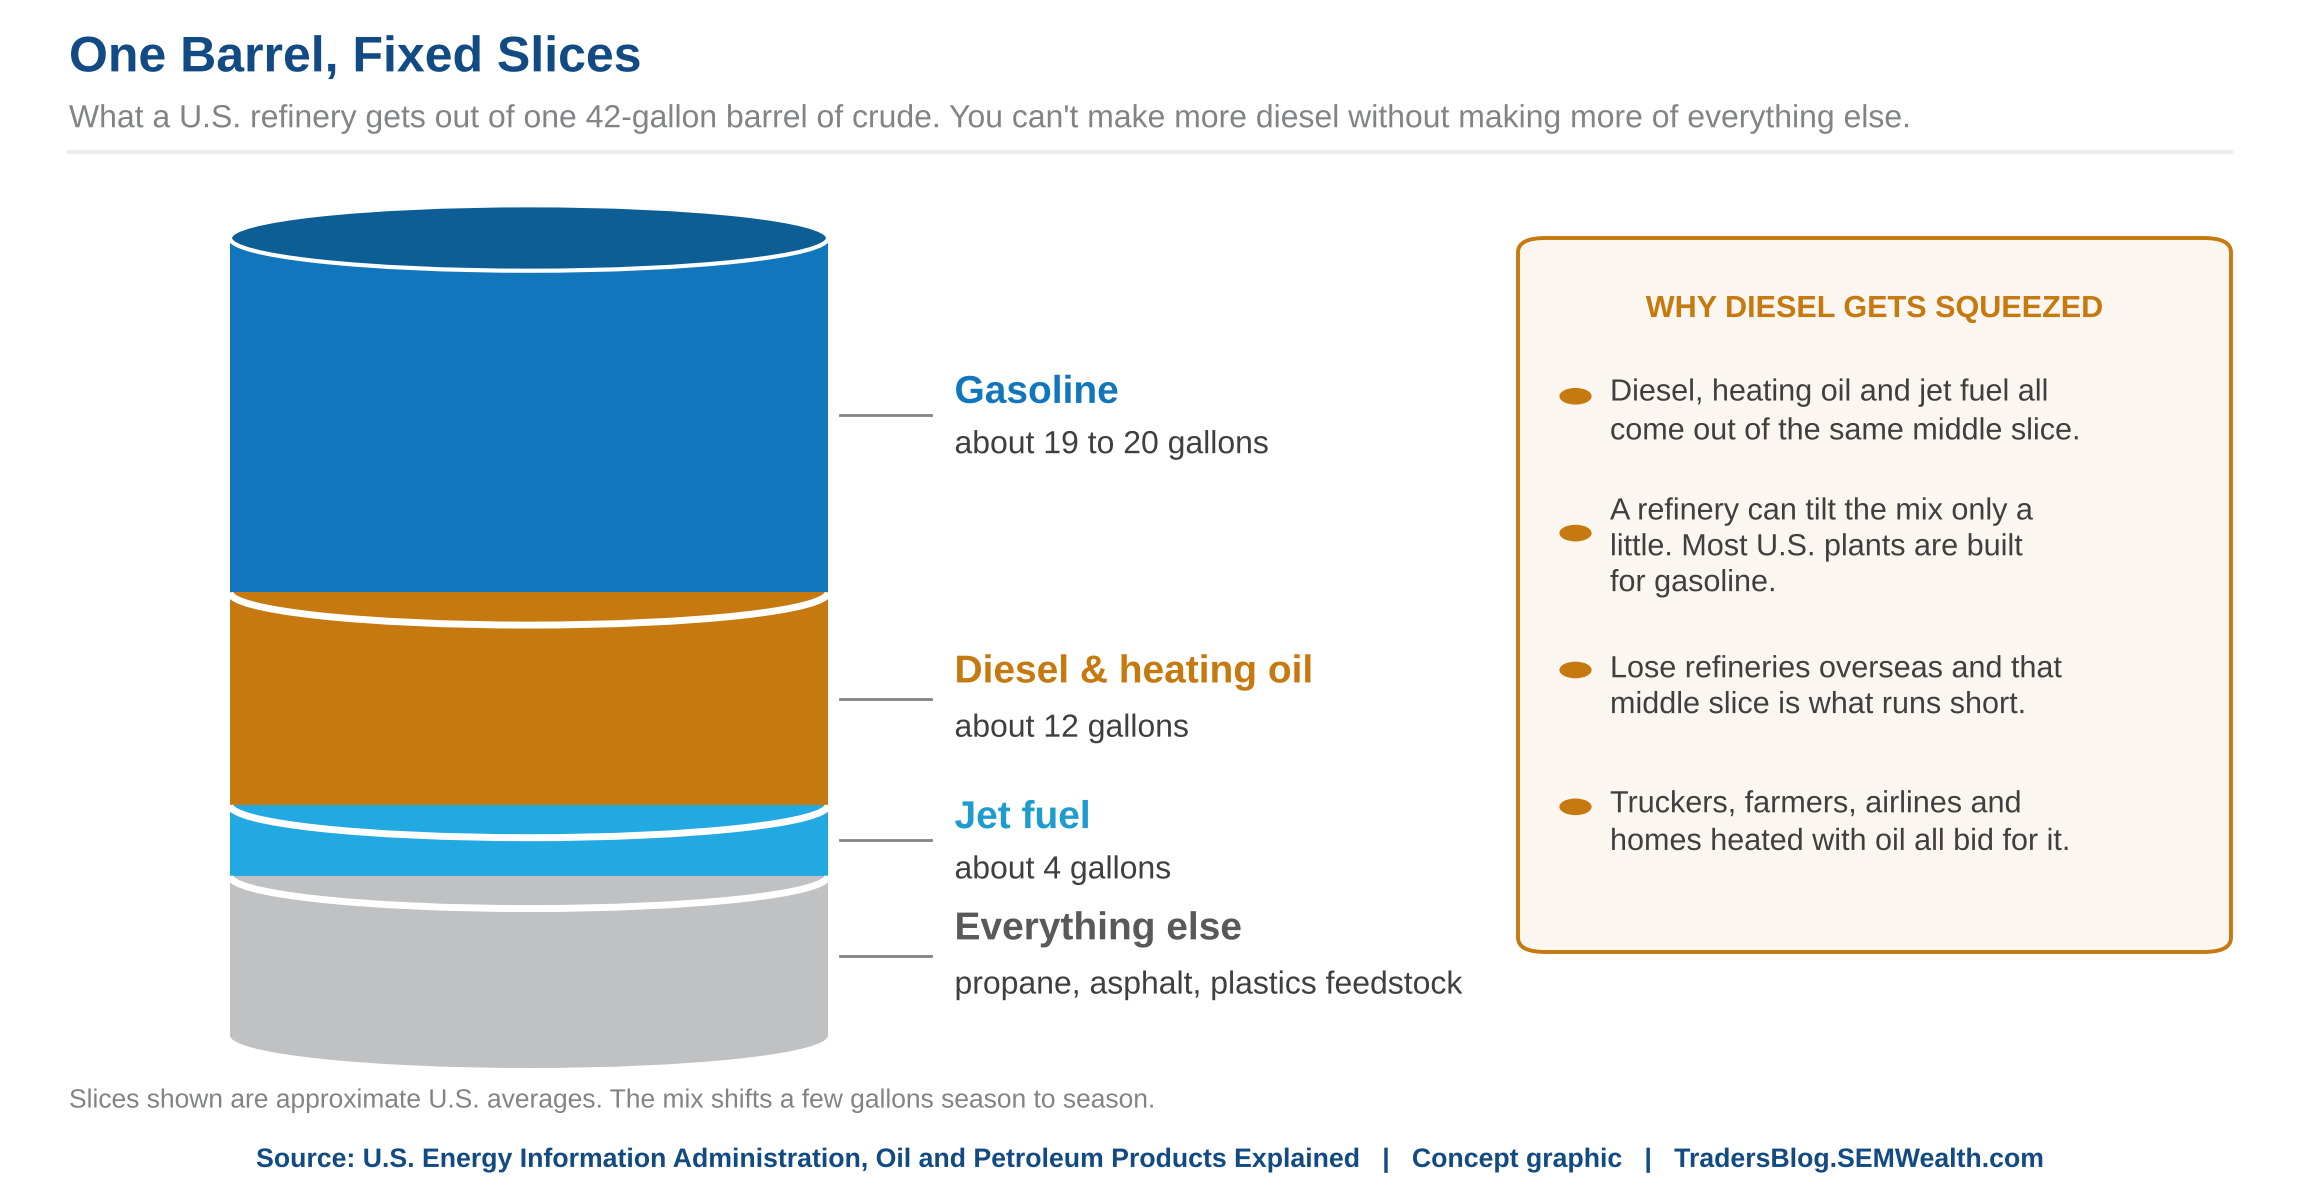
So is someone gouging? Someone IS making a lot more money: the refiners. But that fat margin is also the price signal that pulls in imports and pushes refiners to make as much diesel as possible. We'll know more when the big refiners report earnings over the next two weeks.
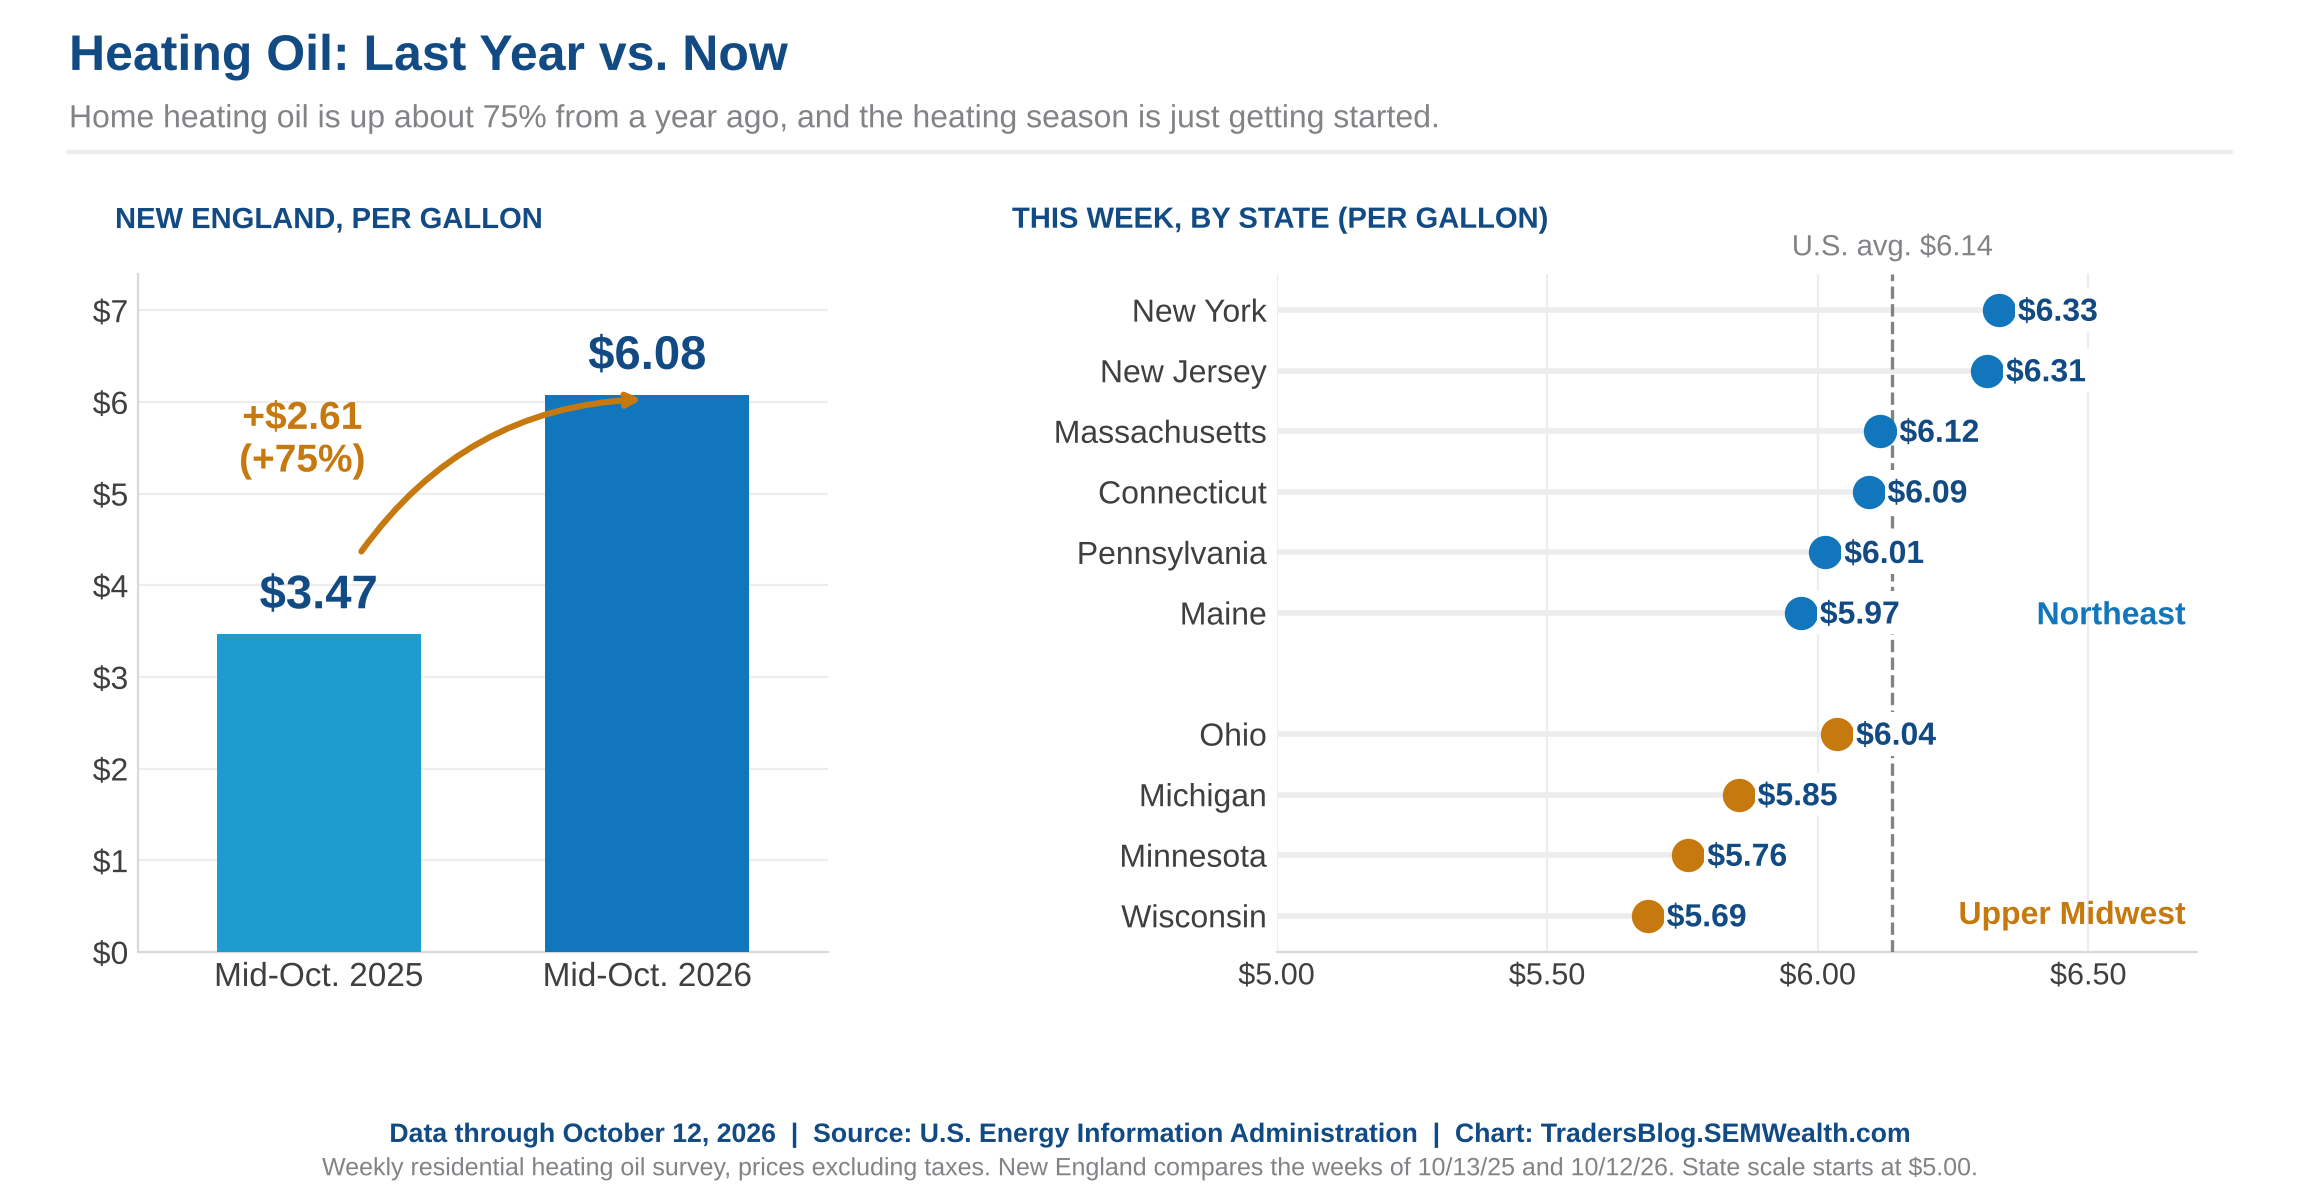
Why does diesel matter so much? Gasoline is the inflation we see at the pump, and it tends to slow spending. Diesel moves almost everything we buy, and it's going to filter through to every part of the economy. As we head into winter with heating oil around $6 a gallon in some parts of the country, this isn't going away soon.
3.) AI
Last week the AI story moved from the stock market to the bond market. Chip stocks lost roughly a trillion dollars in value Thursday and Friday, mostly because of worries over CoreWeave.
CoreWeave rents out computing power to the big AI companies and has borrowed heavily (about $50 billion in debt and leases) to do it. Its bonds crossed into "distressed" territory on Thursday before closing just under that line Friday at about 80 cents on the dollar (a 14.7% yield)
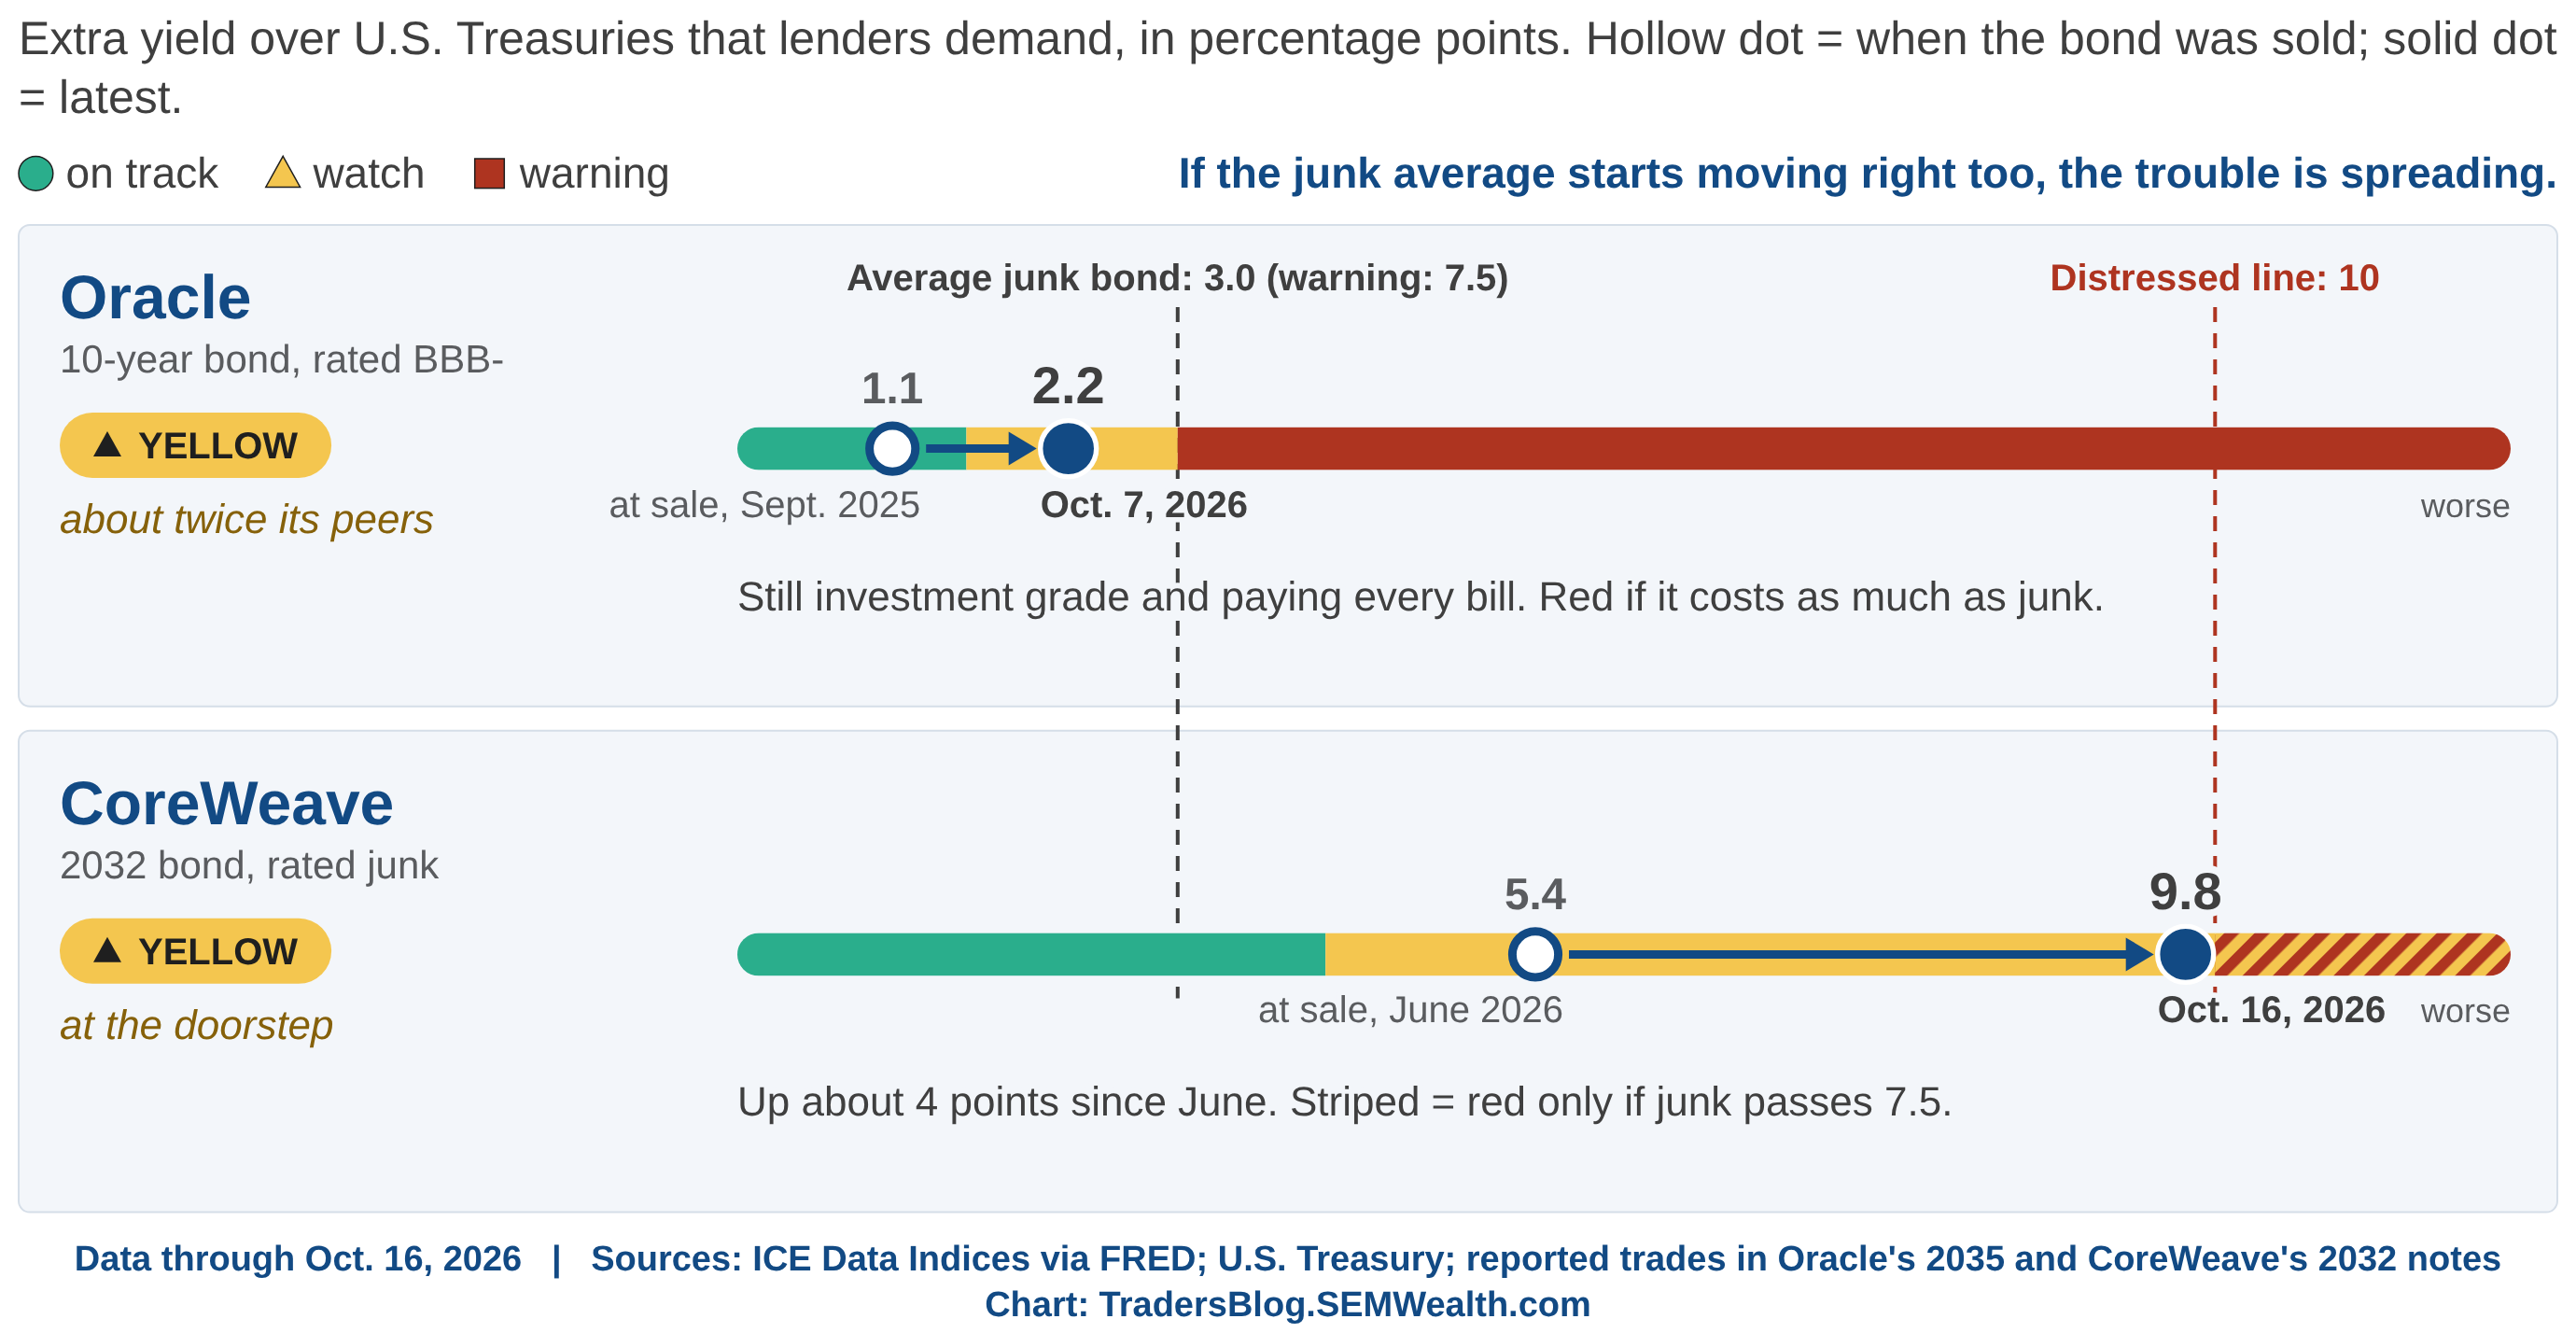
The line that matters most on that chart is the average junk bond. So far it has barely moved. The fire is in one room of the house. The other room I'm watching is the debt tied to Meta's huge Hyperion data center in Louisiana (financed with Blue Owl). Those bonds are down about 9 points from where they started, although most of that is from higher interest rates, not lenders getting nervous. Meta, Amazon and the other big spenders are still investment grade.
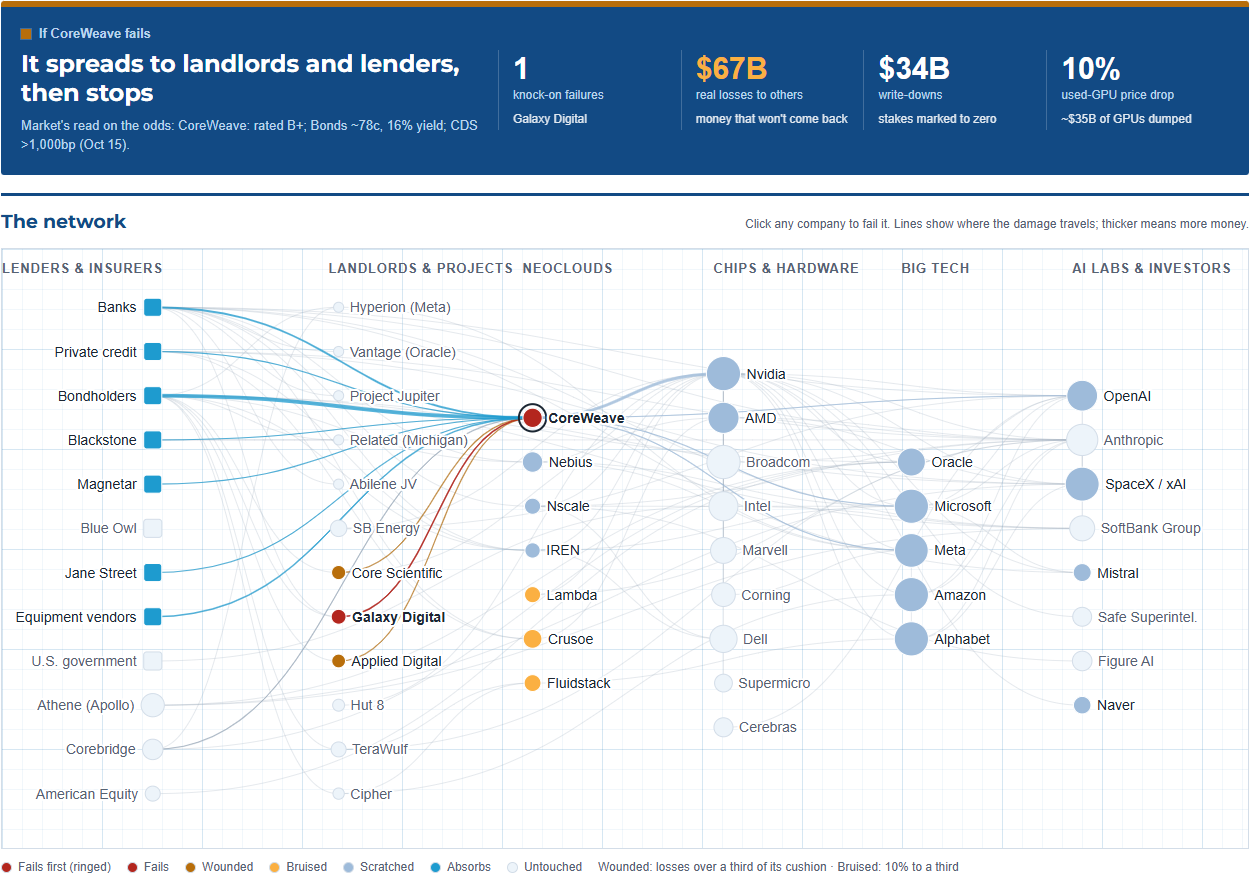
After the CoreWeave bonds started selling off on Wednesday, George said, "wouldn't it be cool if we could have a scenario tool that would look at the links between the different companies in the system and what happens if one fails. We already had most of the data in our research notes to write the "Everchanging AI Landscape" research report, the problem was a.) verifying the data, b.) finding ways to keep it updated, c.) making sure we understood the relationships, and d.) actual building the tool. So on Wednesday night I spent a good 5 hours working on this, continuing into the morning on Thursday and then again late into the night on Thursday.
Keep in mind this has no impact on how we manage money and won't make its way into our models, which is why I chose to use "off work" hours to work on it. (Full disclosure: Because I'm such a nerd, I had a blast working on this and it's generated even more ideas of things I want to try.)
The tool will live inside the "Everchanging" report at the top of the page, but is linked through the image below. Check it out if you're curious.
Is AI driving up building costs?
Back to inflation.......I'd heard building costs were elevated due to the AI buildout and have repeated that at times. The data shows it's more nuanced than that.
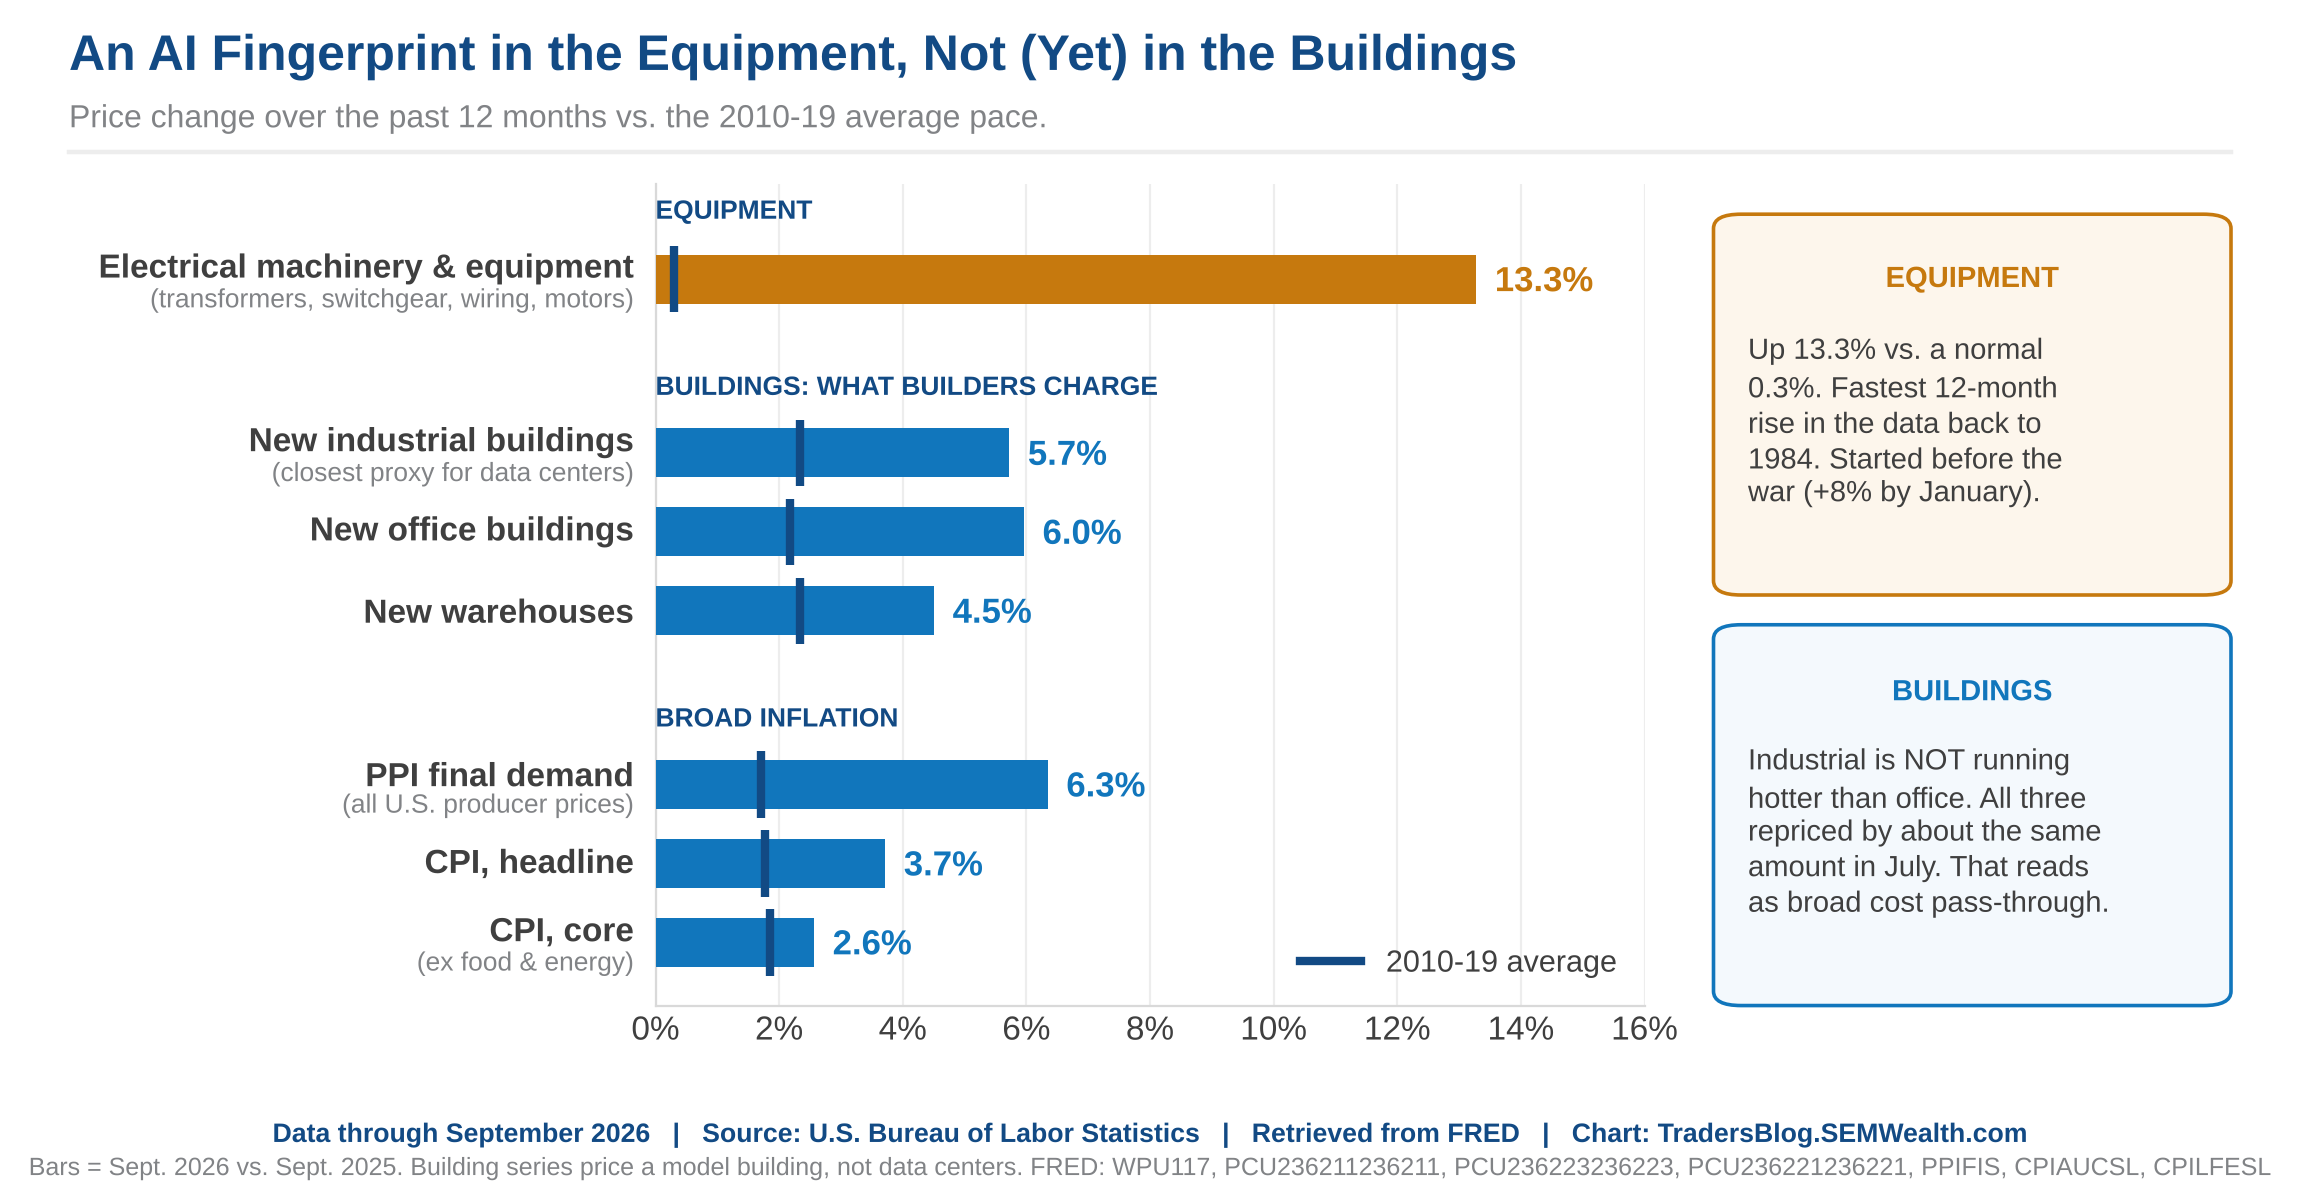
The AI "fingerprint" shows up in electrical equipment (the transformers, switchgear and wiring a data center needs). Those prices are up 13% over the last year, the fastest rise on record going back to 1984. Normal is about 0.3% a year.
It does NOT show up in what builders charge. Industrial buildings (the closest thing to a data center in the data) are up 5.7%, no faster than offices at 6.0%. And the materials story is mostly steel, which is up 34% since January 2025, largely due to tariffs. Commercial building costs are rising only a little faster than residential.
So AI is adding to inflation, just not in the place I expected. It's in the equipment, not the buildings.
The AI Buildout Dashboard is live
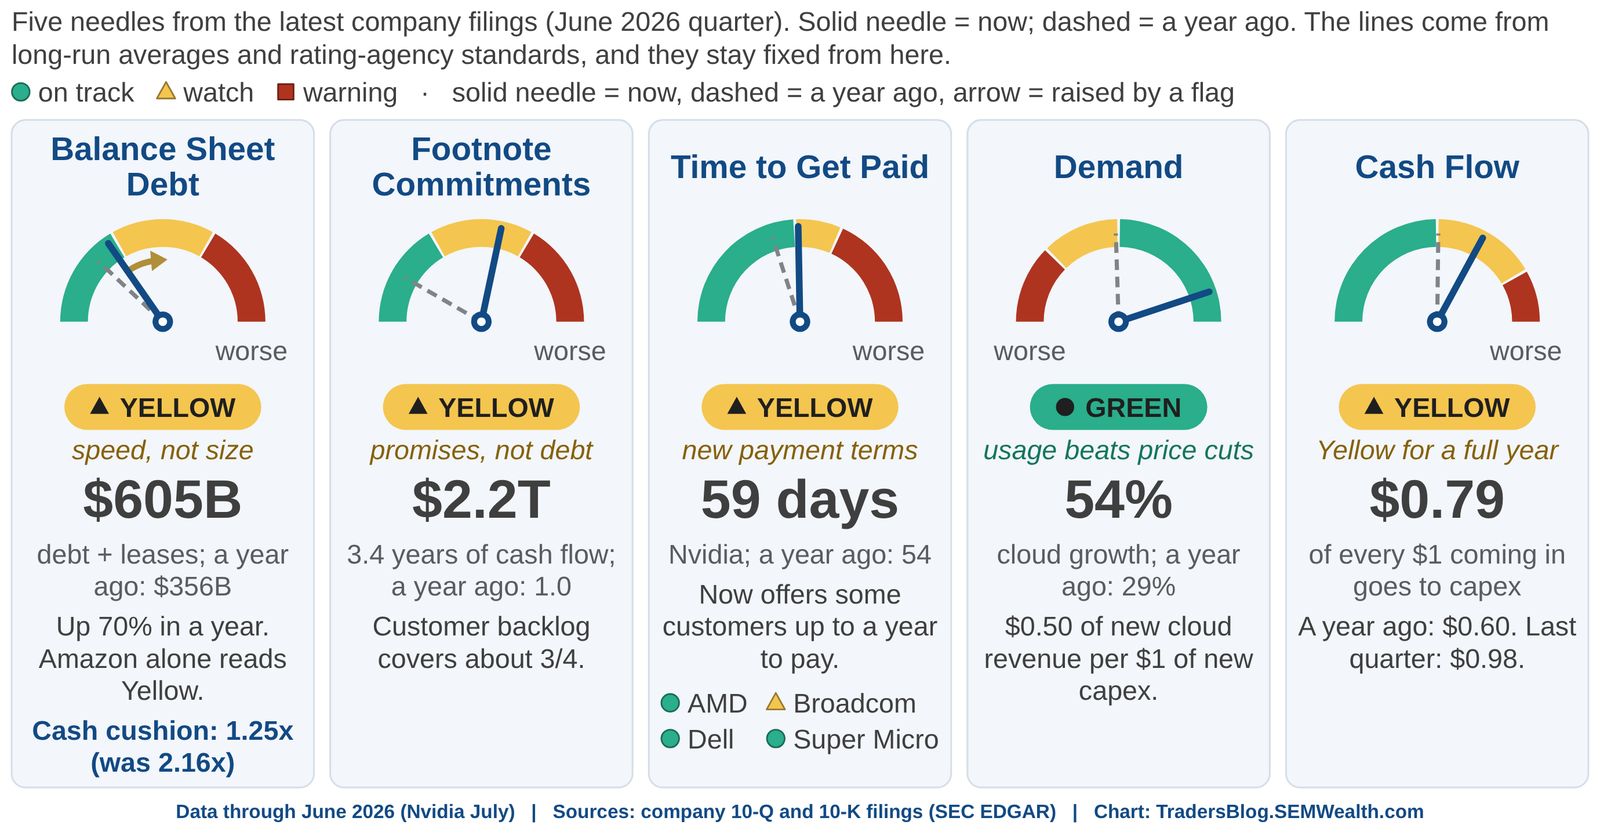
We launched five gauges to track the AI buildout using the four biggest spenders' own filings. Four read Yellow (watch), one reads Green, and none are Red. Put simply, things are stretched, but nothing is breaking. The full breakdown and every chart are in the latest update to The Everchanging AI Landscape (click on the dashboard for the write-up and additional data). We'll update it after the big tech companies report over the next few weeks.
4.) Interest Rates & the Fed
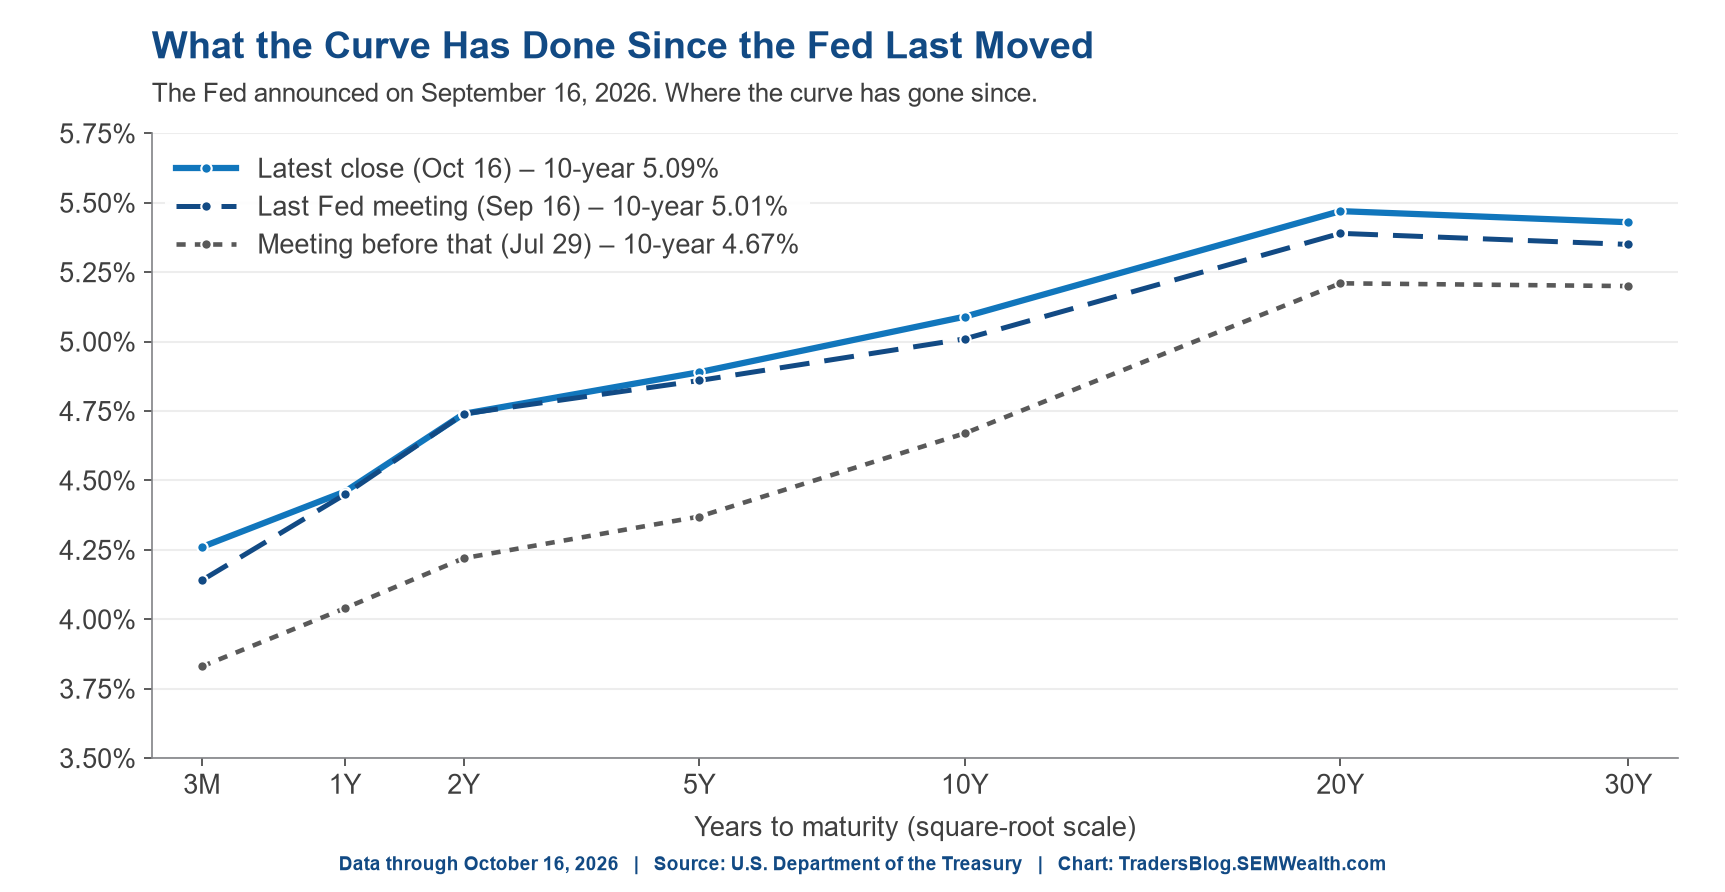
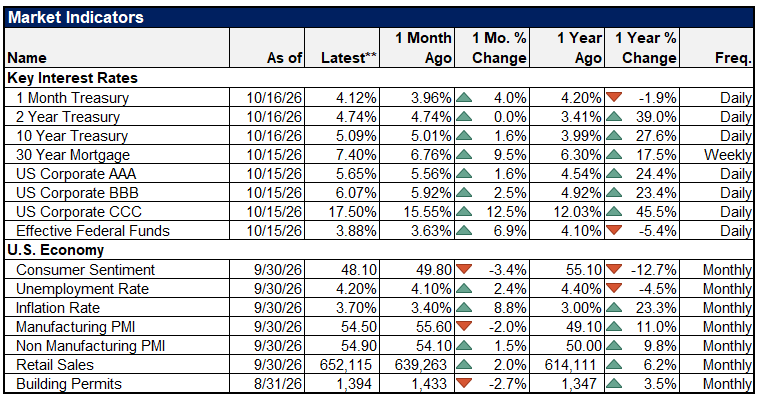
Here's the part that confuses people. With a hot CPI and the Fed more likely to raise rates, you'd expect interest rates to go UP. Instead the 10-year Treasury fell from 5.24% to 5.09%.
As we've been discussing since the summer, the 10-year is made up of inflation expectations and the "real yield." Inflation expectations didn't move (2.33% to 2.35%). The ENTIRE drop came from the real yield.
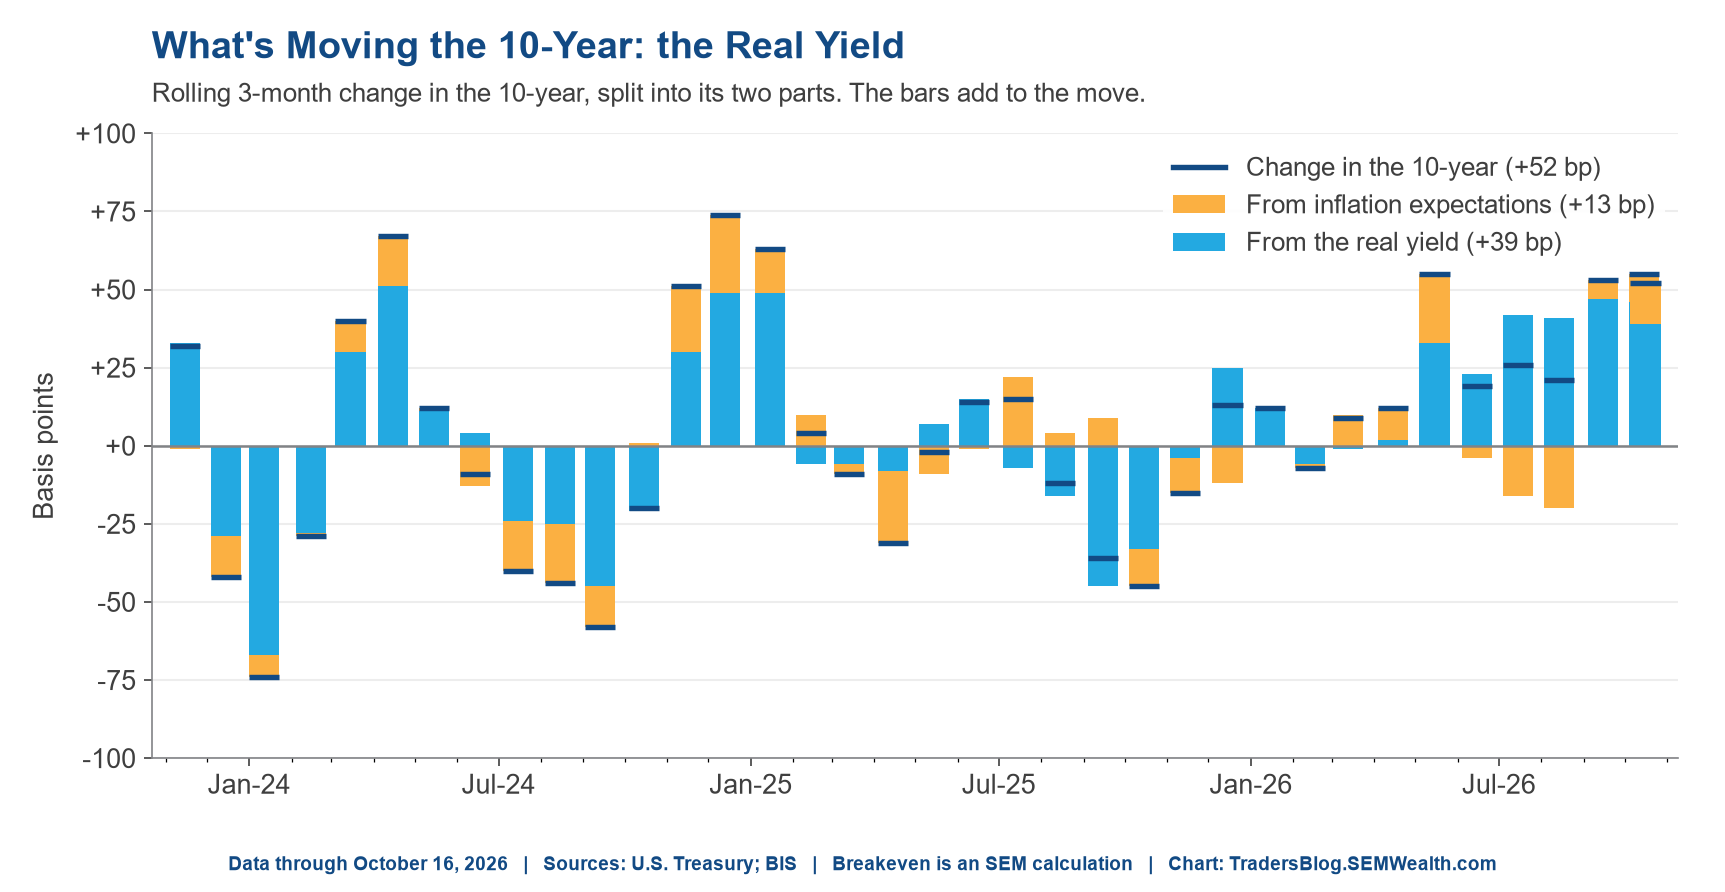
Two things drove that. First, money left AI stocks and AI bonds and went into the safety of Treasuries. Second, and more important, if the AI buildout has been carrying a big part of economic growth, then any doubt about whether it can be paid for means slower expected growth, and that's what the real yield reflects.
Meanwhile short-term rates barely moved. The 2-year actually fell a bit (4.80% to 4.74%), even as the odds of a Fed hike went up. I know my call that a Fed hike would bring long-term rates down hasn't worked so far. This week rates did fall, but for different reasons. As I said before, we'll grade that one after the October 28 meeting.
What We're Watching
- October 28: the Fed
- October 29: Q3 GDP (our model says right around 4%)
- Late October: Microsoft, Alphabet, Meta and Amazon earnings (our first dashboard read is planned for the 11/2 blog)
- Daily: CoreWeave and the average junk bond
None of our models took action last week. Our high yield trend following systems were already in "cash" (money market), our economic model remains "neutral", and the core rotation system inside of AmeriGuard and Cornerstone eliminated/reduced small caps the week before.
Election Update
By: Cody Hybiak
Make sure you check out last week's post which looked at the current Congressional maps and what the polls are saying.
 Cody Hybiak

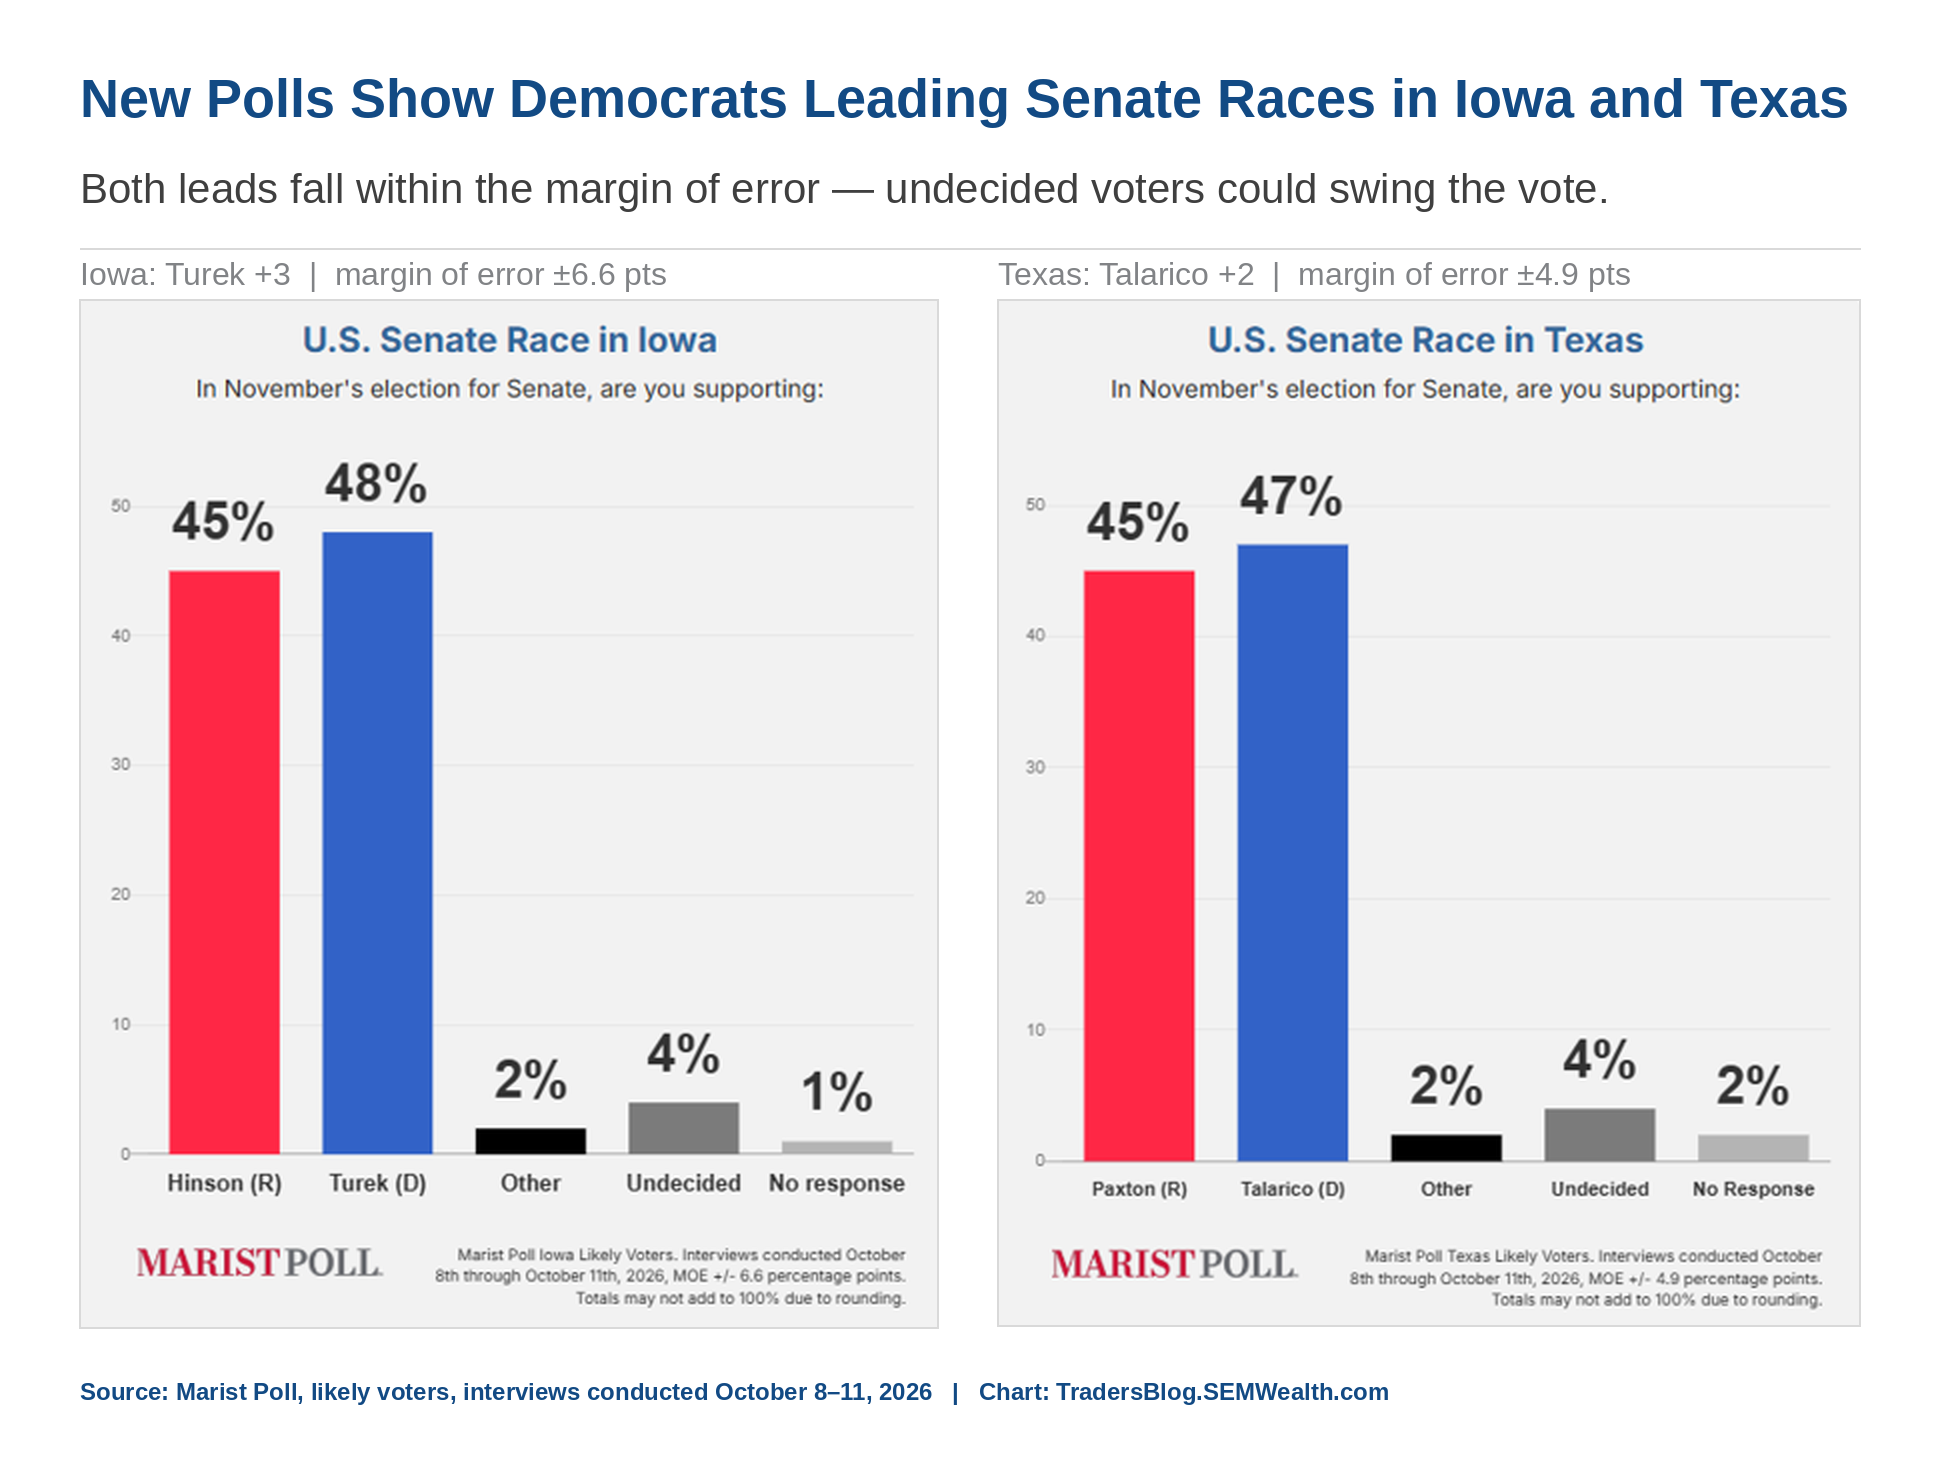
There isn’t a lot that has changed since last week’s polls. Marist, one of the top pollsters, published a senate poll in Texas and Iowa, with both results slightly favoring the Democrat:
In both cases, both polls fell within the margin of error, along with a small percentage of undecided voters potentially swinging it either way. So, although the Democrat is leading, I would rate both of these as a coin flip if we use each of these polls. If we conclude that both of these are tossups, along with using the data from other reputable pollsters, this would put the Senate races like this:
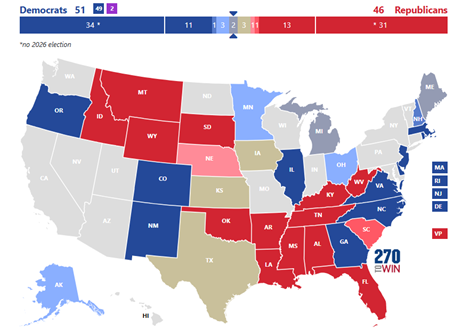
While not a guarantee, with the Dems able to hold their current slim leads in Maine and Michigan, they would be able to win a majority, even without winning either coin flip election in Texas or Iowa. Which, if we used the polling data from other polls, Texas would be rated as a lean Dem race currently.
Texas polls are interesting, even outside of this election cycle. It is the fastest growing state and is a diverse population. While it has been a strong red state for a while, Democrats hope that this election cycle will be the start of Texas becoming a swing state for future elections. So, what else is the Texas polling data telling us?
As the economy is almost always the primary talking point for elections, the role of the government in the economy is usually the debate. Well, at least in Texas, a plurality of both parties agree about the government’s current role in the economy:
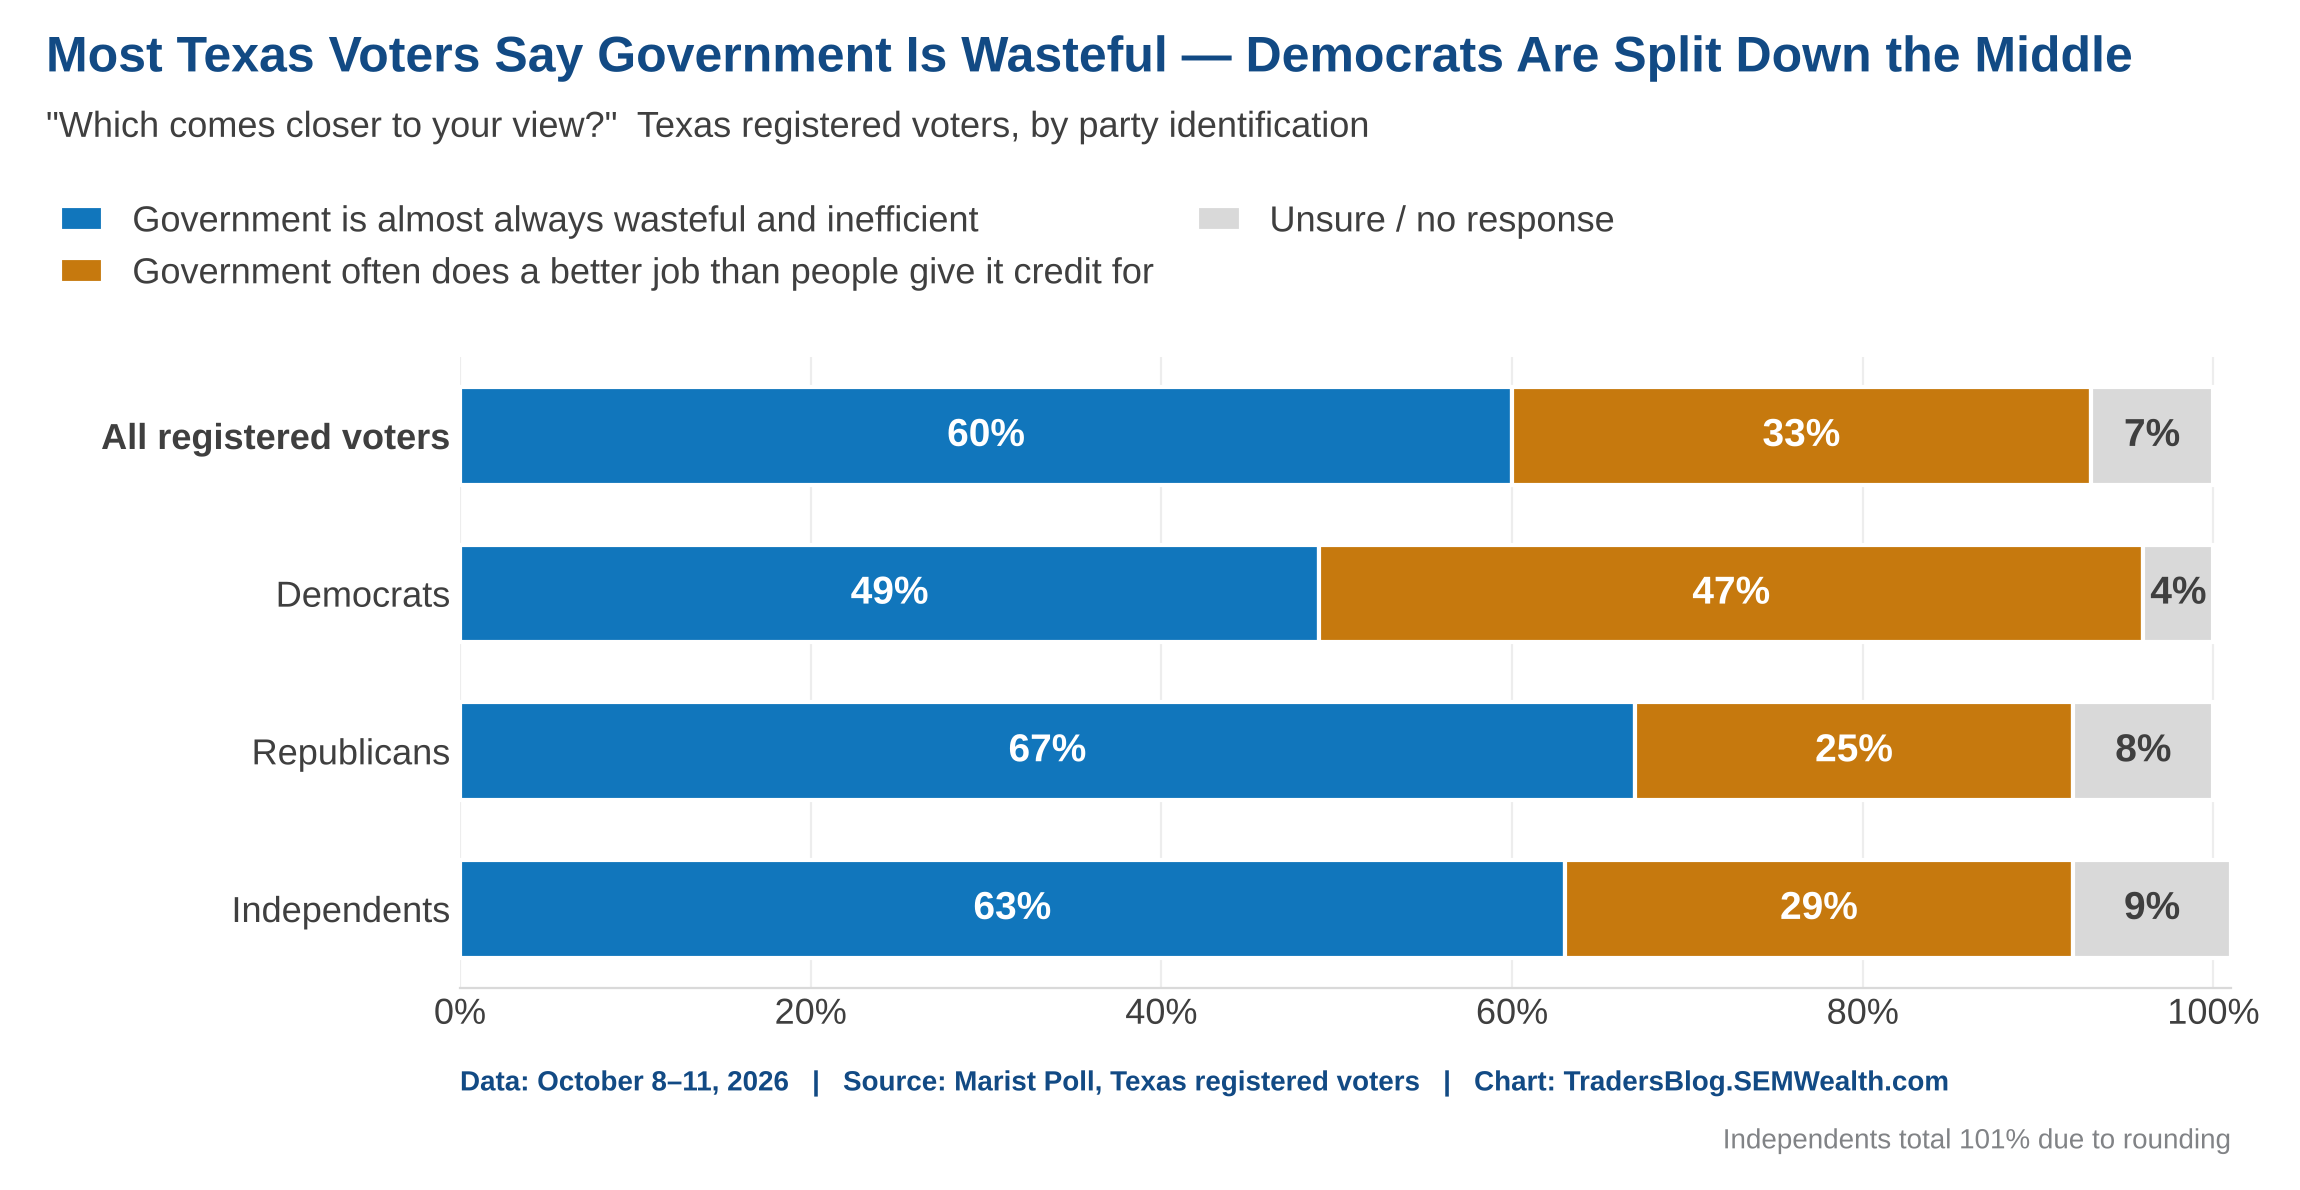
Can a party grab a hold of the plank of making the government more efficient? If they can, that may be a winning message in the future. One other note about this election is it’s looking more and more like a serious “age gap” is occurring. In this same Texas poll, Trump’s approval rating was at 46/54 approval/disapproval. That isn’t as bad as it’s been in nationwide polls. But if we break it down by age, the 18–29-year-old age group was at 18/81 approval/disapproval. Compare that to the 65+ age group, which was at 60/38. This may not be a new trend, with older age groups being more approving of the Republican president than younger voters. But in 2024, exit polling in Texas indicated Trump won roughly 48% of the vote in the 18-29 demographic. Then, when asked what role Trump will play in how they will vote this November, the young voting group was most likely to say Trump will play a role in how they vote (81%, compared to 60% of the remaining voting groups). If younger voters turn out to vote, that will likely spell concern for Republicans in the state.

Picking Portfolio Winners Is Complicated
After one of the most aggressive sell-offs on record, the S&P 500 saw, for the first time in weeks, more stocks making new 52-week highs than new lows, finally ending a remarkably persistent streak of negative breadth.
Amidst the recent tech rotation and bonds coming back into the picture, we dive deeper to see what's going on and emphasize the importance of diversification.
This week, I wanted to share a few topics that have been on my mind, along with some helpful charts to help paint the picture.
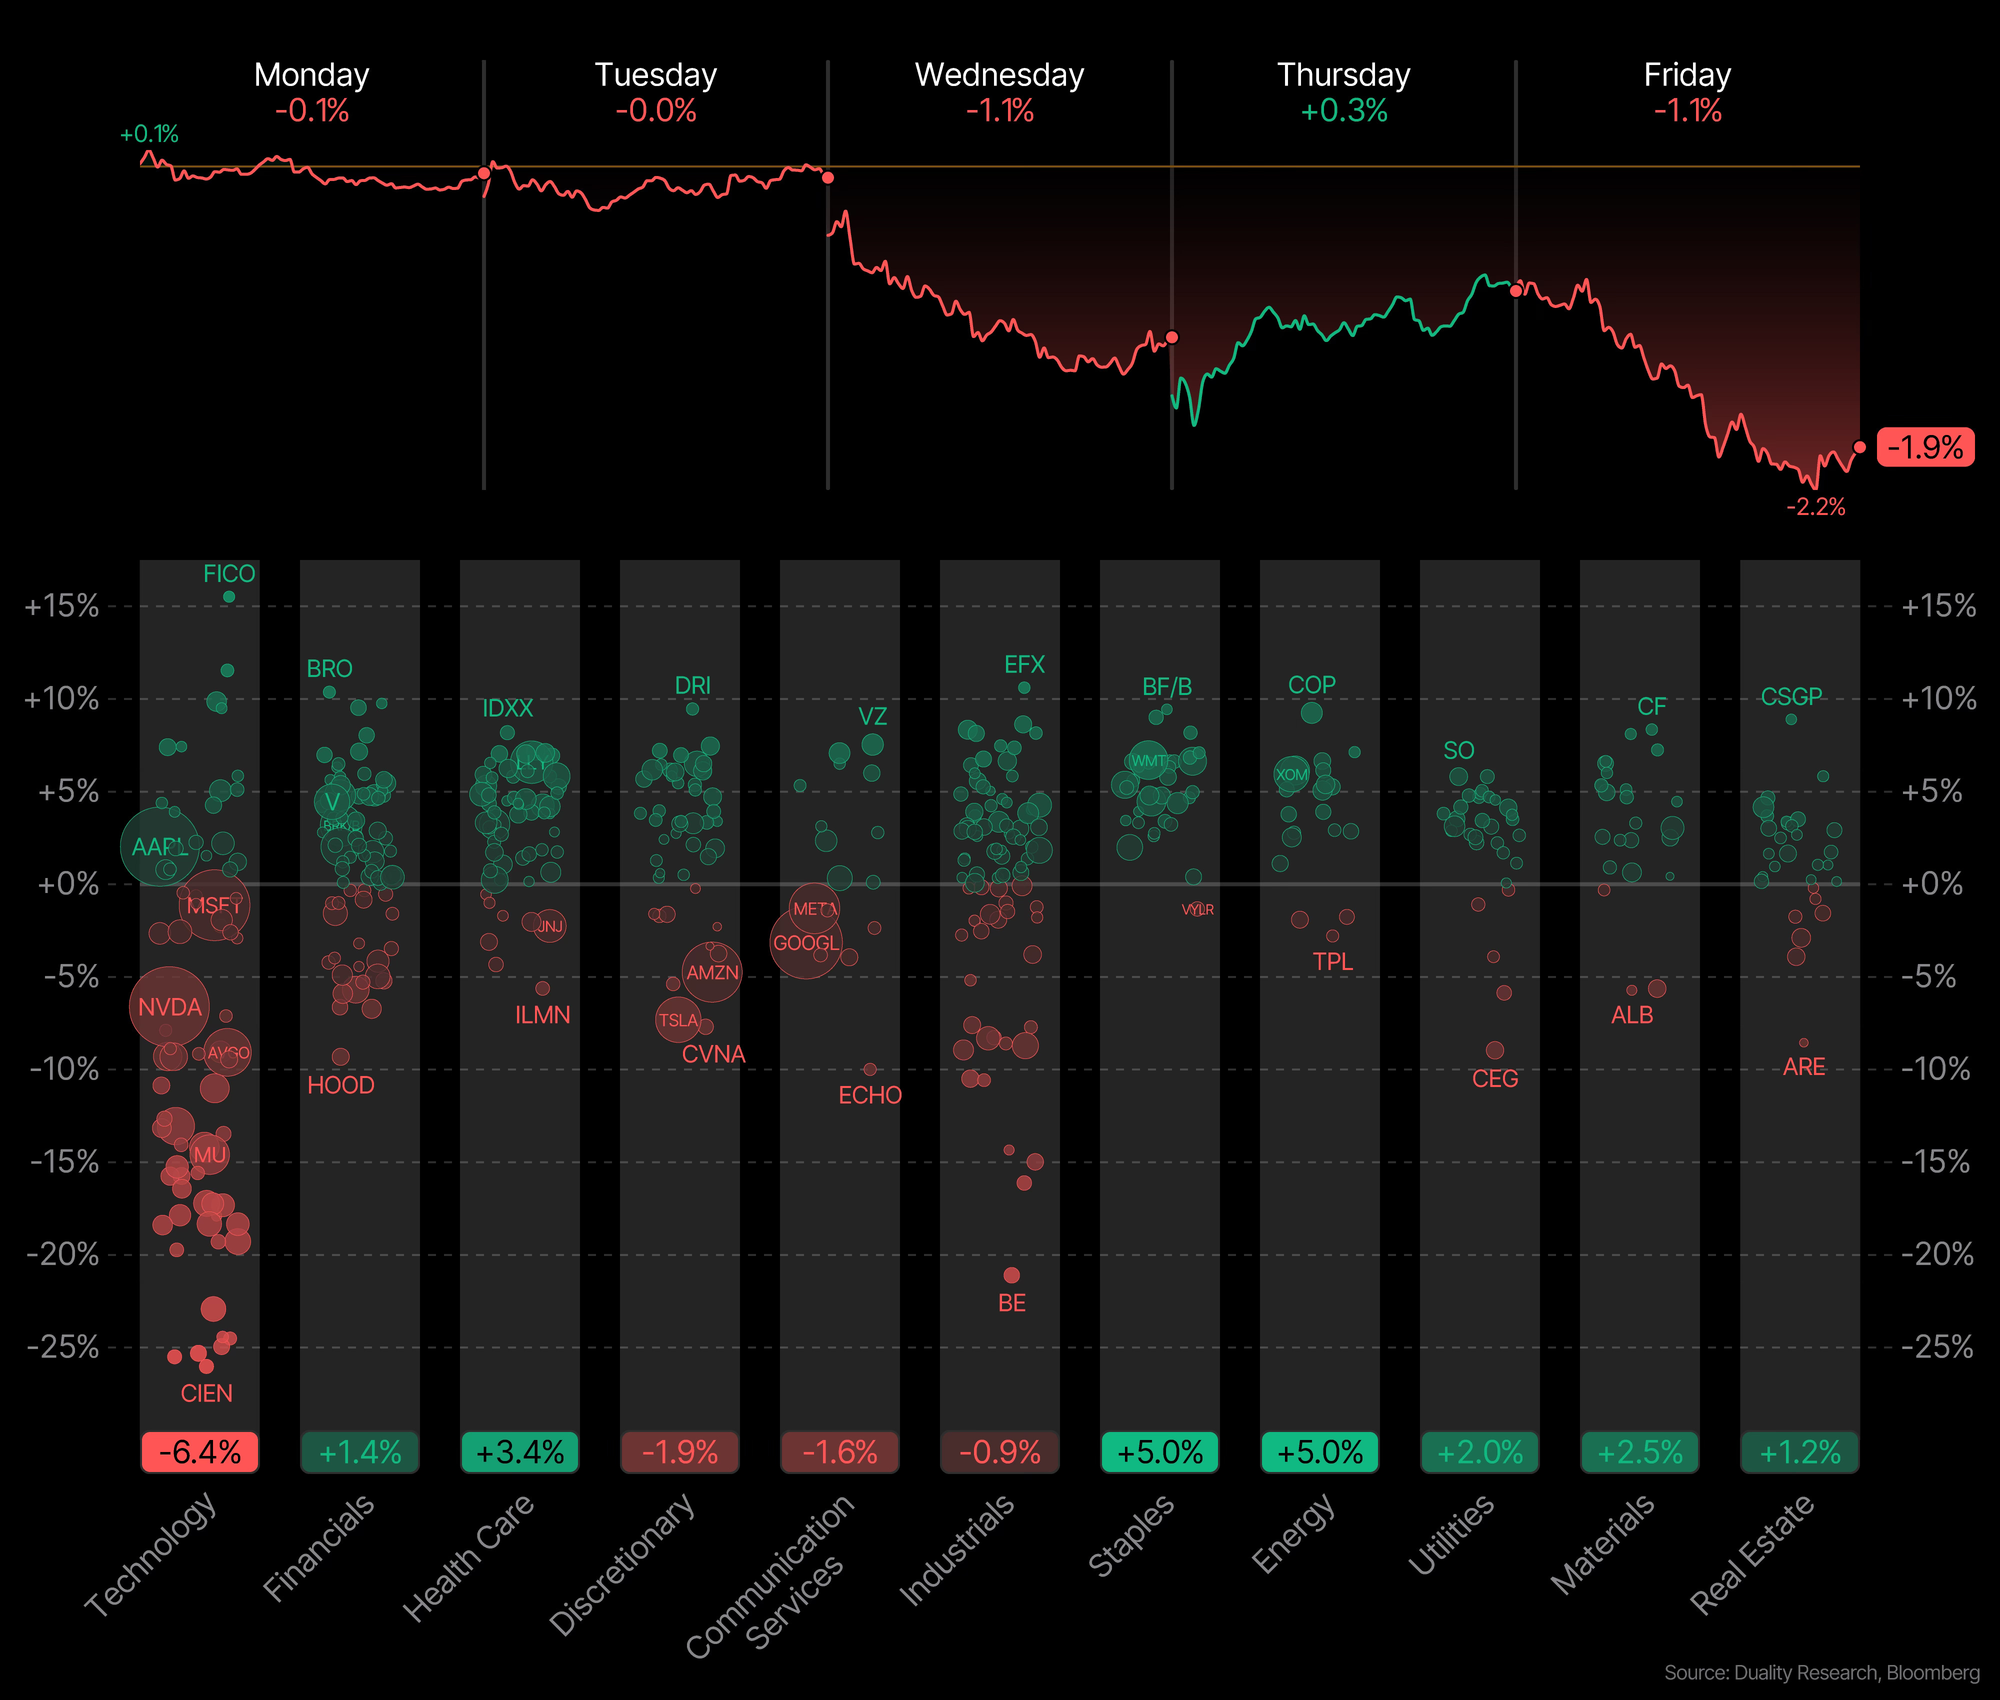
Market Breadth & Performance Range. Illustrated on the chart below from Duality Research, the S&P 500 had their highest level of net new highs turn positive, and in fact, their highest level in two months.

In addition, we're experiencing a 56% spread between the best and worst performing S&P 500 sectors so far this year.
Energy: +51% vs. Consumer Discretionary -5%

Let's take a step back further. Looking at the previous seven years, we've actually experienced nearly a 17% spread of annualized performance between the S&P 500 and U.S. bonds, the largest on record.
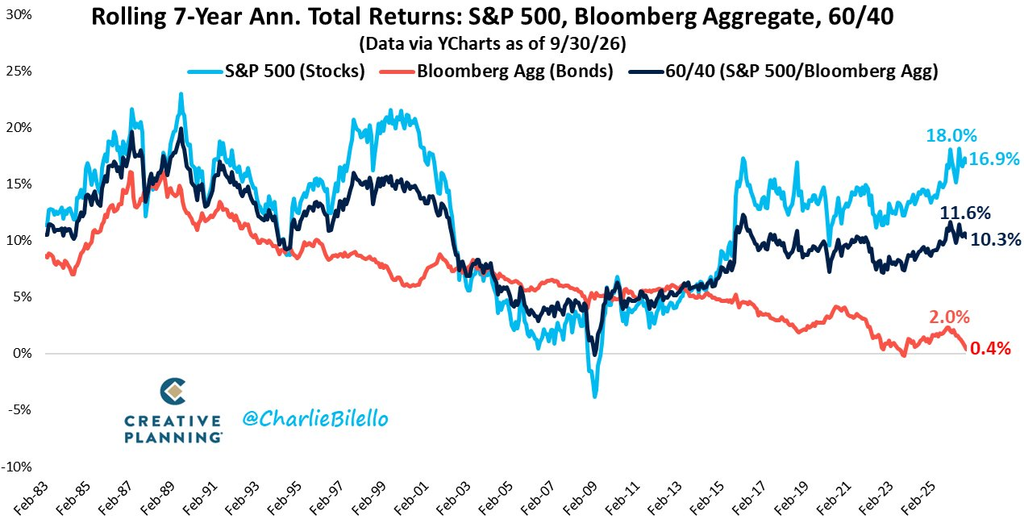
Why? With the uncertainty of future stock returns, the prospective returns for bonds are the highest they've been in 24 years (!).
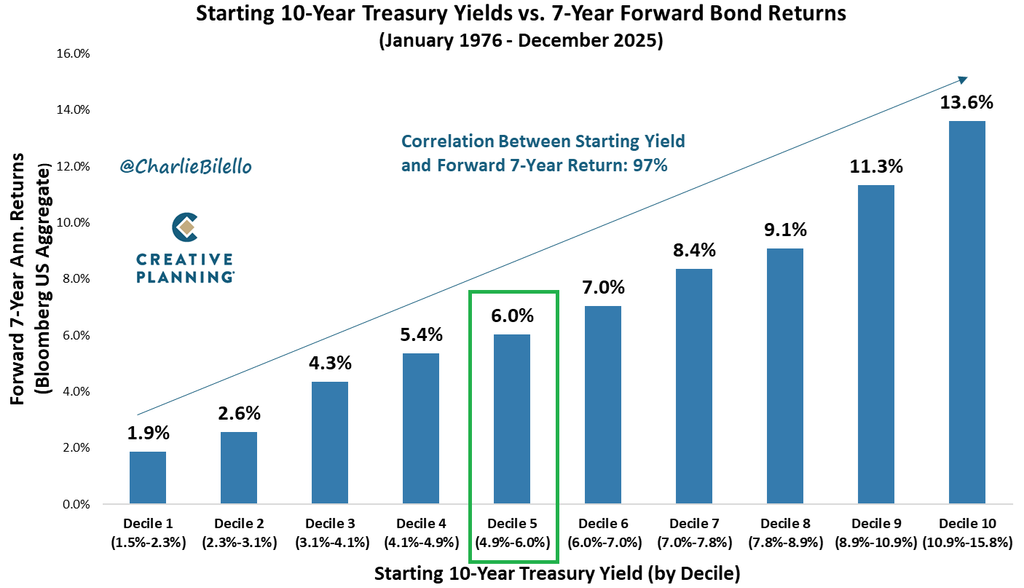
No one can know the duration or strength of any bull or bear market when at the present moment, so it's important to periodically revisit your investment portfolio and reiterate the critical role that diversification plays in your portfolio with your advisor. At the same time, there is no perfect asset allocation and one's time horizon must be brought into the conversation.
So, why am I bringing up risk management? Well, as we've mentioned in previous posts, the 60/40 portfolio has shifted to nearly a 70/30 portfolio, so rebalancing back to target weights may be warranted.
Rotation Out of Tech & Finding Cover.
We've recently seen swift sell-offs move from tech into other parts of the market. Whether investors are cutting losers or selling winners for a profit, we will never know for certain.
But it begs me to ask the question: What does history tell us about when a once-favorable sector eventually becomes less appealing, and for how long?
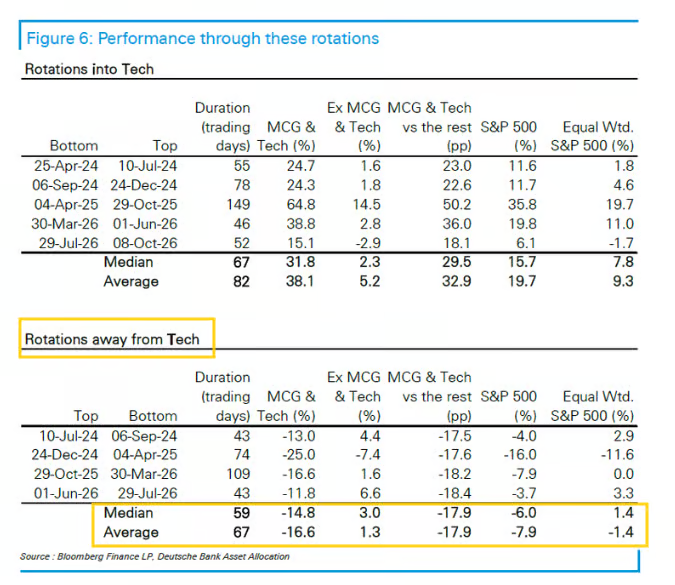
According to Deutsche Bank, rotations out of technology, since mid-2024, see:
Duration: 67 days trading days, on average (median of 59 days).
Performance: Mega-cap growth and technology -16.6% drawdown, on average (median -14.6%).
Meaning that we're relatively early in this realignment.
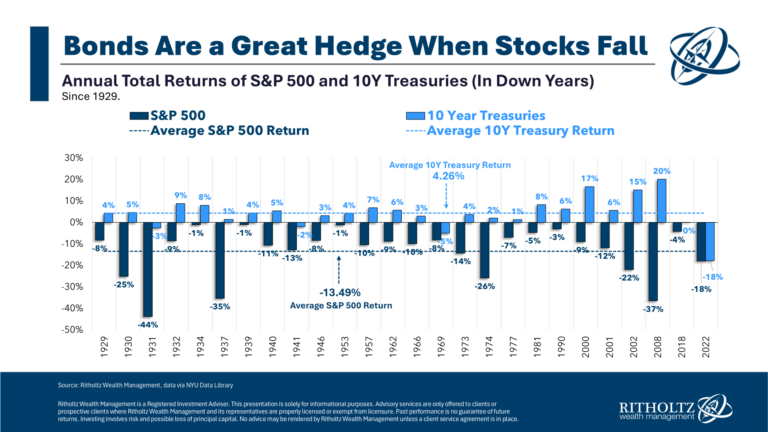
How can one look for downside protection? One place that investors have found luck is, frankly, bonds.
Just look at what history has told us dating back to 1936.
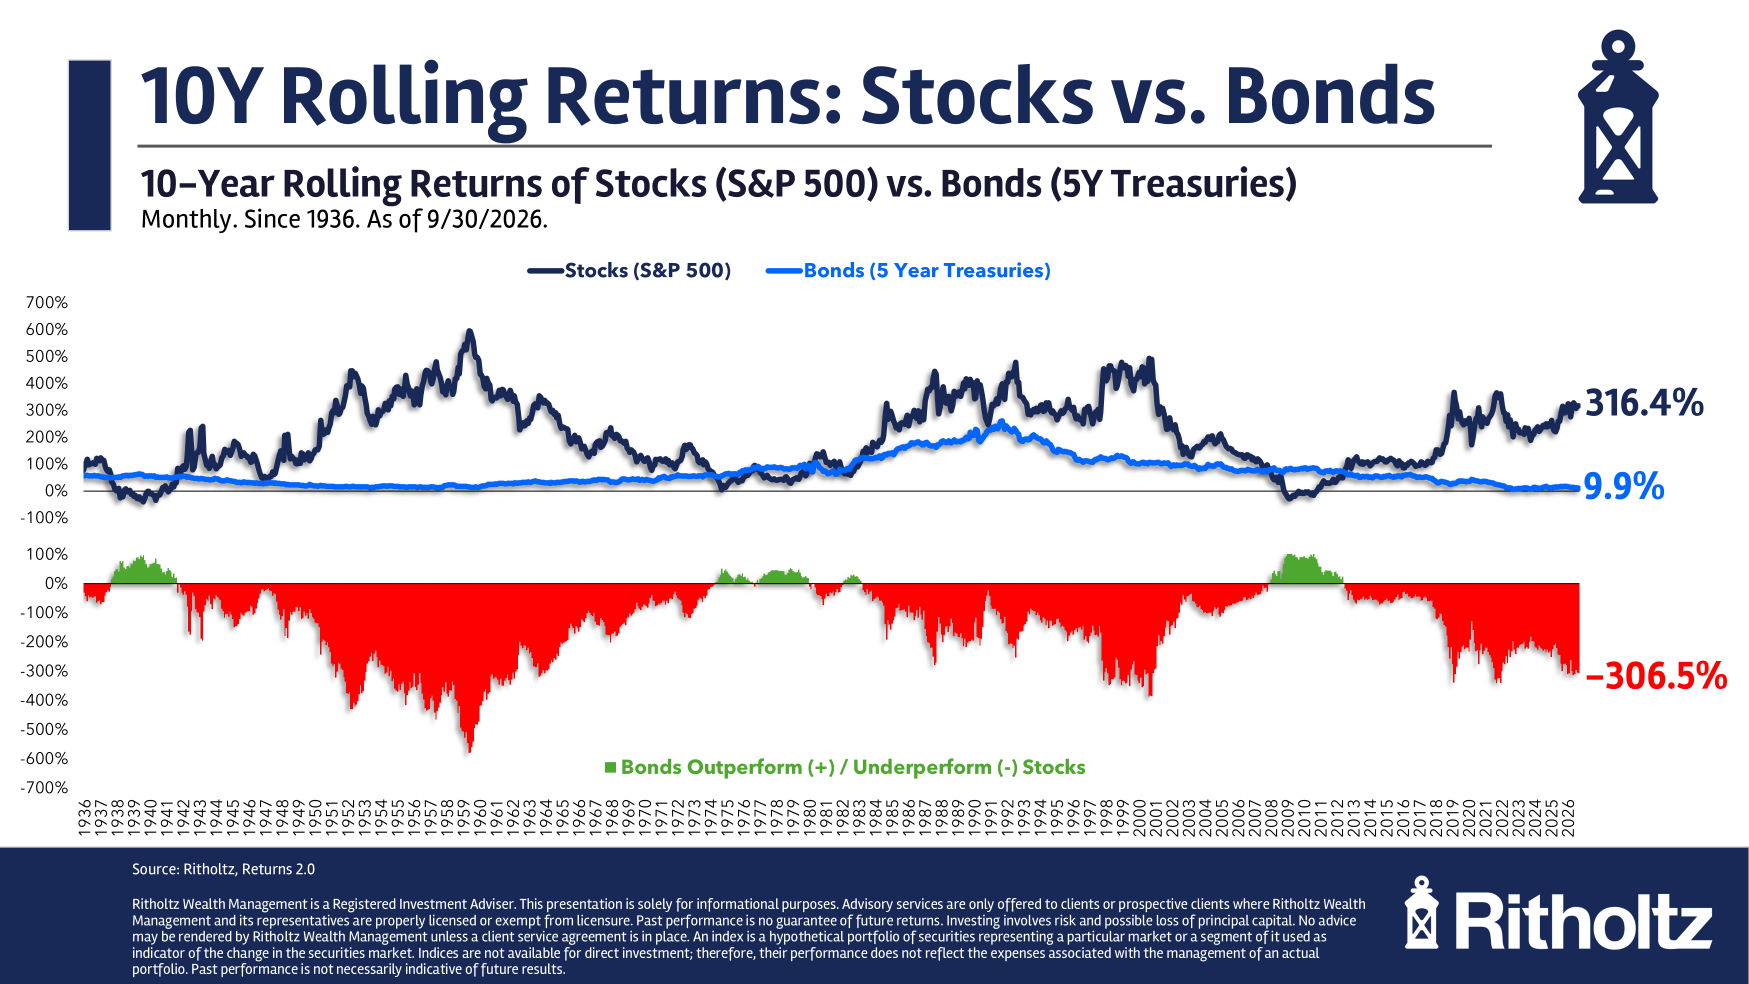
Sure, there is an opportunity cost when keeping a percentage of your portfolio in bonds. While we understand that stocks beat bonds over 83% of all ten year periods since the 1920s, it is important to not side-step their role.
Well, how do I know that I'm diversified and aligned with my investment goals and plan? This is where SEM comes in. Having a well-designed, quantitative strategy that works with your financial plan, cash flow strategy, and investment personality allows you to ignore some of the swings throughout the year.
Market and Economic Data
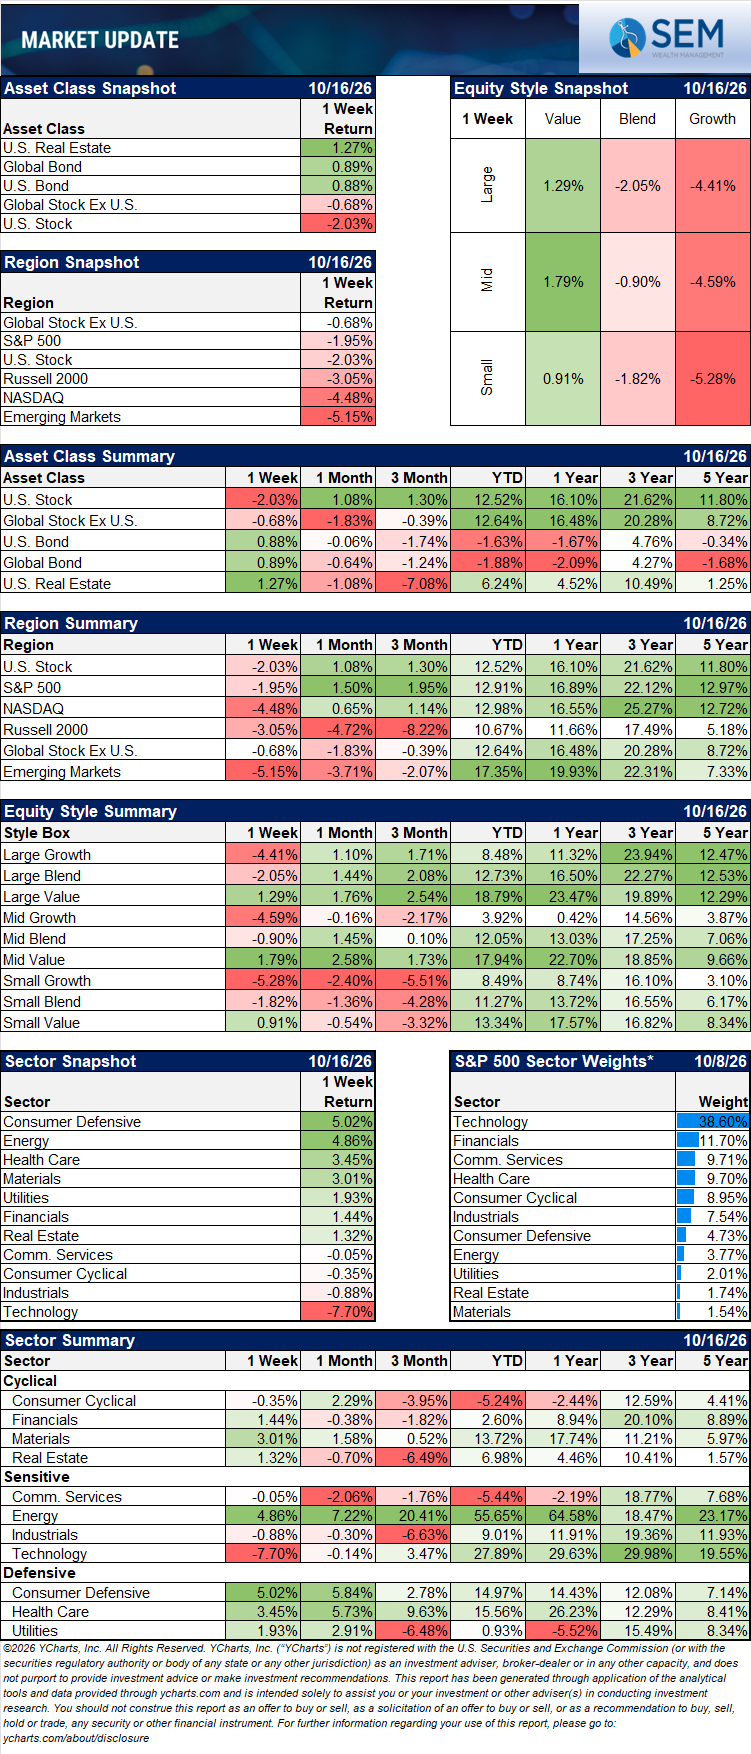
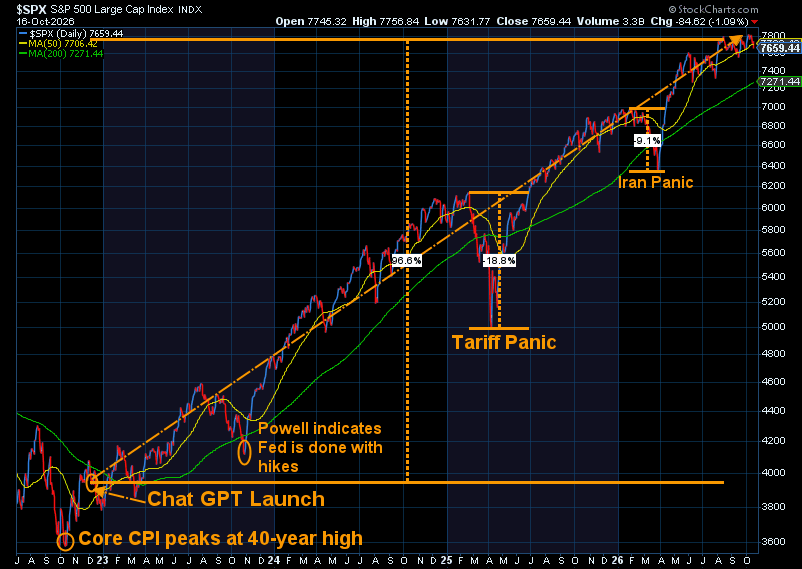
U.S. stocks retreated last week as heavy selling in technology shares weighed on the major indexes. The Nasdaq fell 4.5% and ended 5.3% below its October 6 record high. The S&P 500 declined 1.9%, while the Dow posted a fractional gain. Investors rotated away from AI-related stocks and chipmakers toward healthcare and other defensive sectors, so large-cap growth fell 5.0% while large-cap value rose 0.9%. Inflation data added to the pressure.
September’s CPI showed a 3.7% annual rate, up from 3.4% in August, and wholesale inflation reached 6.3%, its highest since 2022. Despite the hotter readings, longer-term Treasury yields fell for a second straight week, with the 10-year closing at 5.08% and the 30-year at 5.43%. With inflation running well above the Fed’s 2% target, investors will be watching closely ahead of the Fed’s policy meeting that ends October 28.
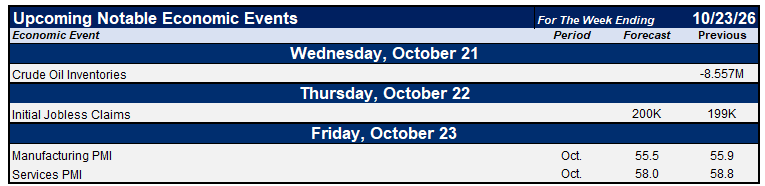
Earnings season picks up this week. Netflix and GE Aerospace report Tuesday, Meta Platforms and Tesla on Wednesday, and American Express on Friday.
Expectations were modestly scaled back after mixed results from the major banks: according to FactSet, analysts now project third-quarter S&P 500 earnings growth of 29.0%, down from 29.4% a week earlier. That would still mark a third consecutive quarter above 25%.
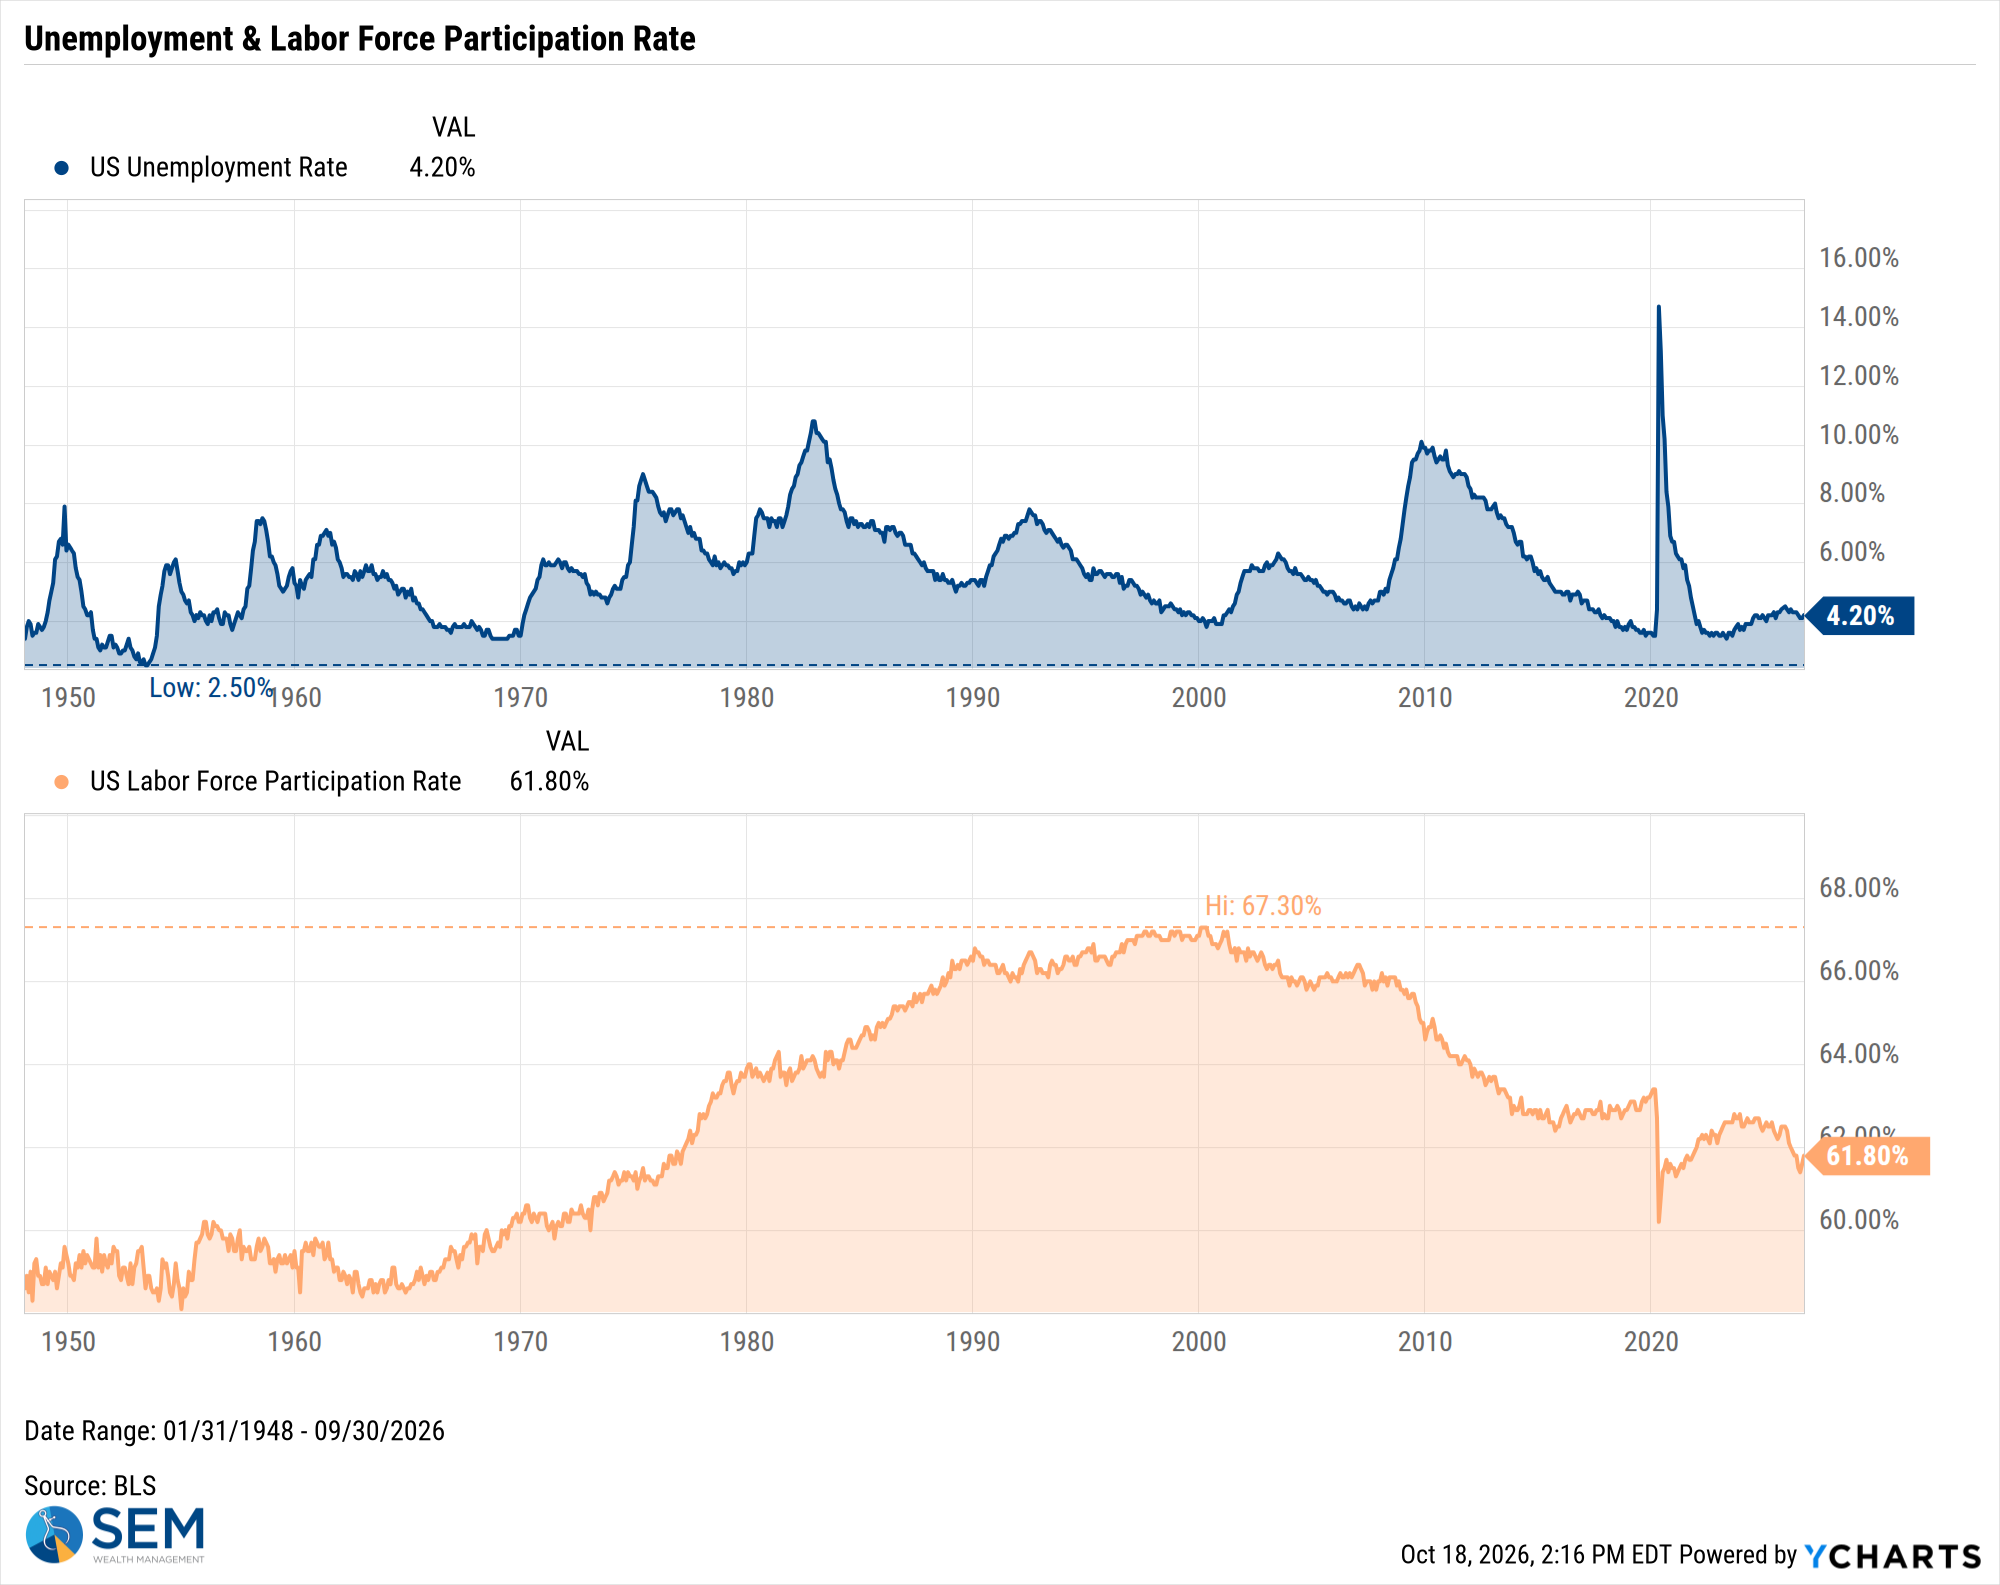
US Unemployment Rate data by YCharts
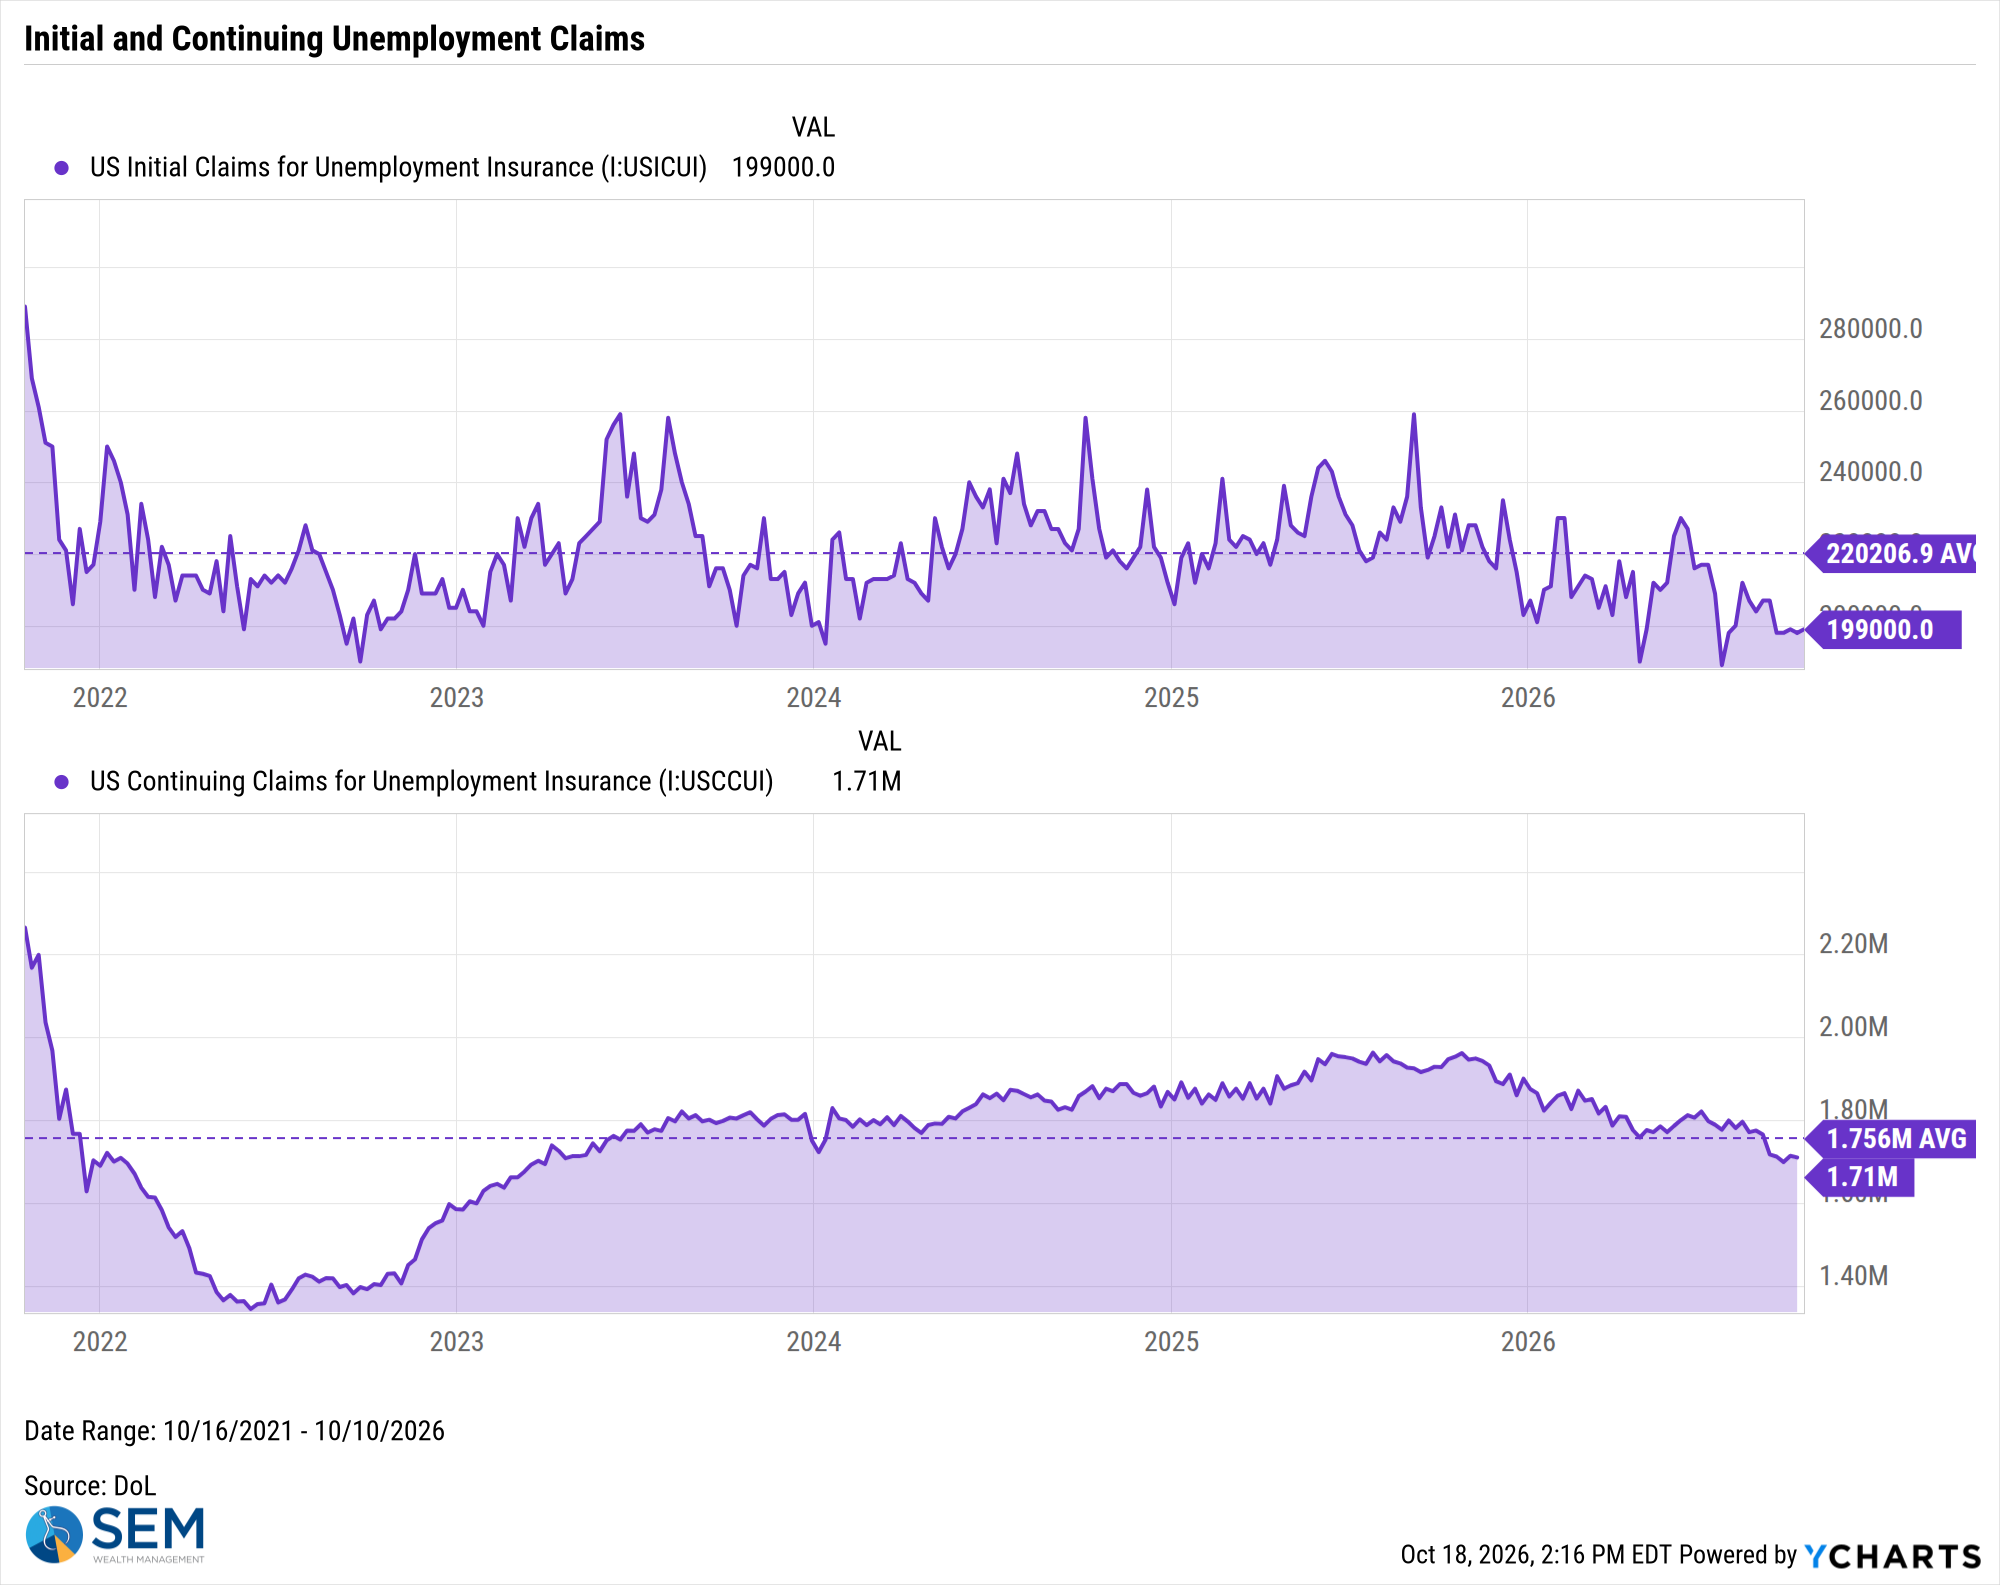
US Initial Claims for Unemployment Insurance data by YCharts
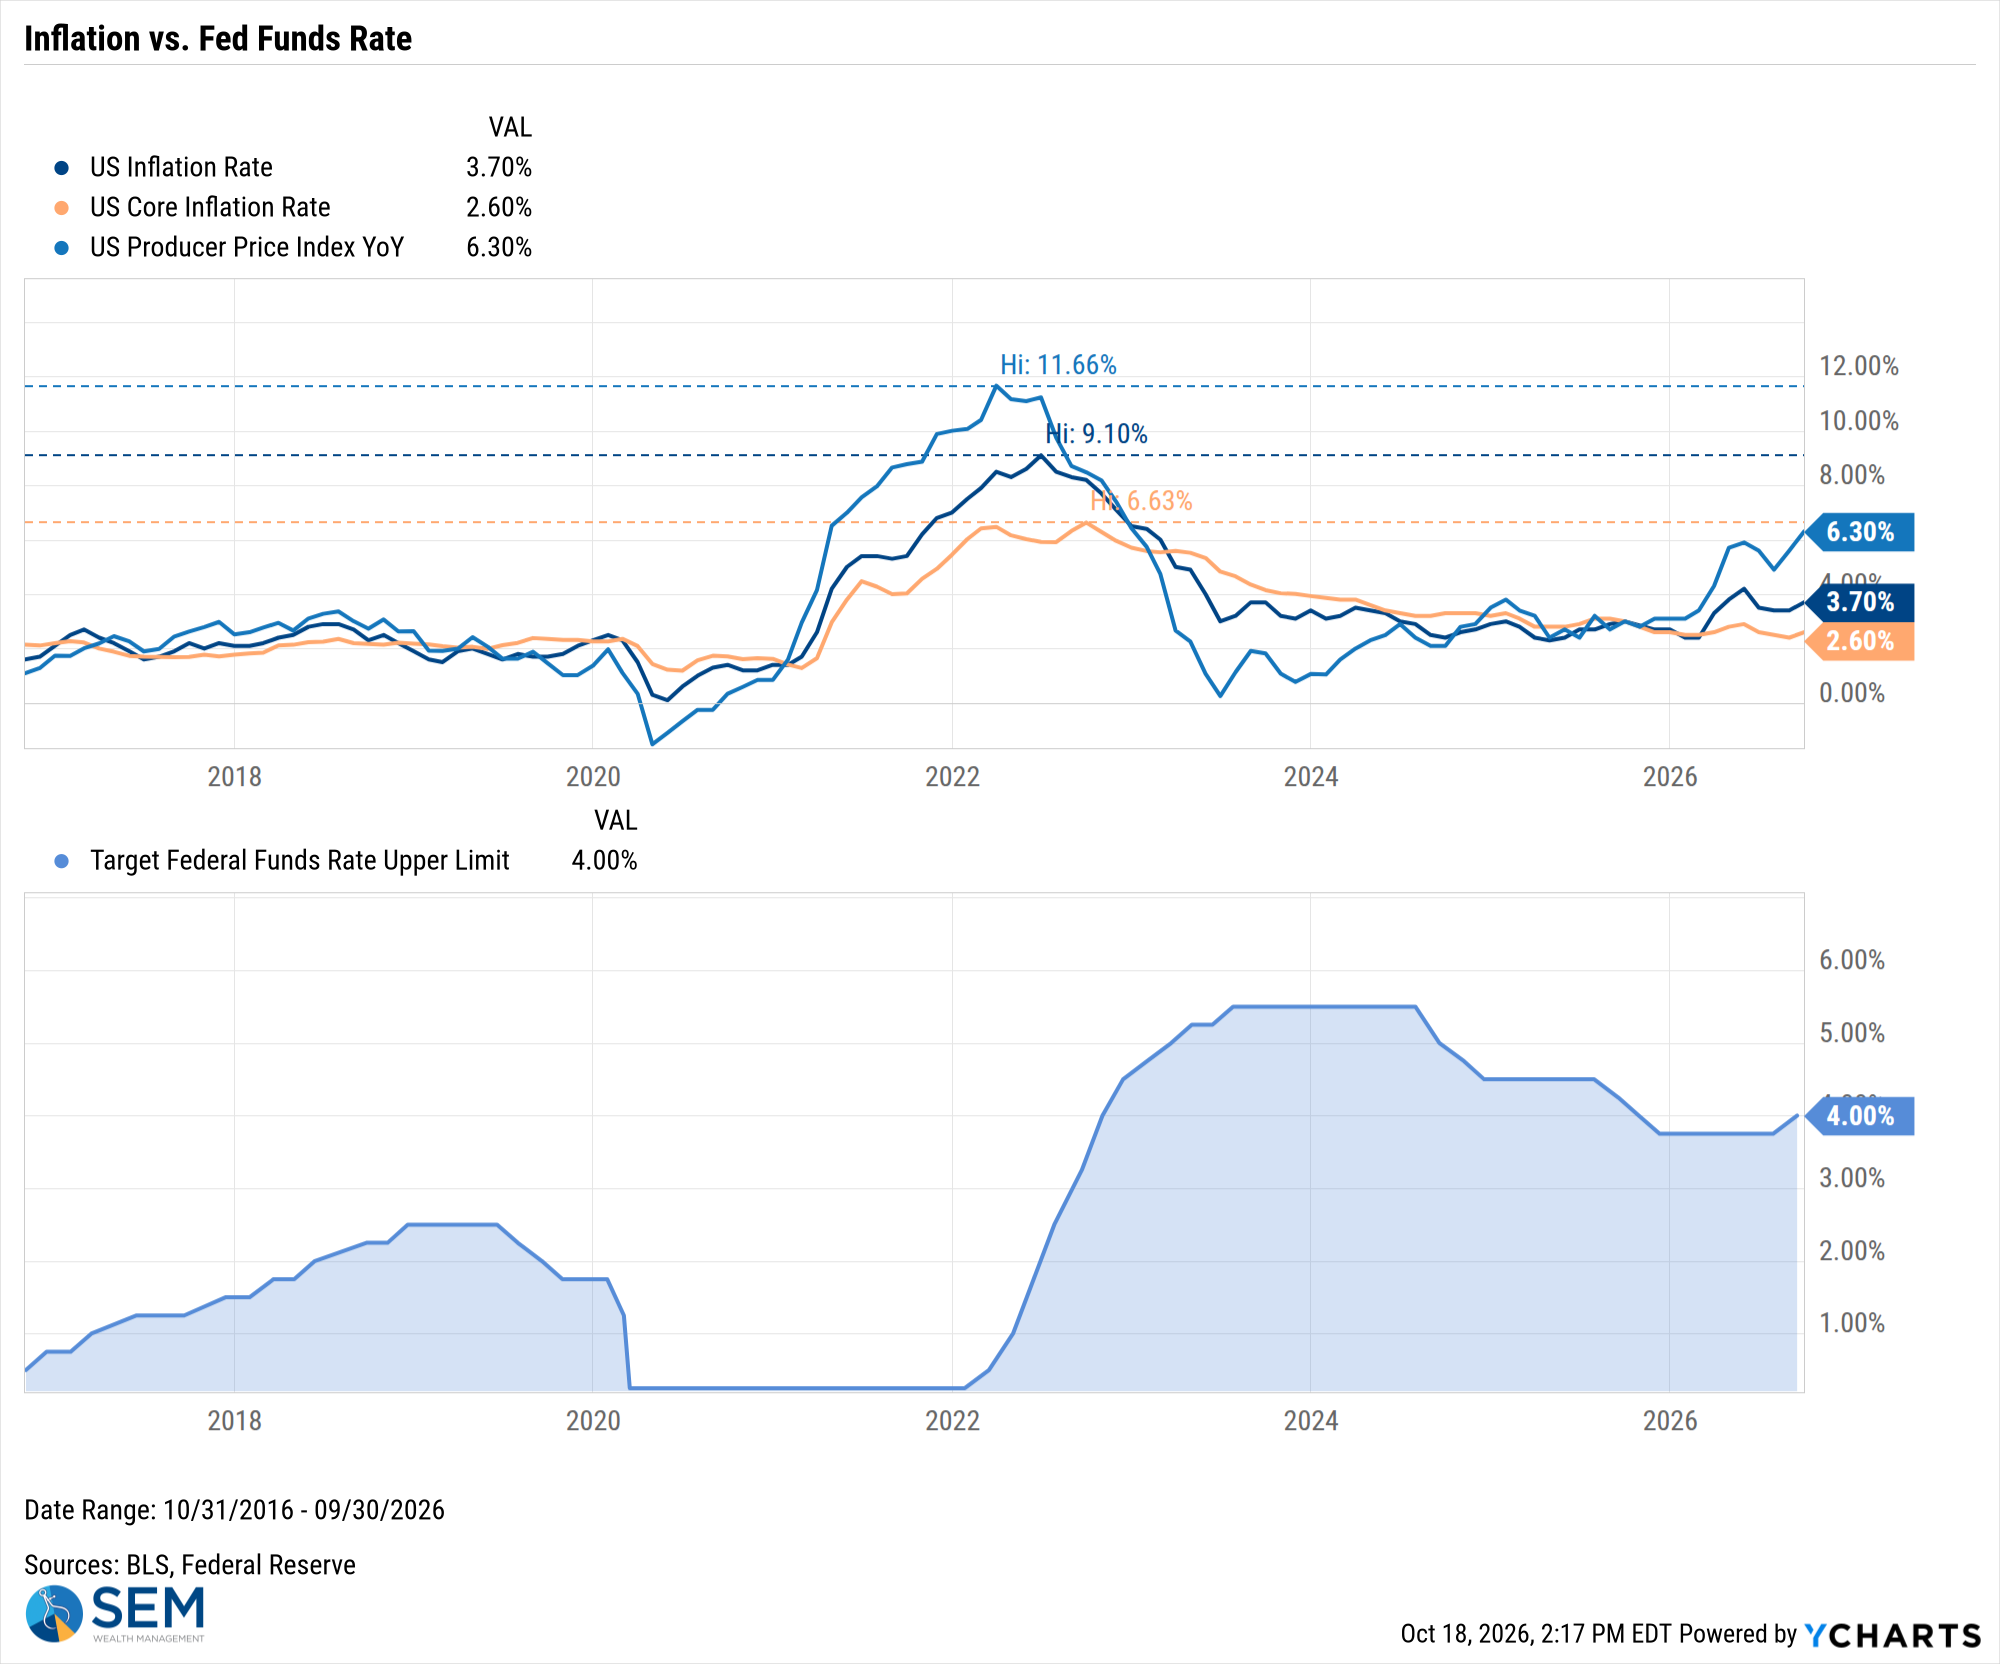
US Inflation Rate data by YCharts
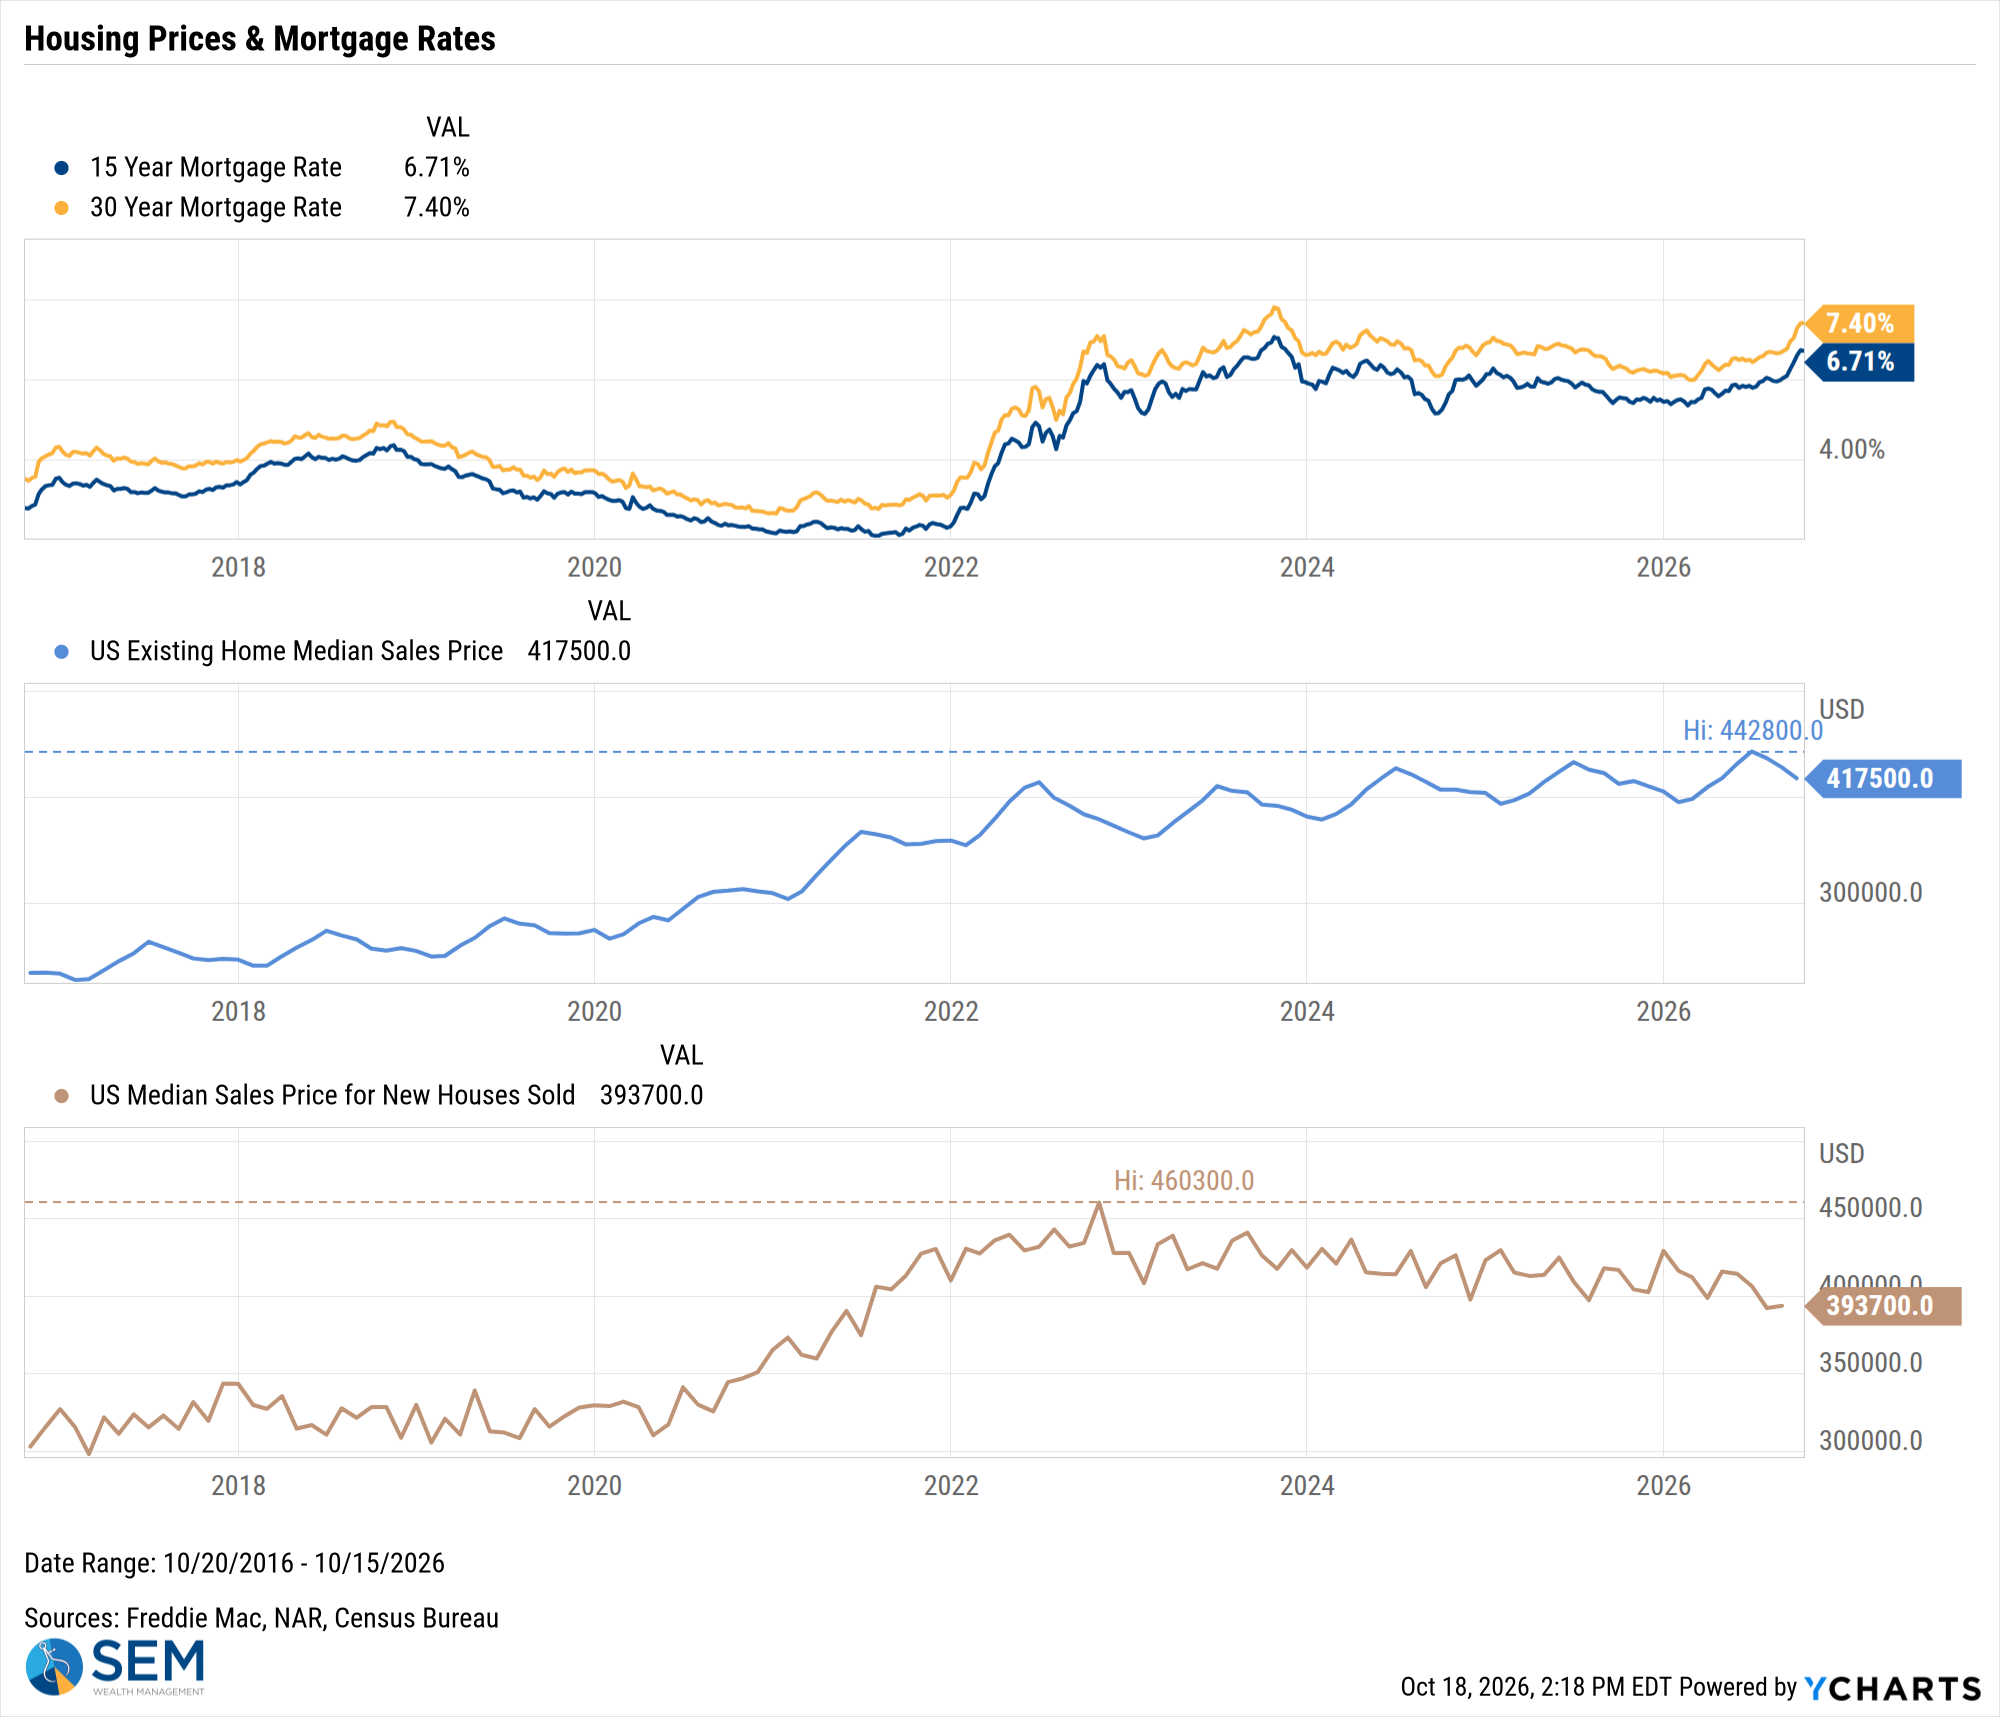
US Existing Home Median Sales Price data by YCharts
SEM Market Positioning
SEM deploys 3 distinct approaches – Tactical, Dynamic, and Strategic. These systems have been described as 'daily, monthly, quarterly' given how often they may make adjustments. Here is where they each stand.
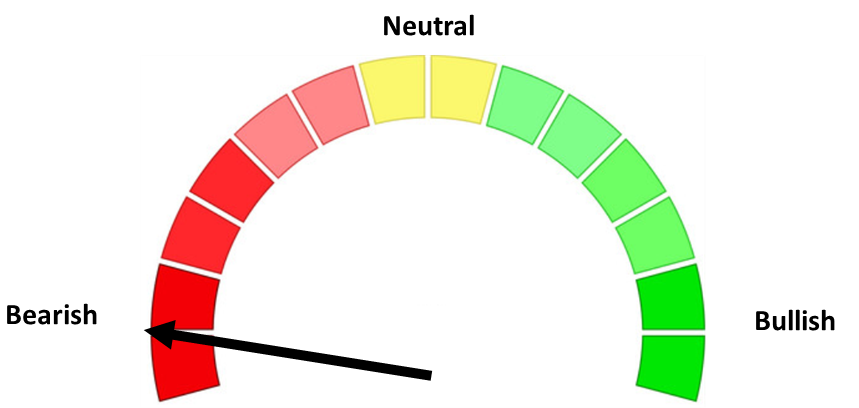
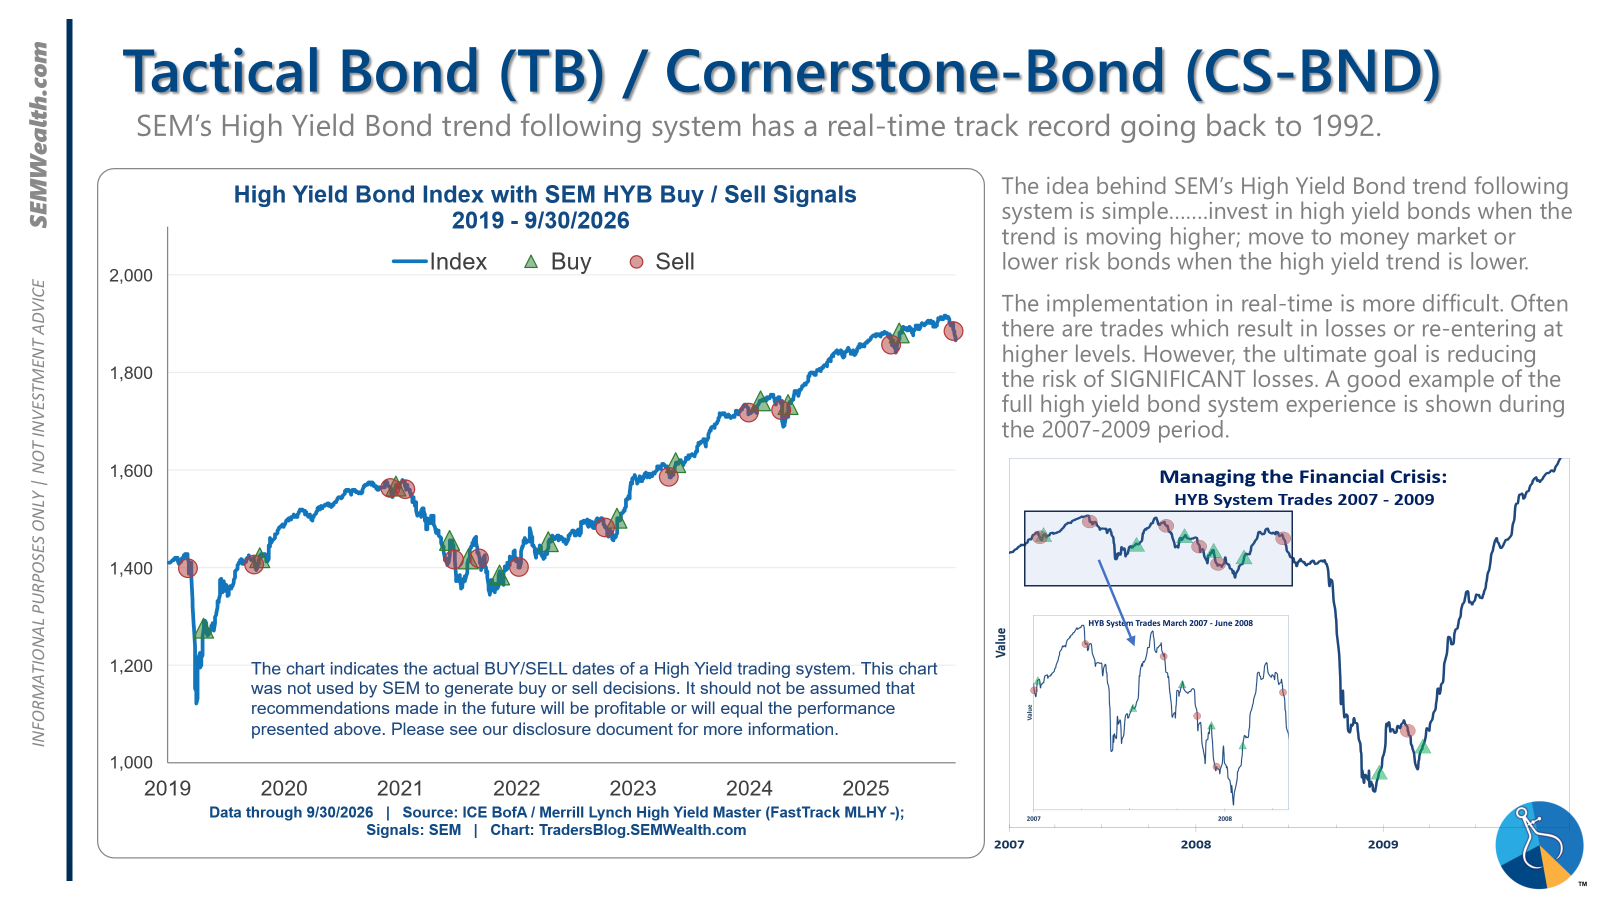
- Tactical = BEARISH (9/24/26) | 100% Money Market / Short Term Bonds (9/24/26) | High-yield trends reversed lower with spreads near historic lows.
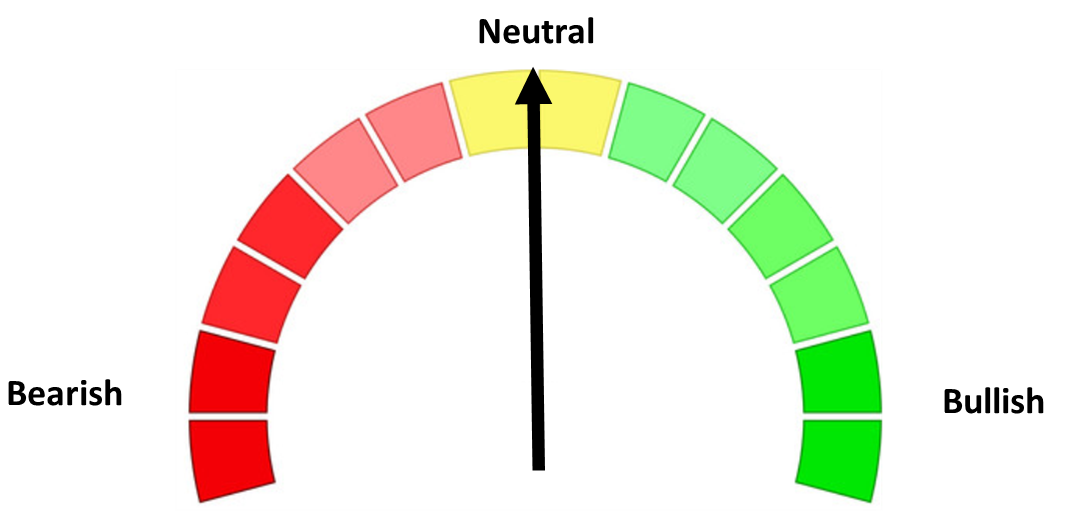
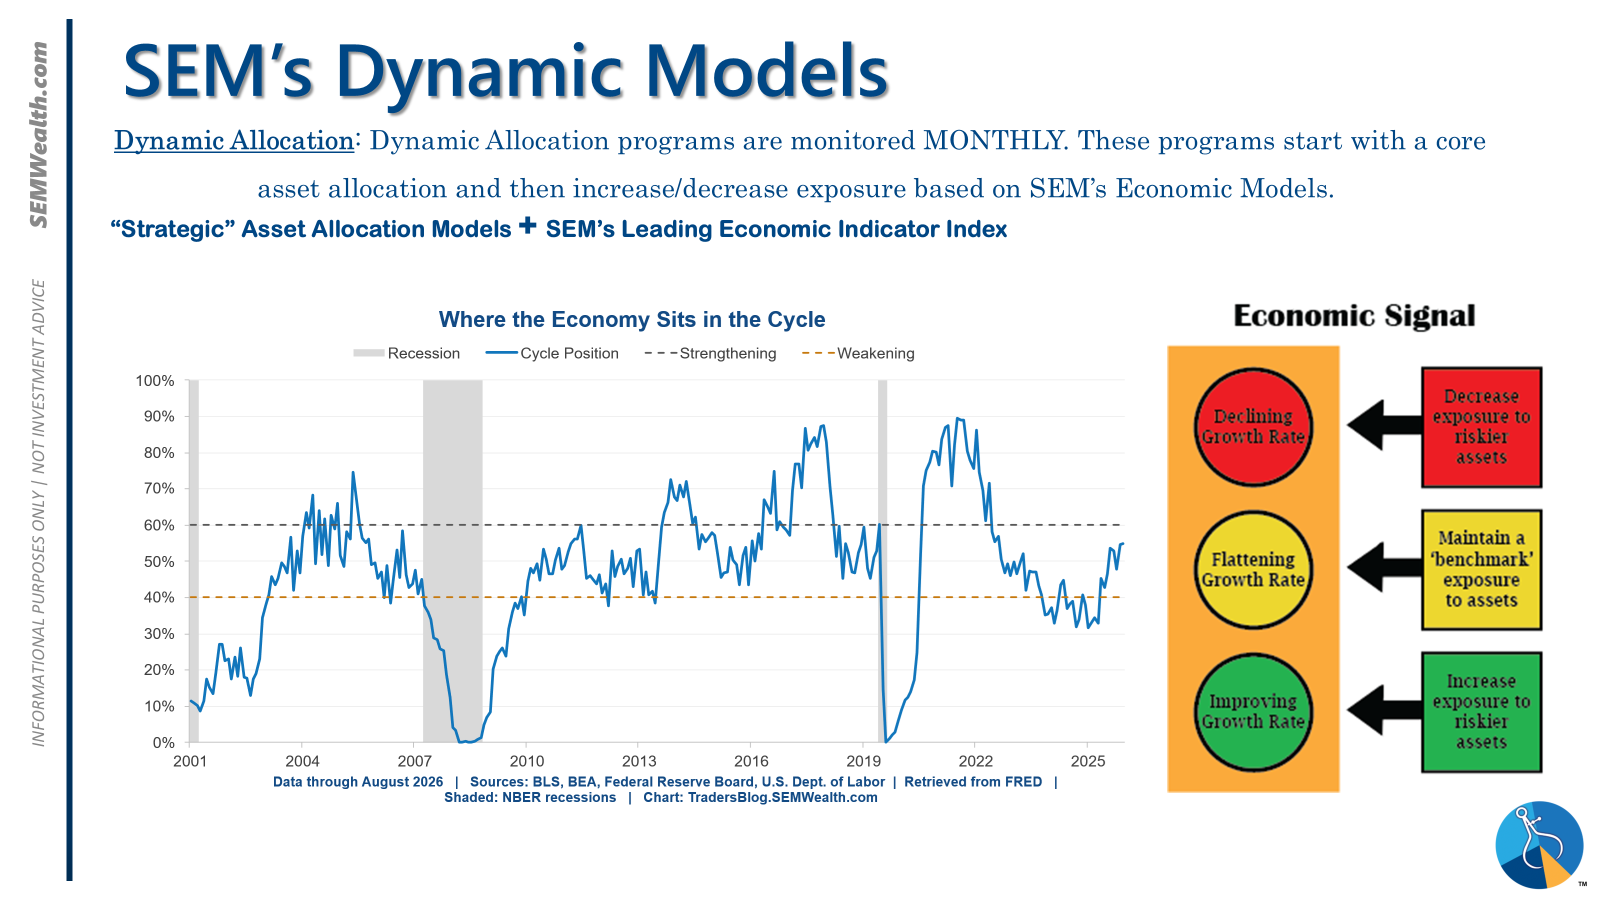
- Dynamic = NEUTRAL (2/15/2026) | "Benchmark" Allocation | Economic model inconclusive
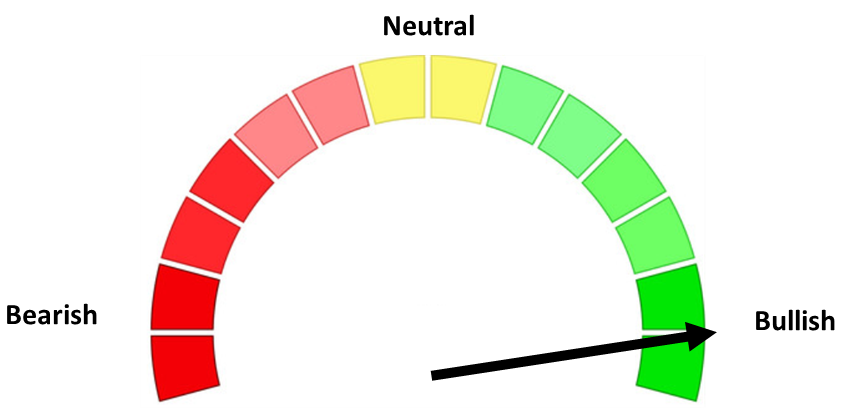
- Strategic = BULLISH (4/15/2026) | V-Bottom projecting "end" of Iran War
Tactical (daily):
- Monitored DAILY
- Models: Tactical Bond, Cornerstone Bond, Income Allocator, Tax Advantaged Bond
- Designed to follow the trends for use in our lower risk models
- SELL Signal issued September 24, 2026 (exiting the buy from April 8, 2026)
Dynamic (monthly):
- Monitored MONTHLY
- Models: All "Dynamic" Models (Income, Balanced, Growth, and Asset Allocator)
- Uses SEM's Quantitative Economic Model
- Designed to overweight riskier assets if economic trend is higher & underweight those assets if economic trend is lower.
- NEUTRAL signal issued February 15, 2026 (following BEARISH signal from July 2025)
Strategic (quarterly)*:
- Monitored QUARTERLY
- Models: AmeriGuard (Balanced, Moderate, & Growth) and Cornerstone (Balanced & Growth)
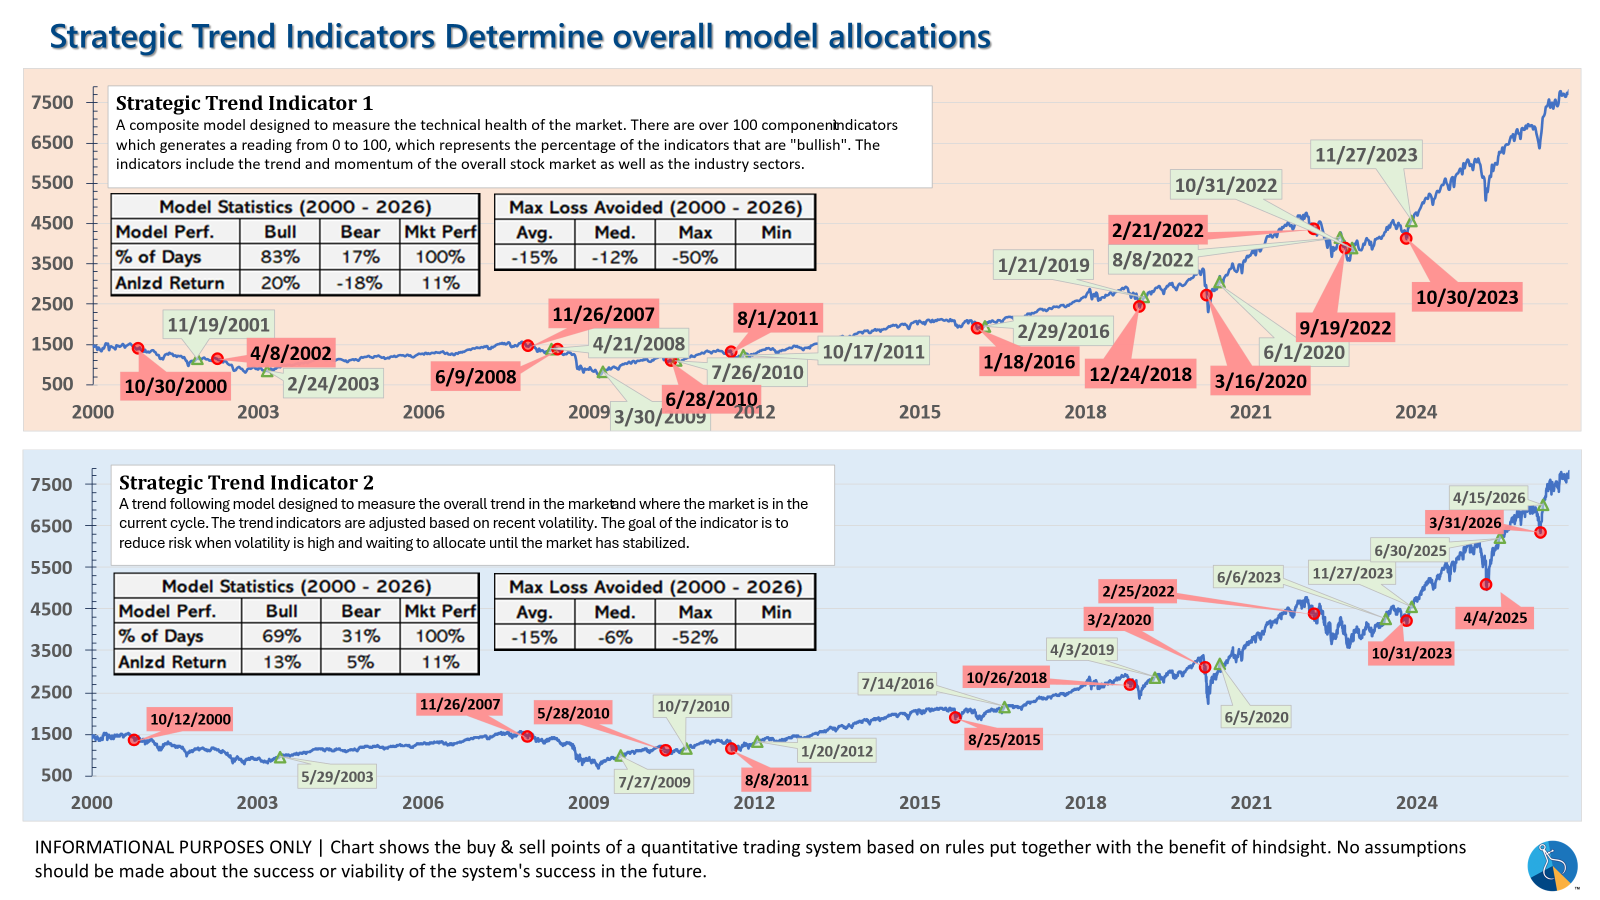
- Core Component: Quantitative Filter using 4 different time horizons across universe of asset classes
- Trend Indicator: Two different Quantitative Systems monitoring the intermediate-term trend, health of the market, and volatility
- CORE eliminated small cap in AmeriGuard and reduced it in Cornerstone in October 2026; overweight international since October 2025.
- Both TREND INDICATORS are BULLISH following 10% drop and "V-Bottom" reversal in early April
- AmeriGuard & Cornerstone Max DO NOT use the Trend indicator and are always 100% invested in stocks using our CORE rotation model.
The core rotation is adjusted quarterly. To start the 3rd quarter we saw all of our small cap position in AmeriGuard eliminated and the Cornerstone small cap position cut in half. We remain overweight international (at least for these models where the benchmark is 0% international).
The * in quarterly is for the trend models. These models are watched daily but they trade infrequently based on readings of where each believe we are in the cycle. The trend systems can be susceptible to "whipsaws" as we saw with the recent sell and buy signals at the end of October and November. The goal of the systems is to miss major downturns in the market. Risks are high when the market has been stampeding higher as it has for most of 2023. This means sometimes selling too soon. As we saw with the recent trade, the systems can quickly reverse if they are wrong.
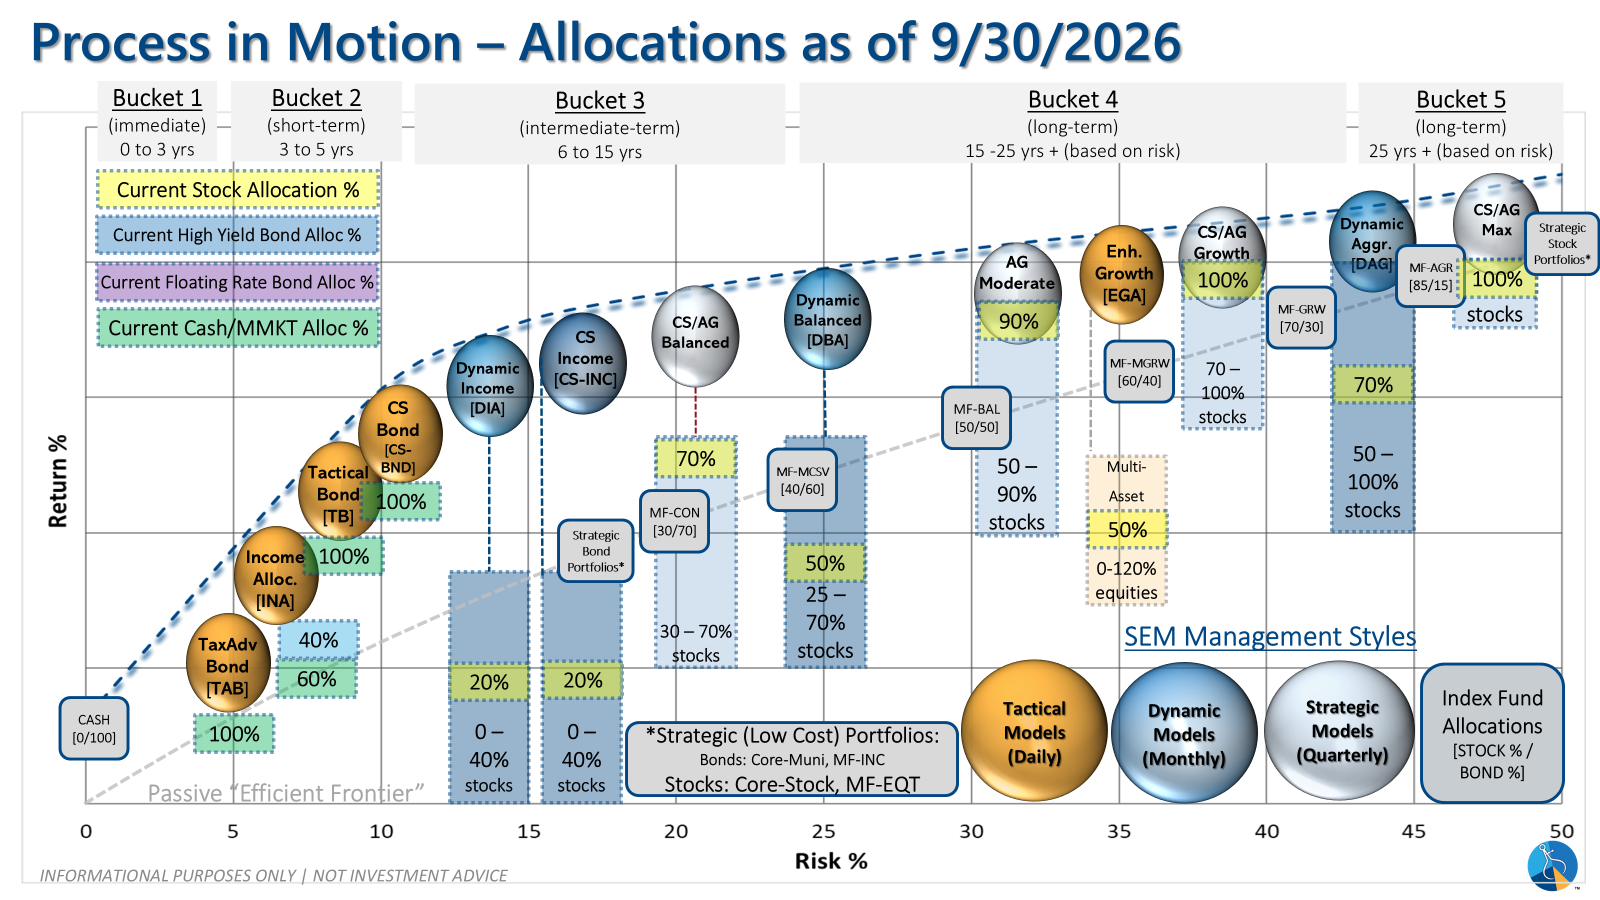
Overall, this is how our various models stack up based on the last allocation change:
Curious if your current investment allocation aligns with your overall objectives and risk tolerance?