
What can stop the AI momentum train? While more and more big name investors voice their concern about the stock market mania, nobody really knows what exactly will stop it. (Michael Burry, made famous by "The Big Short" has been the most vocal, but Paul Tudor Jones, Jim Chanos, Peter Theil, and even famed tech analyst Dan Niles have joined the chorus of warnings.) We have history on our side to help identify things to watch, but the biggest lesson we have from history is a seemingly inconsequential event (identified with hindsight) usually marks the beginning of the end. It could be a company (or 3) announcing their earnings were not exactly what they had stated, a hedge fund (or 3) closing due to large losses in a few investments, or an IPO (or 3) falling below their issuance price a day or two after it started trading.
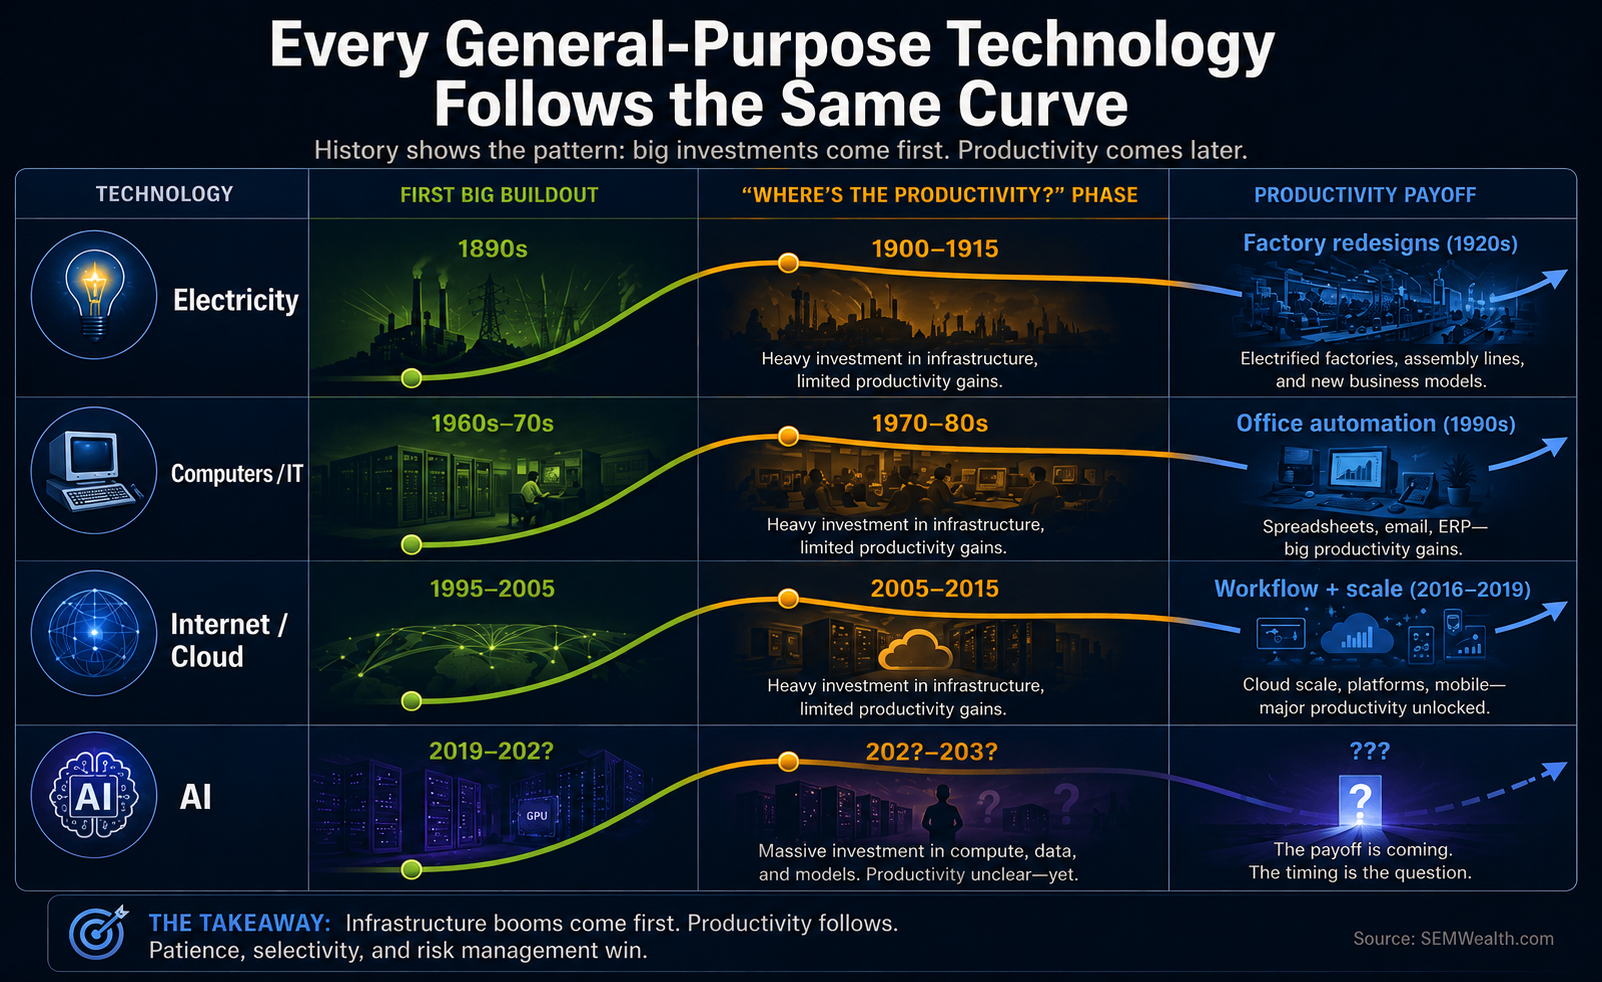
What we do know is every technological revolution has followed the same pattern where there is a mass investment along with huge gains in the stocks related to the industry. Later in the investment cycle you see companies remotely related to the technology seeing gains that make no sense. We also see the investment companies are making in the technology increase at exponential levels while investors start to question exactly when the payoff will come. We are clearly at that stage of the cycle, but that can go on for 1-3 years before the stock market eventually (over)corrects. This wipes out the fringe players who probably should have never been funded and clears the way for companies with better ideas, more stable funding, and an actual business plan to become the dominant player.
SEM's primary keynote presentation we give at conferences this year is "AI: Boom, Bubble, or Both". As proof I am a big believer in the "boom" side of things, I took my very boring tables discussing some past technological innovations and had Chat GPT and Gemini turn them into a graphic. Gemini a week earlier had been the superior app to create graphics. The latest version of Chat GPT, however, blew Gemini's creation out of the water. I fully expect Gemini to take the lead again based on my experience the past 18 months with both.
The biggest question of course is how long until the inevitable (over)correction begins. Yahoo Finance ran a story over the weekend talking about past market bubbles. This chart was included to highlight some of the past bubbles for the stock market.
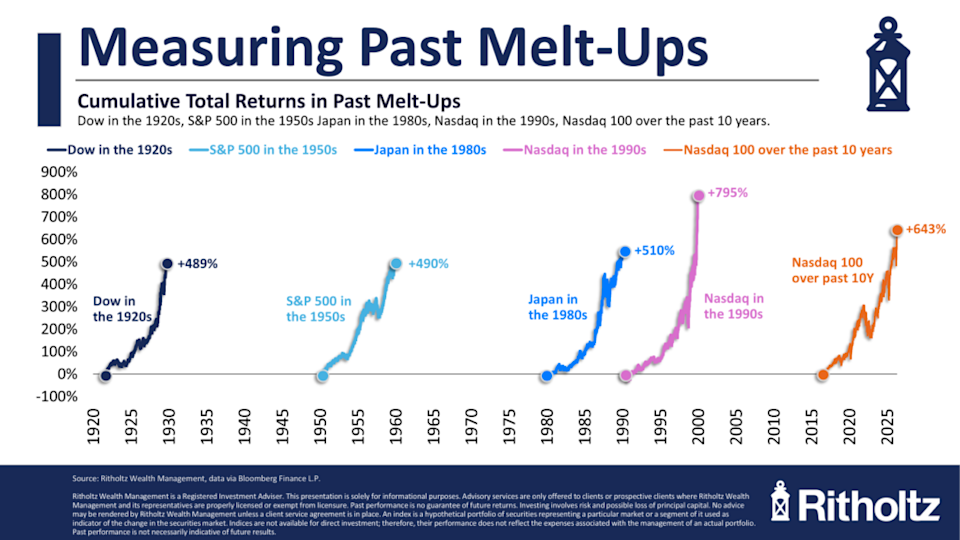
I thought the last sentence summed up the problem we have currently.
History’s weirdest bubbles do not say AI is doomed. They say the market often finds the future before it knows how to price it.
In other words, the "boom" from AI is coming. The problem is the expectations are far and away too high. Not every company can succeed, but the stock market is still rewarding anybody who has even a remote exposure to "AI".
One thing that investors are ignoring (for now), is the big run-up in interest rates. Higher interest rates hurt the highest growth companies the most. We saw that in 2022. I included a deeper look at what is happening with interest rates in the "Market Charts" section below.
Market Charts (including an inflation/bond market update)
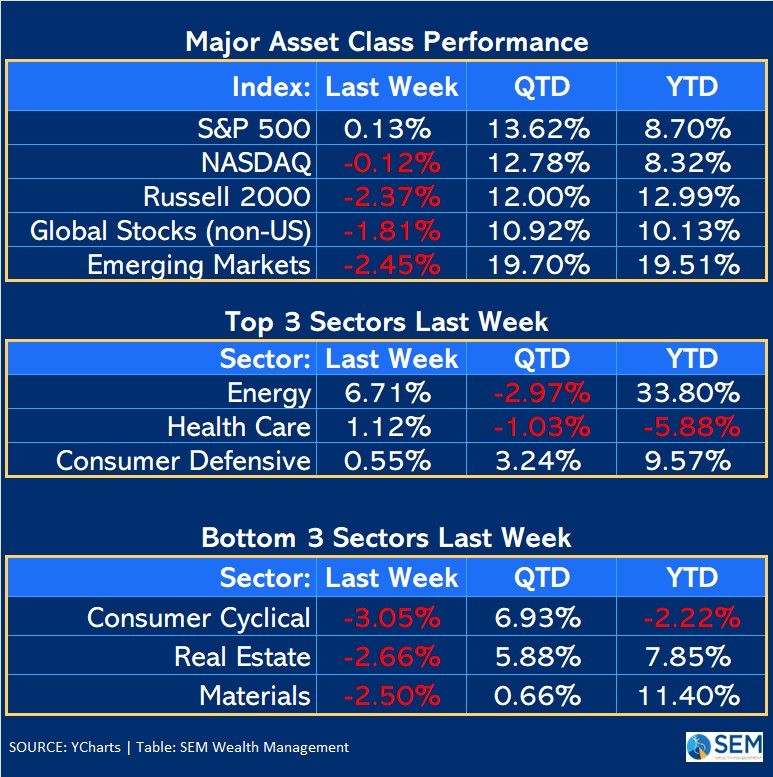
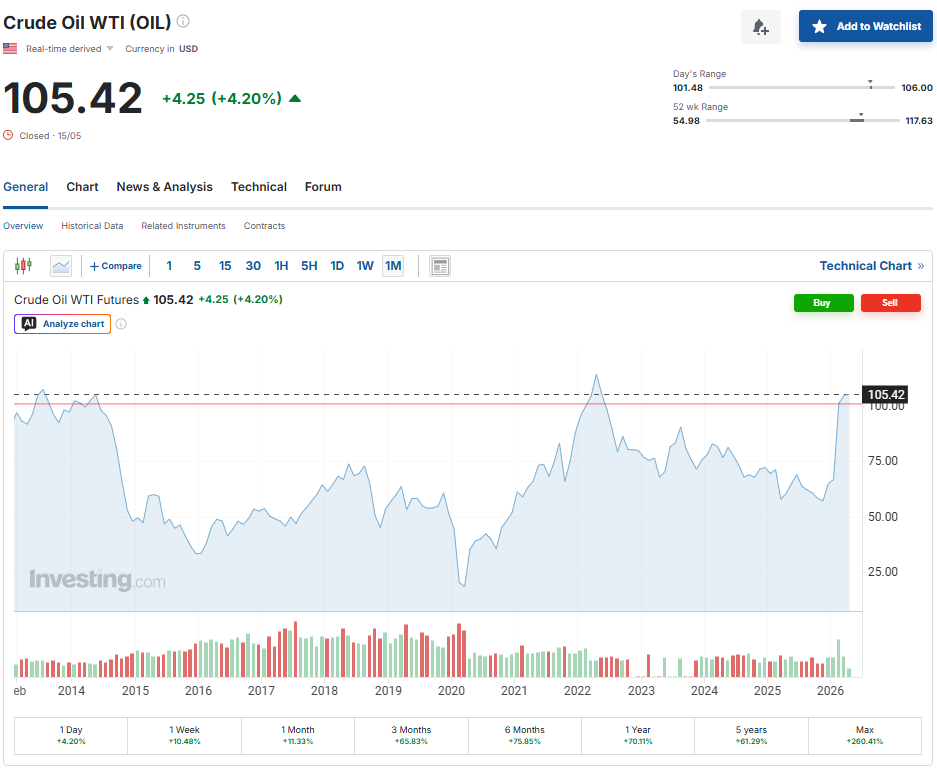
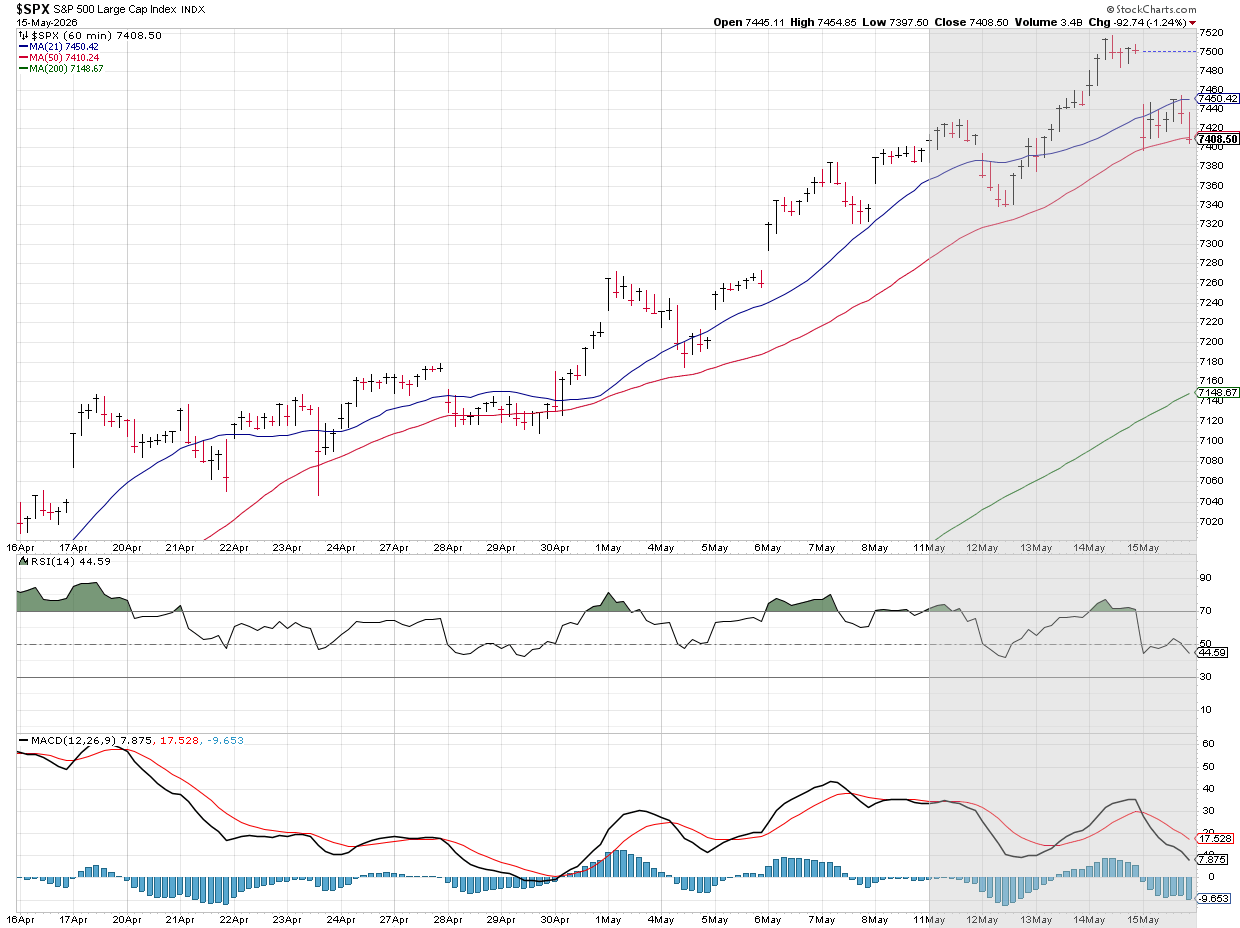
Friday's sell-off essentially just wiped out the gains for the S&P 500 and the NASDAQ. The small cap Russell 2000 was break-even going into Friday. Despite the 2% loss on Friday small caps are still leading the way in 2026. Friday's spike in oil prices boosted energy stocks. As I've said many times over the past 20 years, a President cannot simply say oil prices will go down and have them listen. Otherwise EVERY president would do that because we all know voters have short-term memories and they will blame the president if gasoline prices are high, especially as we move into vacation season.
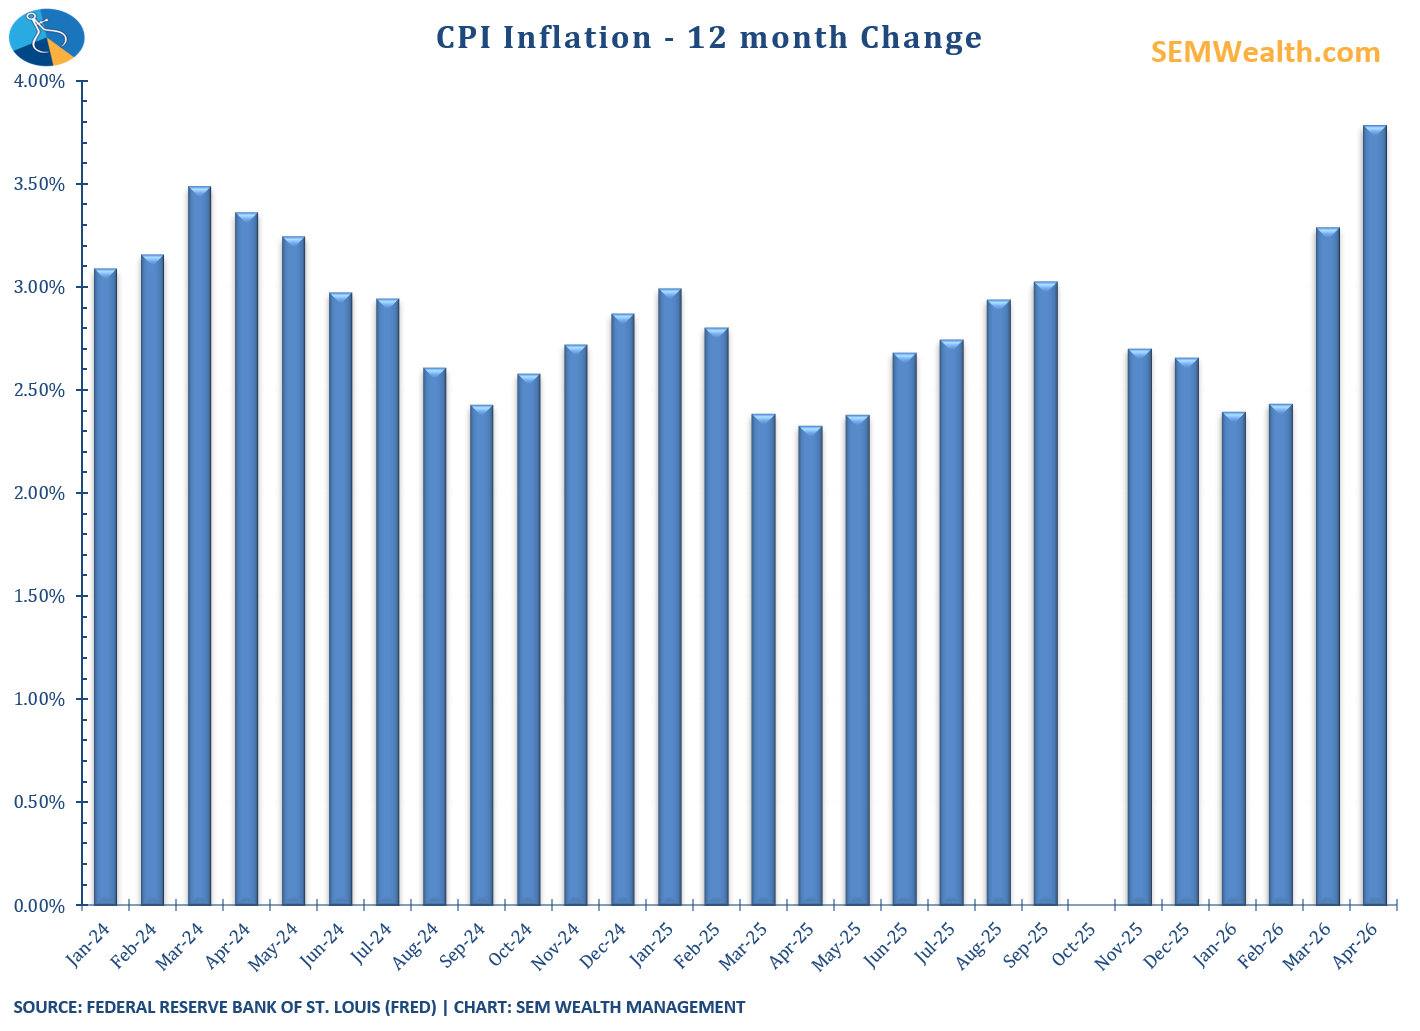
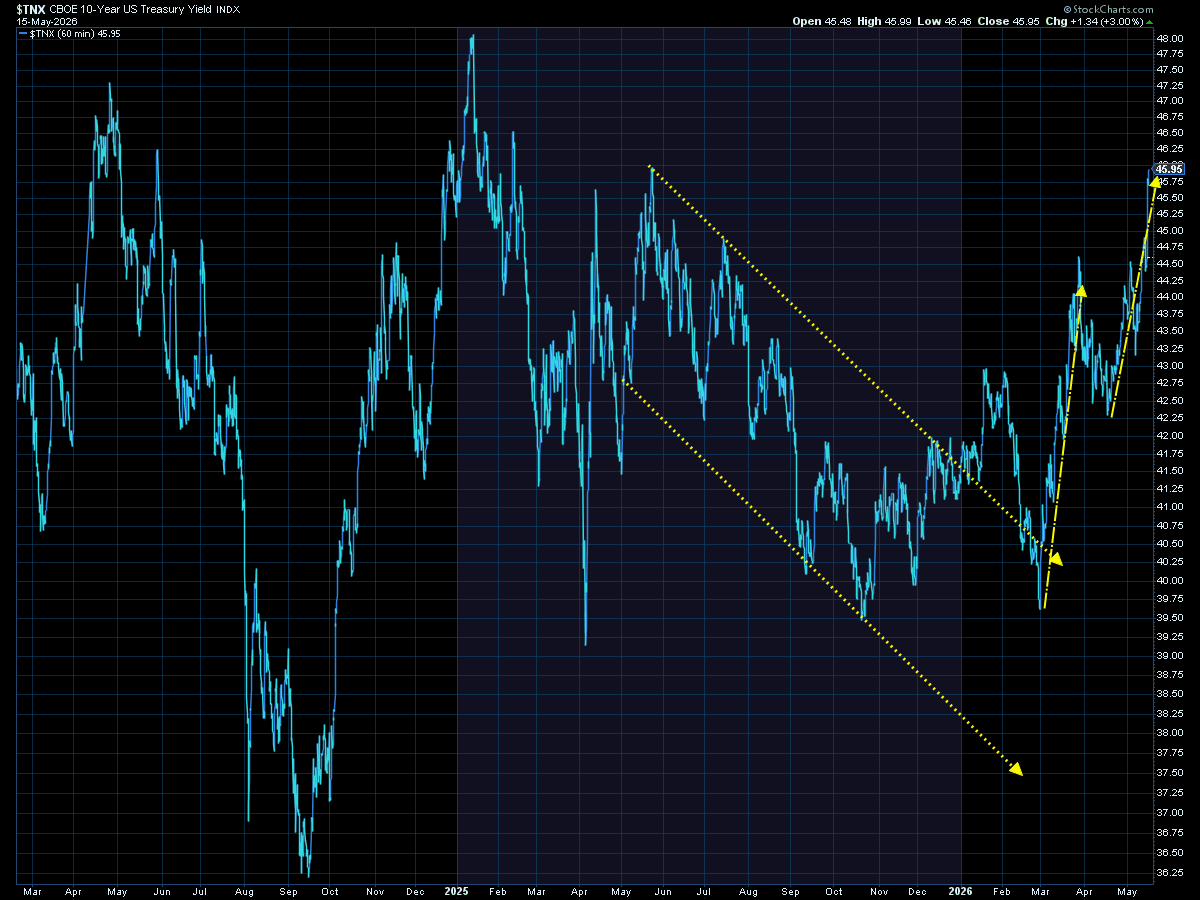
Interest rates spiked last week, helped by the fact inflation seems to be spreading beyond just oil prices and is moving far away from the Fed's 2% target.
I identified this chart last week as the most important one on my dashboard. Note the huge move up in rates last week as compared to the last 12 months.
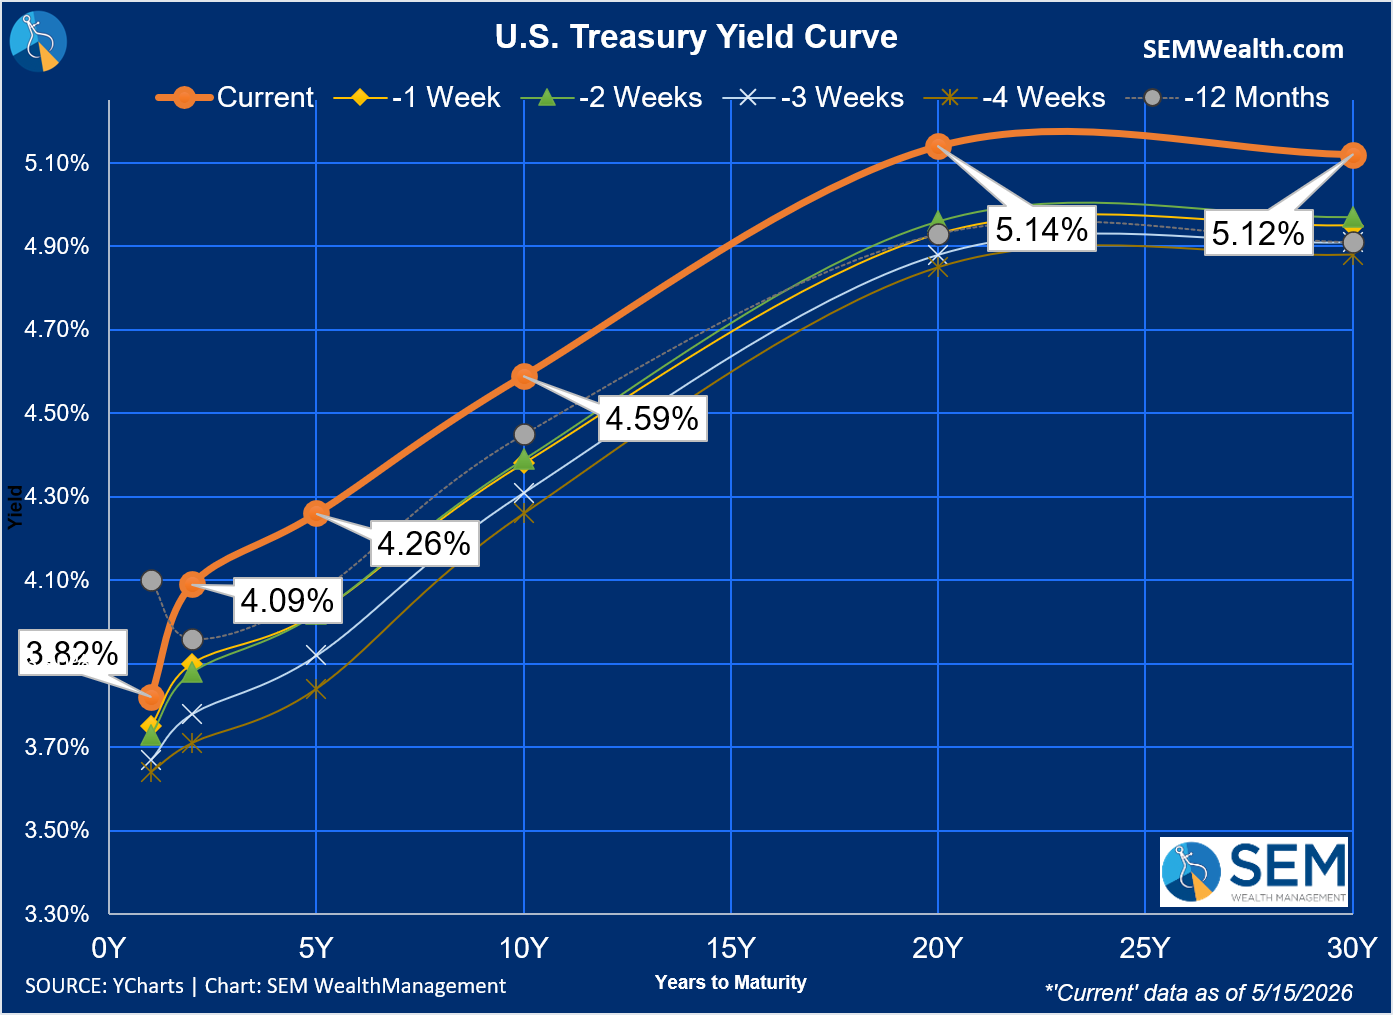
The Fed (again) has been wrong on inflation. The irony is the President wanted the Fed to cut even more aggressively. The "patient" or "too late" Fed Chair Jerome Powell should have been more forceful in fighting inflation rather than trying to "stimulate" when the labor market was already at capacity.
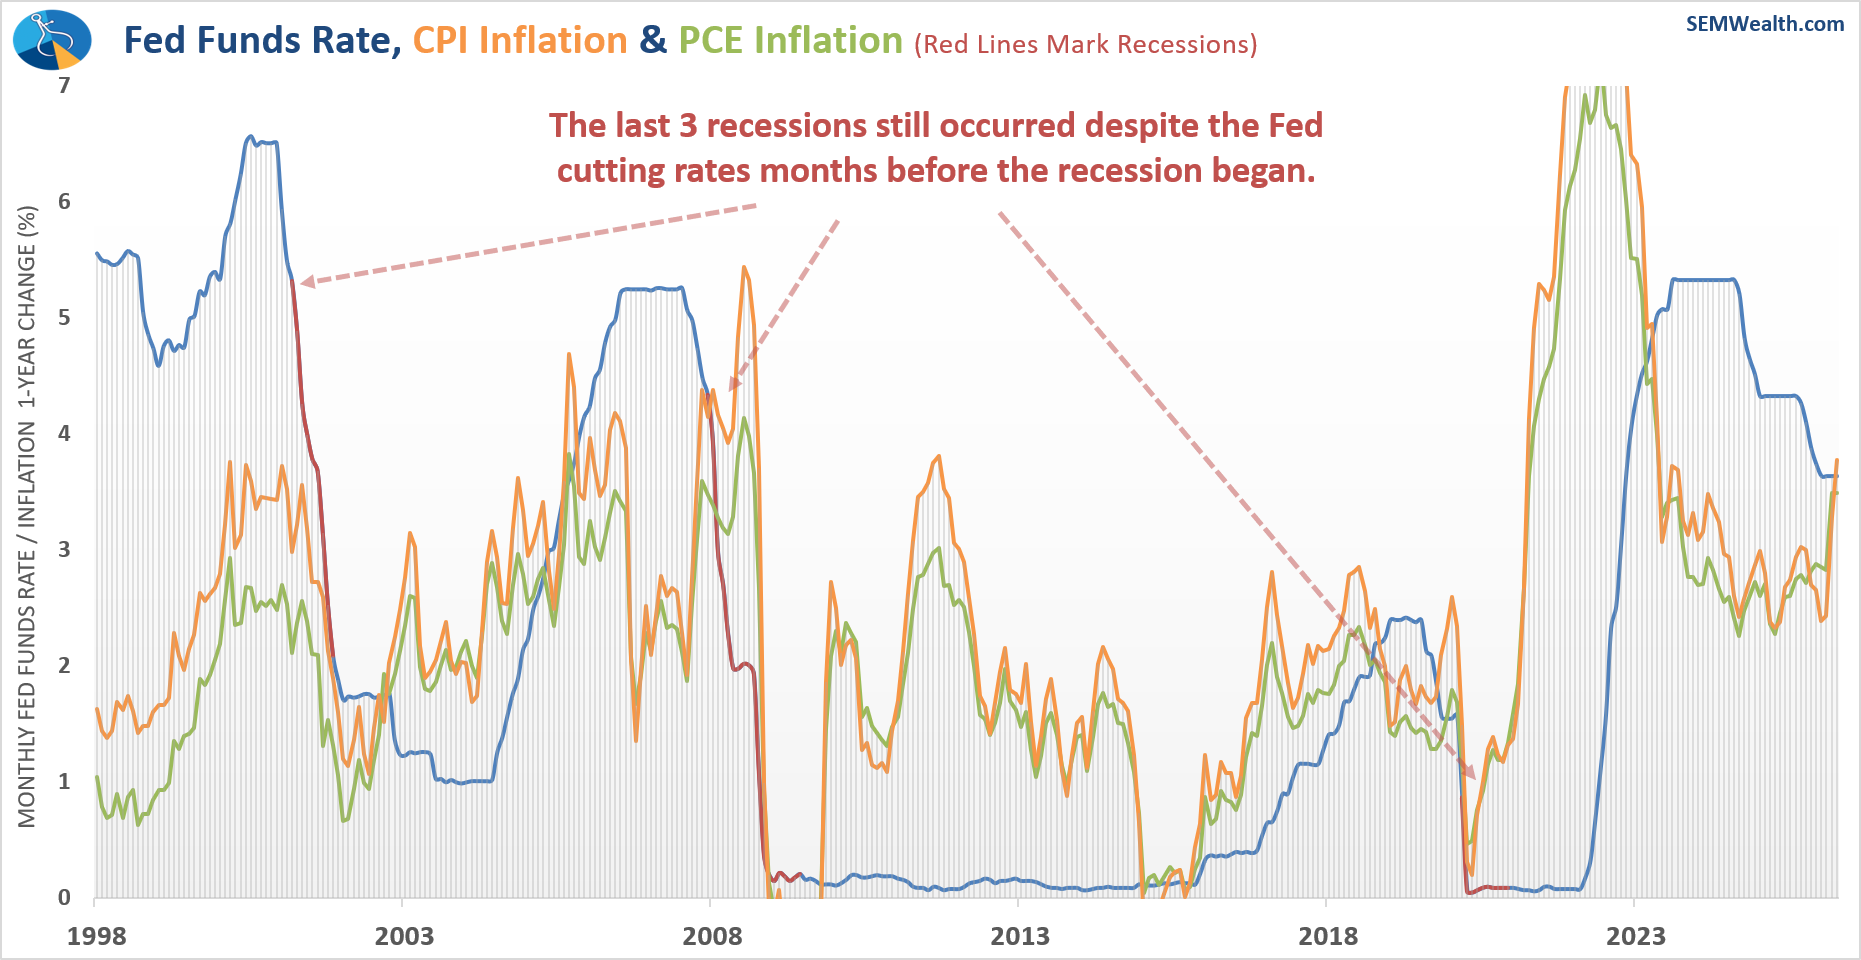
No matter what the Fed does, the free market controls longer-term rates. The 10-year Treasury is used as a benchmark for most borrowing that happens in the economy. In fact, if the Fed keeps rates low for too long (or eases when inflationary pressures were building which they did over the past 12 months), the free market may overreact. Nothing erodes the value of your bond like higher than expected inflation.
Stay tuned as we may be seeing some defensive signals if the bond market continues pushing rates higher.
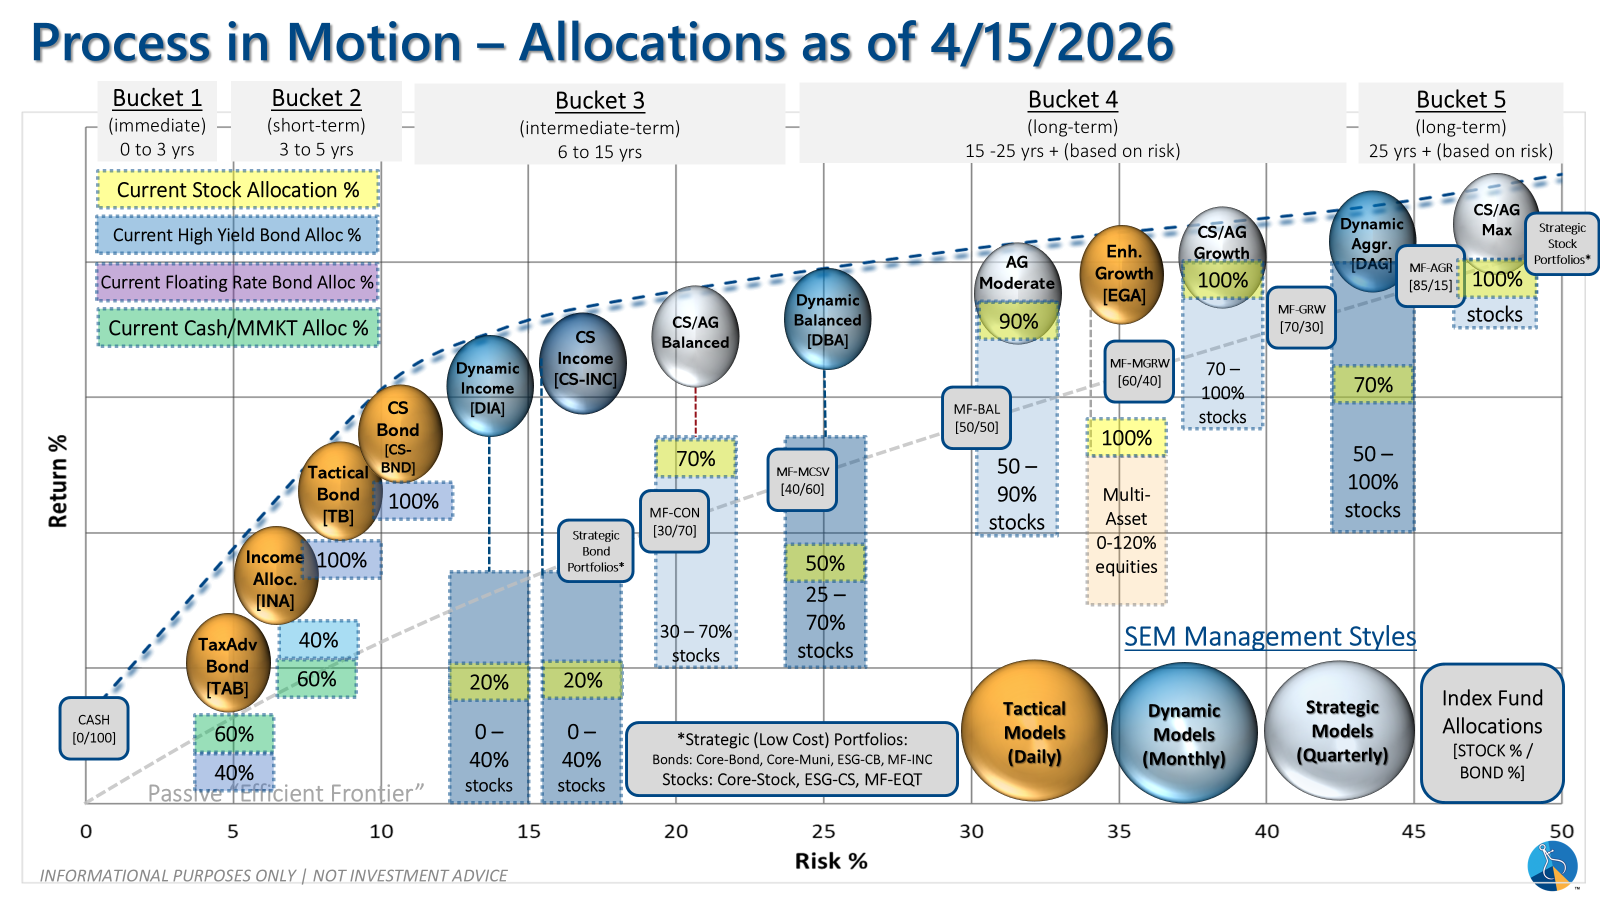
SEM Market Positioning
SEM deploys 3 distinct approaches – Tactical, Dynamic, and Strategic. These systems have been described as 'daily, monthly, quarterly' given how often they may make adjustments. Here is where they each stand.
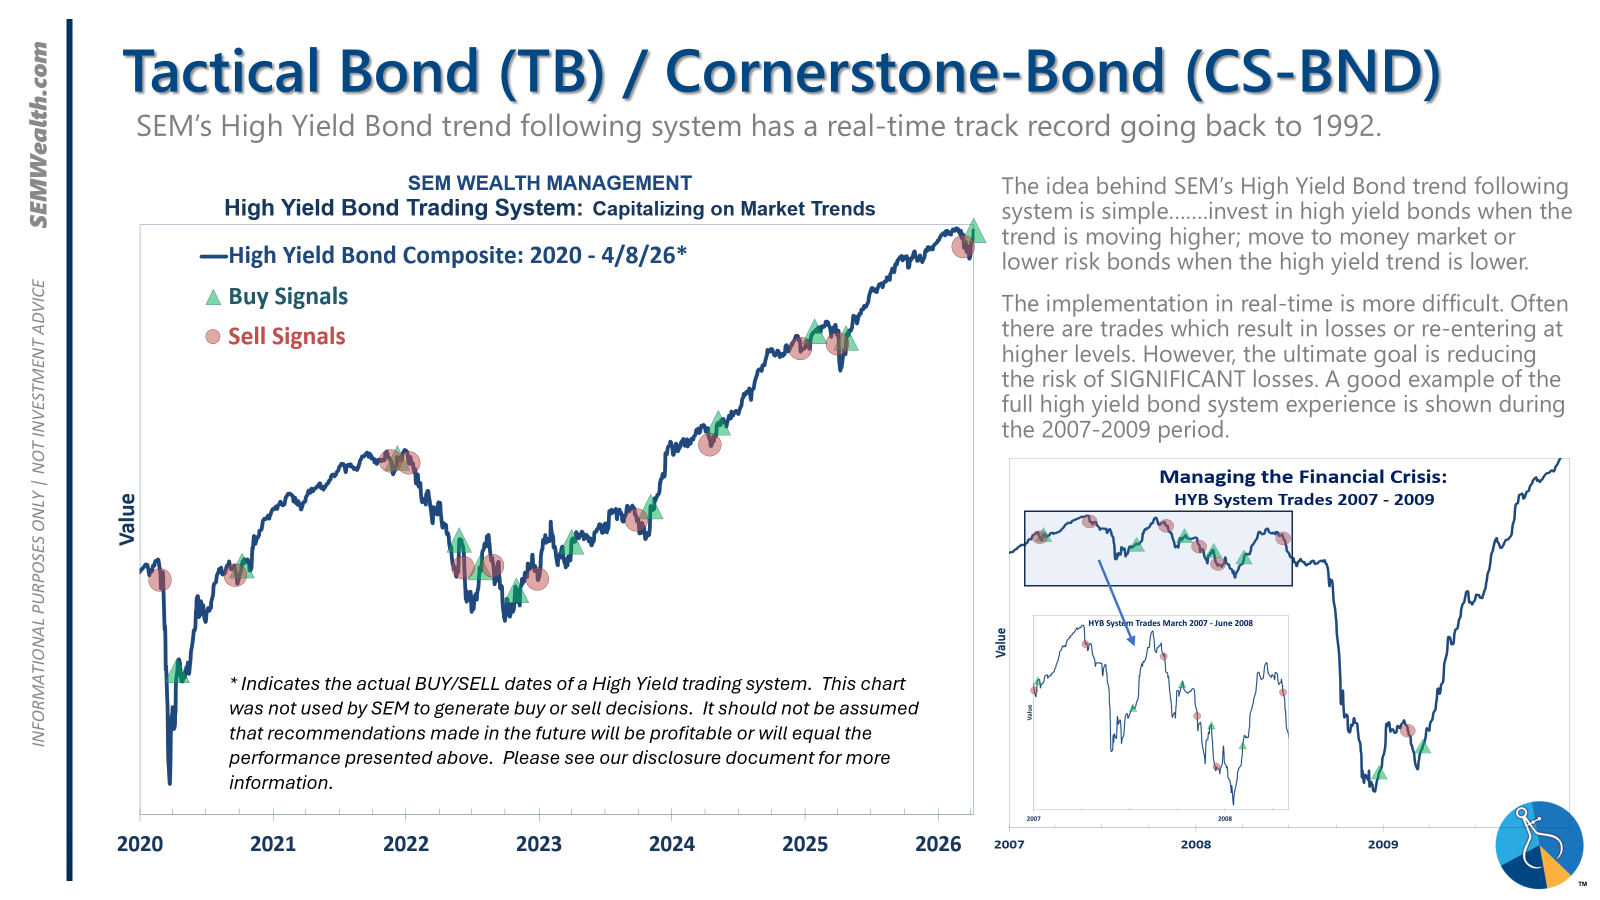
- Tactical = BULLISH | 100% High Yield Bond (4/8/2026) | High-yield spreads remain narrow but trend is slightly higher
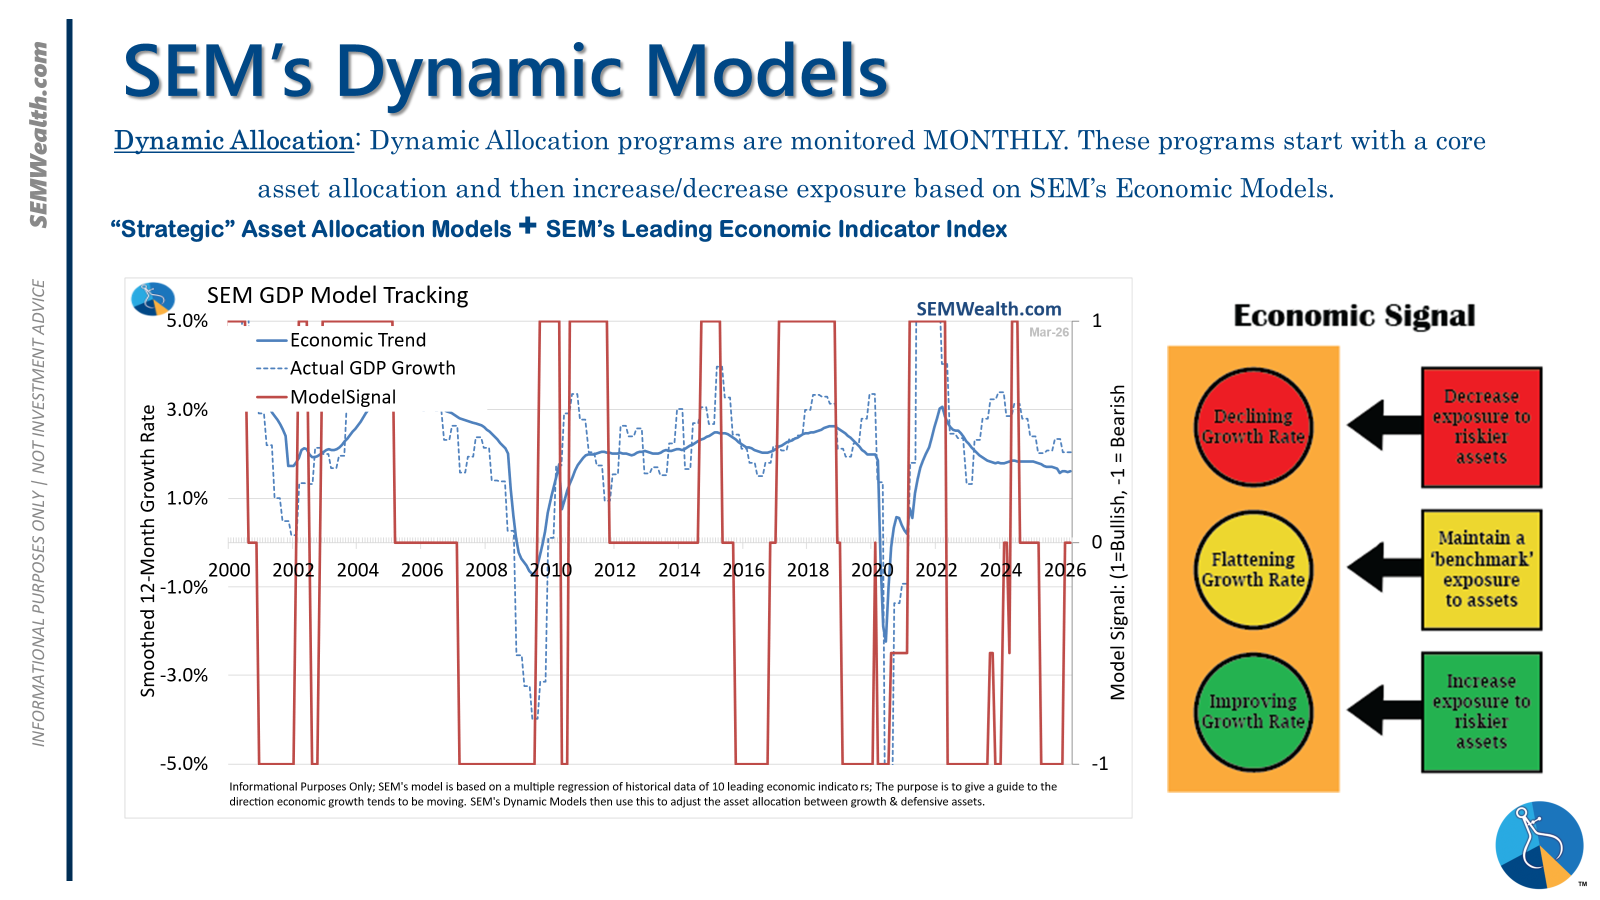
- Dynamic = NEUTRAL (2/15/2026) | "Benchmark" Allocation | Economic model inconclusive
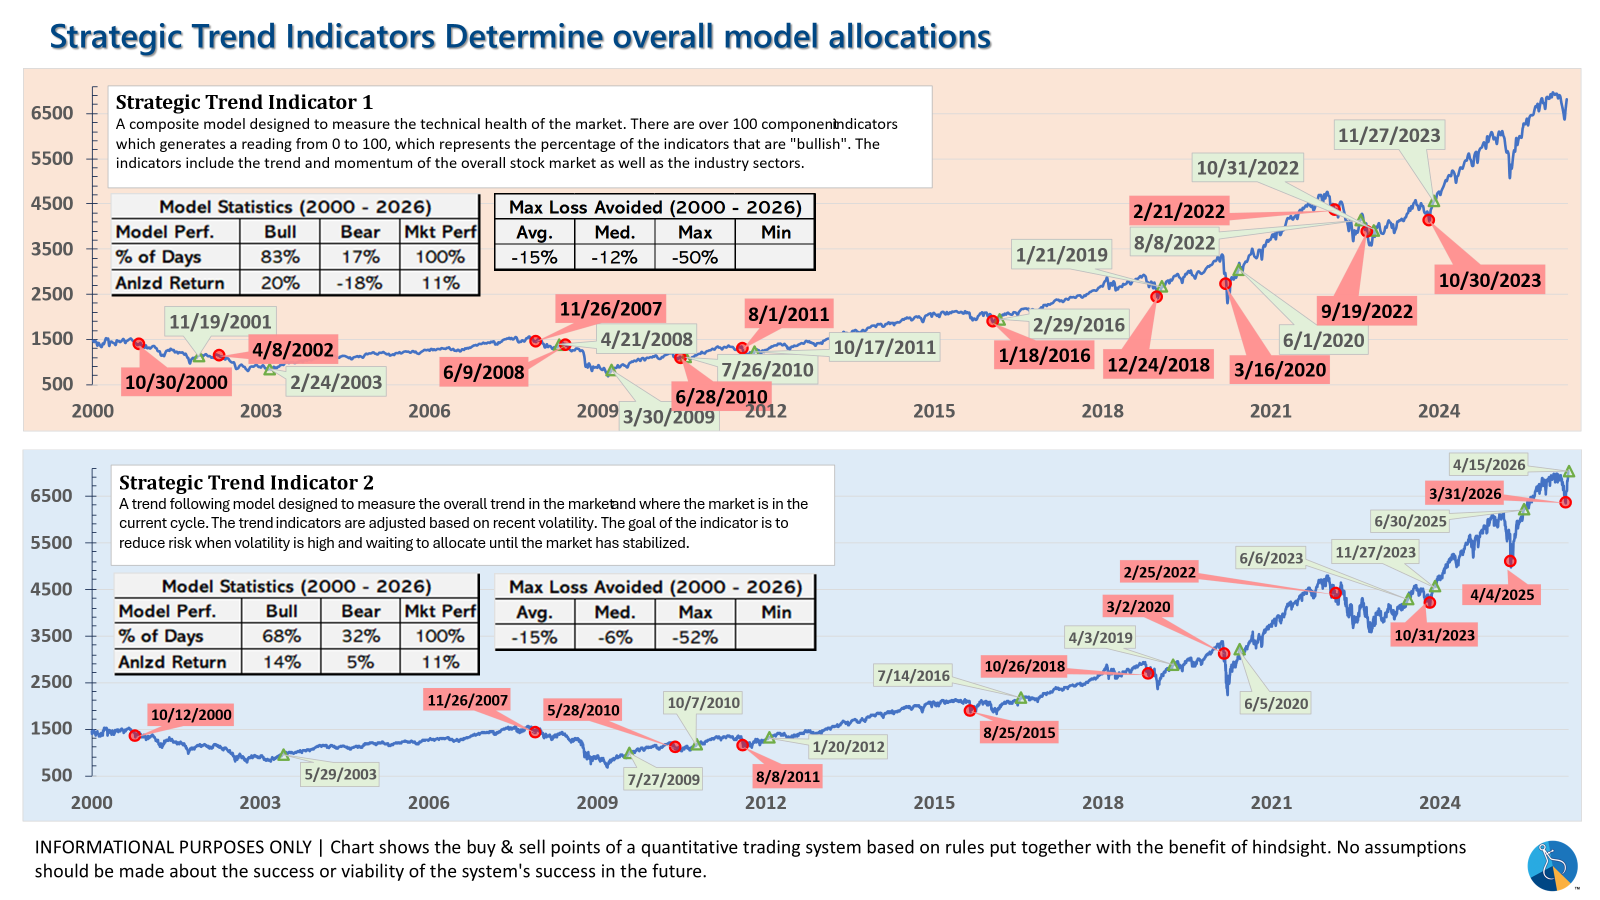
- Strategic = BULLISH (4/15/2026) | V-Bottom projecting "end" of Iran War
Tactical (daily):
- Monitored DAILY
- Models: Tactical Bond, Cornerstone Bond, Income Allocator, Tax Advantaged Bond
- Designed to follow the trends for use in our lower risk models
- BUY Signal issued April 8, 2026 (exiting the sell from March 13)
Dynamic (monthly):
- Monitored MONTHLY
- Models: All "Dynamic" Models (Income, Balanced, Growth, and Asset Allocator)
- Uses SEM's Quantitative Economic Model
- Designed to overweight riskier assets if economic trend is higher & underweight those assets if economic trend is lower.
- NEUTRAL signal issued February 15, 2026 (following BEARISH signal from July 2025)
Strategic (quarterly)*:
- Monitored QUARTERLY
- Models: AmeriGuard (Balanced, Moderate, & Growth) and Cornerstone (Balanced & Growth)
- Core Component: Quantitative Filter using 4 different time horizons across universe of asset classes
- Trend Indicator: Two different Quantitative Systems monitoring the intermediate-term trend, health of the market, and volatility
- CORE has been overweight small cap and international since October 2025 – overweight increased slightly in January
- Both TREND INDICATORS are BULLISH following 10% drop and "V-Bottom" reversal in early April
- AmeriGuard & Cornerstone Max DO NOT use the Trend indicator and are always 100% invested in stocks using our CORE rotation model.
The core rotation is adjusted quarterly. This quarter we saw half of our international positions reduced (we sold developed markets and kept our emerging markets exposure). We also saw the remaining share of mid-cap reduced in favor of more small cap exposure. We remain with a "barbell" core portfolio – about half in large cap and half in small cap as the models expect the market to "broaden".
The * in quarterly is for the trend models. These models are watched daily but they trade infrequently based on readings of where each believe we are in the cycle. The trend systems can be susceptible to "whipsaws" as we saw with the recent sell and buy signals at the end of October and November. The goal of the systems is to miss major downturns in the market. Risks are high when the market has been stampeding higher as it has for most of 2023. This means sometimes selling too soon. As we saw with the recent trade, the systems can quickly reverse if they are wrong.
Overall, this is how our various models stack up based on the last allocation change:
Curious if your current investment allocation aligns with your overall objectives and risk tolerance?


