
If you listened to the "experts" discuss the latest jobs numbers, you might think things are picking up for the economy again. If you watch stock prices, you'd think the economy was roaring. But take a step back and the picture looks a little different. Job growth is not really accelerating. It is slowing down and starting to level off, getting closer to that point where the economy feels like it is running out of momentum. It is kind of like watching a big plane moving down the runway and wondering if it actually has enough lift to get off the ground.
The April Payrolls report showed a "surprising" jump in the estimated number of jobs 'created' in April (+115K when economists expected 55K). This is down from the 160K in January and 185K in March (after February saw job losses of 156K.
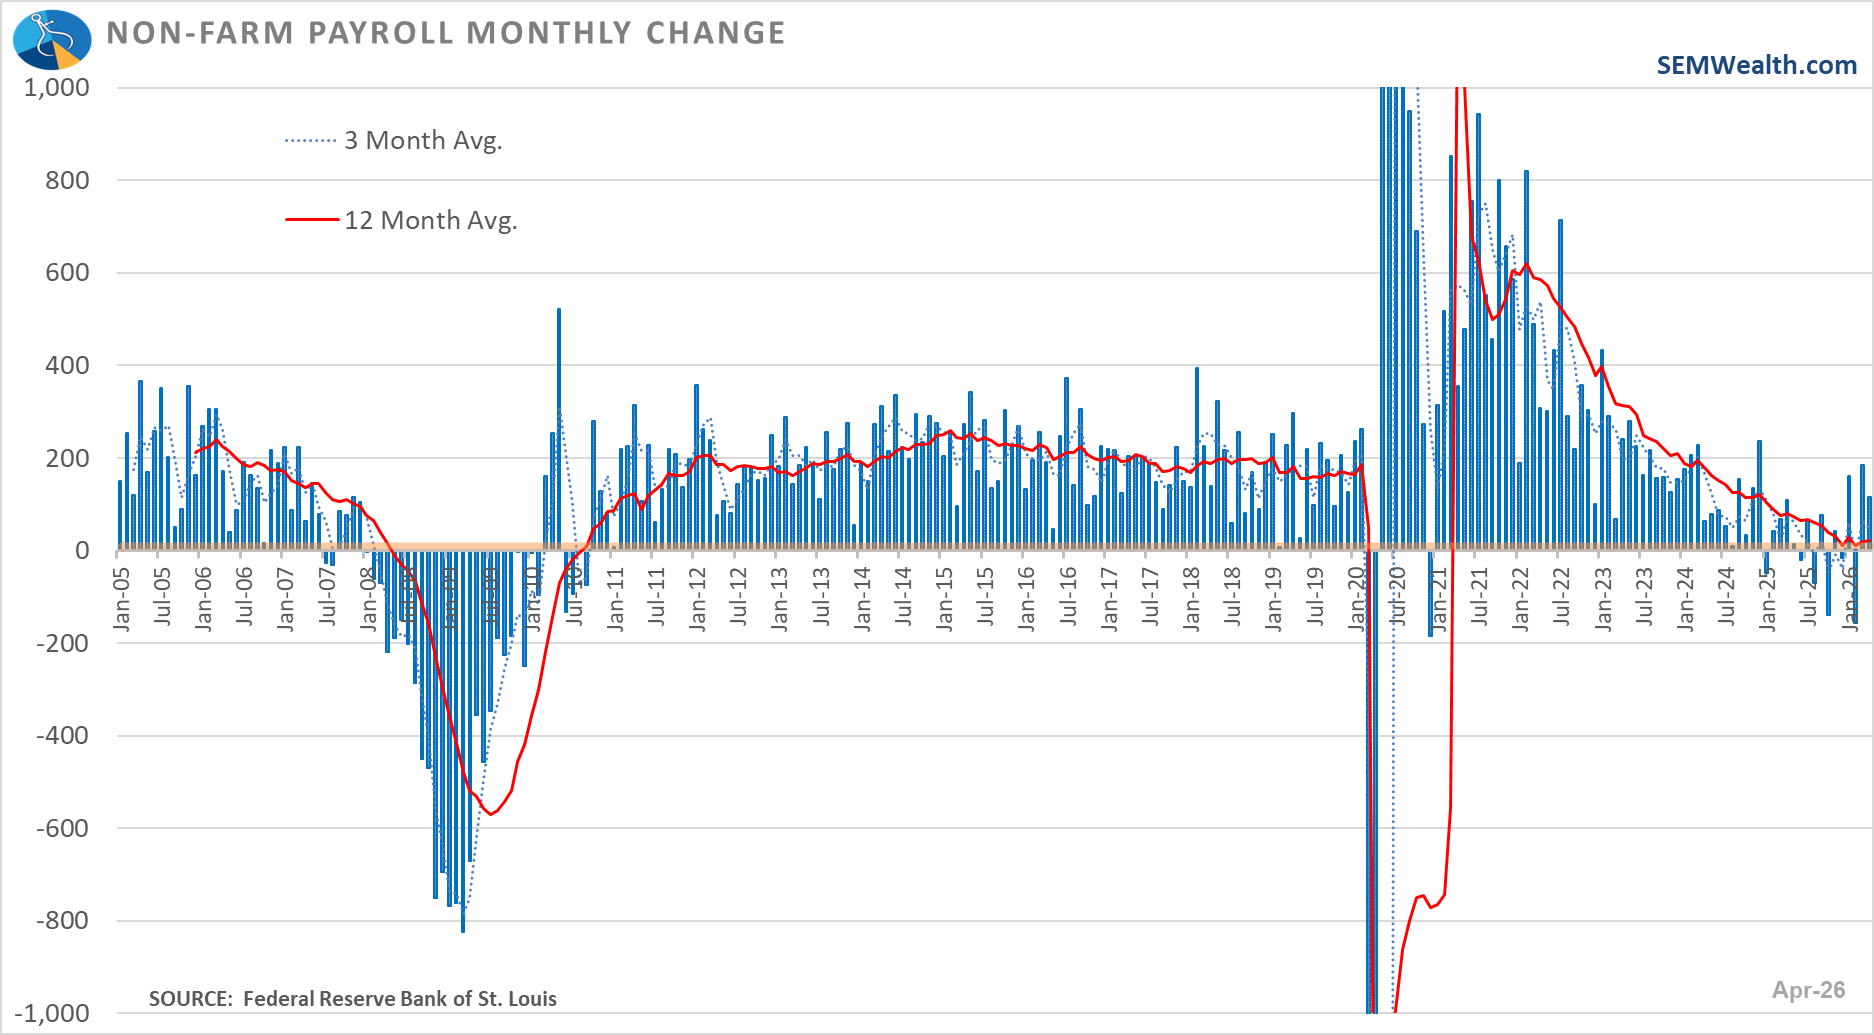
The 12-month average in the chart above (the red line) is at 20K – basically a rounding error between positive and negative. The 12-month rate of change is 0.16%. In other words, the economy has essentially the same number of jobs as we had last year at this time.
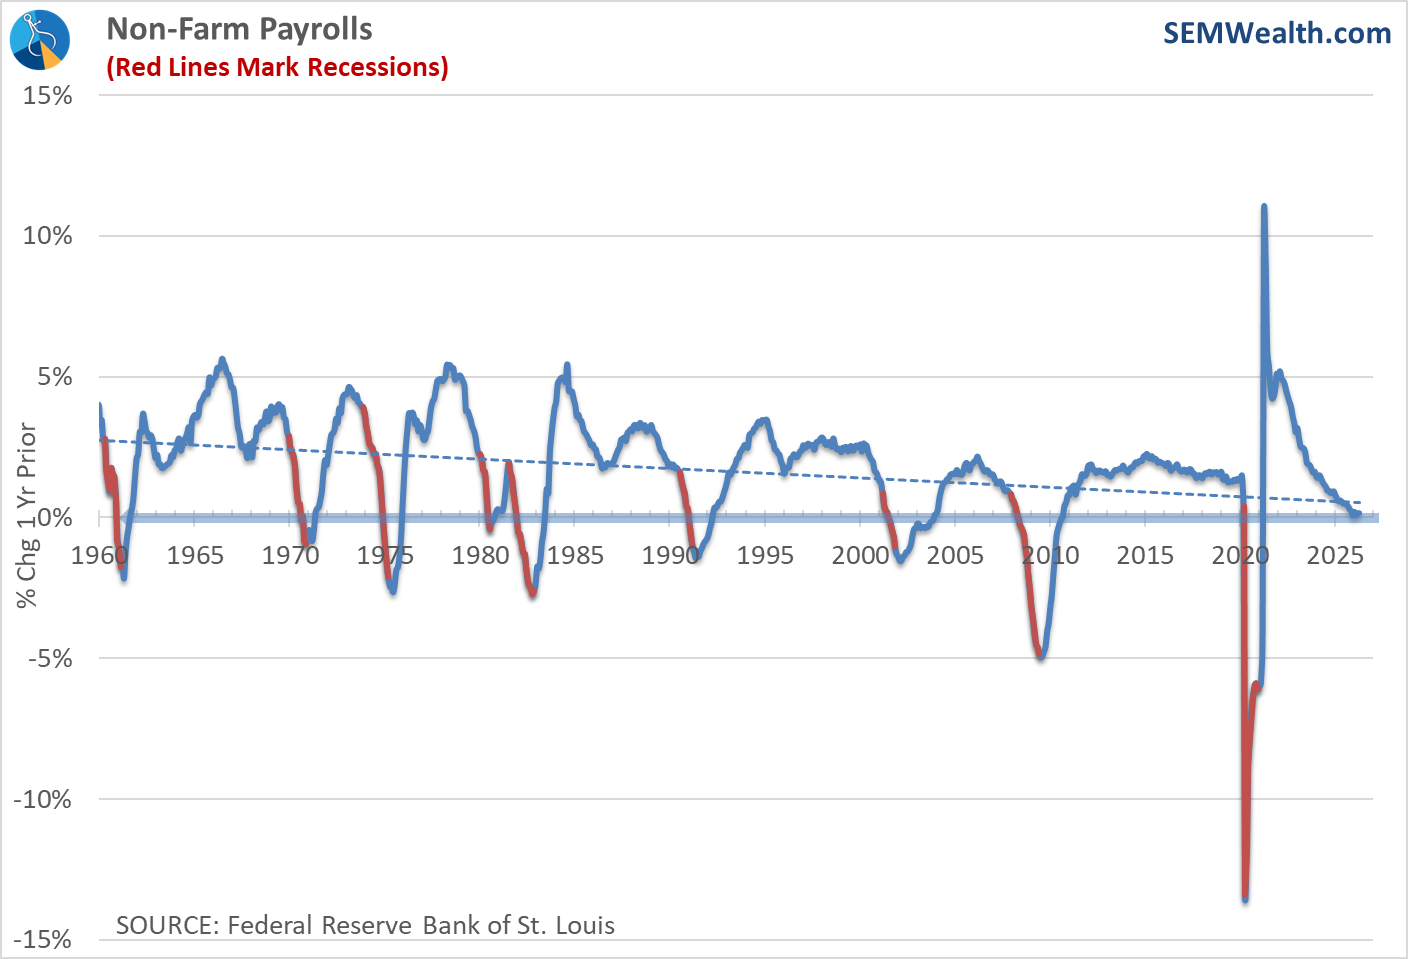
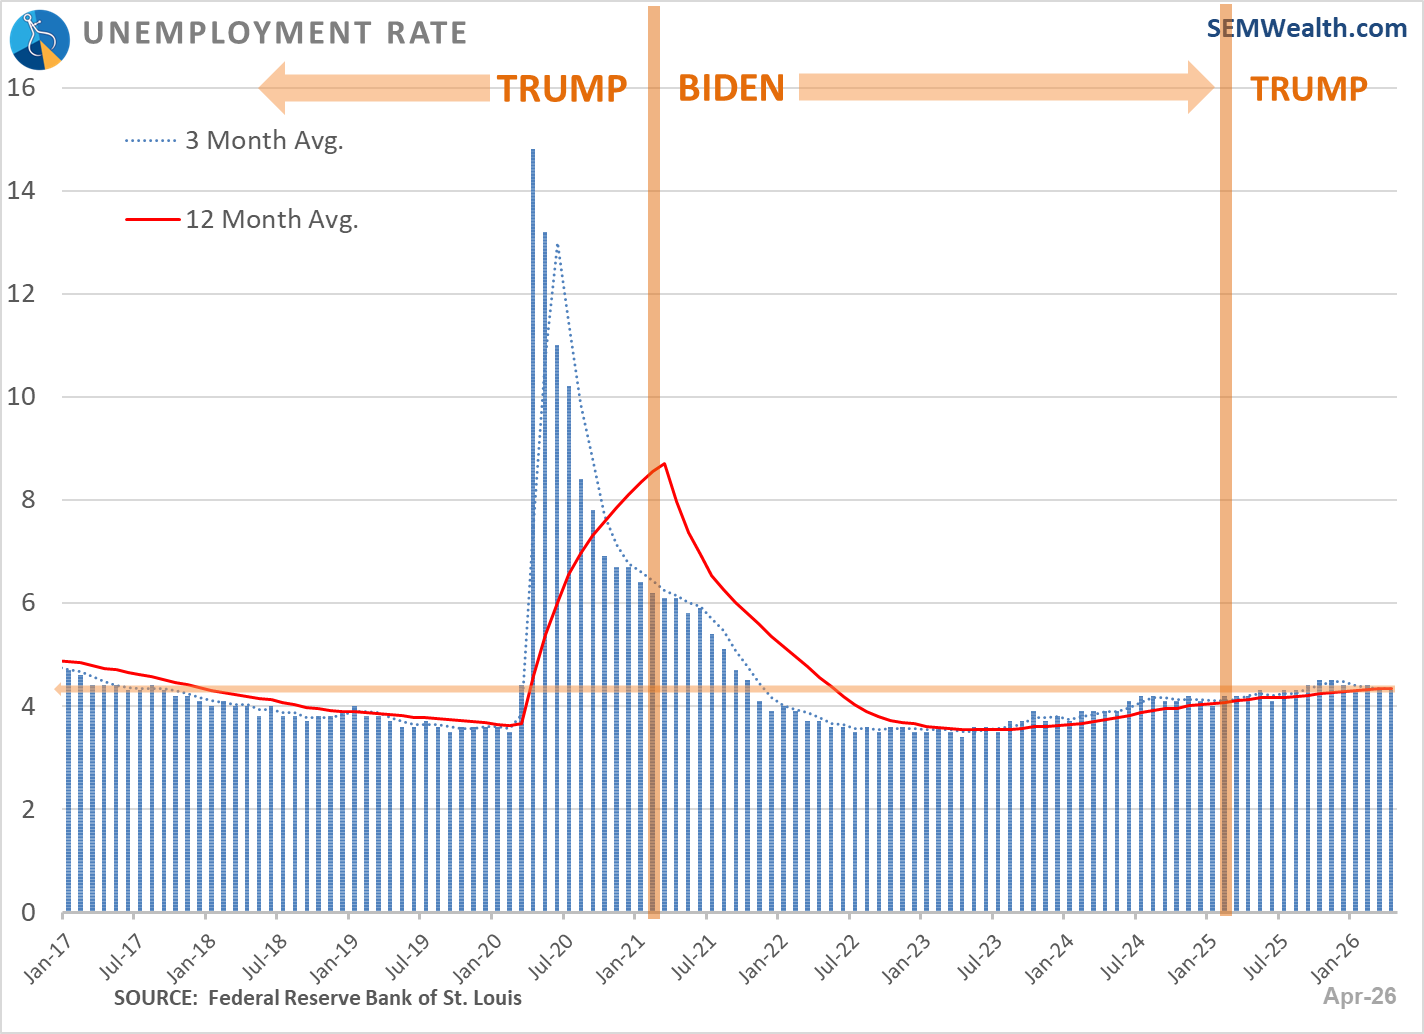
Going back to the 1960s, every time we approached 0% job growth we were already in a recession. We aren't quite there yet, but the economy is clearly teetering. The unemployment rate remained essentially the same. It's been gradually rising since the summer of 2023.
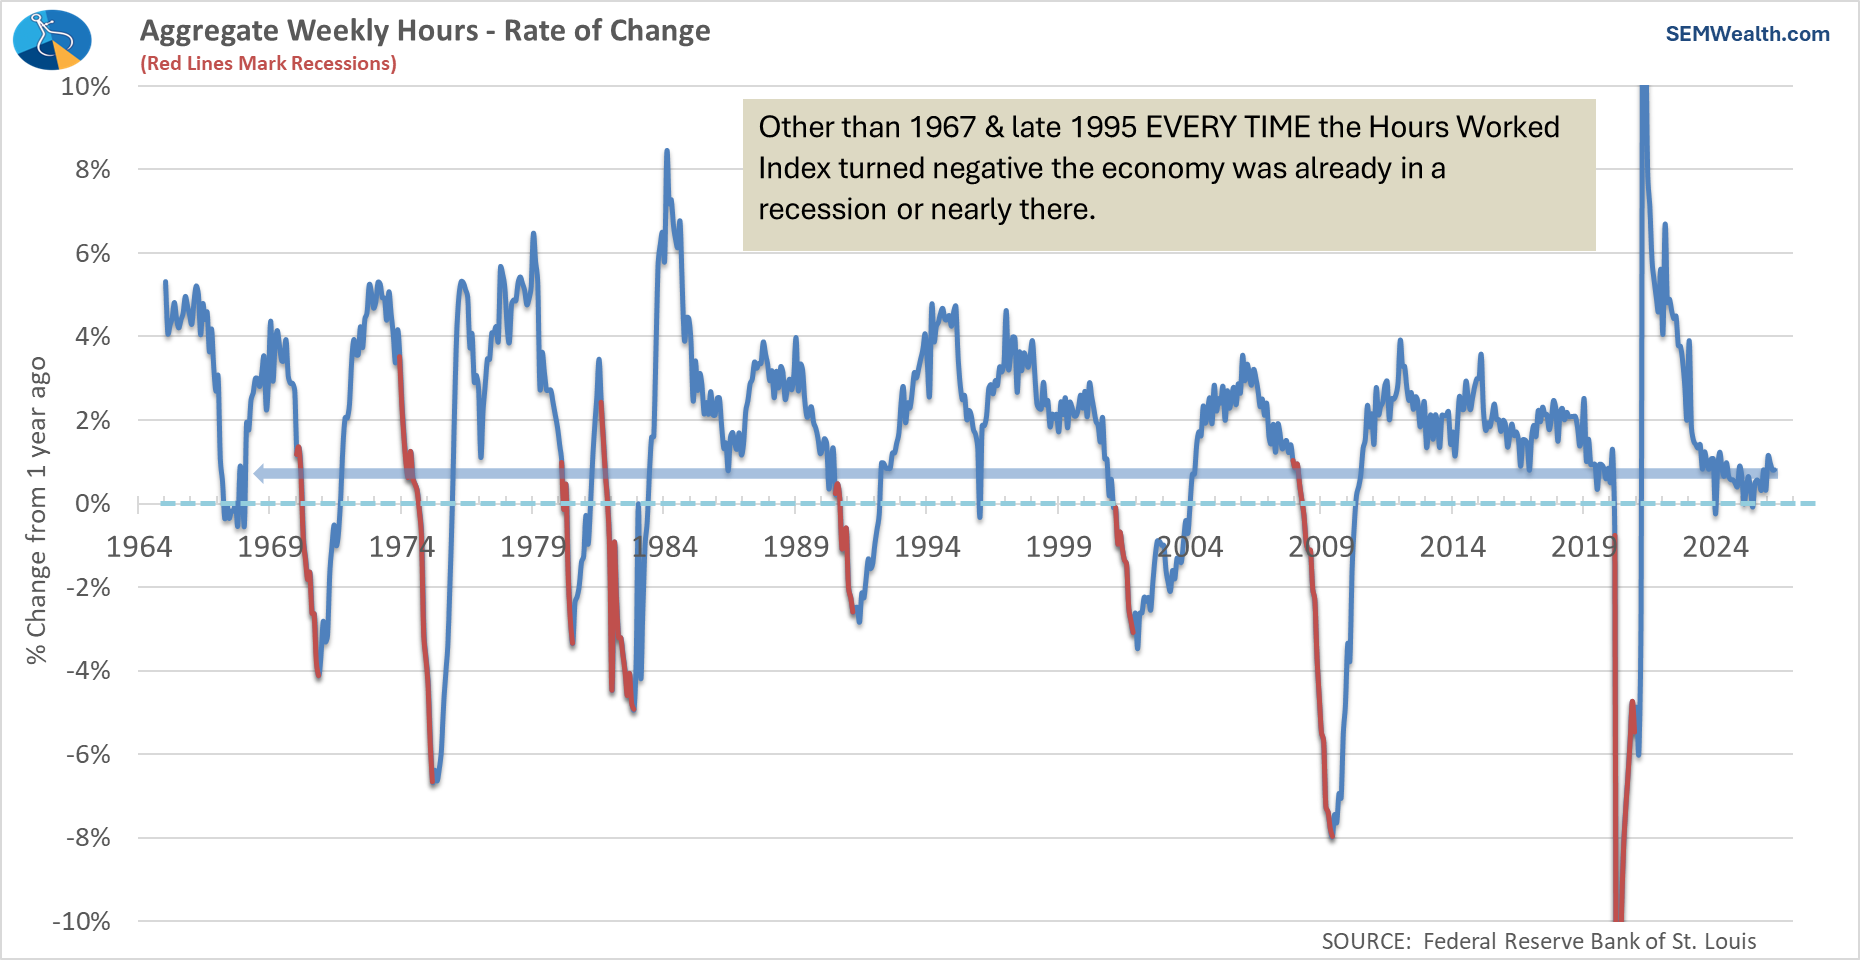
The average work week has been essentially flat the entire year. The year-over-year change is just under 1%. As noted below, if this goes negative it is a fairly strong sign we are heading towards a recession.
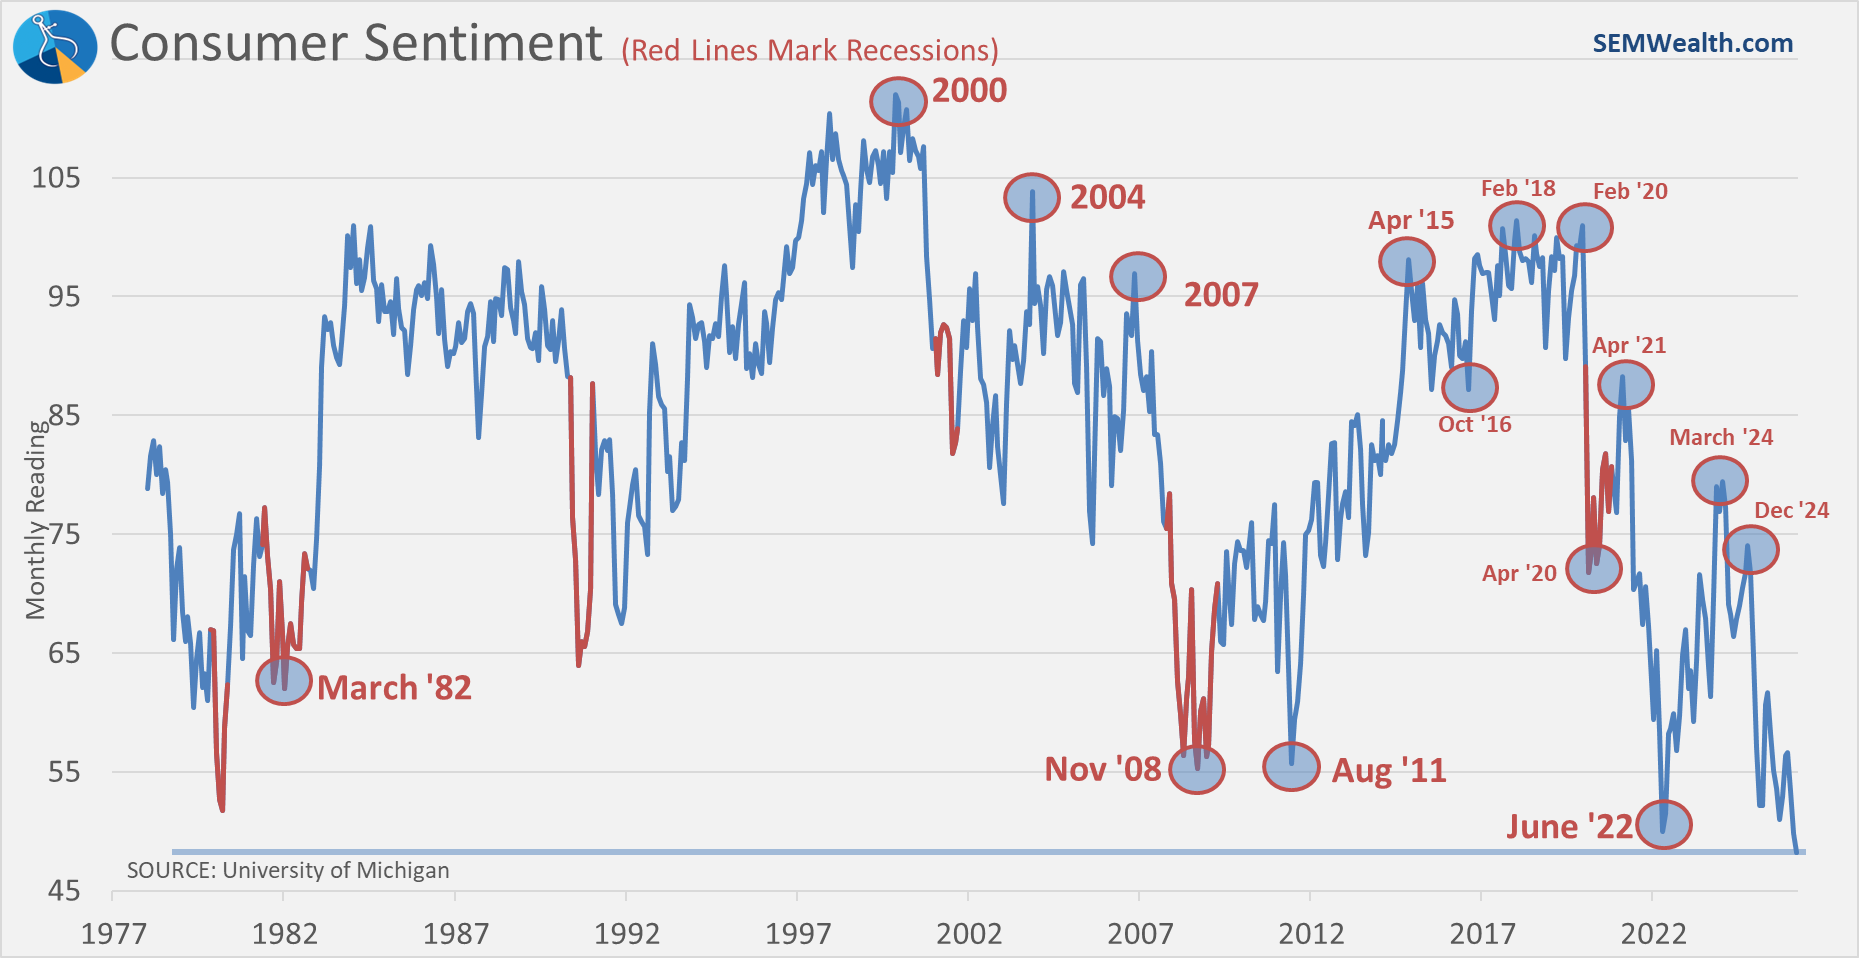
While Wall Street was talking about the "strong" labor market, Consumers have literally never felt worse about the prospects of the economy, at least according to the University of Michigan Consumer Sentiment index. Even with oil coming back down and the apparent winding down of our war with Iran, sentiment in the most recent survey broke the all-time low of last month. This is lower than when inflation was at 9% back in June 2022 or in the mid-teens in the early 1980s. Combine rising prices with a stagnant labor market and it's hard to feel excited about the future if you're in the middle class right now.
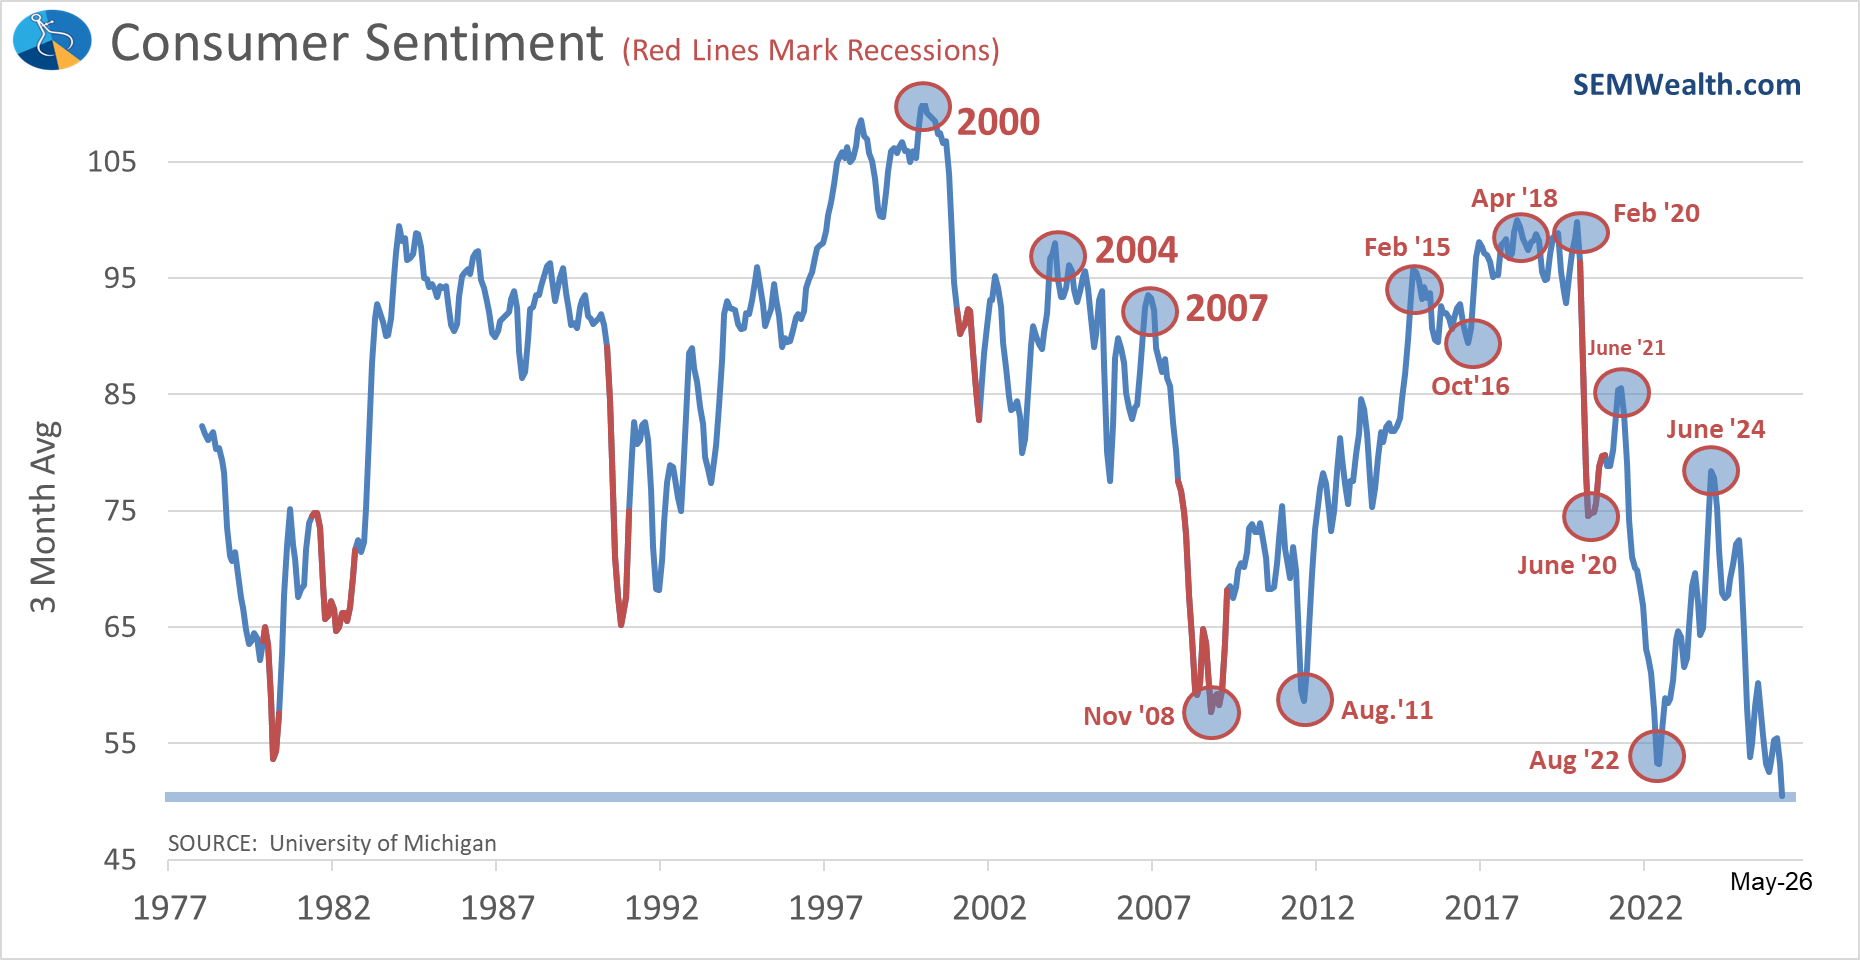
Even using the 3 month moving average, sentiment is not looking great.
When you combine all this together, we get a lackluster economy. It's not yet heading to a recession, but it's also not showing strong growth. What's holding the economy up? Based on our indicators, it is stock prices and consumer spending (which is dollar weighted meaning those in the upper half of the 'K' can offset a slowdown in spending from the lower half since they have more money to spend.)
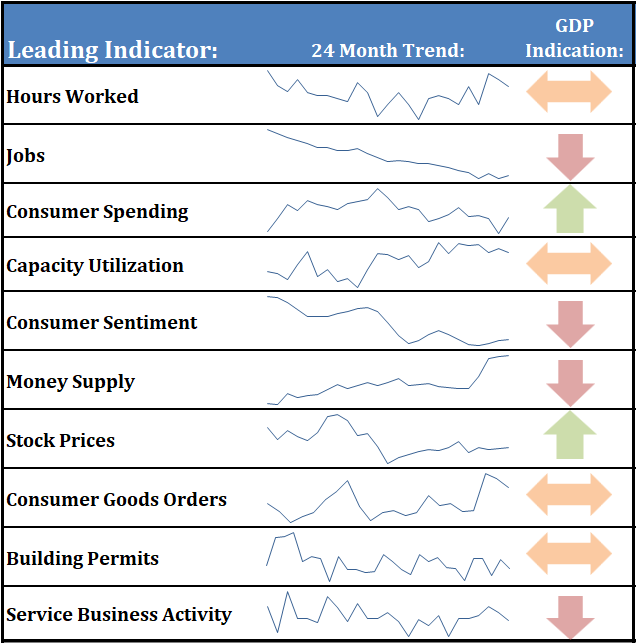
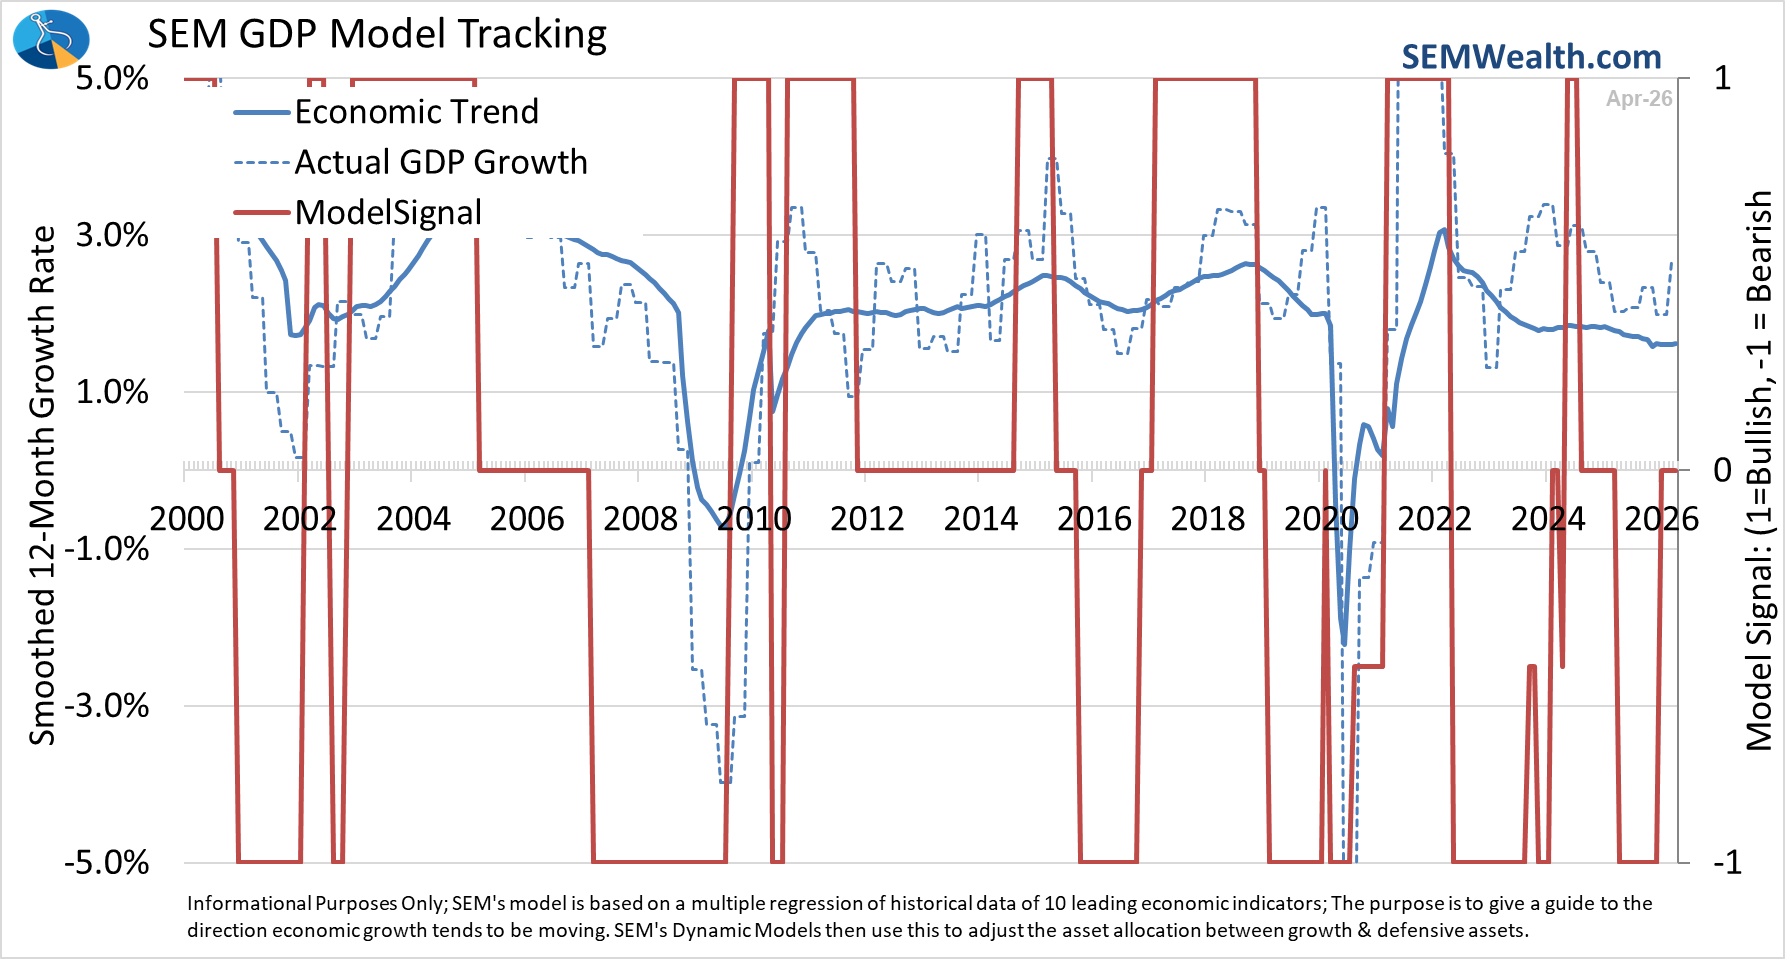
Here's a look at our model, which remains "neutral".
There are no releases scheduled for any of our leading indicators next week.
What does the Fed do?
Interest rates crept lower a bit on Friday as the continued "flat" labor market reignited some to believe the Fed could lower interest rates to help create more growth. The problem of course is what we noted last week:
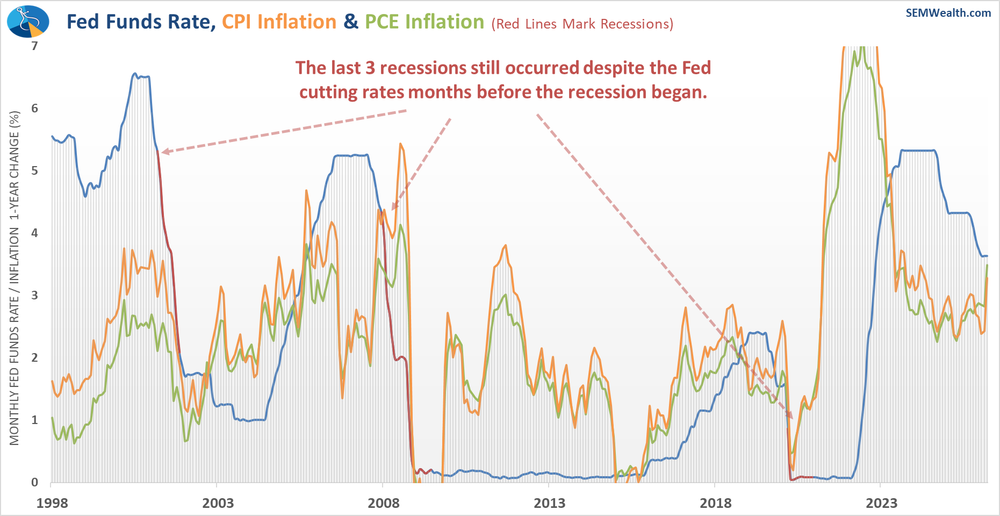
Even before the war in Iran, inflation was moving higher. The longer oil prices remain high the more baked in inflation will be as it works its way through the supply chain. This chart should be at the front of every pitch deck given to a Fed member. The Fed aggressively cut rates and inflation has been going up. If they were to cut more they risk sparking another round of uncomfortably high inflation.
Tuesday brings us the April CPI report. It will be interesting to see how high it is and how the market reacts. As I said last week, no president can simply will prices to go lower (or tell us they will be heading lower). Otherwise, EVERY president would use their powers to keep inflation low (and growth high).
Can AI Mania keep the market at all-time highs?
Other than a 6 month period at the end of 2025 and the beginning of this year, mega-cap growth stocks have pulled the stock indexes higher. They hit an air pocket during that time, but since the President backed off on his "end their civilization" threats against Iran at the end of March, mega-cap stocks have again been the star. Earnings have most certainly backed up this enthusiasm and there appears to be no end in sight. Guessing when/if that comes to an end is a losing game. We'll keep riding the trend as long as we can and enjoy the gains it is bringing.
Before chasing stocks higher I would remind everyone that higher interest rates hit the highest growth stocks the hardest (remember 2022?). Even though the President will have his preferred Fed Chair and he wants interest rates "at least 1% lower", if inflation keeps going in the wrong direction, the Fed may have to raise rates. Even if the Fed doesn't and the free market pushes long-term rates higher, we could see the highest growth stocks take a big hit.
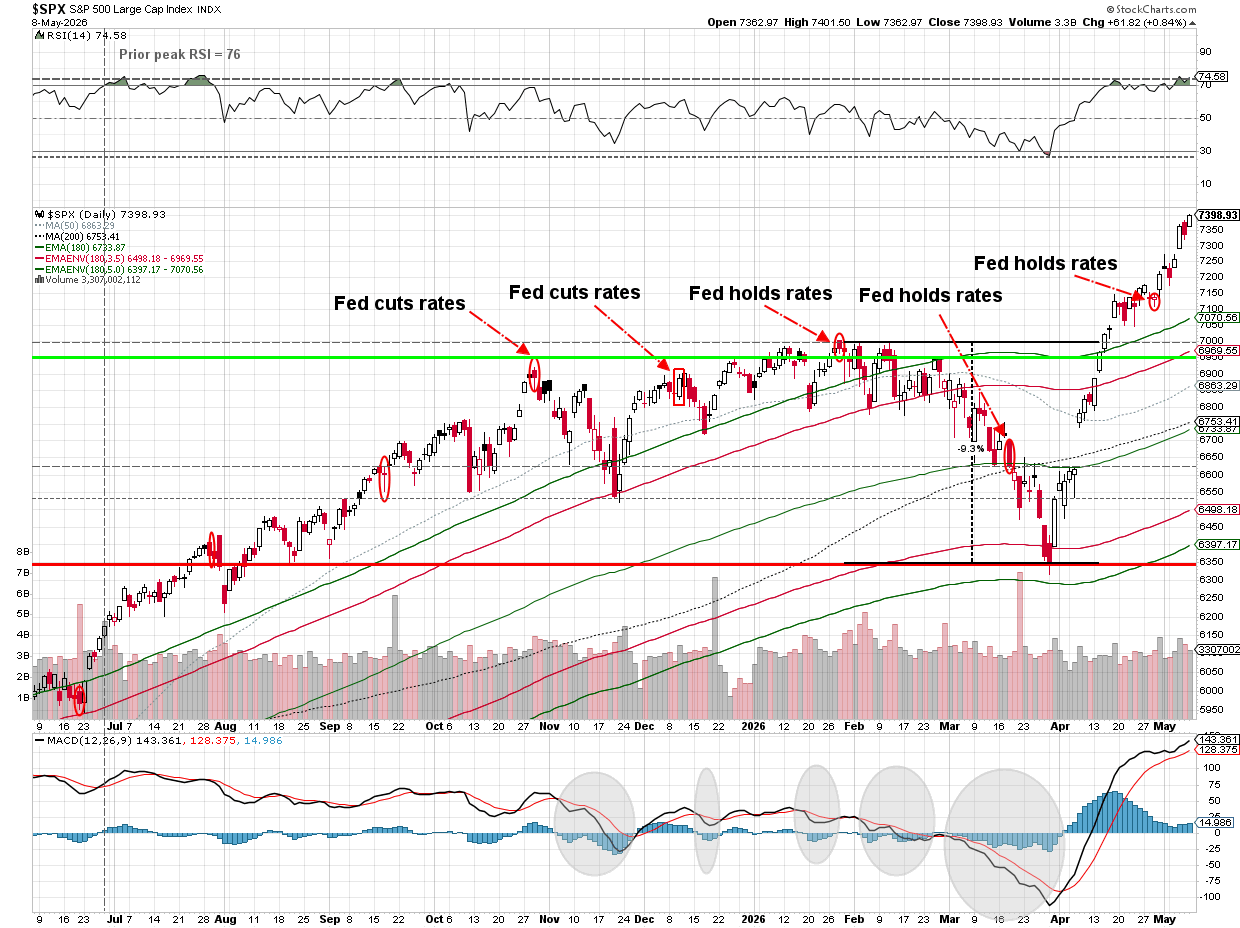
That means rather than watching the S&P 500 and NASDAQ hit all-time highs on their charts, the most important chart for stock investors is this one.
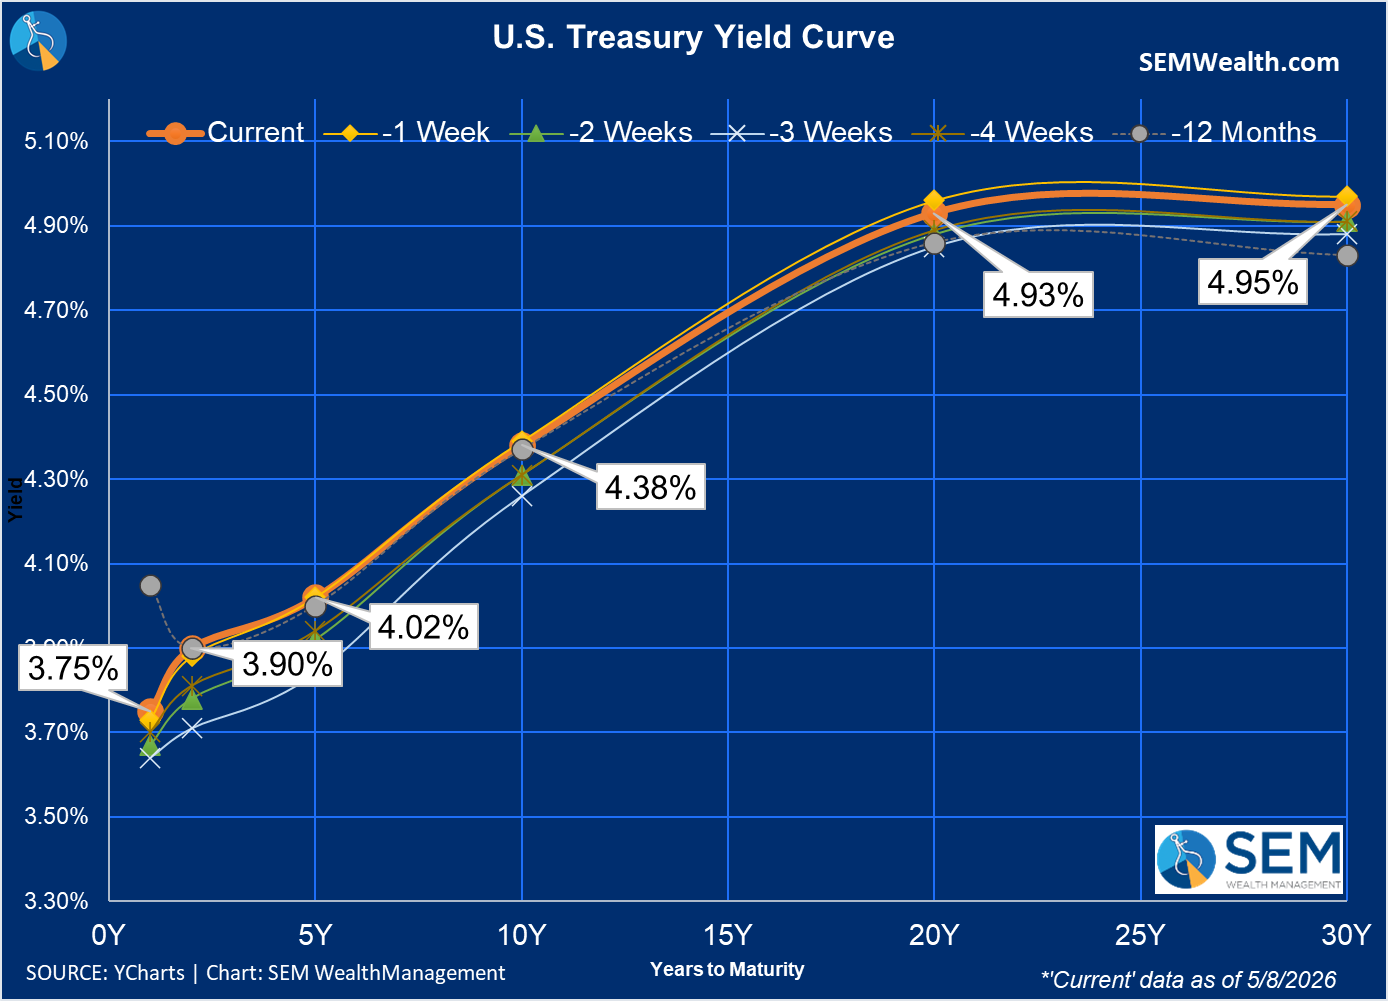
Interest rates have moved up over the past month. Long-term rates are also now higher than they were a year ago, with short-term rates essentially the same.
When you step back and look at everything together, this does not look like a booming economy, but it is not falling apart either. It is somewhere in the middle, supported by strong markets and spending from those who are still in good shape – namely the companies investing heavily in AI. That is why our dynamic model stays neutral for now while our trend following models are all in. We will continue to keep leaning into what is working, but we are also paying close attention to the risks, because if inflation does not ease up and rates stay higher, the market could shift faster than people expect.
Market Charts
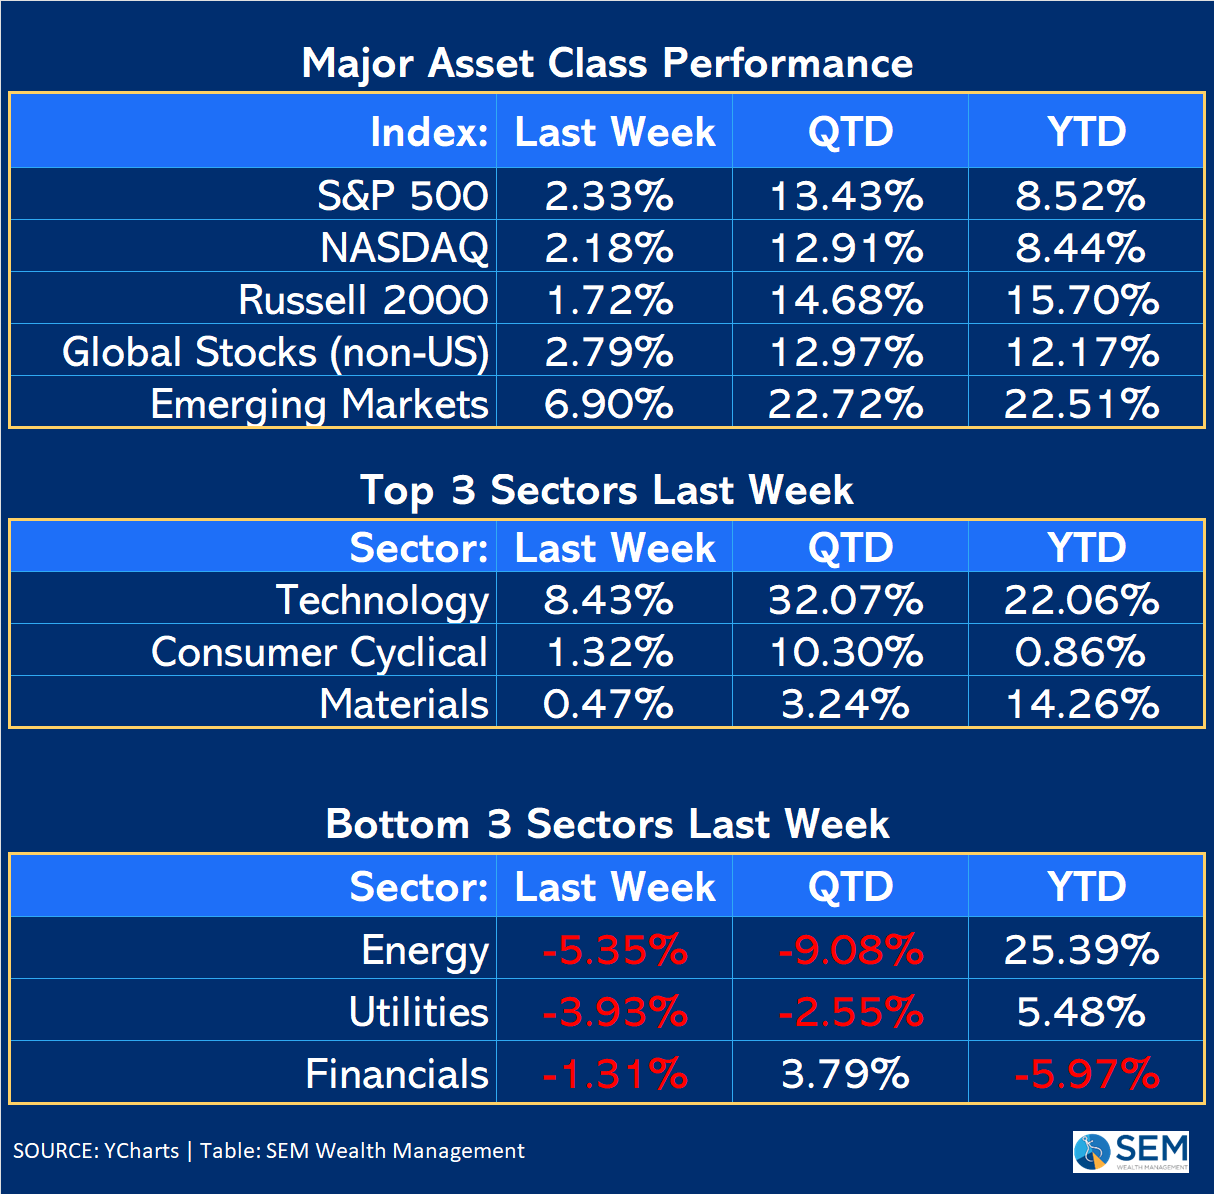
The S&P 500 continues to stampede higher.
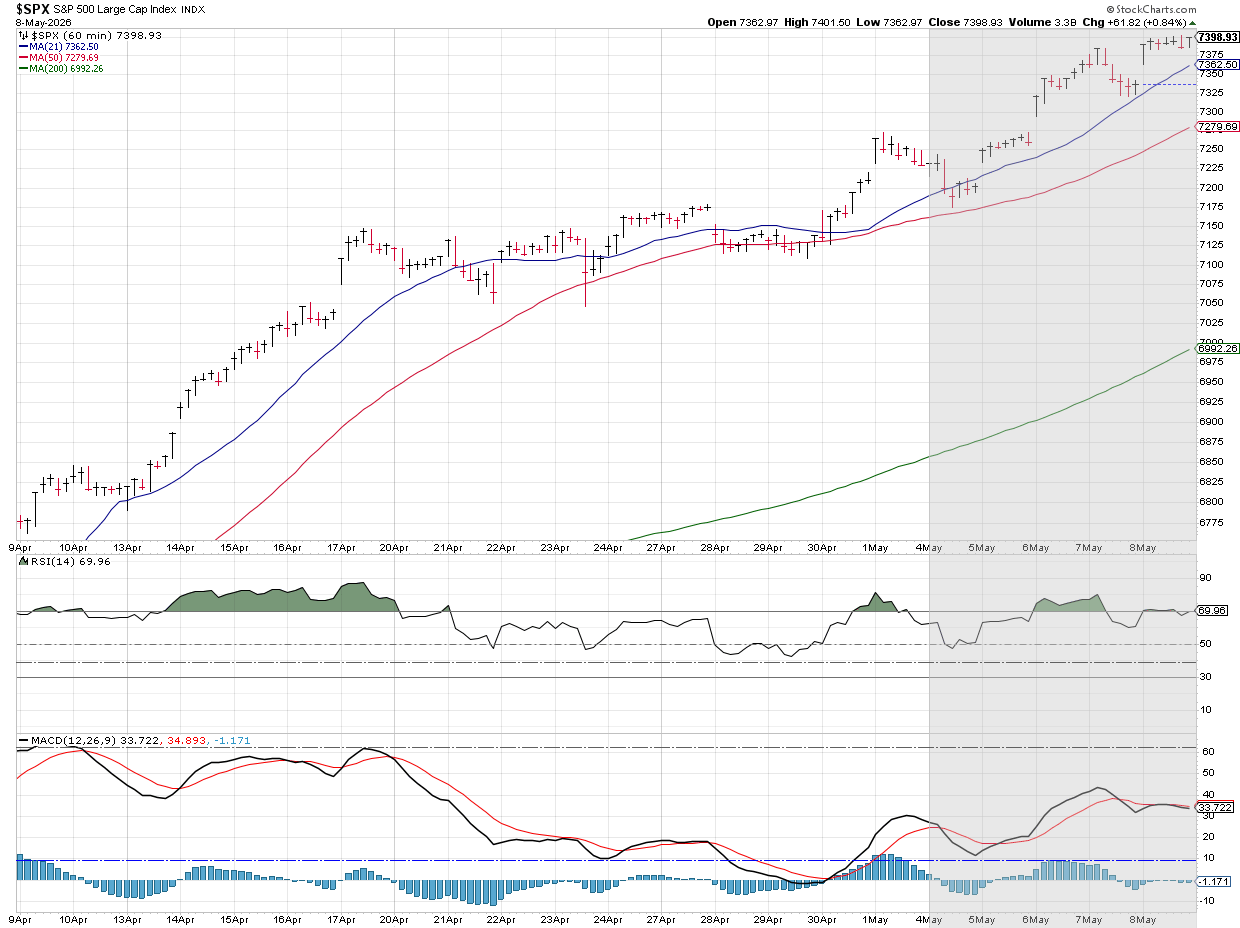
There appears little right now that can stop it.
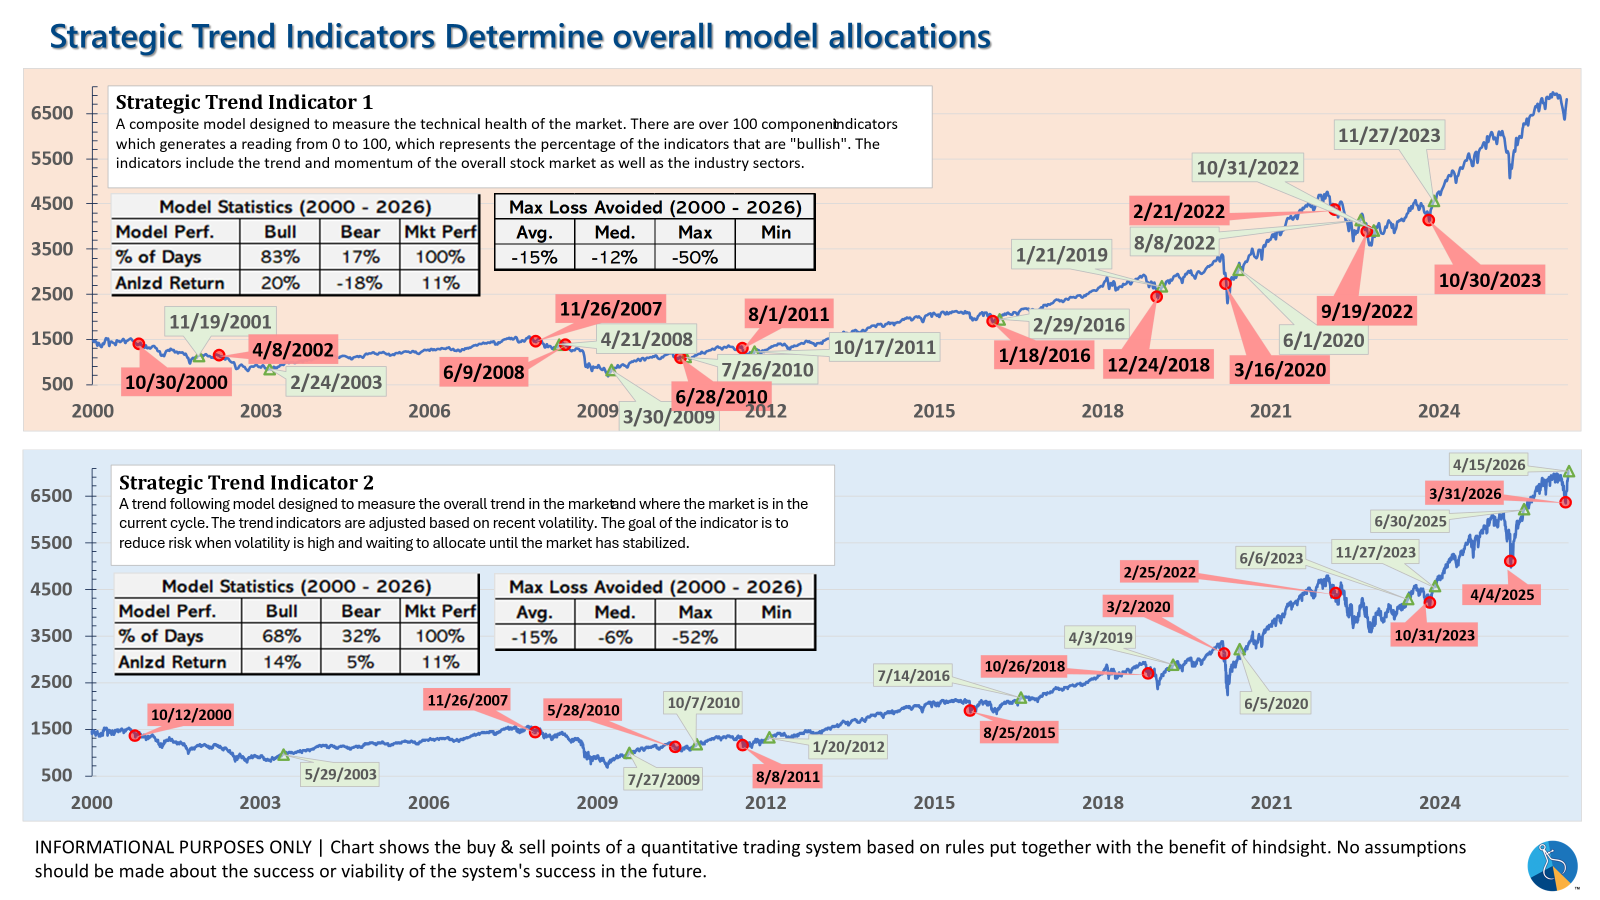
SEM Market Positioning
SEM deploys 3 distinct approaches – Tactical, Dynamic, and Strategic. These systems have been described as 'daily, monthly, quarterly' given how often they may make adjustments. Here is where they each stand.
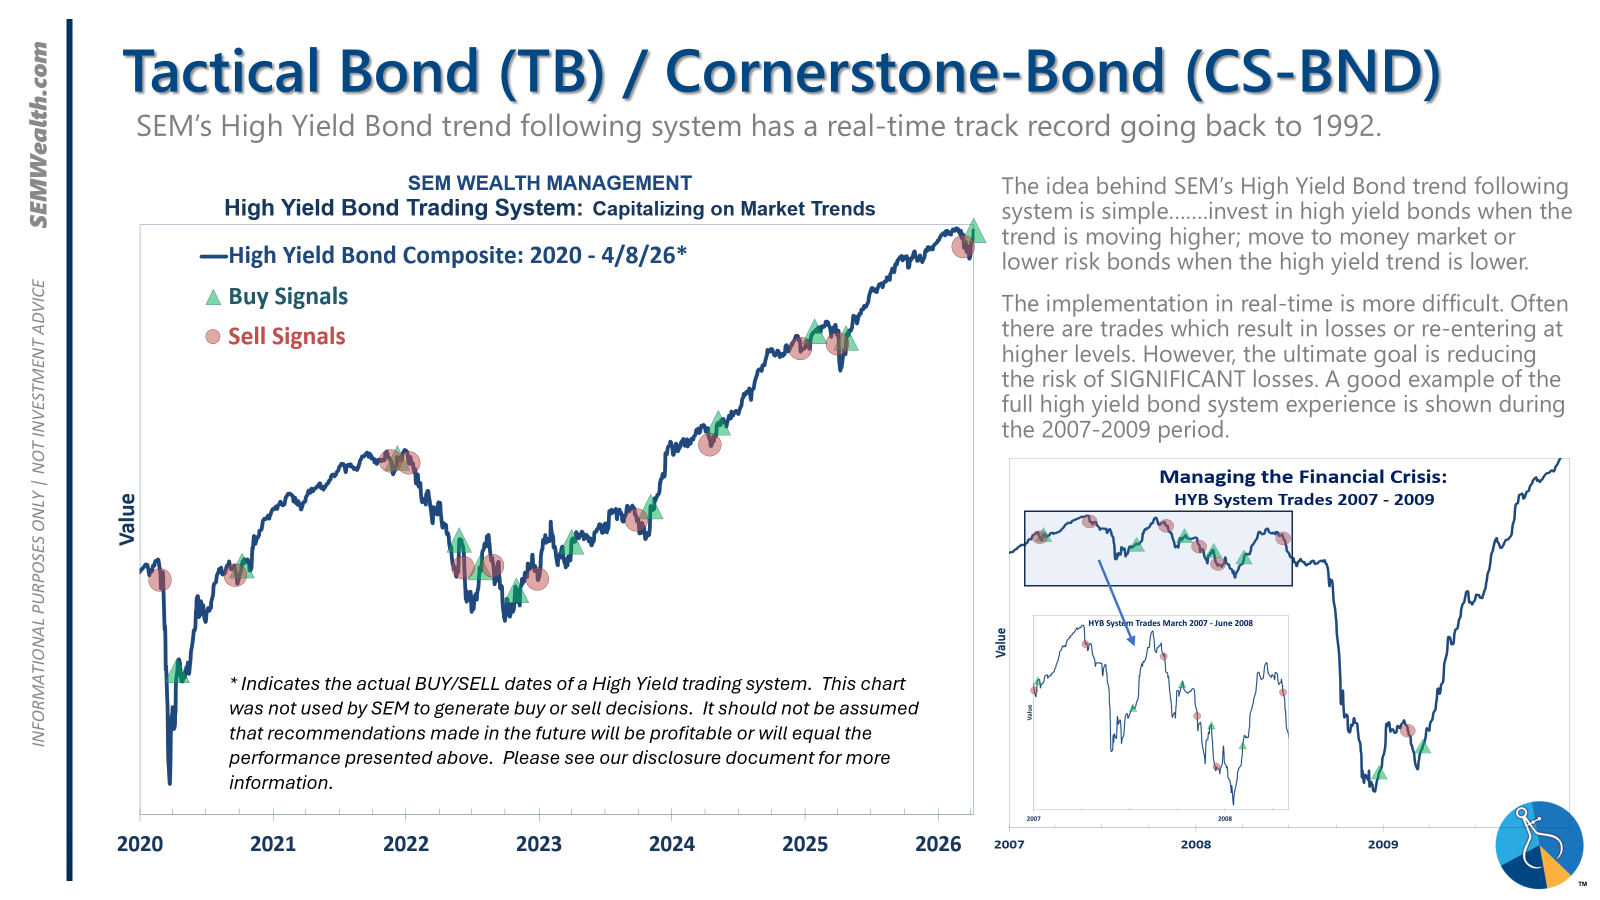
- Tactical = BULLISH | 100% High Yield Bond (4/8/2026) | High-yield spreads remain narrow but trend is slightly higher
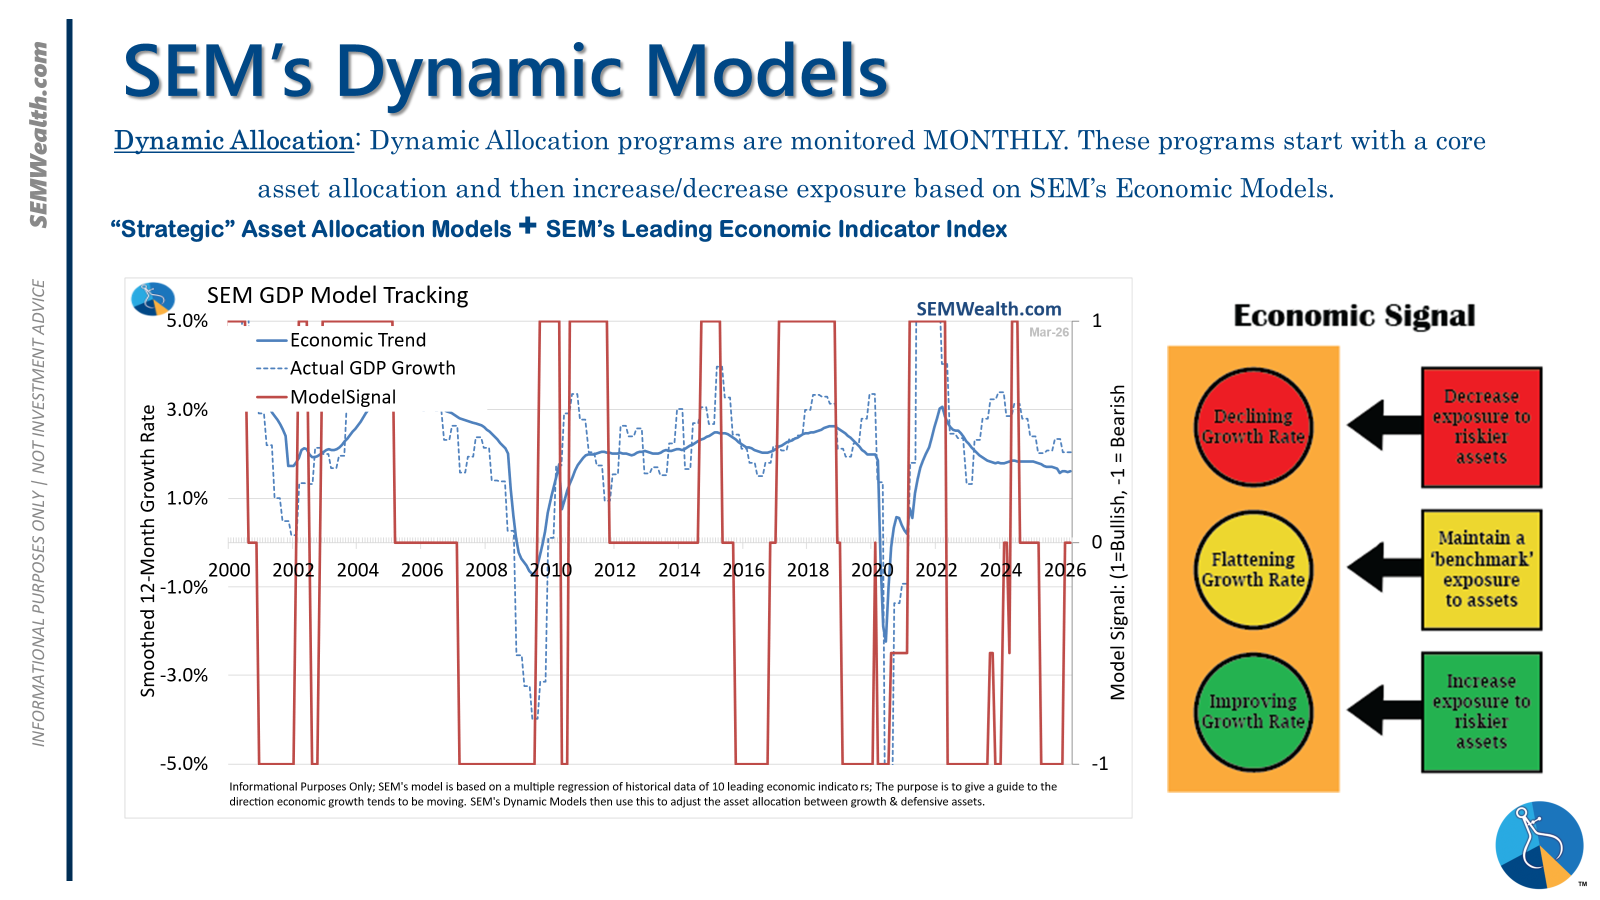
- Dynamic = NEUTRAL (2/15/2026) | "Benchmark" Allocation | Economic model inconclusive
- Strategic = BULLISH (4/15/2026) | V-Bottom projecting "end" of Iran War
Tactical (daily):
- Monitored DAILY
- Models: Tactical Bond, Cornerstone Bond, Income Allocator, Tax Advantaged Bond
- Designed to follow the trends for use in our lower risk models
- BUY Signal issued April 8, 2026 (exiting the sell from March 13)
Dynamic (monthly):
- Monitored MONTHLY
- Models: All "Dynamic" Models (Income, Balanced, Growth, and Asset Allocator)
- Uses SEM's Quantitative Economic Model
- Designed to overweight riskier assets if economic trend is higher & underweight those assets if economic trend is lower.
- NEUTRAL signal issued February 15, 2026 (following BEARISH signal from July 2025)
Strategic (quarterly)*:
- Monitored QUARTERLY
- Models: AmeriGuard (Balanced, Moderate, & Growth) and Cornerstone (Balanced & Growth)
- Core Component: Quantitative Filter using 4 different time horizons across universe of asset classes
- Trend Indicator: Two different Quantitative Systems monitoring the intermediate-term trend, health of the market, and volatility
- CORE has been overweight small cap and international since October 2025 – overweight increased slightly in January
- Both TREND INDICATORS are BULLISH following 10% drop and "V-Bottom" reversal in early April
- AmeriGuard & Cornerstone Max DO NOT use the Trend indicator and are always 100% invested in stocks using our CORE rotation model.
The core rotation is adjusted quarterly. This quarter we saw half of our international positions reduced (we sold developed markets and kept our emerging markets exposure). We also saw the remaining share of mid-cap reduced in favor of more small cap exposure. We remain with a "barbell" core portfolio – about half in large cap and half in small cap as the models expect the market to "broaden".
The * in quarterly is for the trend models. These models are watched daily but they trade infrequently based on readings of where each believe we are in the cycle. The trend systems can be susceptible to "whipsaws" as we saw with the recent sell and buy signals at the end of October and November. The goal of the systems is to miss major downturns in the market. Risks are high when the market has been stampeding higher as it has for most of 2023. This means sometimes selling too soon. As we saw with the recent trade, the systems can quickly reverse if they are wrong.
Overall, this is how our various models stack up based on the last allocation change:
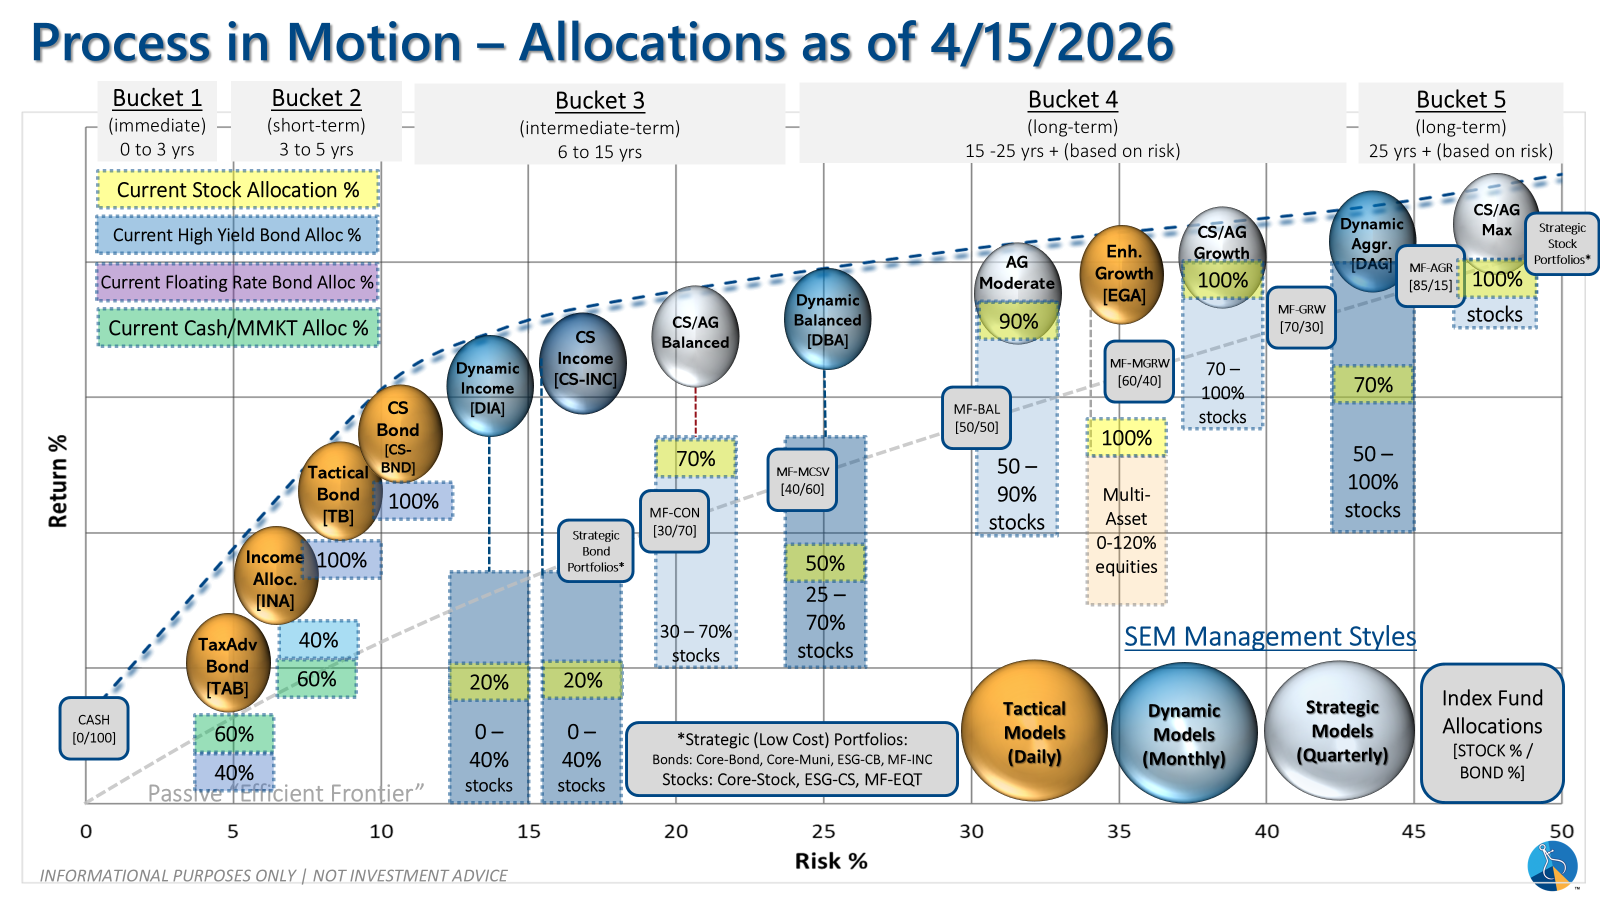
Curious if your current investment allocation aligns with your overall objectives and risk tolerance?


