
Everyone is still hyper-focused on AI as the return of AI growth mania has taken over the stock market once again. April was the best month for stocks since 2020 as the still on-going Iran War has been pushed to the backs of most people's minds (other than those people feeling the impact of the big jump in gasoline prices the last two months). Somewhat related to that though is a jump in inflation and the fact the Federal Reserve may not be cutting rates any time soon.
Last week's Federal Reserve meeting was mostly overlooked as it occurred on the same day all 4 Hyperscalers (Amazon, Google, Meta, and Microsoft) released earnings (more on that later.) The meeting, which may be Jerome Powell's last as Fed Chair had the most dissents (4) since October 1992. We saw 3 dissents in the December 2025 meeting, which had been the most of Chair Powell's tenure.
3 Fed voting members opposed the Fed's "easing" bias, citing inflationary pressure. Recent Trump appointee Stephen Miran wanted a 25 basis point rate cut. The day after the meeting the Fed's preferred inflation measure, the PCE Price Deflator came out for March, showing a huge jump in inflation. (It is the preferred measure because it is more stable than CPI historically.) While many blamed the jump on the War with Iran, the chart below shows we've been seeing inflation running at a 3% level for most of the last 10 months.
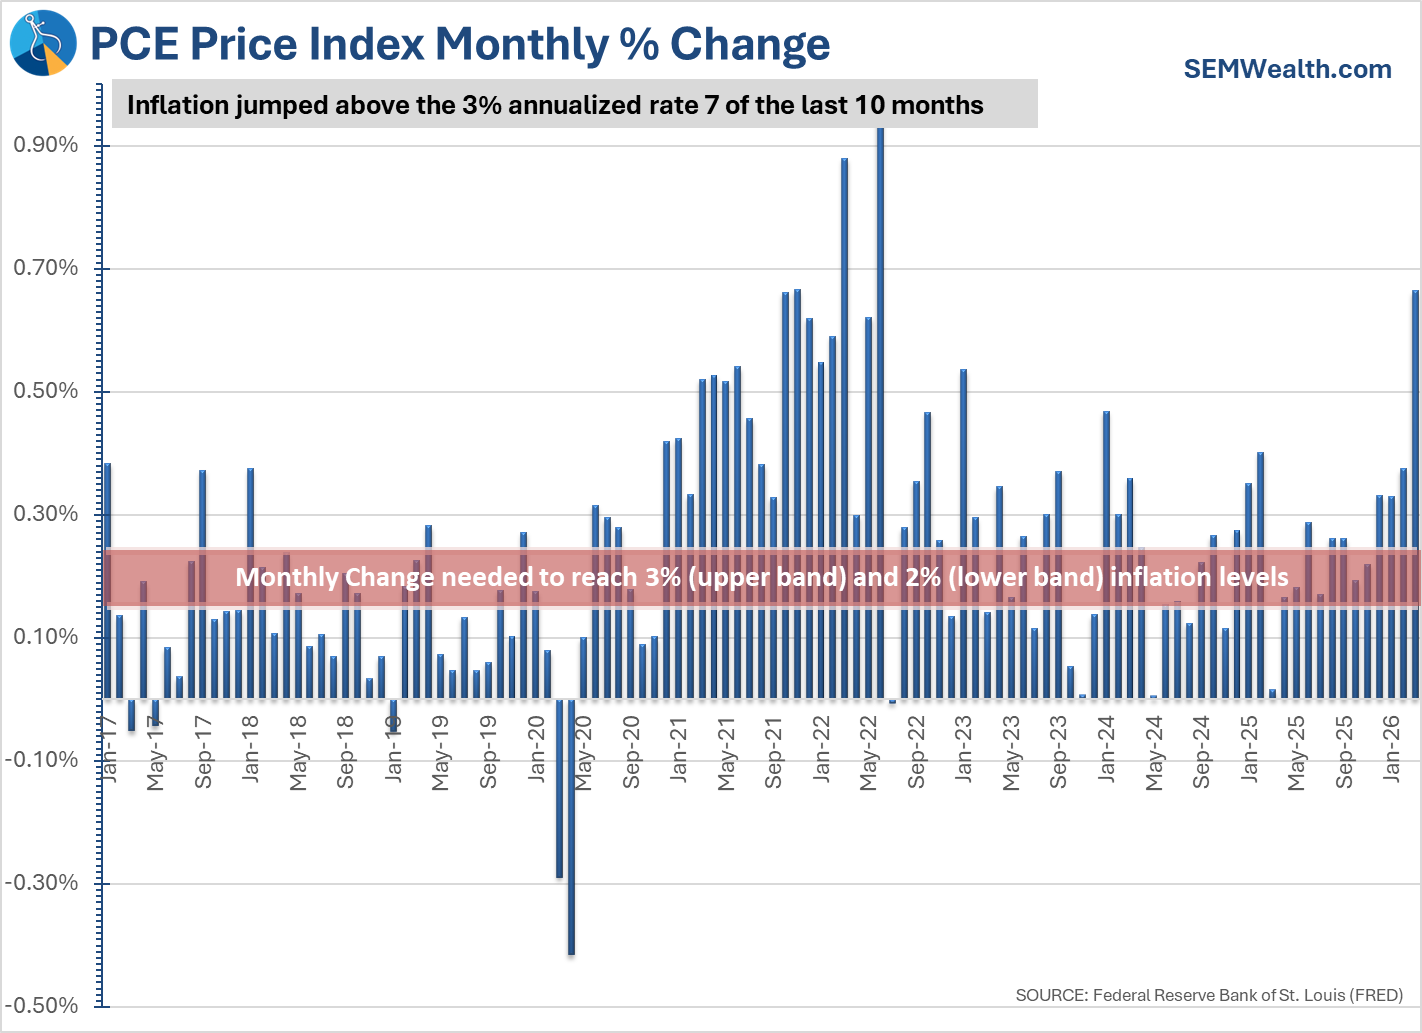
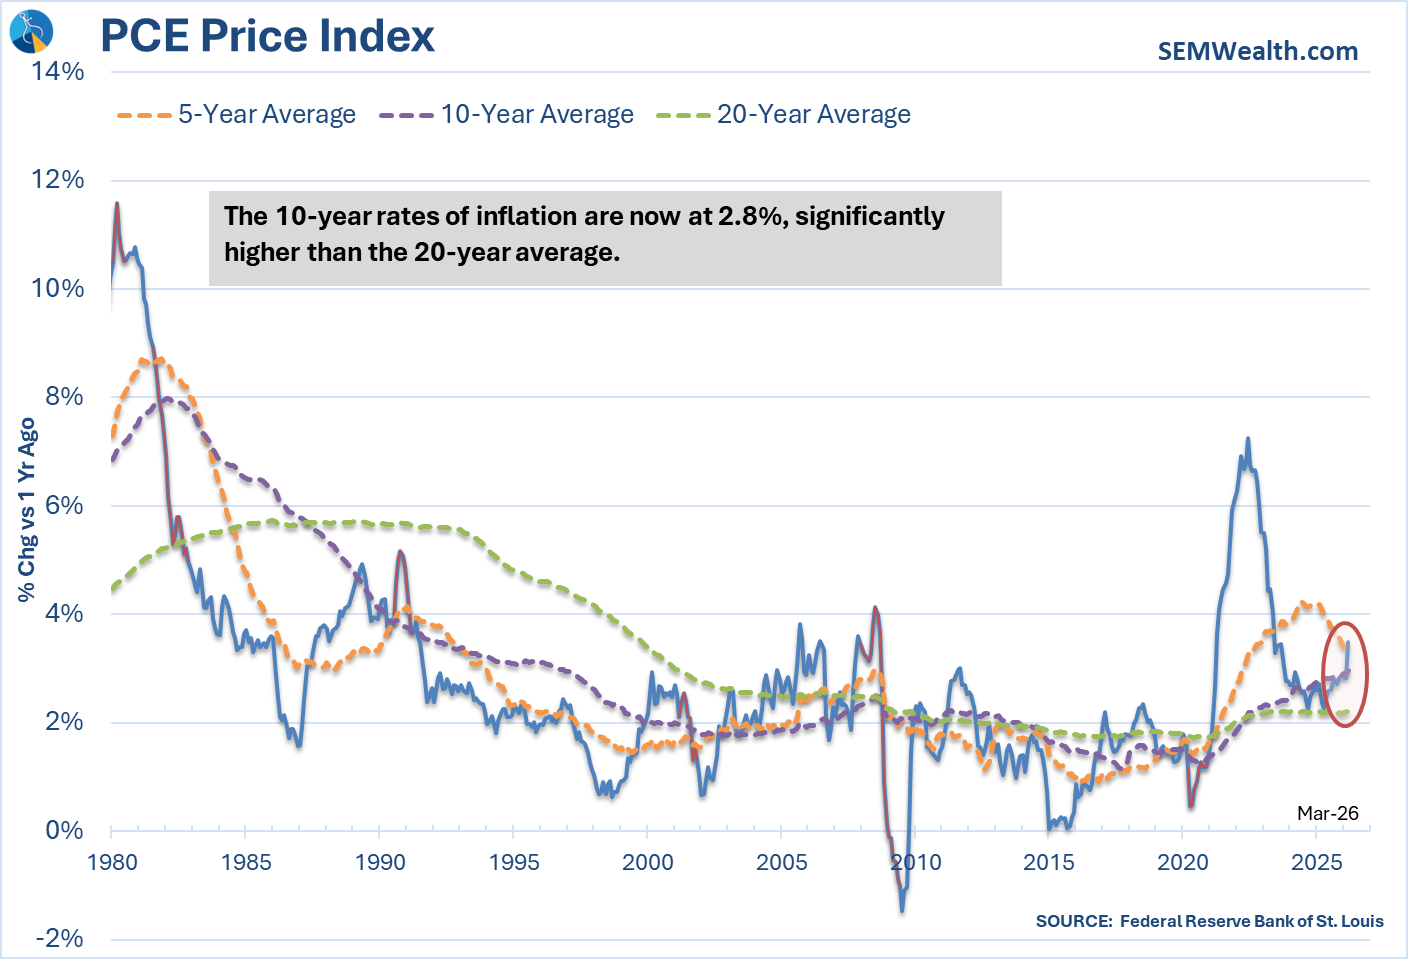
The 10-year rate of inflation is now 2.8% (at a time where the Fed's 'target' was 2%).
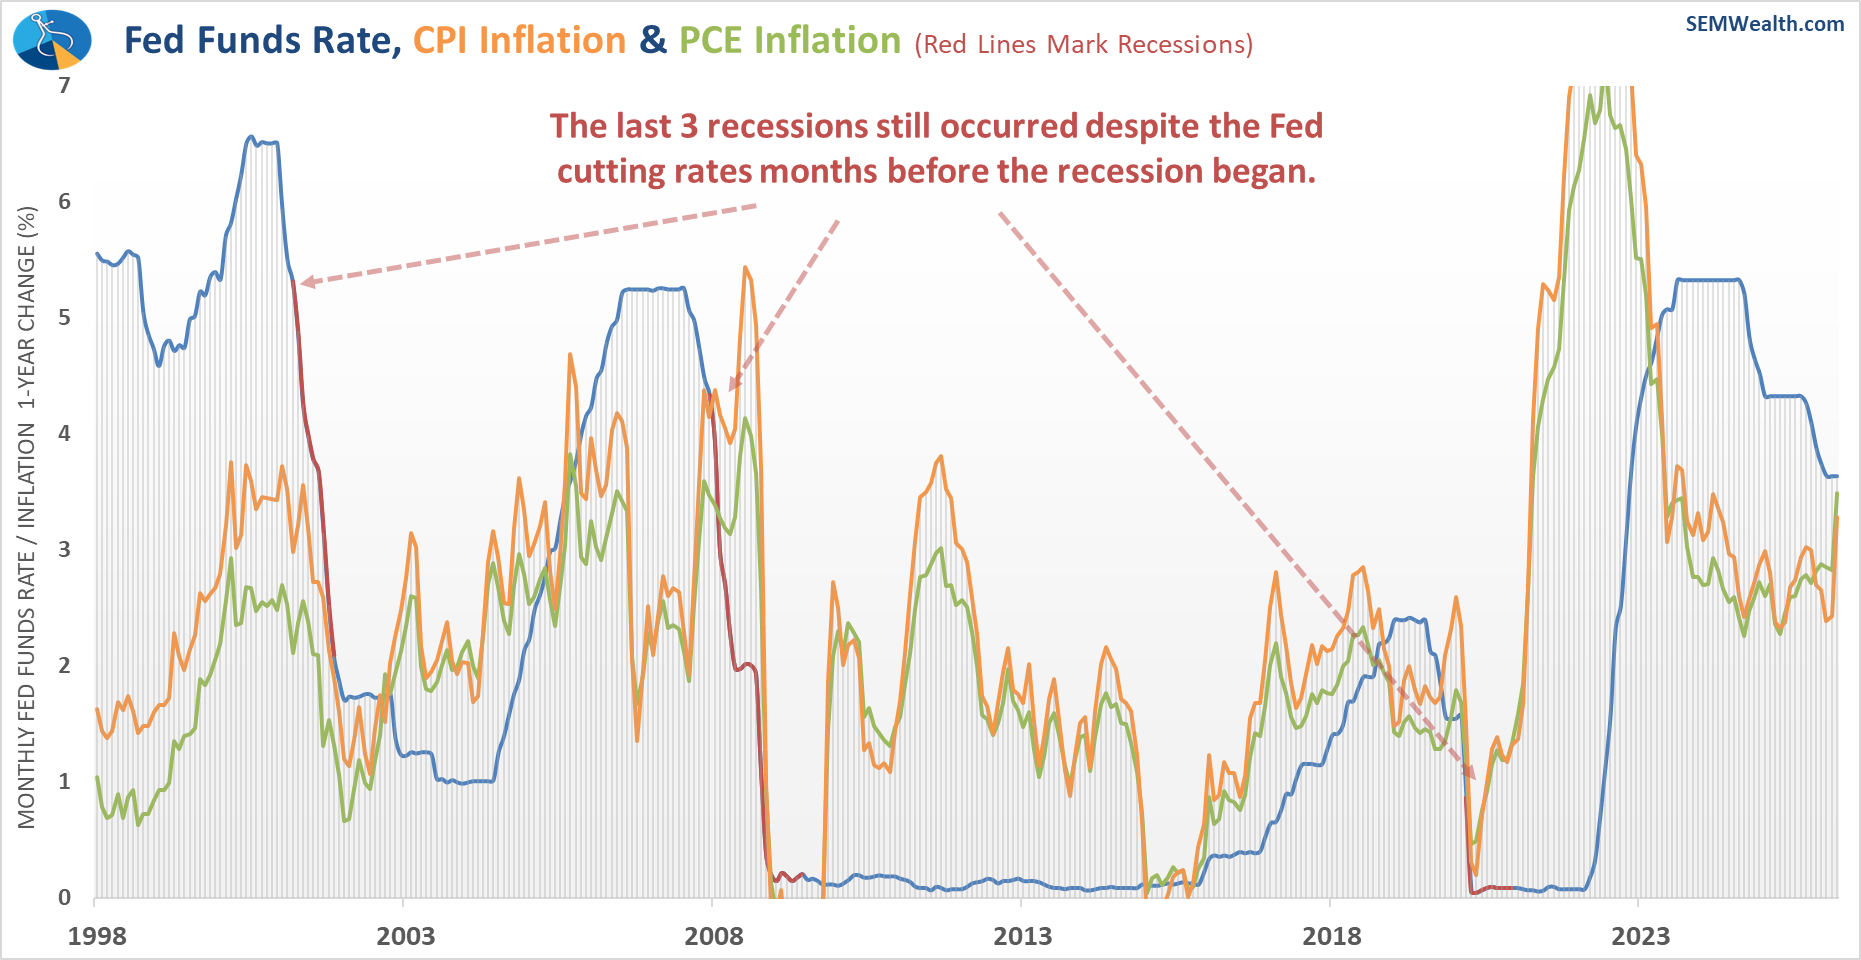
CPI also jumped in March, showing the Fed may have lost control of inflation (again), which is why the 3 Fed "dissenters" wanted the Fed to remove the statement indicating they are leaning towards rate cuts.
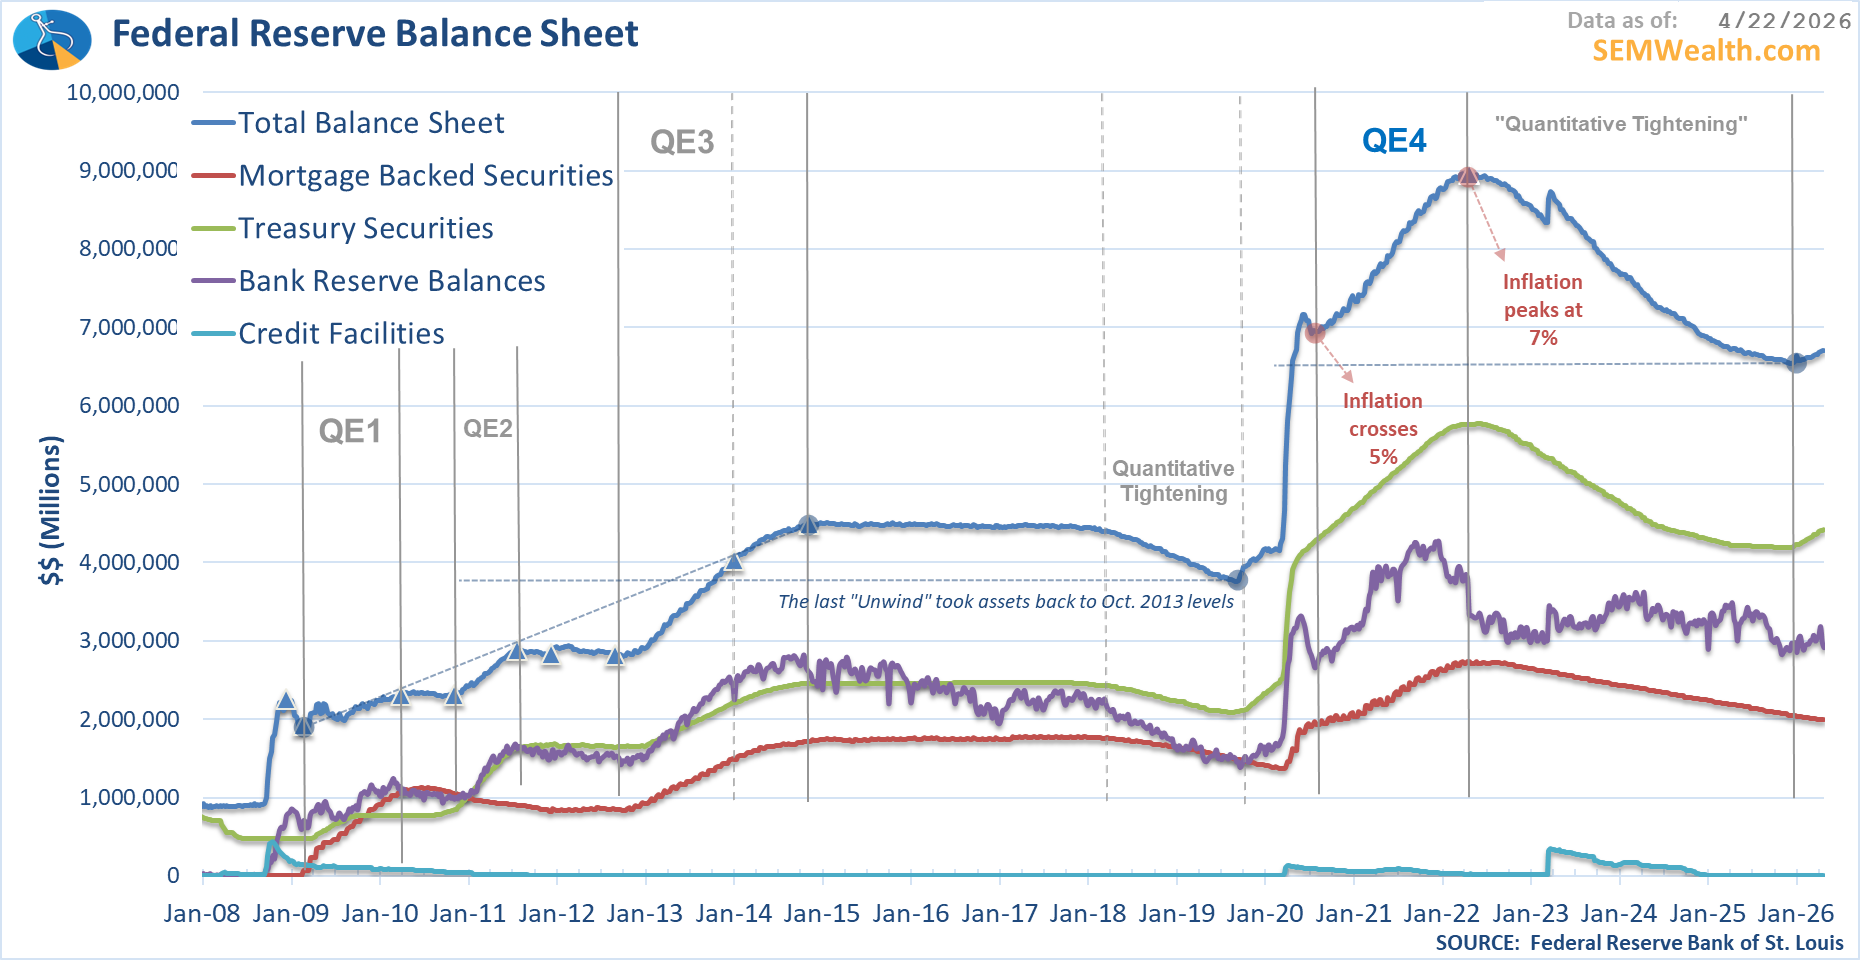
What's baffling is how anybody can argue the Fed's policies are too tight. They've increased the money supply at a whopping 14% rate over the last 12 months, down just slightly from the 15% level we saw 2 months ago.
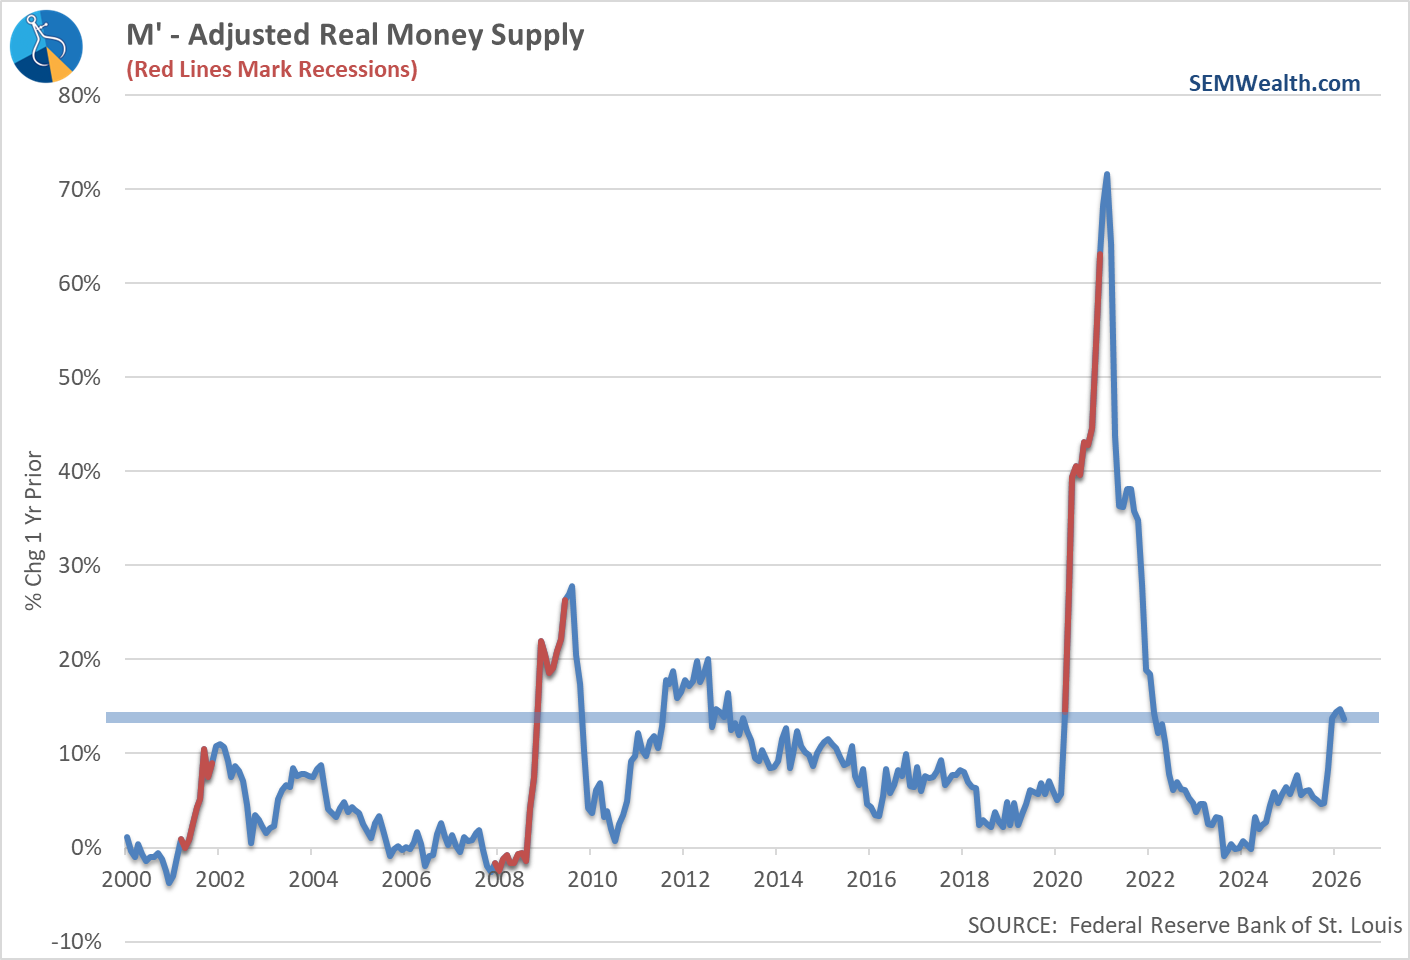
Part of the increase is due to the Fed ending their "quantitative tightening" and resuming re-purchases of Treasury Bonds when their holdings matured. This puts more money in circulation.
The Manufacturing Survey for April showed huge upward pressure on prices, climbing to the highest levels since March 2022.
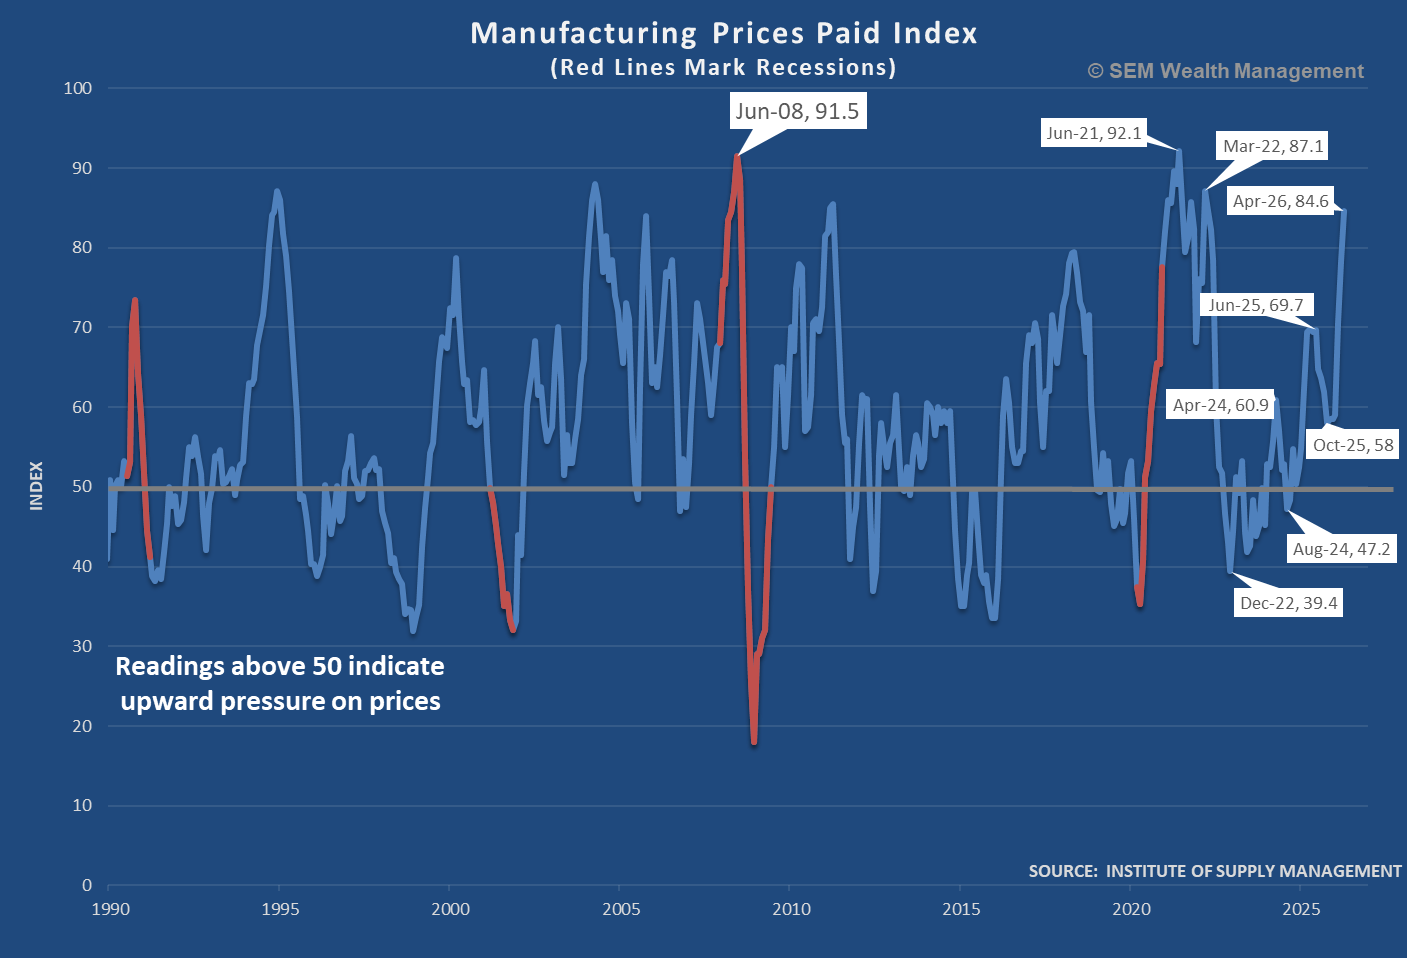
I know the story is inflation will plumet once the War in Iran is over, but we should know by now, a president cannot will prices to come down, especially if the same president will be putting pressure on the new Fed Chair to cut rates dramatically.
For now, nobody seems to care about inflation as the economy appears to be handling the near 3% levels quite well overall.
Economic Data Update
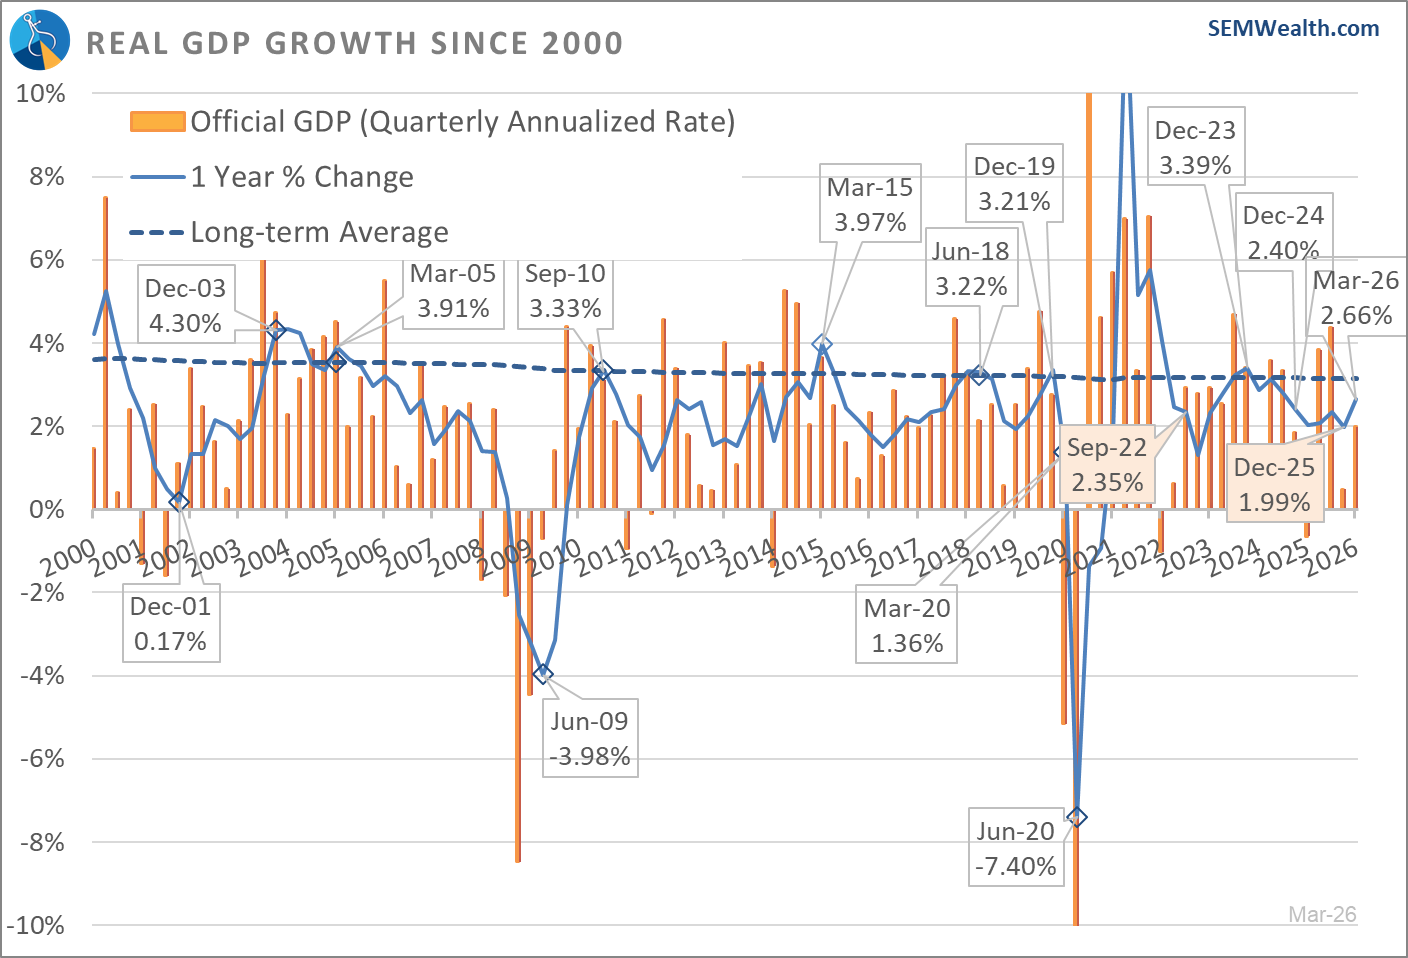
Last week was a fairly heavy week for economic data. The biggest item was the initial release of Q1 GDP. The official number came in at a 1.99% annualized rate (using the last 3 months and compounding it 4 times). What we focus on is the 1 year change, which came in at 2.66%, the highest reading since September 2024.
Consumer Spending (in terms of dollars spent) remains strong and was the biggest driver behind the jump in economic growth. This chart illustrates how the COVID stimulus accelerated spending to levels well above the long-term trend and it appears to remain intact.
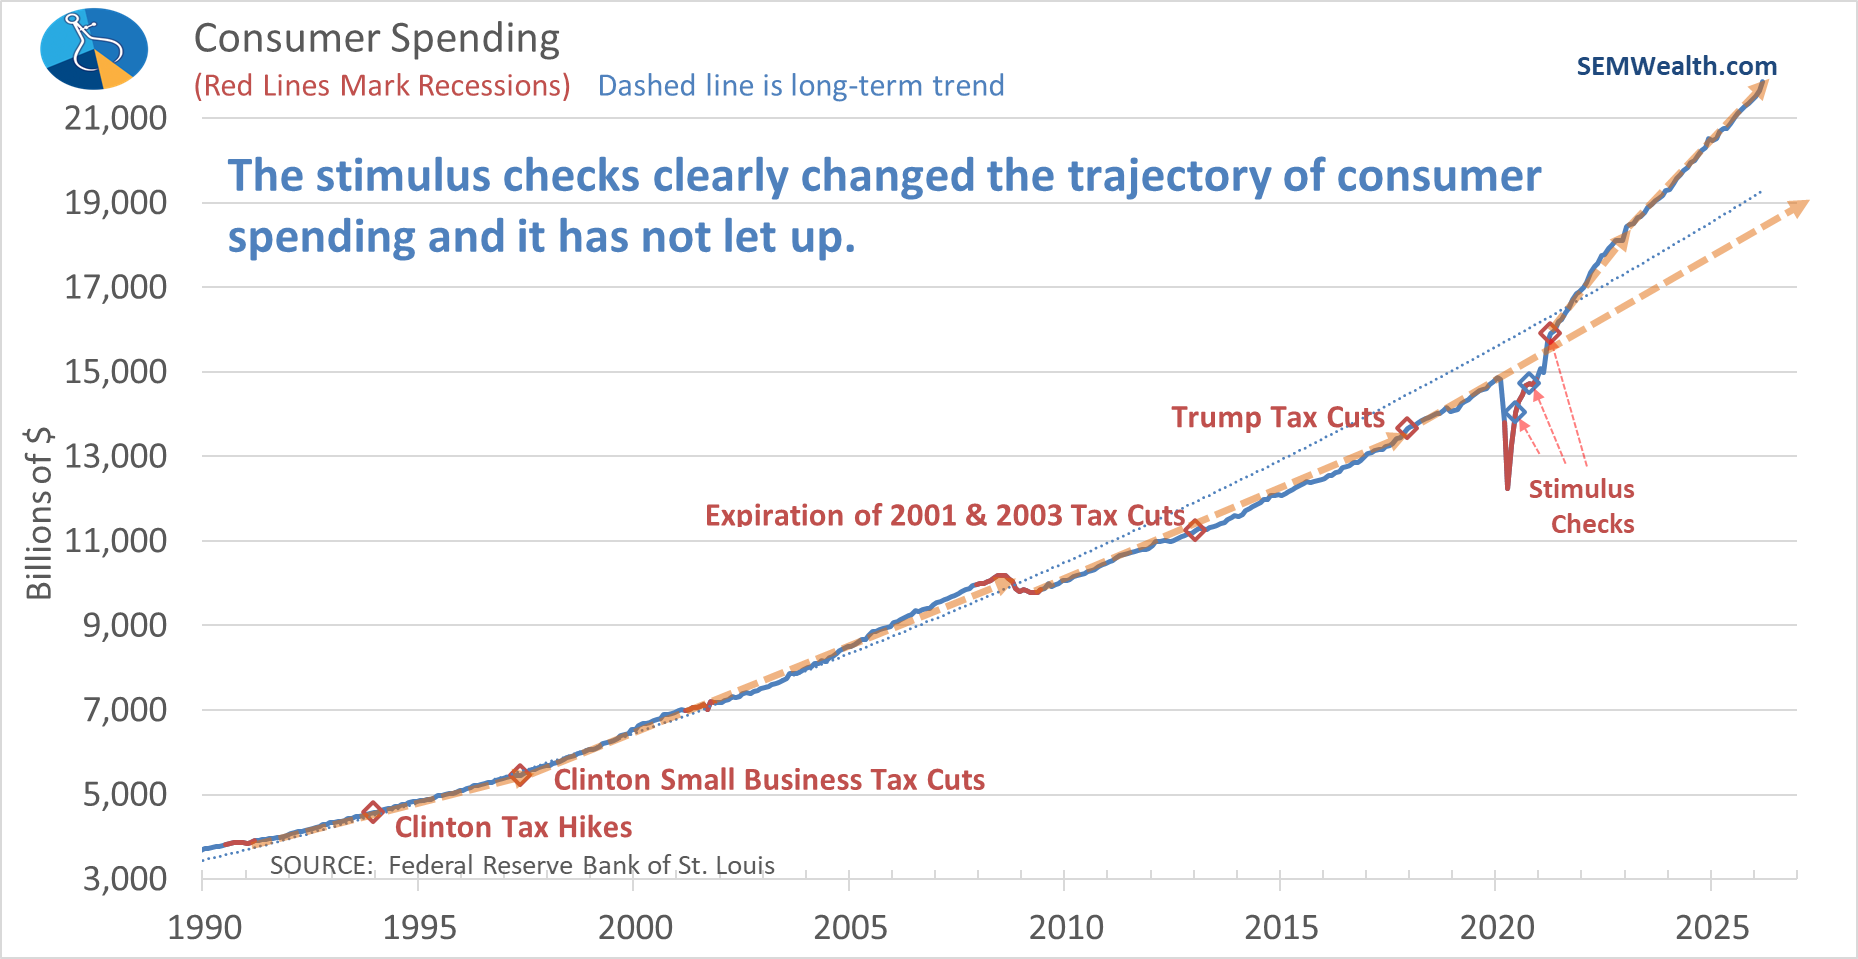
The problem is income has not kept up.
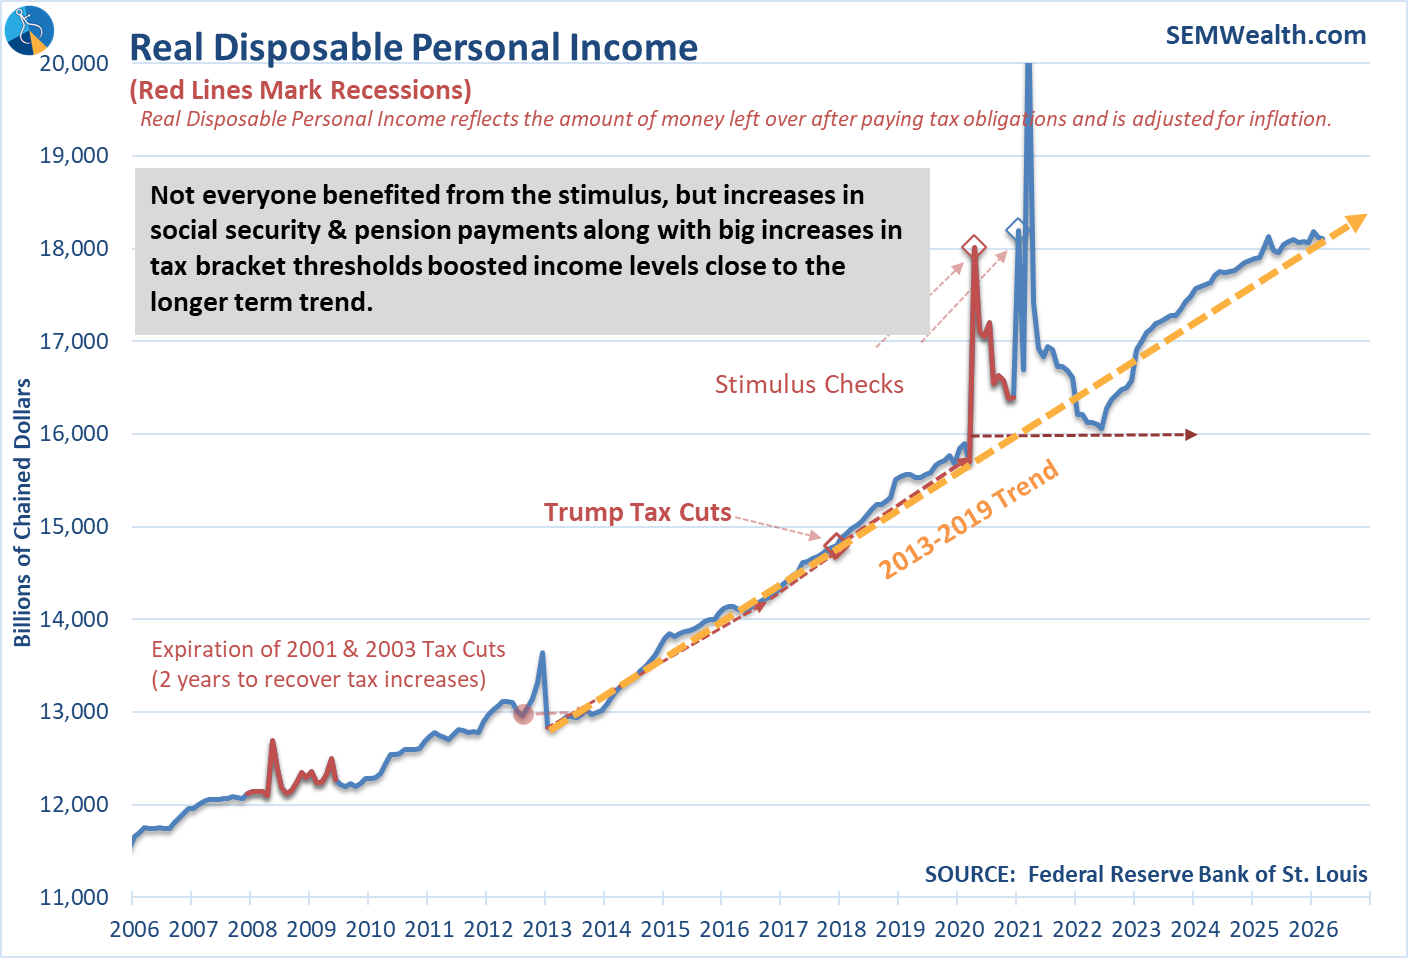
At some point this has to give. Personal Income is barely up for the last 12 months, yet spending is 5% higher.

We also got our first look at April Manufacturing activity, which was a mixed bag. The leading indicators of the index showed a drop in New Orders and the order Backlog, but the Deliveries component jumped.
We also finally got a bit closer to recent data on Building Permits, with the government giving us both February and March data last week. The news is not great in terms of creating more supply in the housing market. Permits fell to their lowest level since August 2025 and are below the November 2022 levels, making March the worst month since COVID.
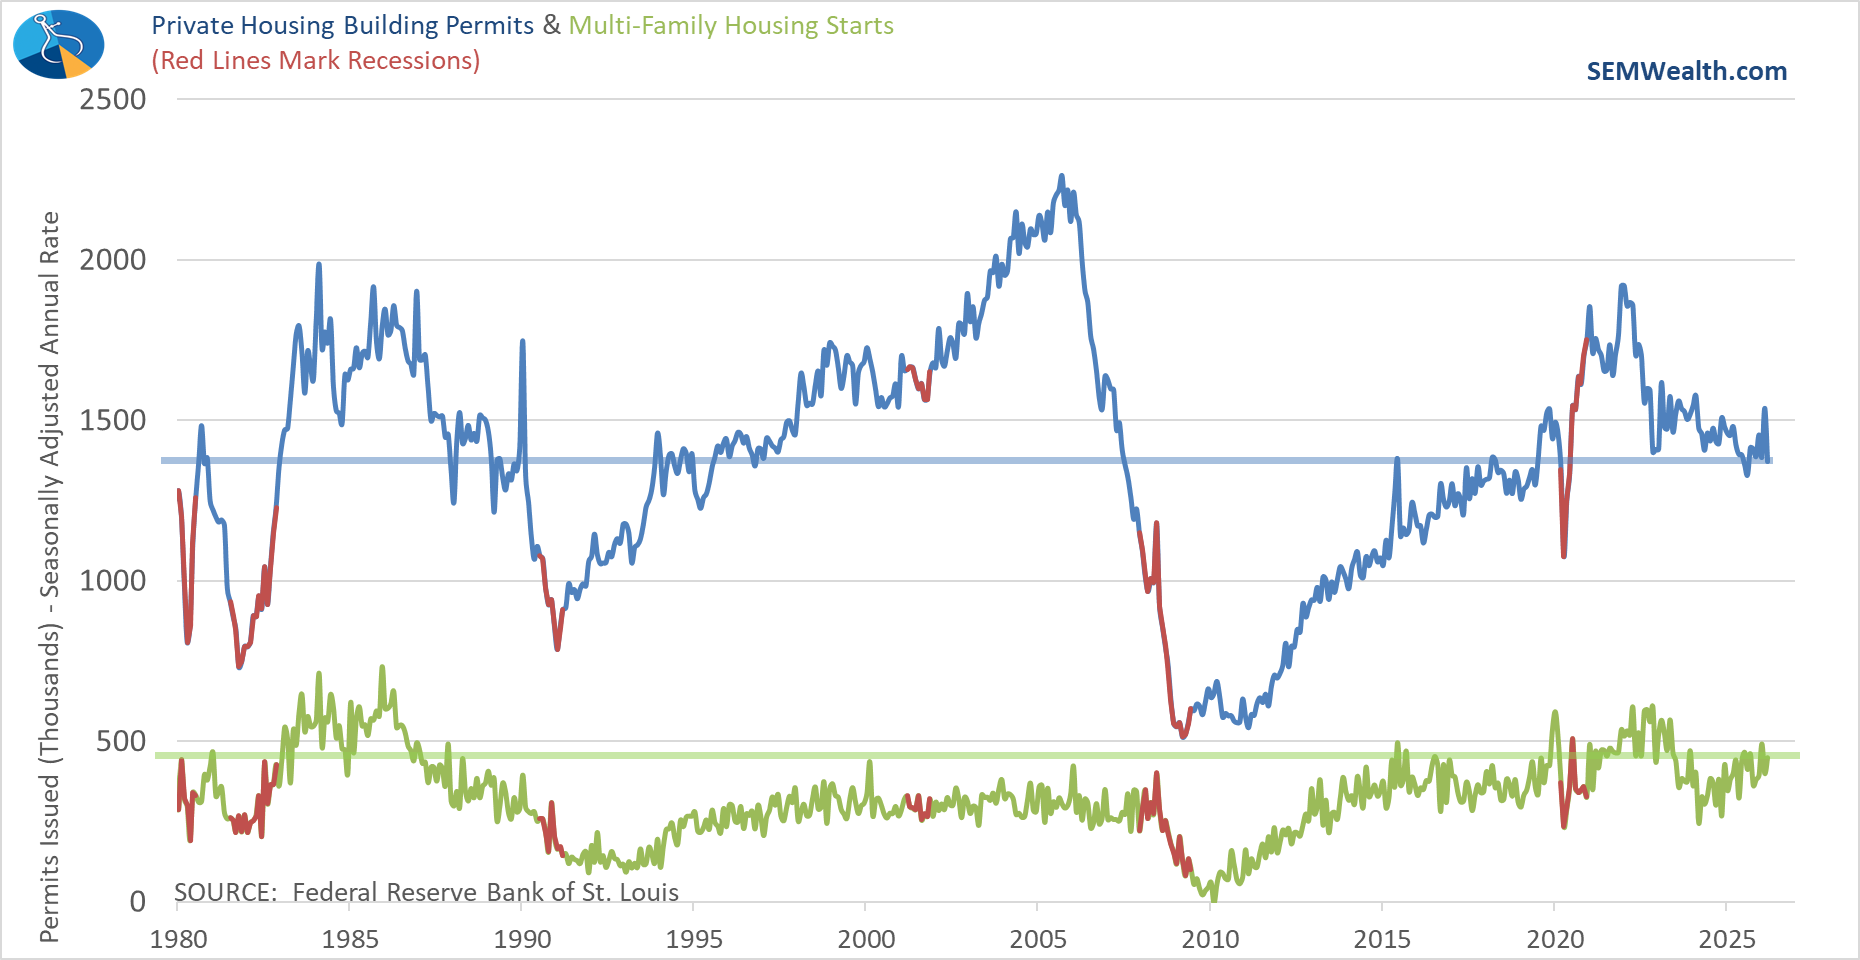
Multi-Family Housing starts have continued to climb since 2024, which may help alleviate the pressure from high rent payments for middle class families.
This week's data includes the ISM Services Index on Tuesday and the all-important Payrolls report on Friday. Our economic model remains "neutral". Stay tuned next week for details on how the Payrolls report changes our model's outlook.
Hyperscaler Earnings
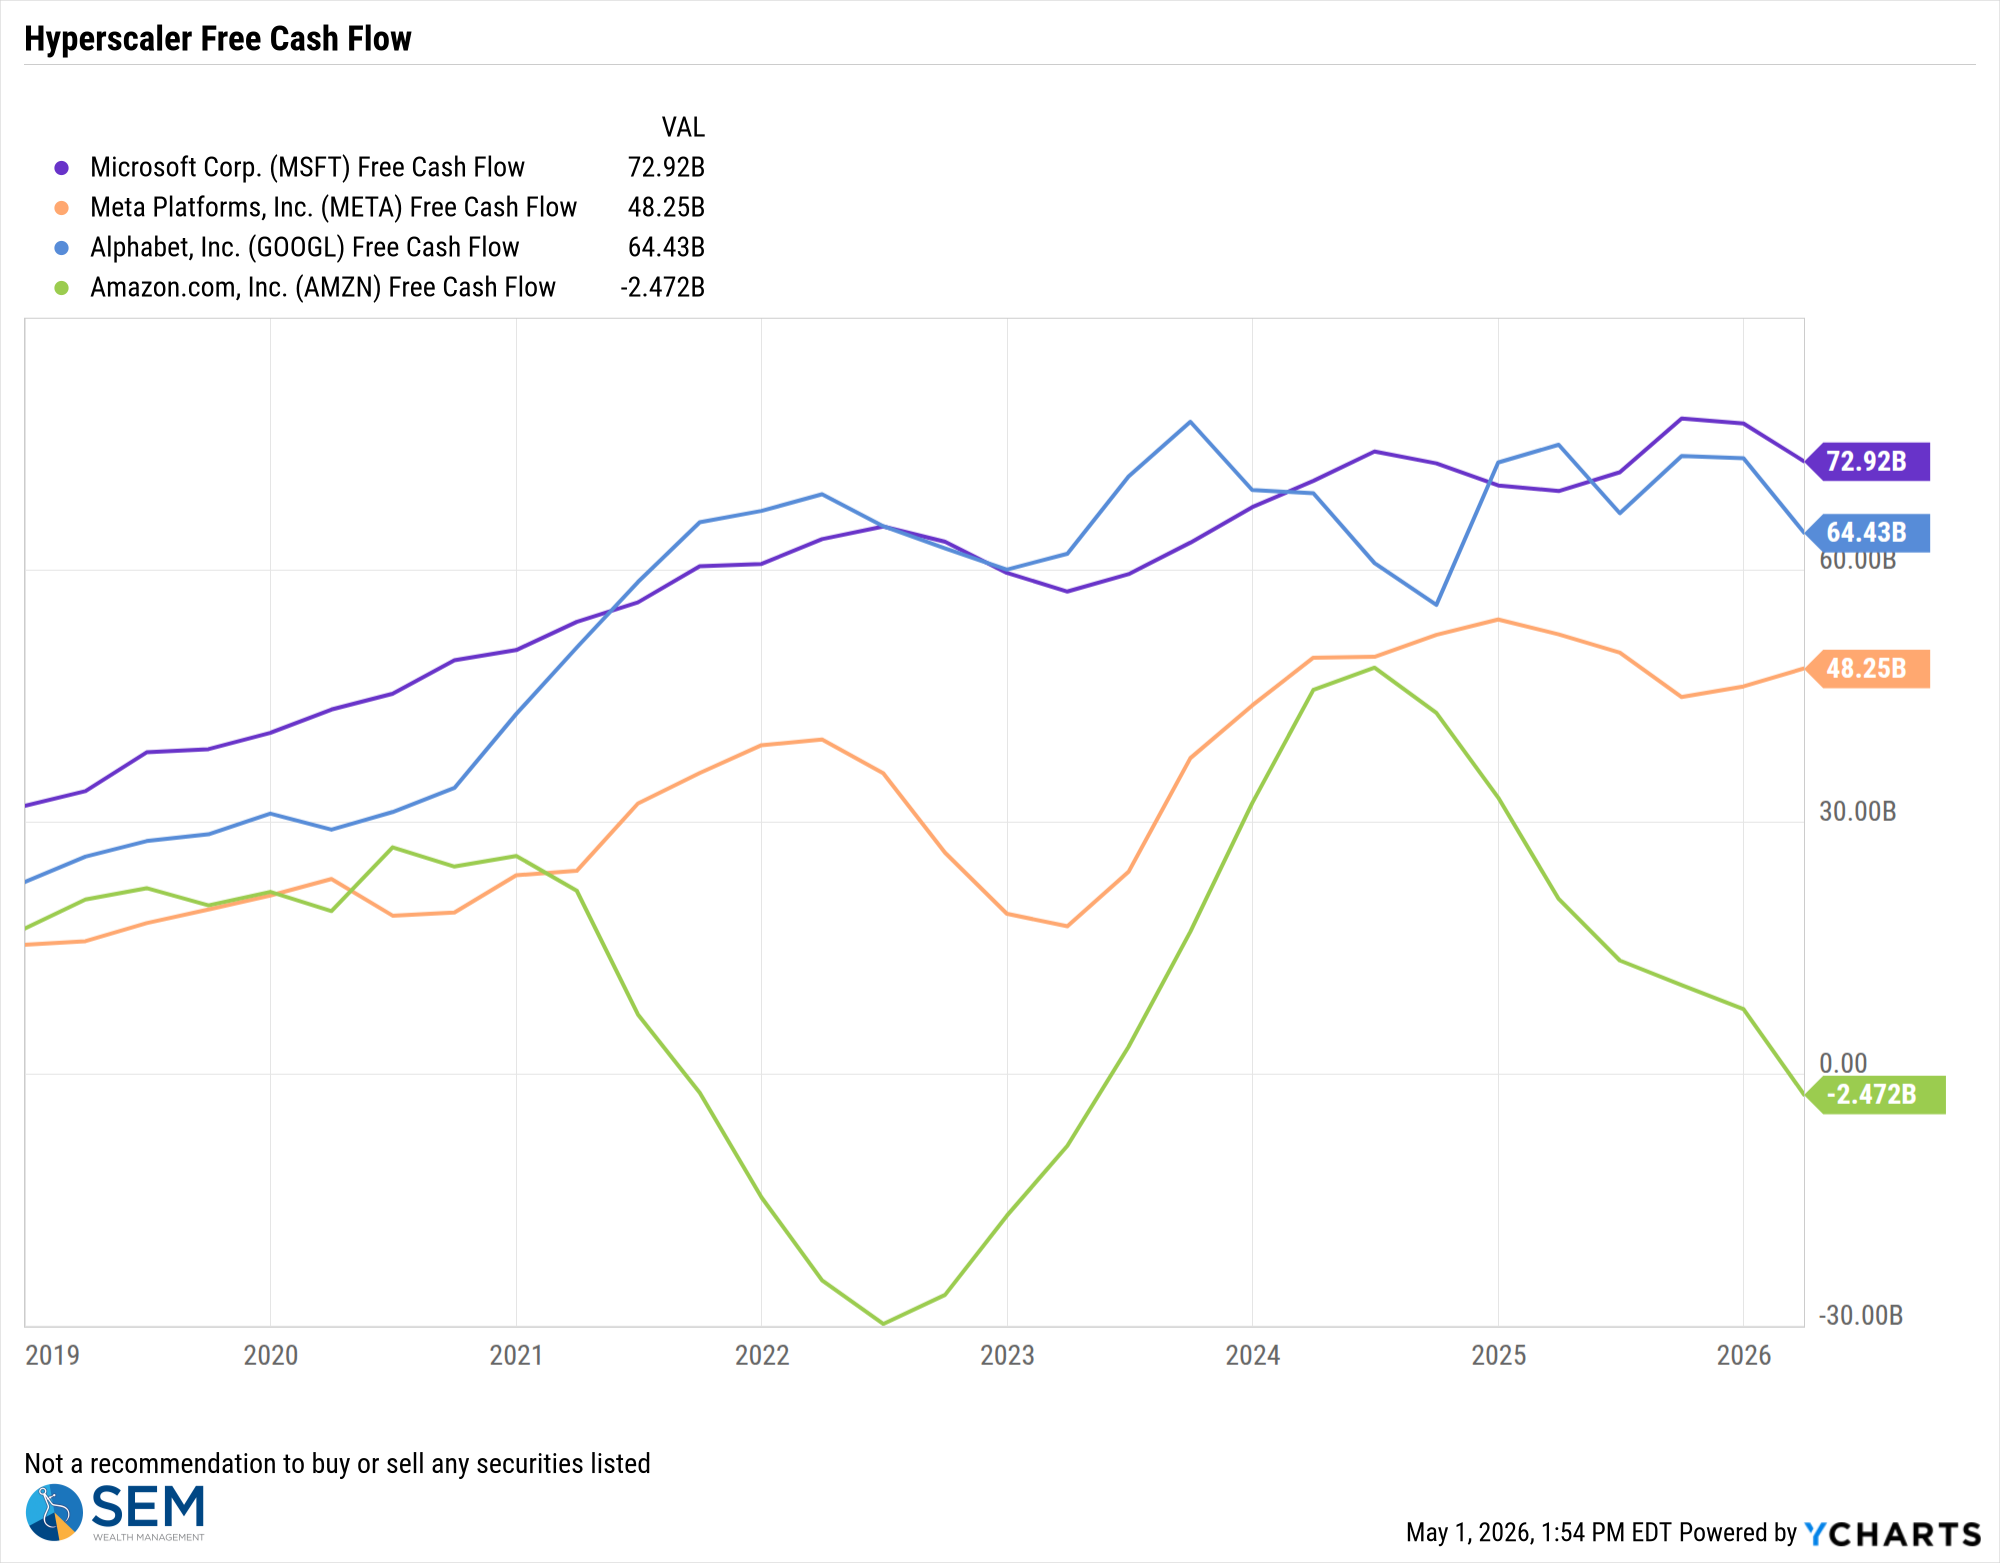
Of course, maybe the Payrolls report won't matter as the focus remains on AI related companies and their growth prospects. While everyone seemed to be focused on the huge jumps in earnings and revenue I am more interested in the Free Cash Flow of each company. Free Cash Flow is Operating Cash flow minus capital expenditures. It is a good indicator of whether or not a company is able to support future growth via current cash flow. I noted a few weeks back the fact Amazon was having to borrow $50 Billion to fund some of their investments. The bond issue is currently ongoing, but it looks like the are locking in the $50 Billion to be paid back over 40 years at an average rate of 6.5%.
While that is a small amount of money for now, it is a sign that at least for Amazon they've yet to see a meaningful return on their invested capital. Microsoft and Google saw a decline in Free Cash Flow last quarter, but Meta's increased. What is interesting is the market reaction to Meta was the most negative of the 4. As I've said many times, each of the 4 have different models. It is easy to see how Microsoft, Google, and Amazon can make money off their data center investments since they already have business lines which can leverage their increased capacity. Meta sells advertising on Facebook and Instagram and the market at least last week seemed to question their high amount of spending on more data centers.
At SEM, this is exactly the type of environment we prepare for, but not predict.
When inflation trends higher than expected, when policy signals conflict, and when markets choose growth over fundamentals, risk doesn’t disappear…..it just gets delayed. That’s why our process stays disciplined. We focus on what the data is actually doing, not what the narrative says it should be doing.
Right now, the story is strong growth and AI optimism. The data, however, is showing persistent inflation, stretched consumers, and early signs of imbalance. That doesn’t mean markets can’t keep moving higher—but it does mean the margin for error is shrinking.
Our job isn’t to chase the story (or the trendy stocks or sector). It’s to manage the risk when the story changes.
Market Charts
Stocks were down a bit ahead of the Hyperscaler earnings on Wednesday after the close. As you can see, all of the gains came in those two days.
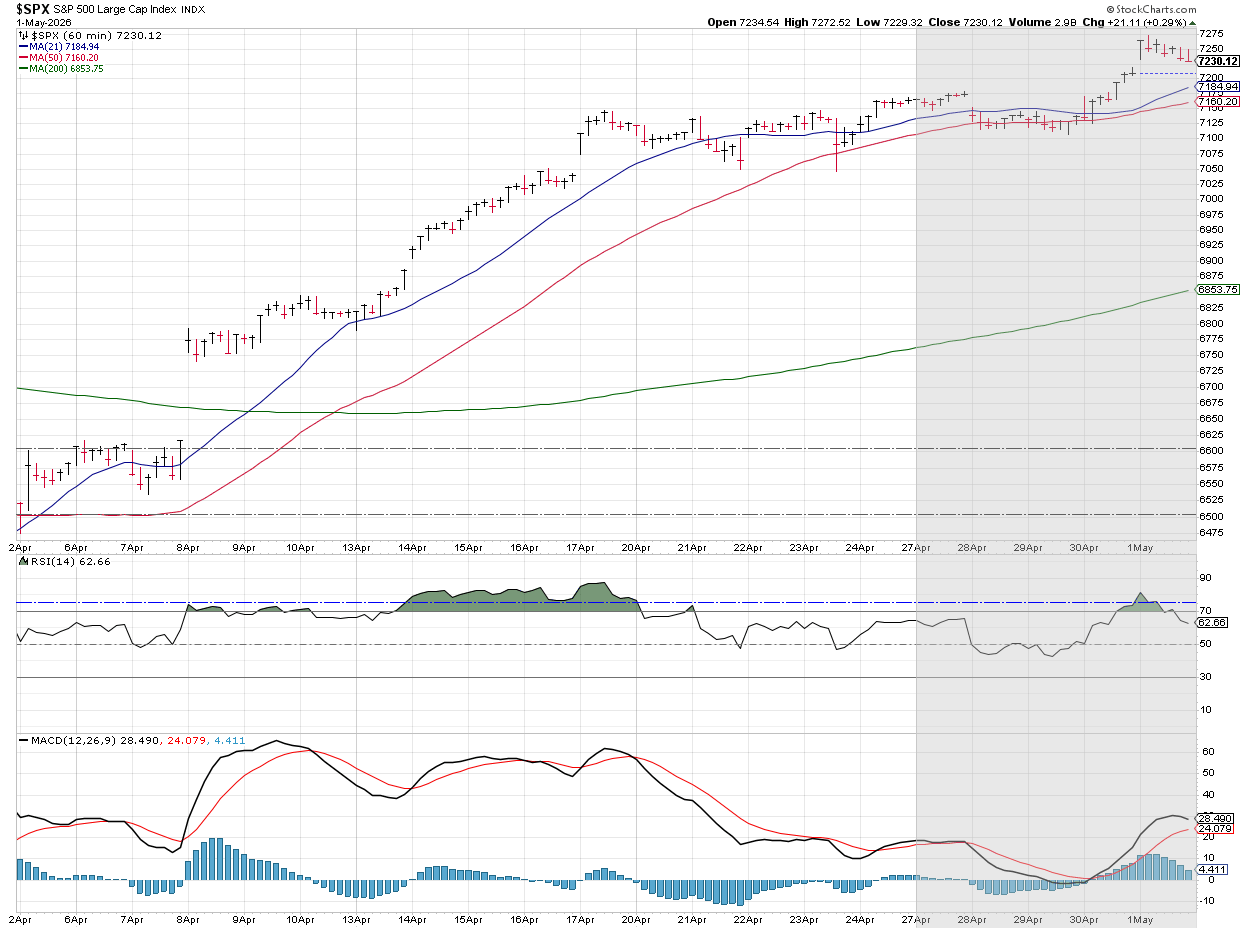
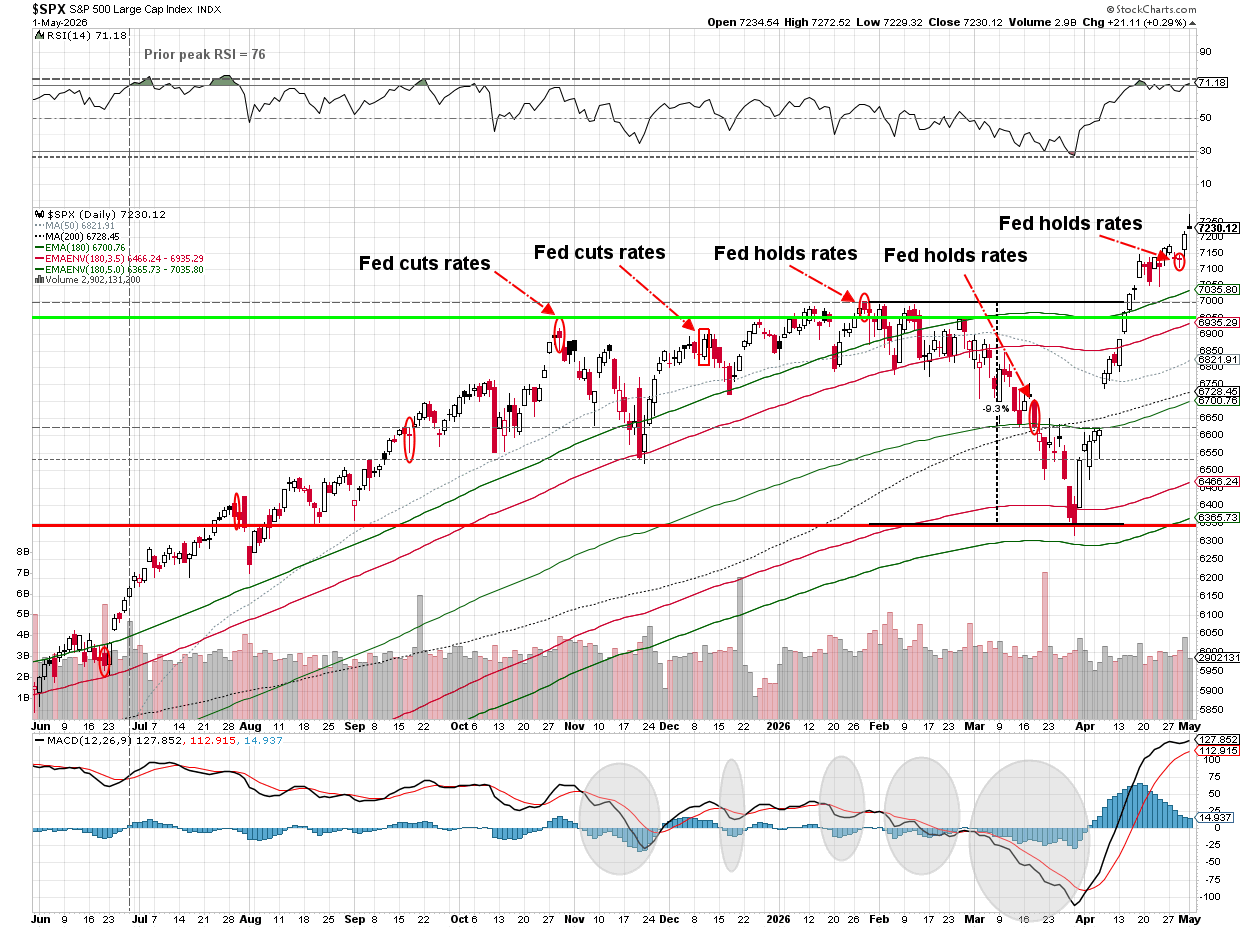
Longer-term (and near-term) the market is clearly "overbought" by all accounts. That hasn't seemed to matter for most of the last 3 years (until something like a hardline stance on tariffs or a war emerge).
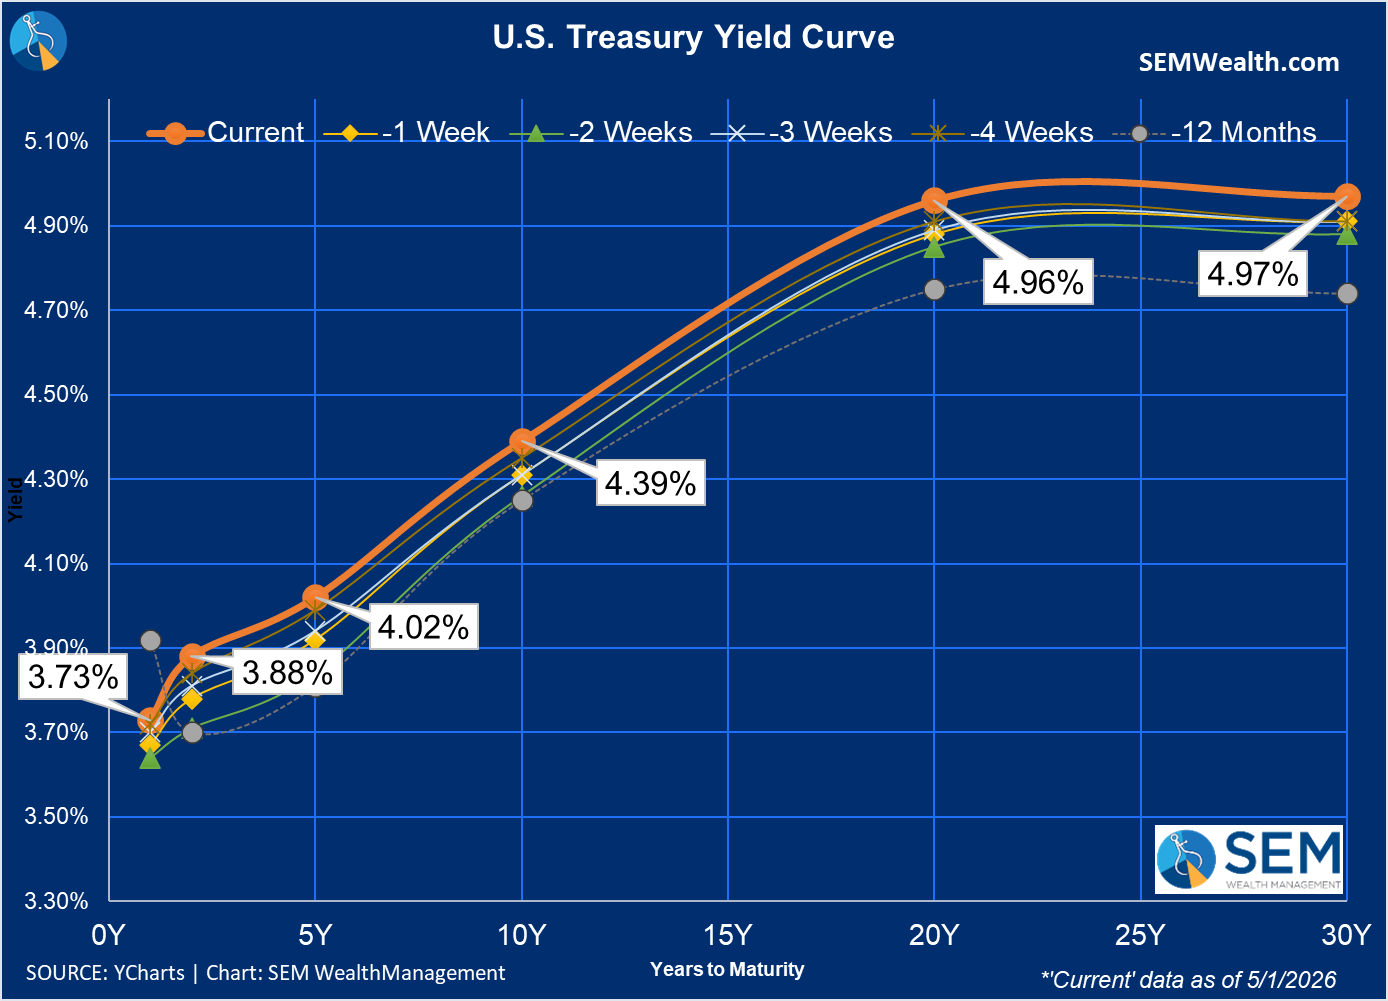
With inflation pressure continuing to be high, the yield curve pushed up to the highest interest rates in a year.
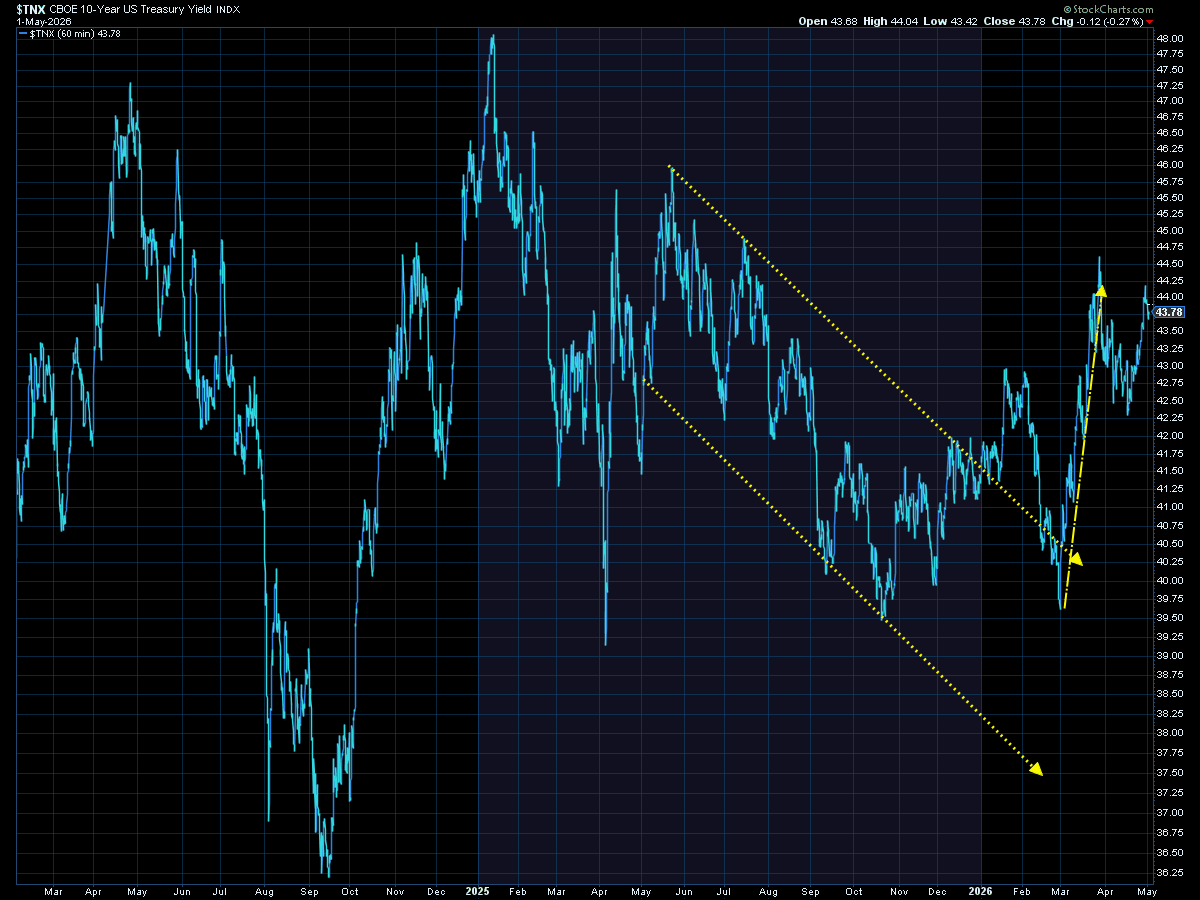
This chart of the 10-year Treasury shows the jump in long-term bond yields since the war began.
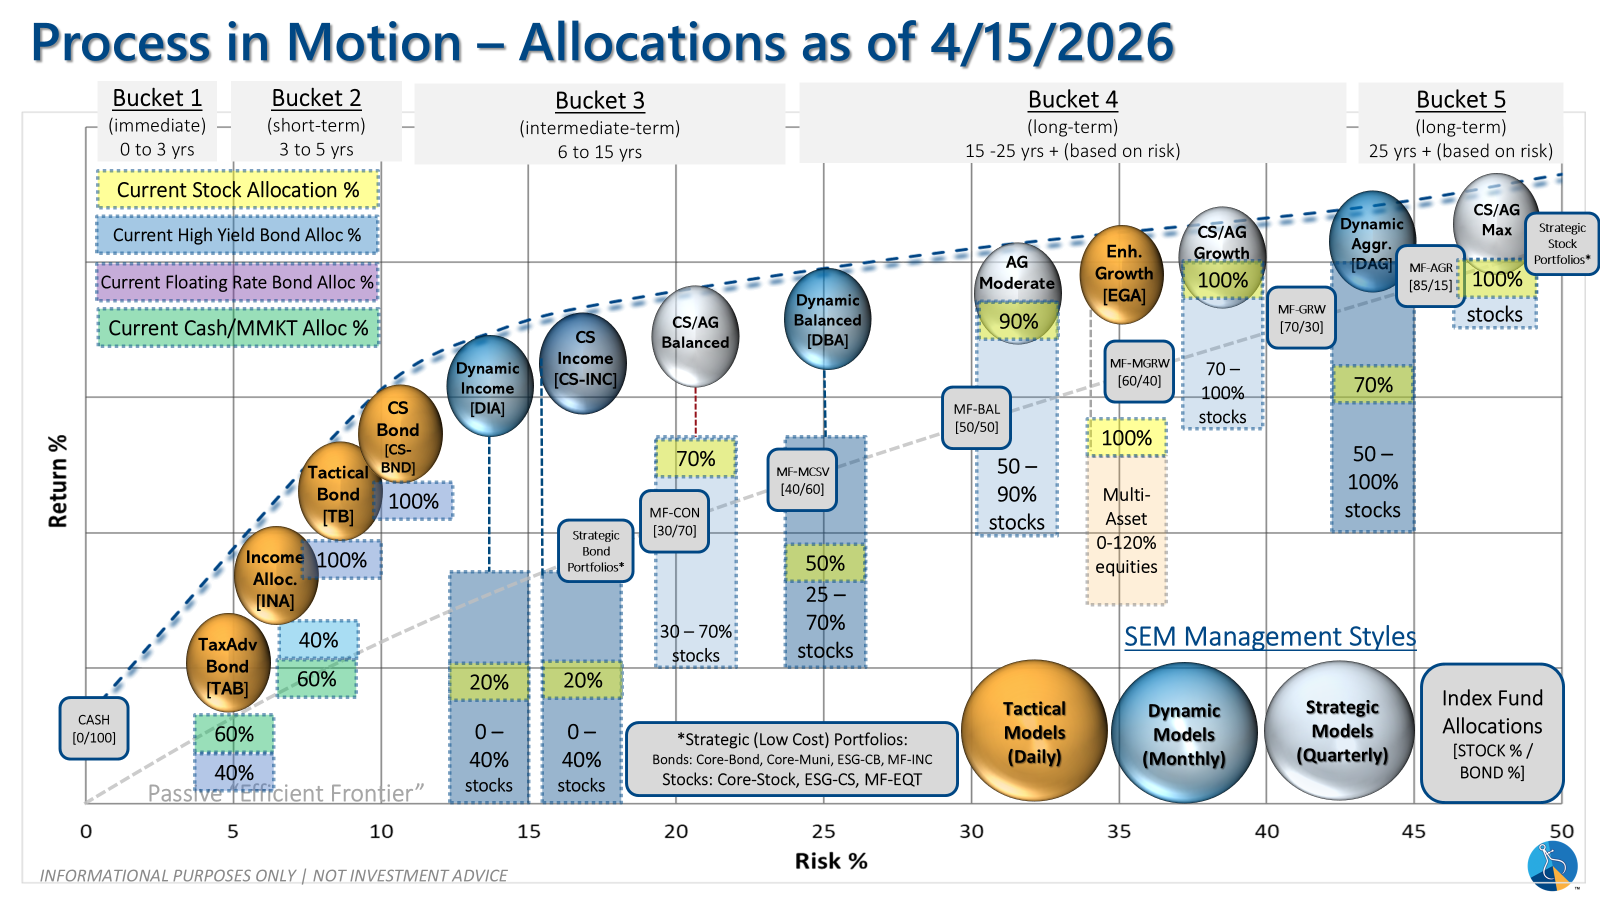
SEM Market Positioning
SEM deploys 3 distinct approaches – Tactical, Dynamic, and Strategic. These systems have been described as 'daily, monthly, quarterly' given how often they may make adjustments. Here is where they each stand.
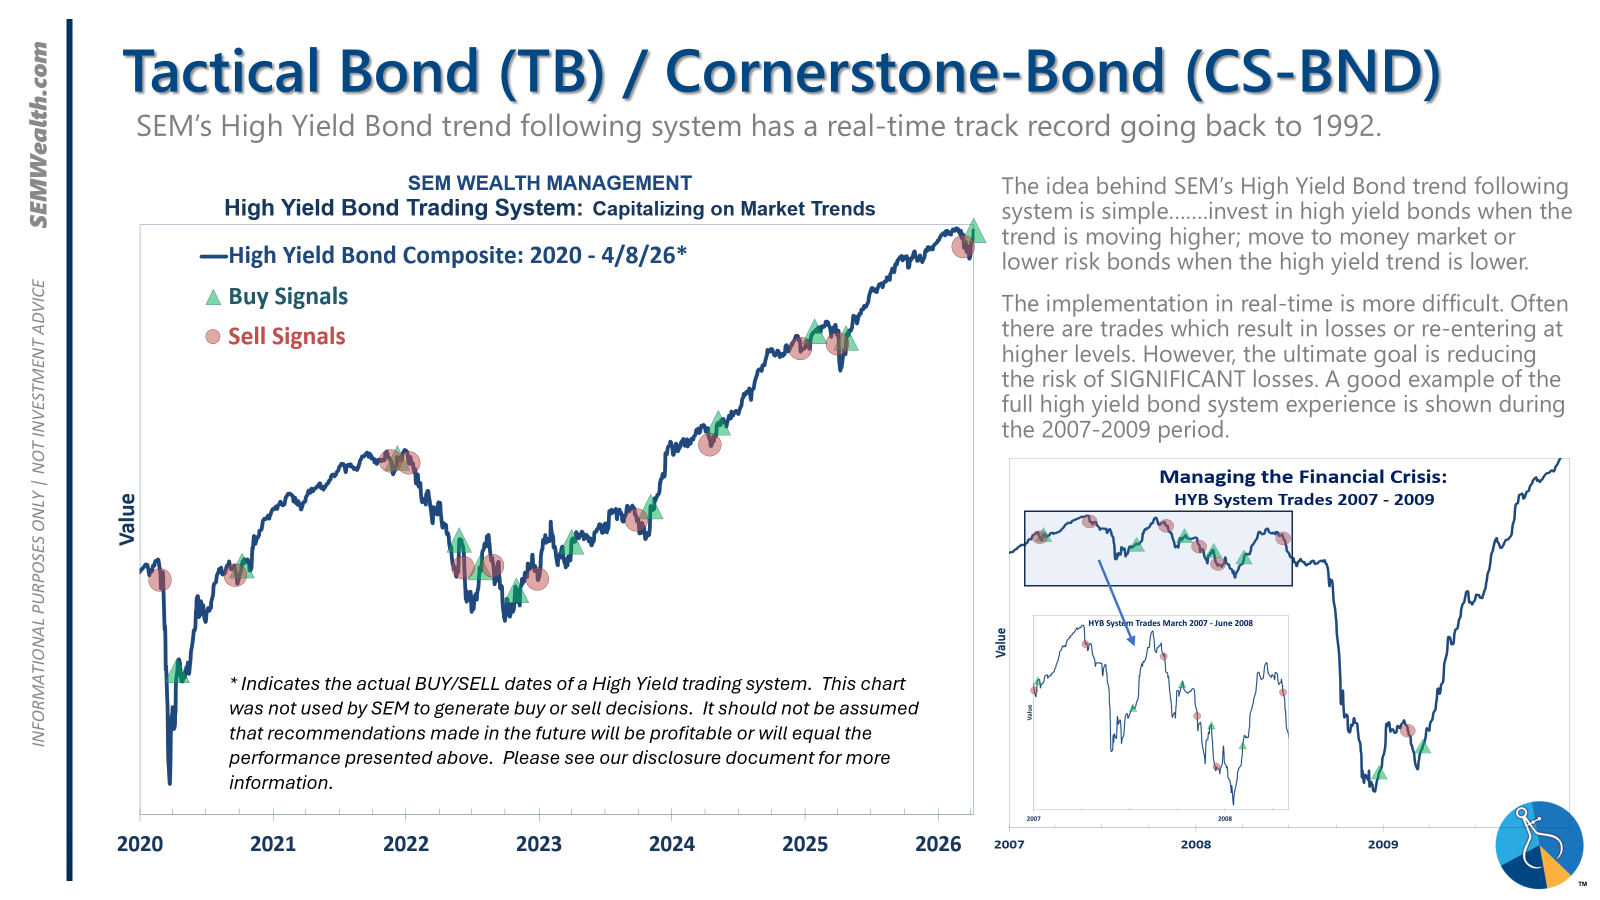
- Tactical = BULLISH | 100% High Yield Bond (4/8/2026) | High-yield spreads remain narrow but trend is slightly higher
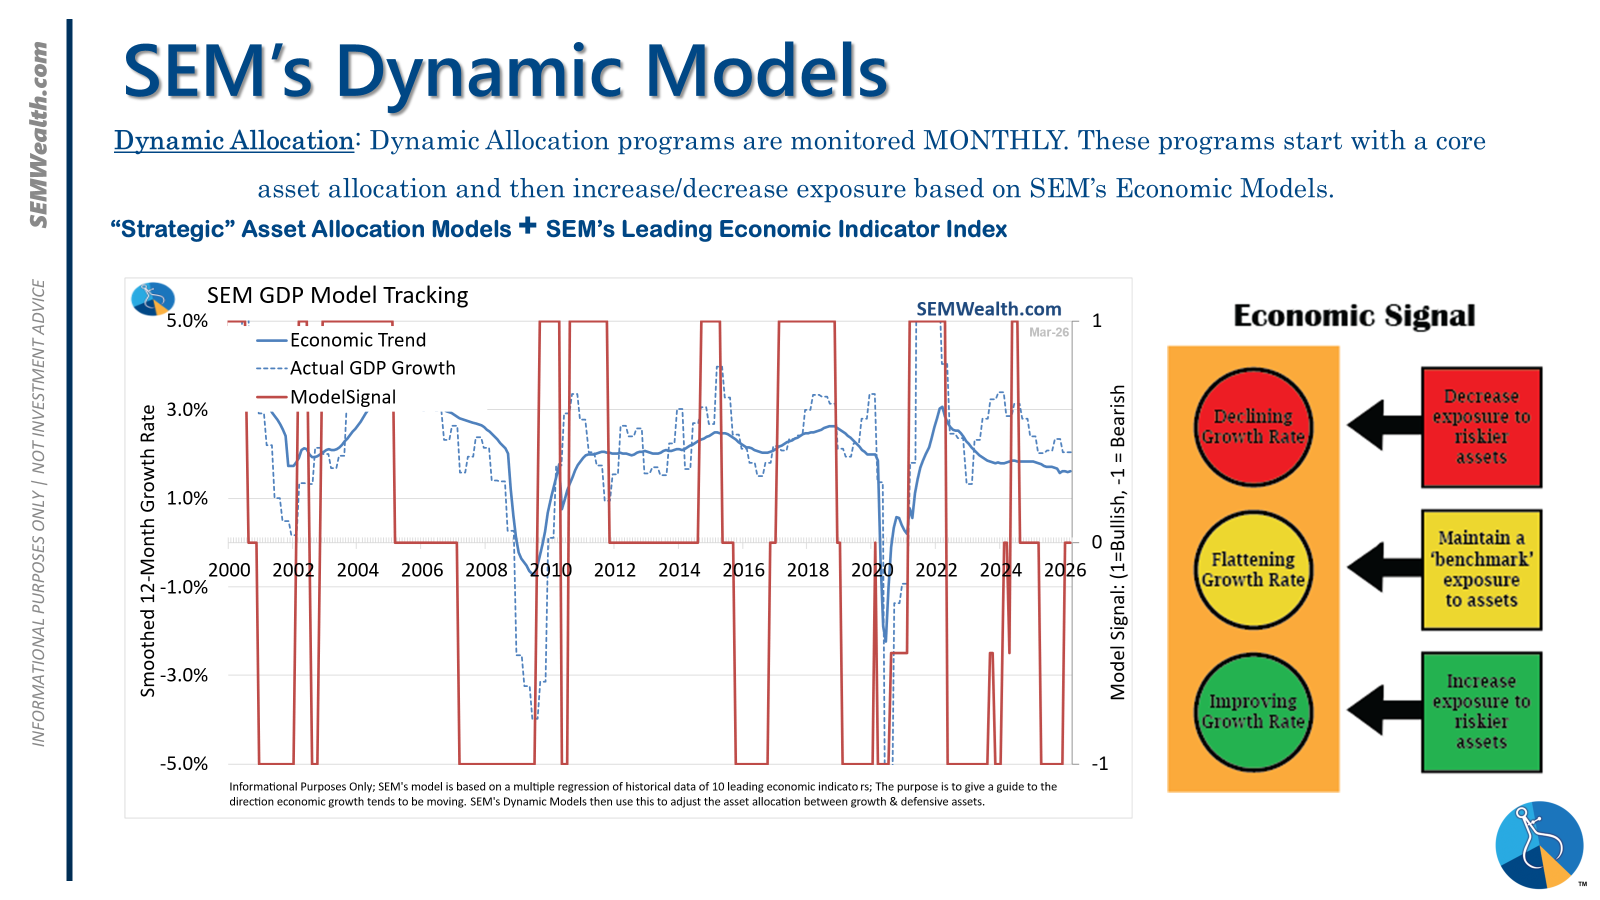
- Dynamic = NEUTRAL (2/15/2026) | "Benchmark" Allocation | Economic model inconclusive
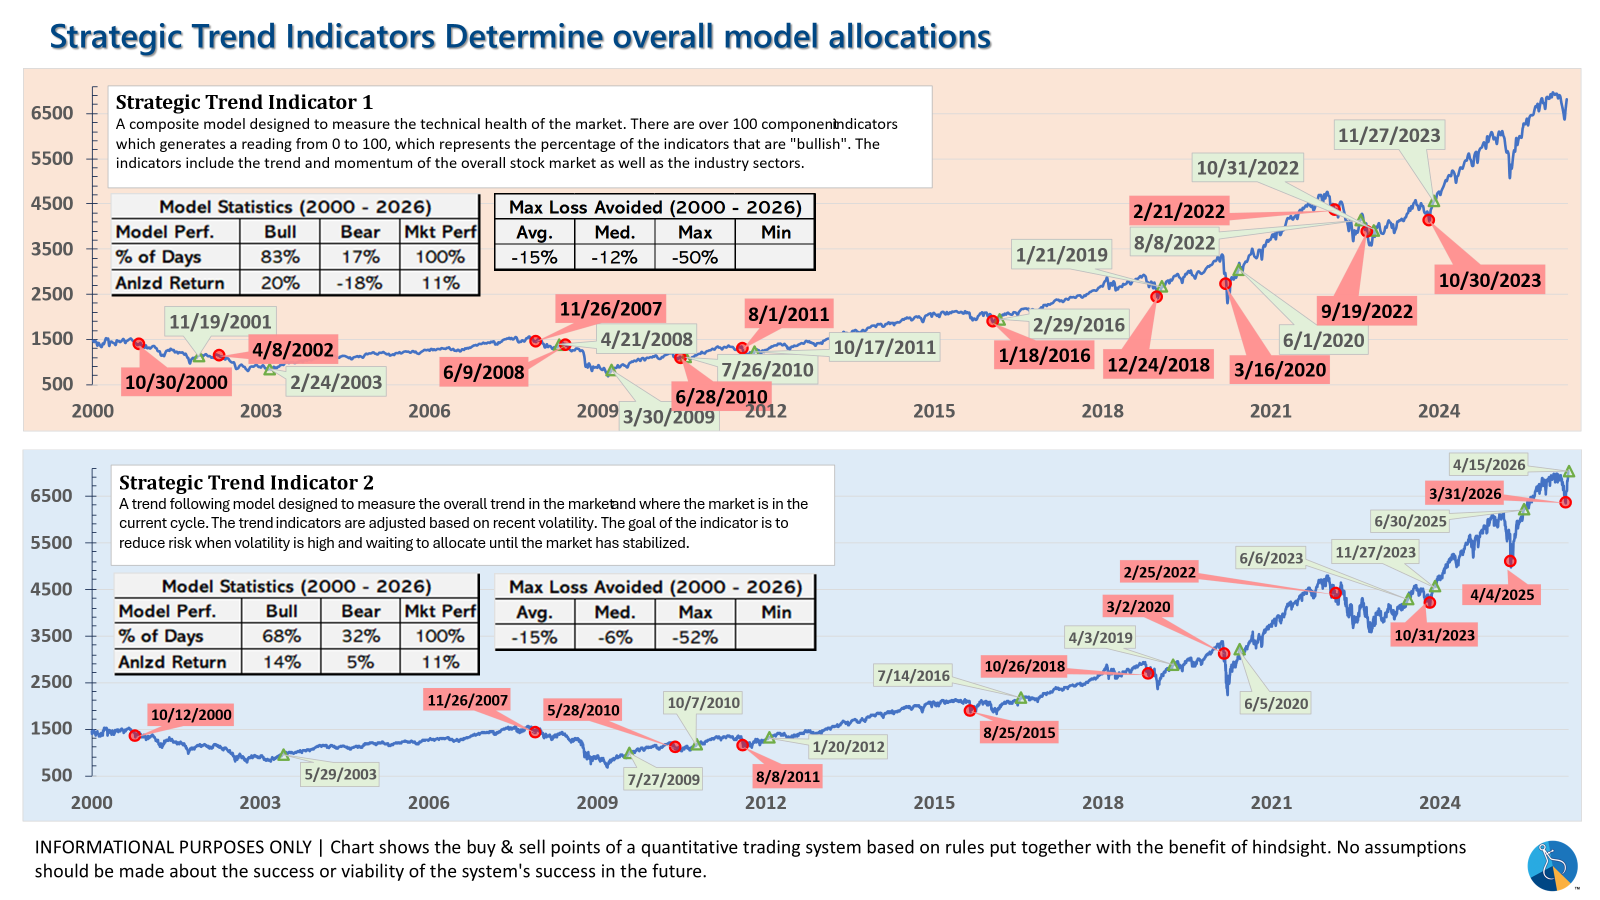
- Strategic = BULLISH (4/15/2026) | V-Bottom projecting "end" of Iran War
Tactical (daily):
- Monitored DAILY
- Models: Tactical Bond, Cornerstone Bond, Income Allocator, Tax Advantaged Bond
- Designed to follow the trends for use in our lower risk models
- BUY Signal issued April 8, 2026 (exiting the sell from March 13)
Dynamic (monthly):
- Monitored MONTHLY
- Models: All "Dynamic" Models (Income, Balanced, Growth, and Asset Allocator)
- Uses SEM's Quantitative Economic Model
- Designed to overweight riskier assets if economic trend is higher & underweight those assets if economic trend is lower.
- NEUTRAL signal issued February 15, 2026 (following BEARISH signal from July 2025)
Strategic (quarterly)*:
- Monitored QUARTERLY
- Models: AmeriGuard (Balanced, Moderate, & Growth) and Cornerstone (Balanced & Growth)
- Core Component: Quantitative Filter using 4 different time horizons across universe of asset classes
- Trend Indicator: Two different Quantitative Systems monitoring the intermediate-term trend, health of the market, and volatility
- CORE has been overweight small cap and international since October 2025 – overweight increased slightly in January
- Both TREND INDICATORS are BULLISH following 10% drop and "V-Bottom" reversal in early April
- AmeriGuard & Cornerstone Max DO NOT use the Trend indicator and are always 100% invested in stocks using our CORE rotation model.
The core rotation is adjusted quarterly. This quarter we saw half of our international positions reduced (we sold developed markets and kept our emerging markets exposure). We also saw the remaining share of mid-cap reduced in favor of more small cap exposure. We remain with a "barbell" core portfolio – about half in large cap and half in small cap as the models expect the market to "broaden".
The * in quarterly is for the trend models. These models are watched daily but they trade infrequently based on readings of where each believe we are in the cycle. The trend systems can be susceptible to "whipsaws" as we saw with the recent sell and buy signals at the end of October and November. The goal of the systems is to miss major downturns in the market. Risks are high when the market has been stampeding higher as it has for most of 2023. This means sometimes selling too soon. As we saw with the recent trade, the systems can quickly reverse if they are wrong.
Overall, this is how our various models stack up based on the last allocation change:
Curious if your current investment allocation aligns with your overall objectives and risk tolerance?


