
In a perfect world we could just focus on the economy and how it impacts our investments. We could just enjoy the USA Hockey victory over Canada, something that united Americans for at least a few hours on Sunday. Unfortunately our world is not perfect and politics and the divide it creates enters into the equation far too often. Last week we had a flood of news and data that will be causing more volatility in the weeks and months ahead. I hope everyone enjoyed the last day of the Olympics and being united for at least a few hours. Today we're back to reality.
Most "Random" Tariffs are Illegal
Prior to Friday's Supreme Court ruling which struck down most of the tariffs President Trump imposed last year, I was going to discuss the fact despite the highest tariff rates we've seen since the 1980s, the trade deficit remains high. This chart from Bloomberg shows the problem.
During his first term, President Trump implemented a broad range of targeted tariffs, which mostly remained in place until he took office again in January 2025. Our trade deficit has only gotten worse since then. Granted, it takes time for trade policies to have an impact and many business "front loaded" their inventories in the 1st quarter to get ahead of tariffs. That doesn't explain why the trade deficit expanded in the fourth quarter last year. My take – trade policy is complicated and there is no easy solution, including blanket or "reciprocal" or punitive tariffs.
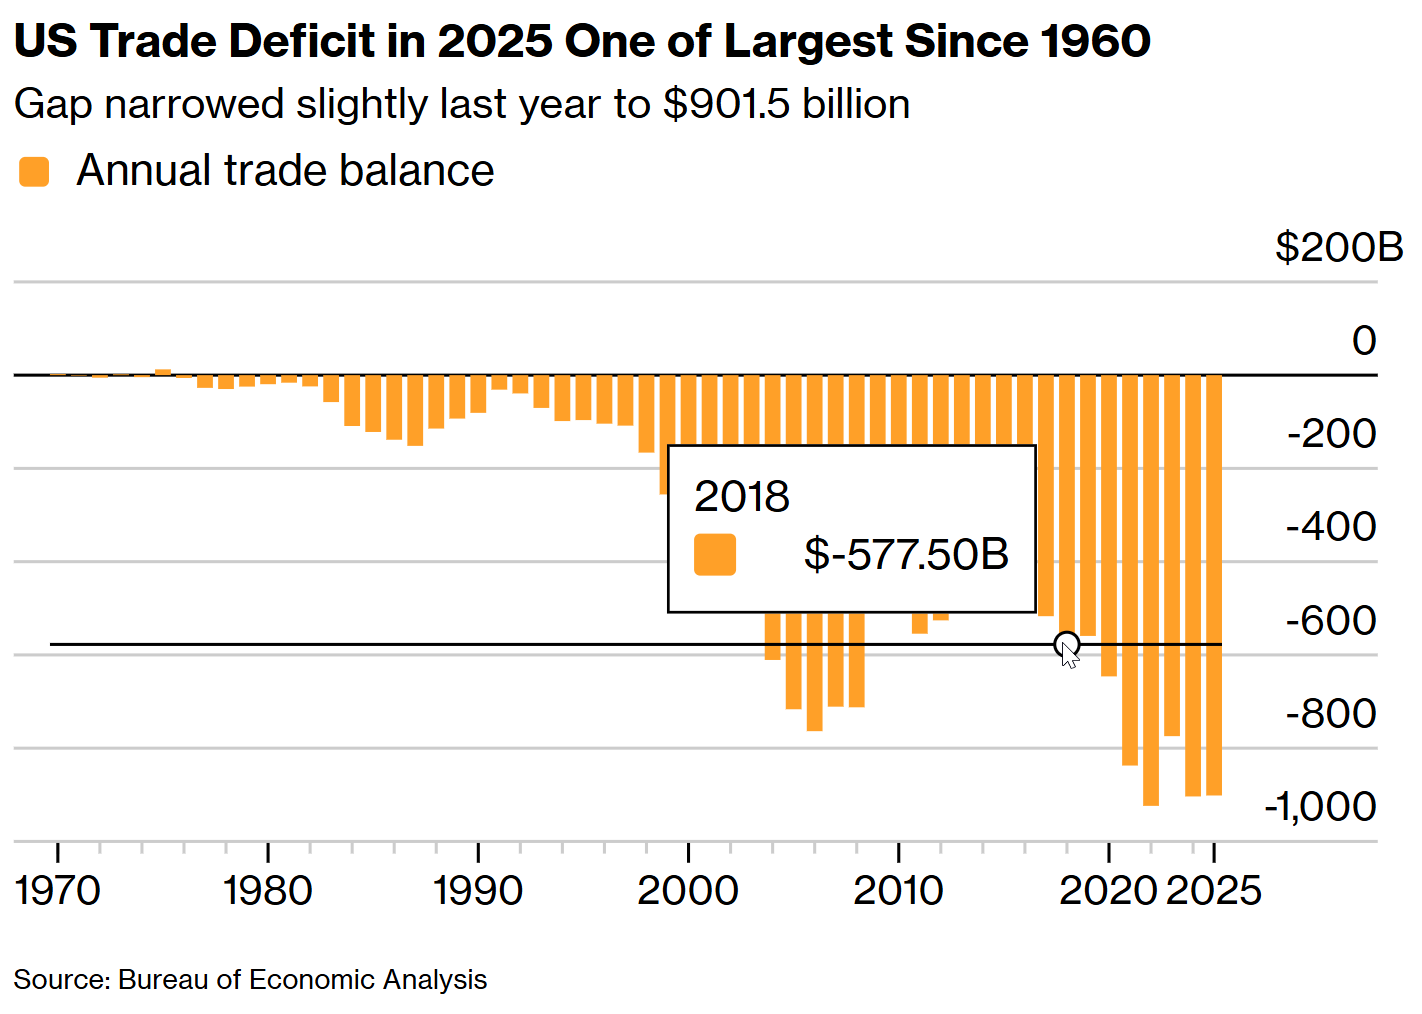
I've said two things all along – we have to fix our dual deficits (trade and budget), but the way President Trump was trying to do this was probably not the best way. First off, as the Supreme Court ruled, with narrow exceptions, Congress has the authority to ratify trade deals and to implement tariffs as needed. Secondly, incentives rather than penalties are usually the better way to get businesses to shift their manufacturing and supply chain to the US. Finally, it will take time and sacrifice to truly fix the trade deficit. Americans (and the politicians we elect) want quick fixes with little pain rather than doing the necessary structural things needed to truly fix the problem.
The market seemed to have priced in the Supreme Court's ruling, but now we have a bigger problem – how/when/if the US pay back the tariffs already collected and how will the Trump administration respond. So far the response was to implement the legally allowed "national emergency" tariff of 15% on EVERYTHING coming into the US. This law allows the President to TEMPORARILY boost tariffs for 150 days. After 150 days, the President can extend it one final time for another 150 days by notifying Congress and documenting the case for the "emergency".
While the trade war most certainly leads to volatility for the markets, from an economic standpoint changes to our trade deficit over the short-term are marginal (a few tenths of a percent). In other words, the noise in the weeks/months ahead will create volatility, but not really impact the overall economy.
Economic Data Finally Catching Up!
We are finally getting caught up on economic data following the government shutdown last fall (and the partial one a couple weekends ago.) The big release came on Friday, starting with GDP. As I do nearly every quarter, I must start with the reminder that the "official" headline number is quite misleading. Essentially the last 3 months' of activity are compounded 4 times to get an "annualized rate". This leads to large fluctuations in the "official" number and causes Americans on both sides of the political spectrum to overreact based on whether or not it supports the party in the White House.
I warned everyone about this last quarter when the headline was an economy that grew at a 4.4% annualized rate. The number we use and I wish everyone would use was the year-over-year (12 month) growth rate of 2.3%. This was still well below the 3.1% long-term average. Since then, most estimates had the official number coming in anywhere from 2.5% to 5.4%. With little economic data being released, we saw economists using private data to guestimate how well the economy was doing. It turns out they were all wrong, with the official number showing a 1.4% growth rate. The 12-month rate declined to 2.23%.
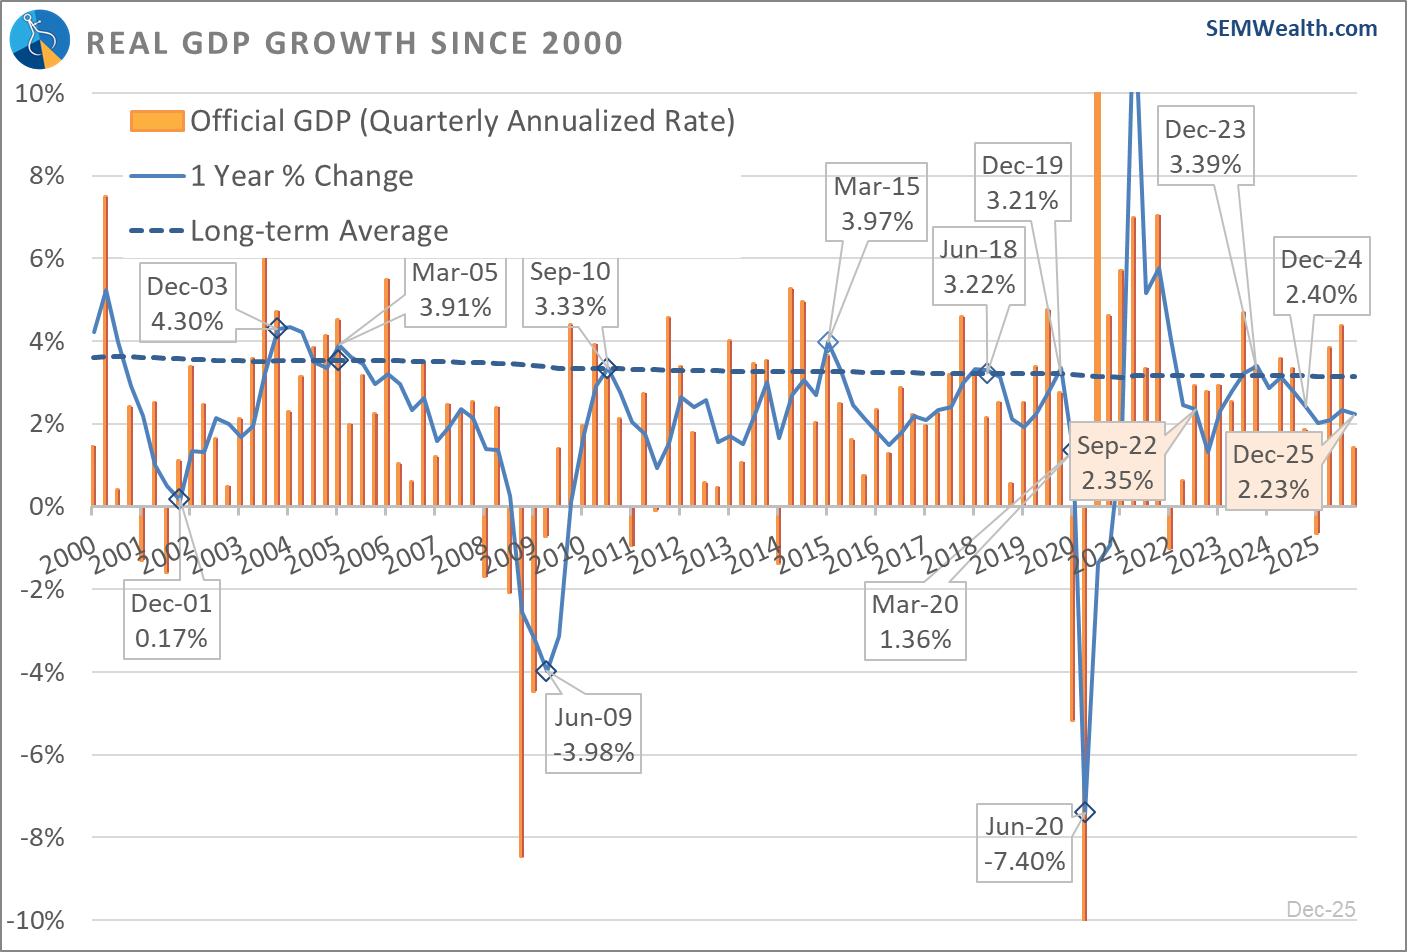
In addition to a much bigger than expected trade deficit last quarter (which subtracts from GDP growth), inventory fluctuations, and the long government shutdown also led to slower growth than most people expected. Overall, other than technology spending (which accounted for just over half of the growth last quarter), everything came in slightly below expectations.
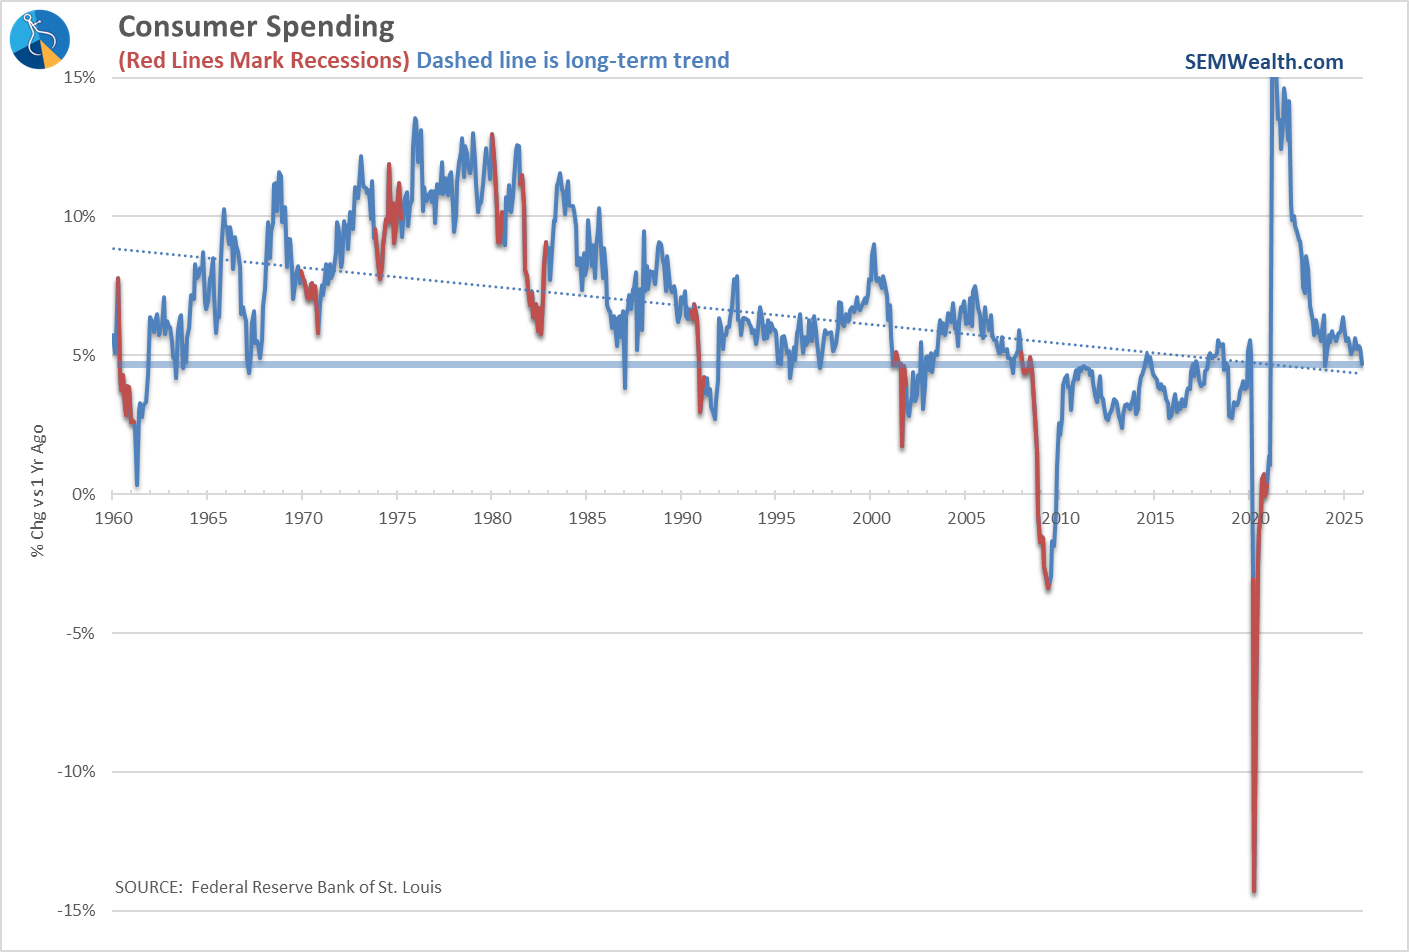
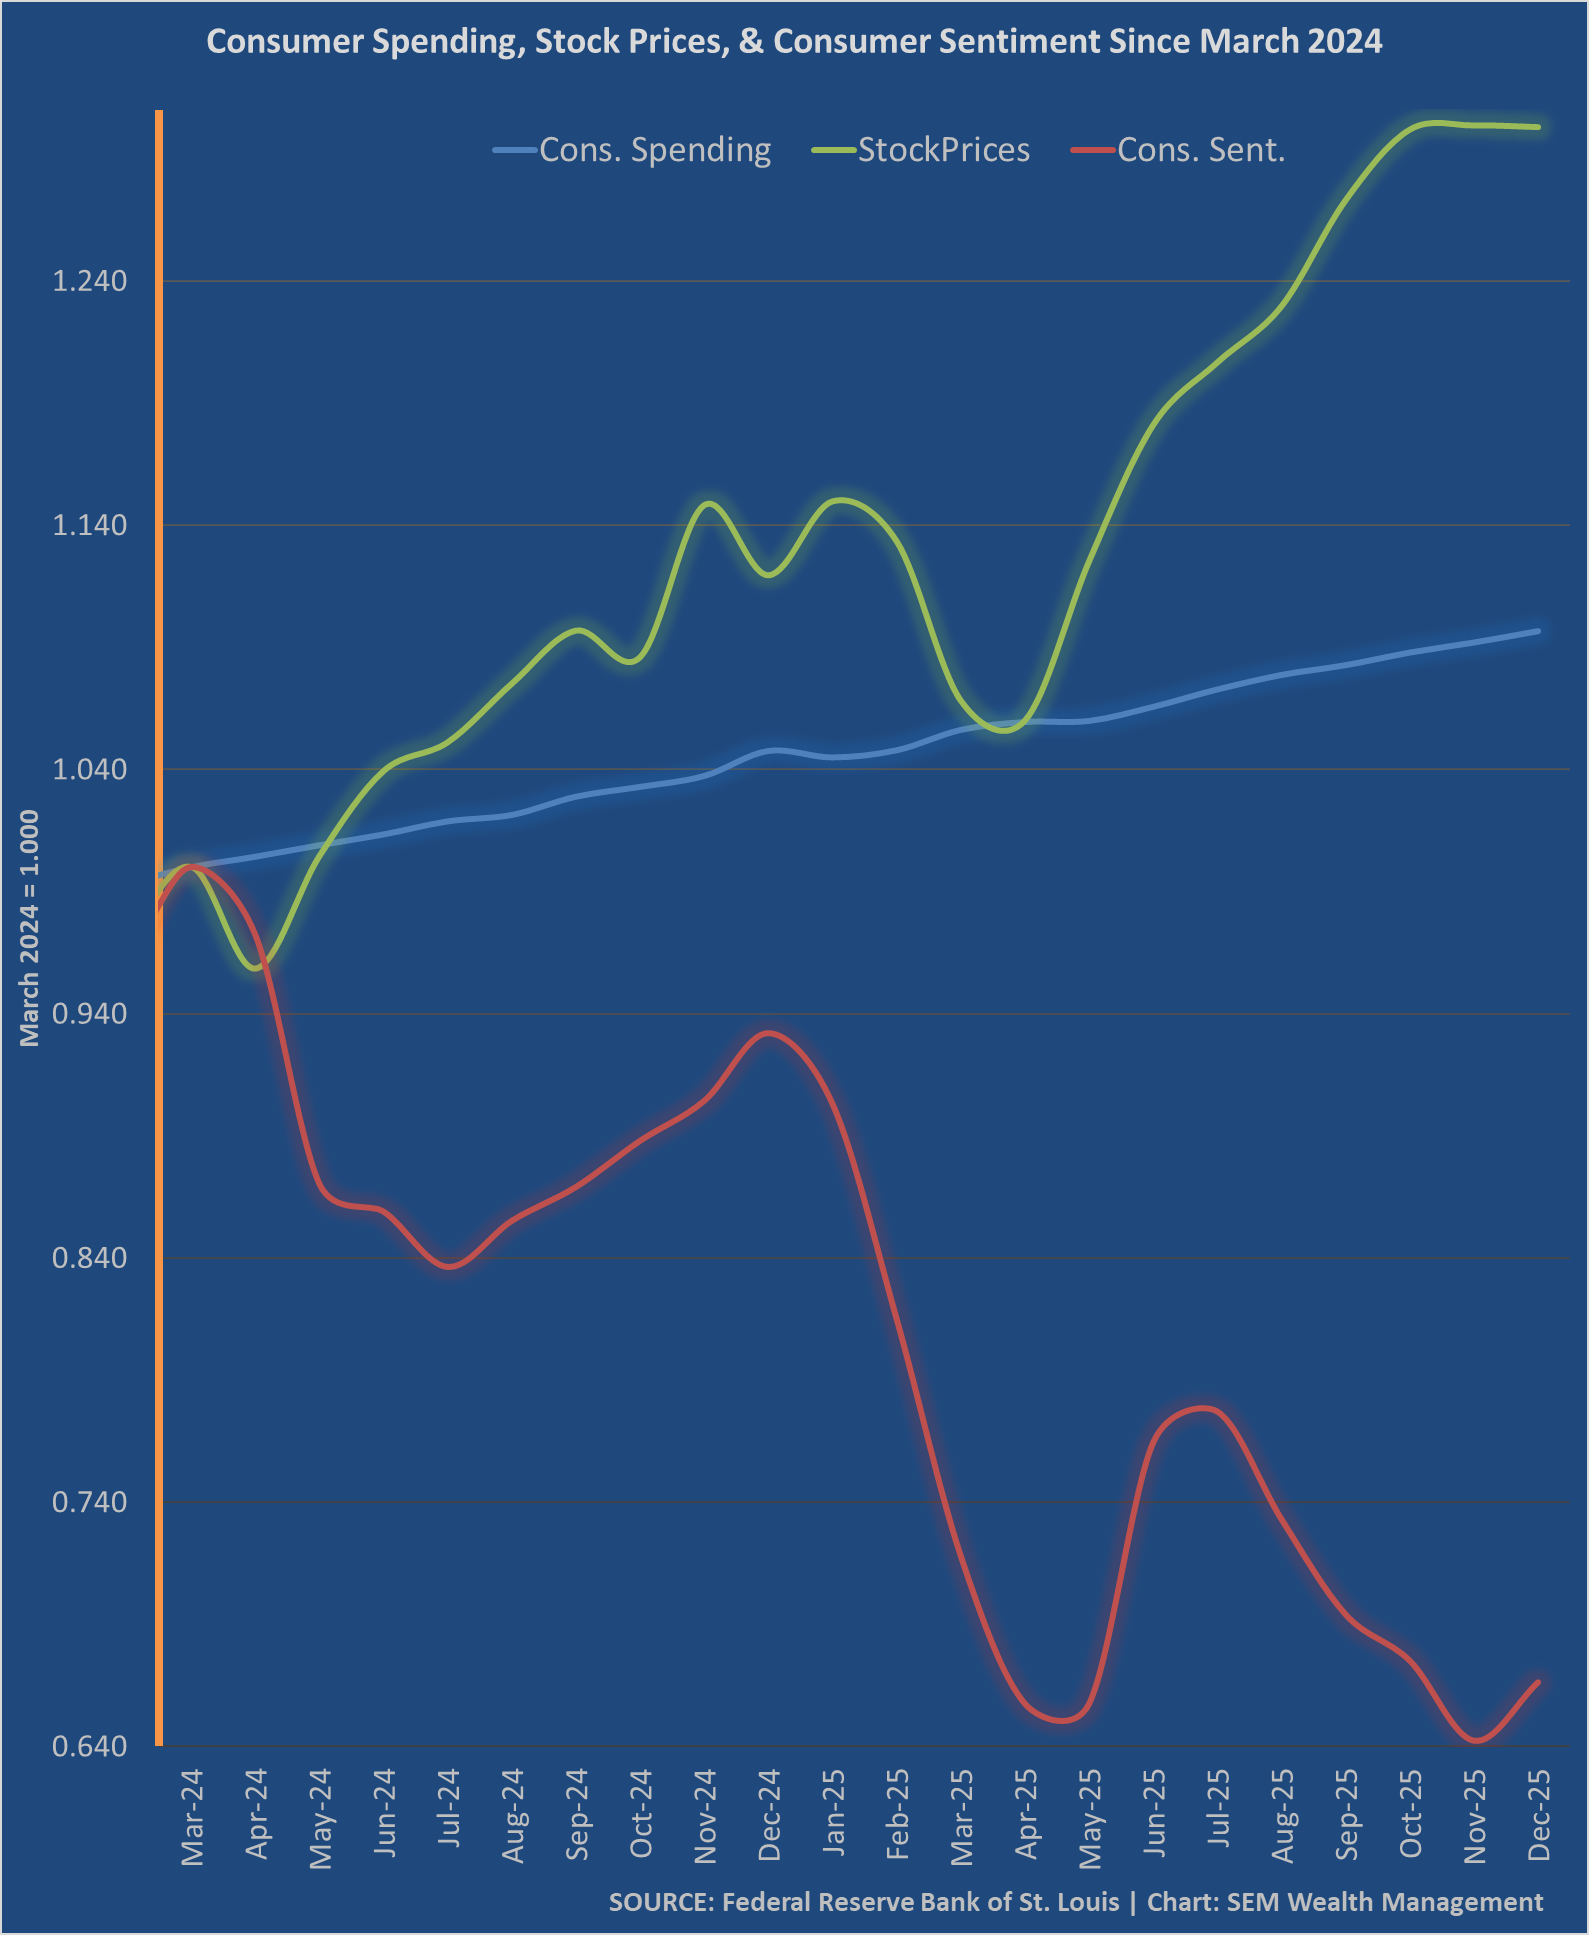
Consumer spending still is "strong", but not as strong as it had been. The current annual rate just below 5% was the LOW levels of the 1990s and early 2000s expansions, but near the highs of the 2009-2019 expansions.
A bigger concern, which ties into the K-Shaped Economy we've discussed on and off since COVID, is the decline in Real Disposable Personal Income (the money leftover after adjusting for inflation and paying taxes.) It has again flattened after rising back to the longer-term trend line.
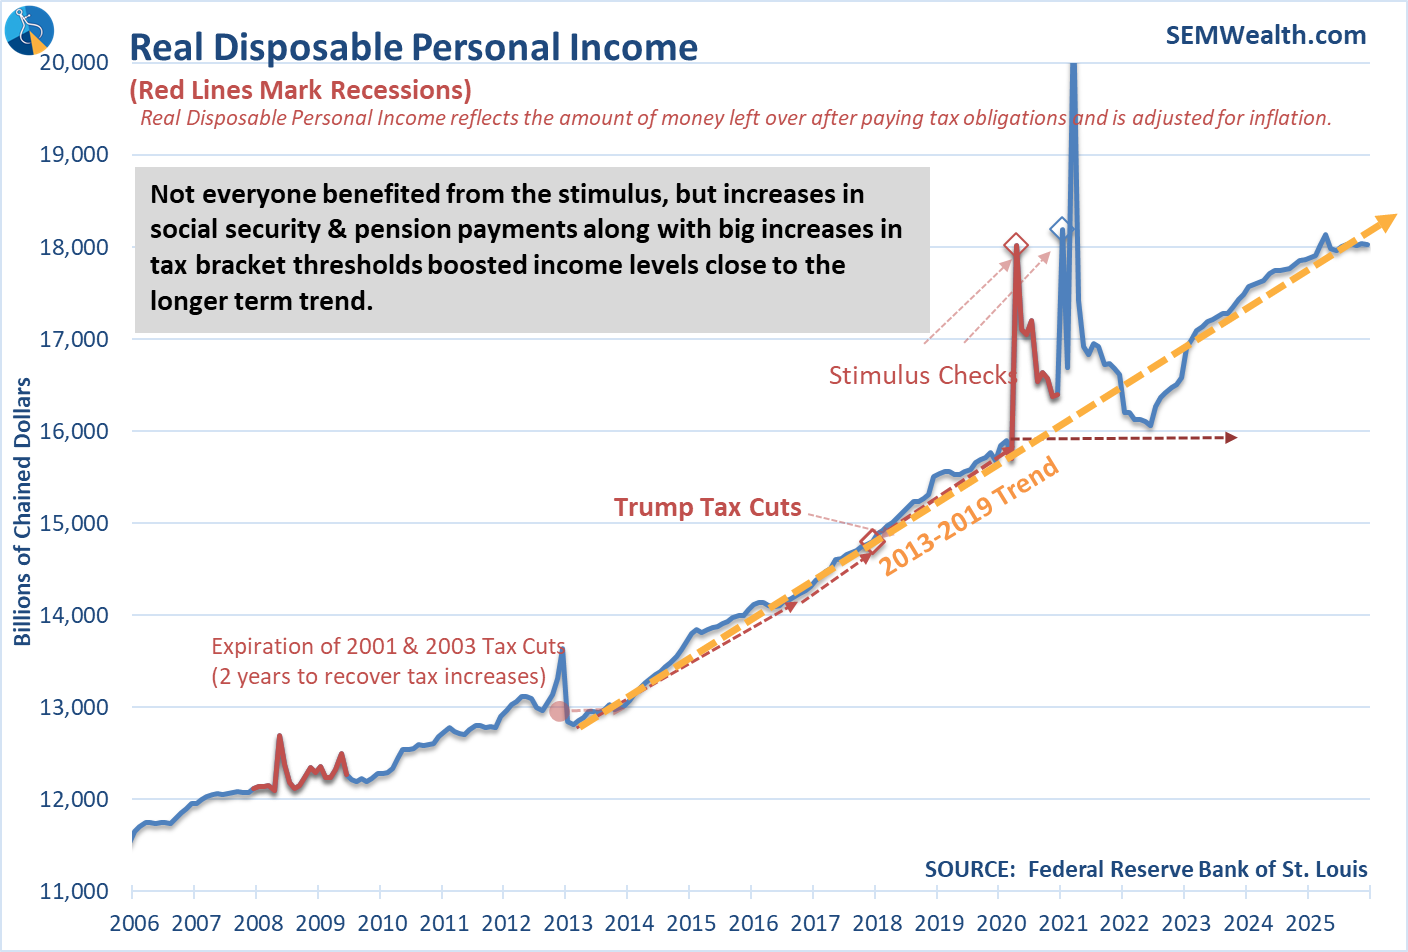
While I do expect tax refunds to boost this temporarily, it won't change the overall disconnect that started when Congress and both Presidents Trump and Biden chose to send nearly every American stimulus checks whether they needed them or not.
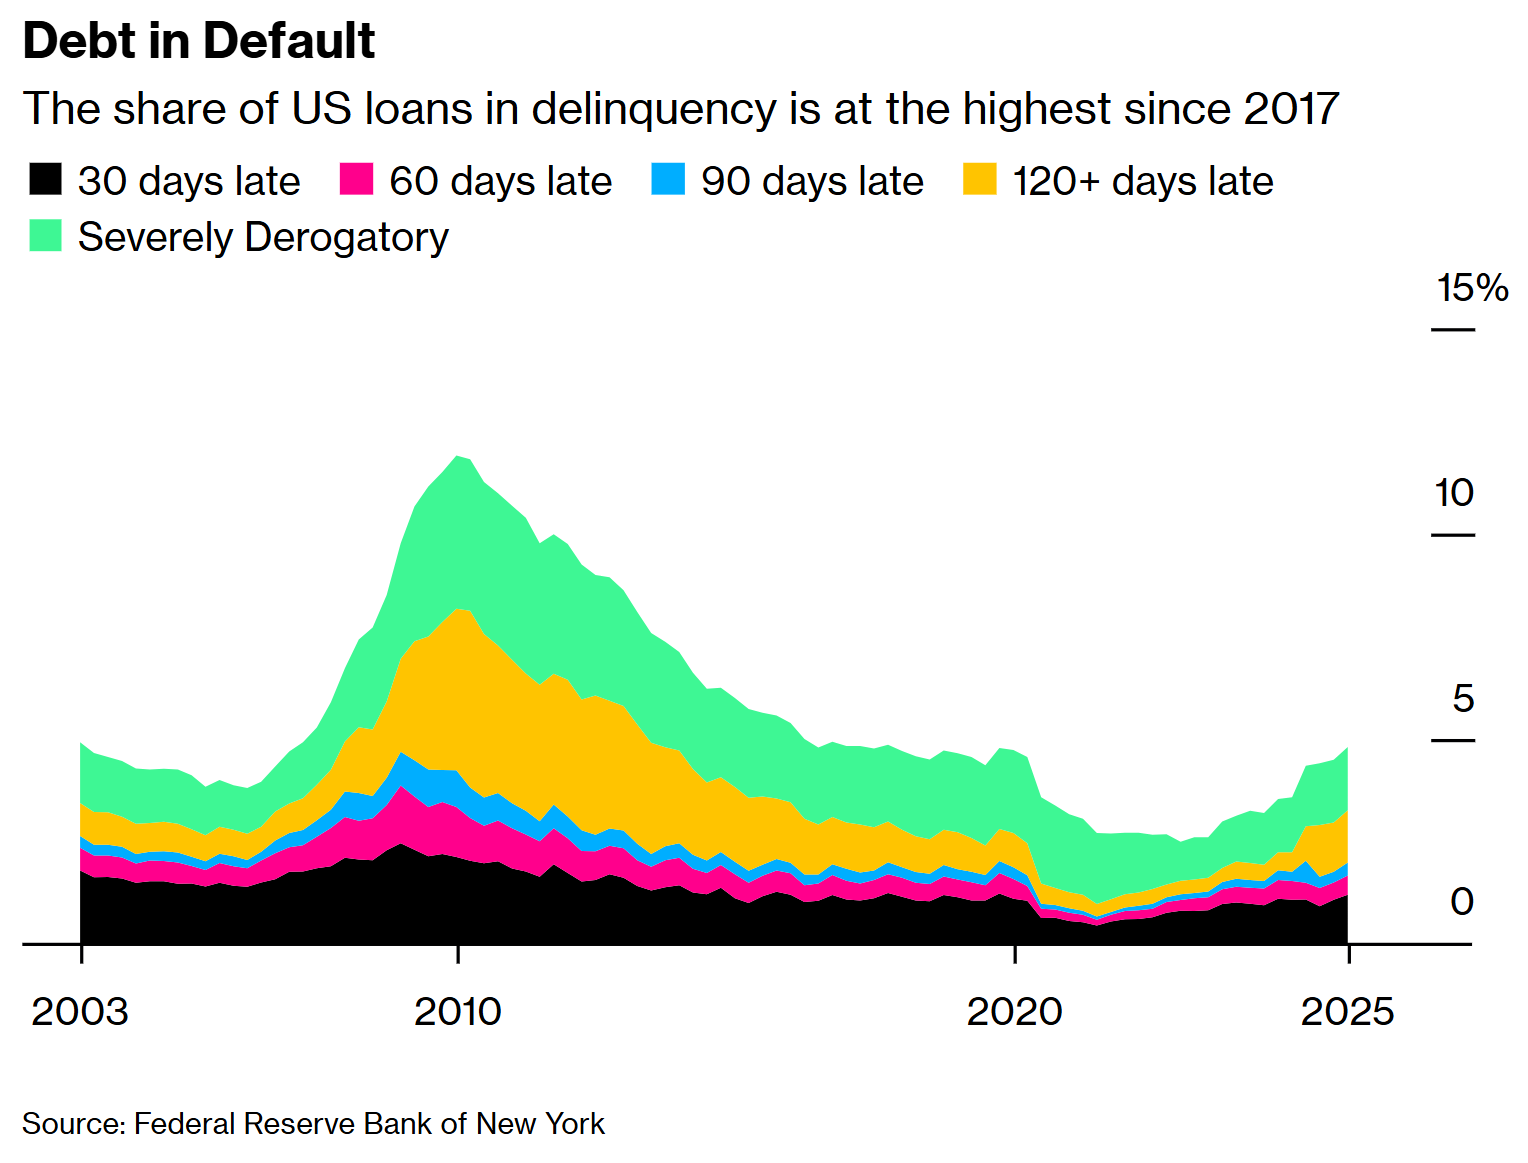
This has been showing up in loan delinquencies, which rose by nearly 5% in the 4th quarter. This is yet another signal of the disconnect between the upper-half of the K and the lower-half. The trend has been moving higher since late 2023, which is about the time consumer sentiment peaked. Note the left side of the chart where the increase in delinquencies started in the middle of 2006, 2 years before it started hitting Wall Street.
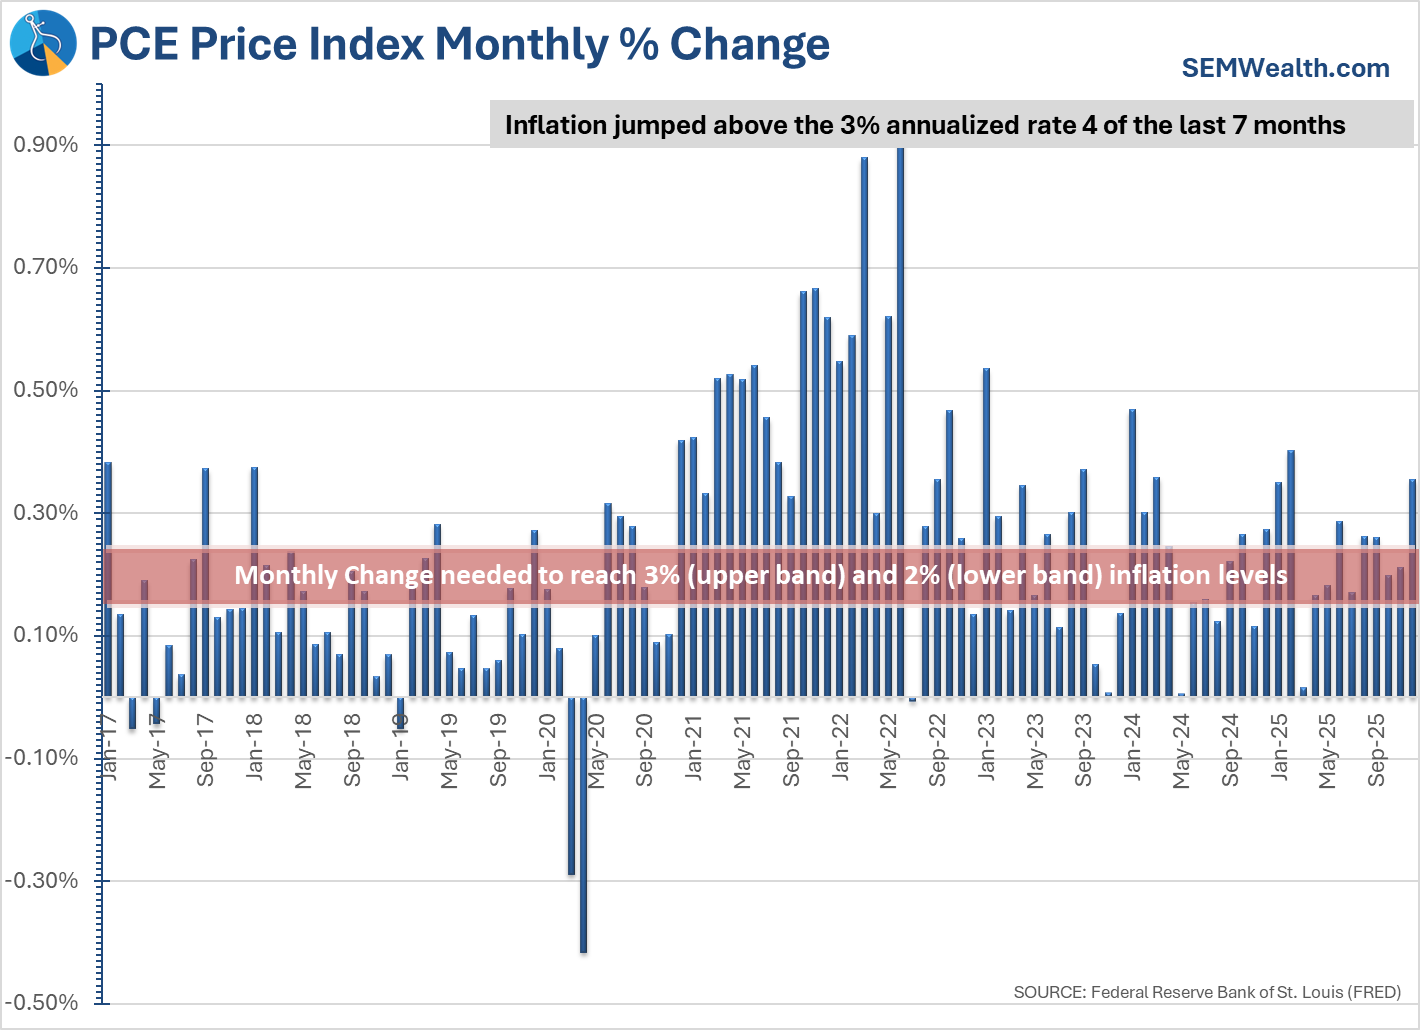
An on-going concern for those in the lower half of the K continues to be inflation. Unlike CPI, which showed a deceleration of inflation, the Fed's preferred measure of inflation, the PCE Price Index showed another increase in the inflation rate.
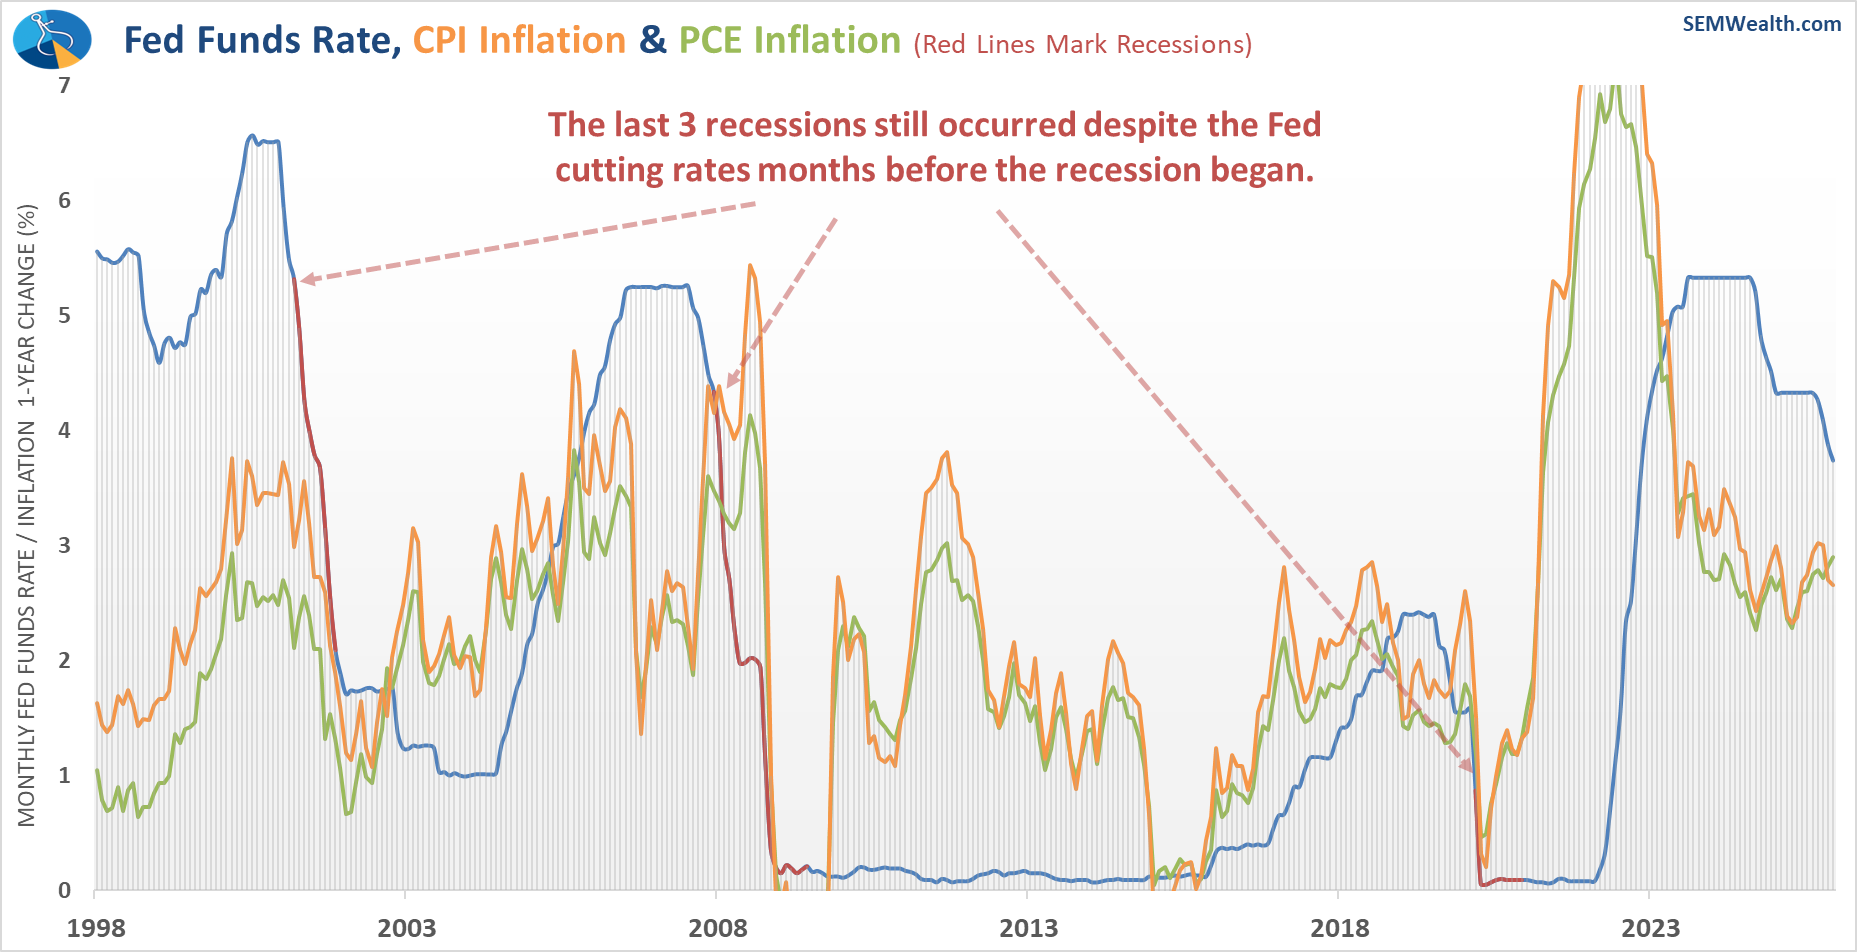
Looking at a longer-term chart of CPI, PCE, and the Fed Funds rate, it is hard to argue the Fed should be slashing interest rates as some are proposing.
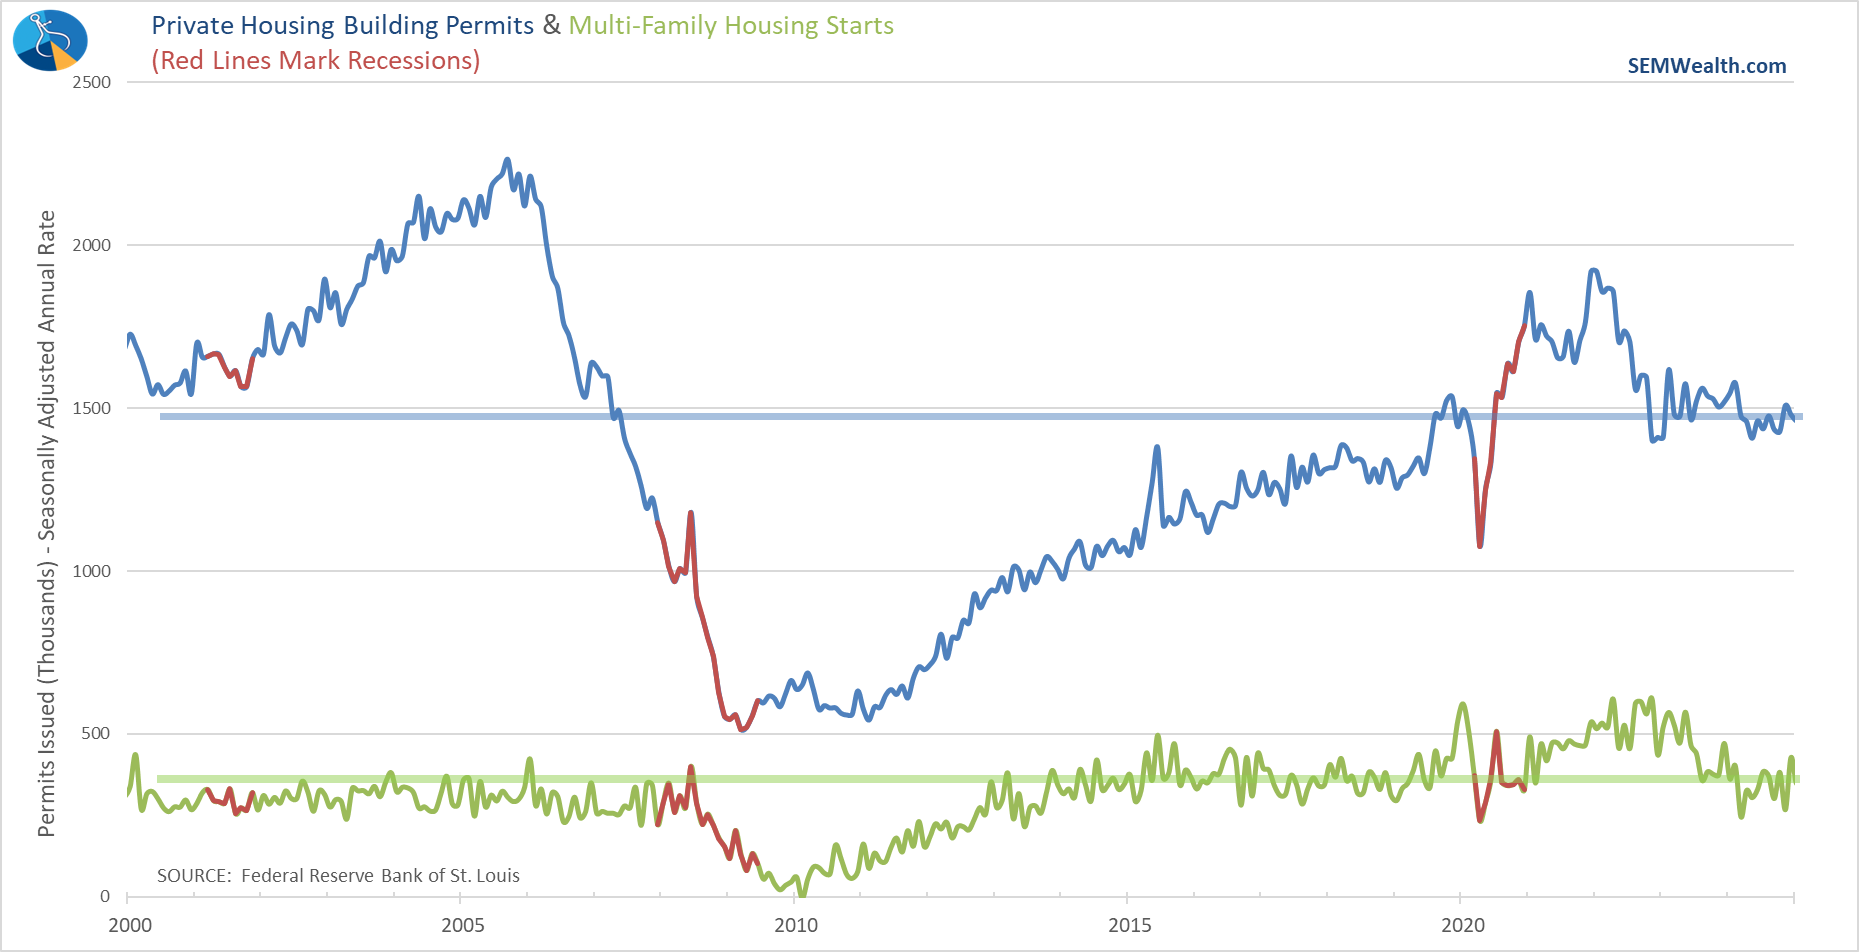
The final piece of data we'd been waiting for since the government shutdown was Building Permits and Housing Starts. This is a key indicator of future economic activity and sentiment as the spending that goes into building a new home has a multiplier effect and we won't see a lot of new home building unless there is confidence in the future. The government provided November and December data in one release last week and the best way I could sum it up was "meh".
We're still not seeing enough activity to get excited about in either single family or multi-family homes. Listening to the CEOs of the homebuilders they claim the issue is the best "demand" will come from the first-time homebuyers, but they cannot increase "supply" because it is far too expensive to build homes these buyers can afford. This only further adds to the K-Shaped disconnect in our economy.
Leading Indicators Flat
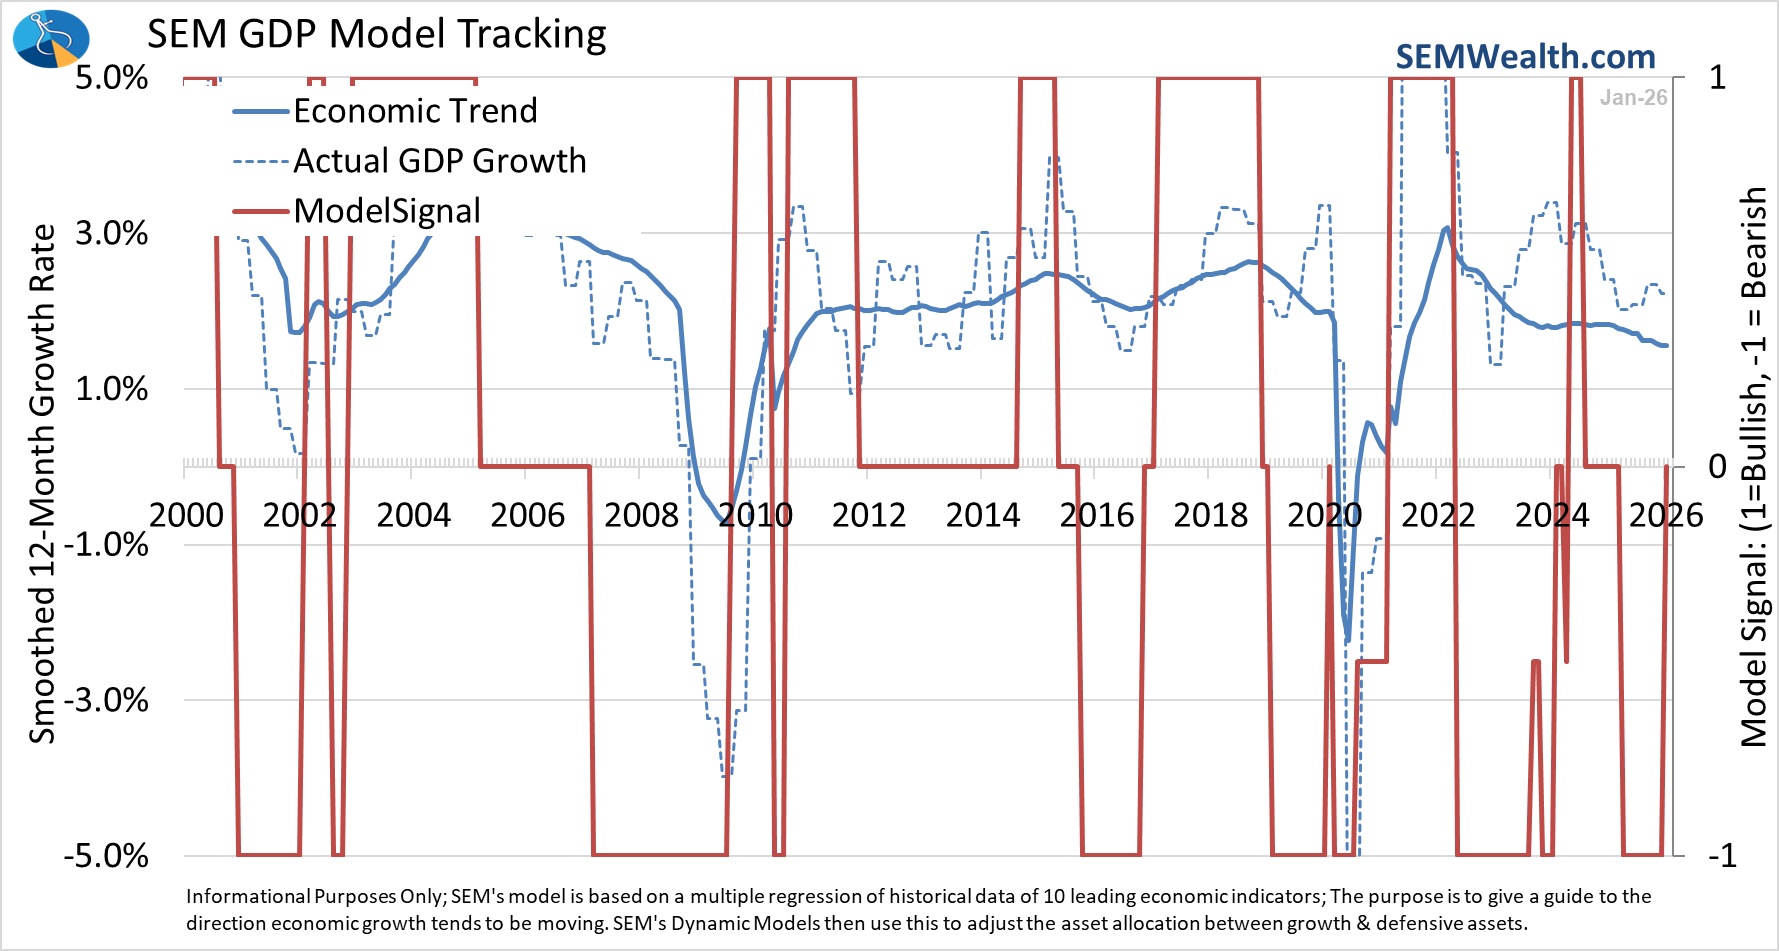
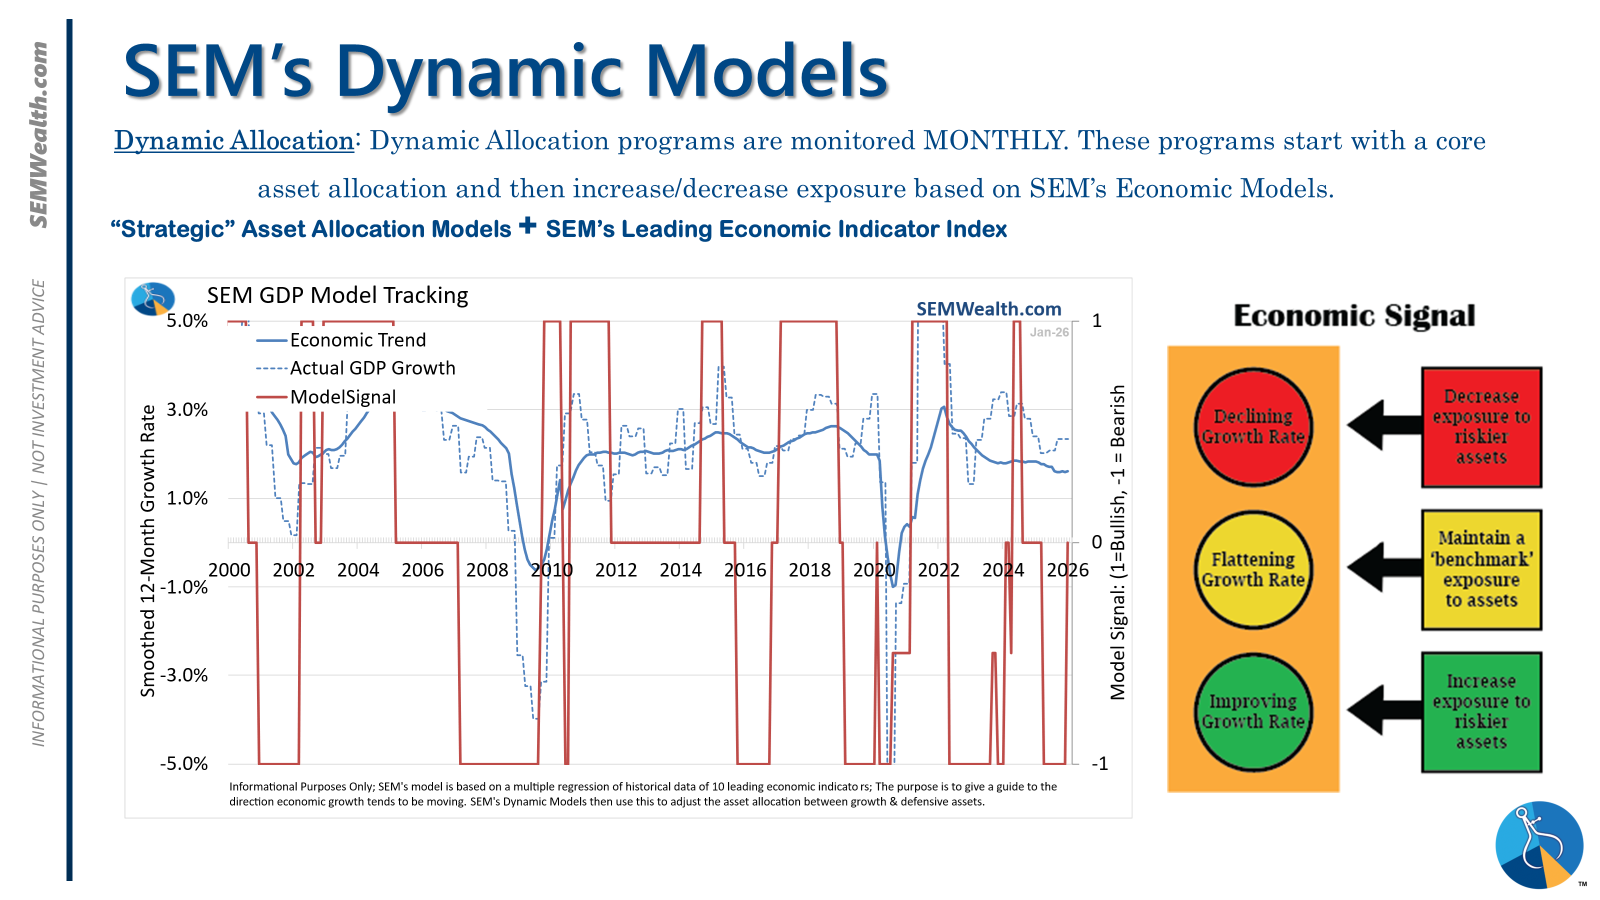
Now that we are caught up from the government shutdown, our economic model has adjusted slightly from bearish to neutral. As you may gather from my commentary and the charts above, this is more of a "things are less bad" than a "things are getting better" signal.
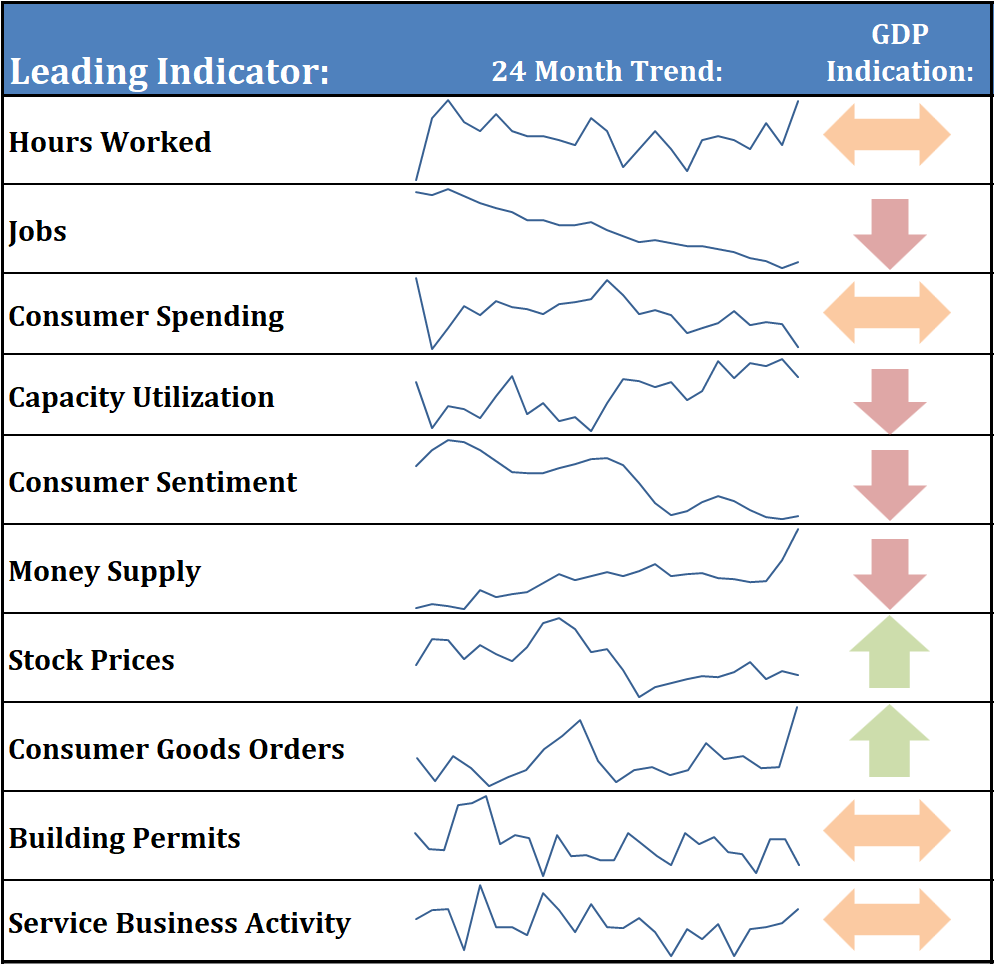
Our heat map illustrates the lack of positives out there.
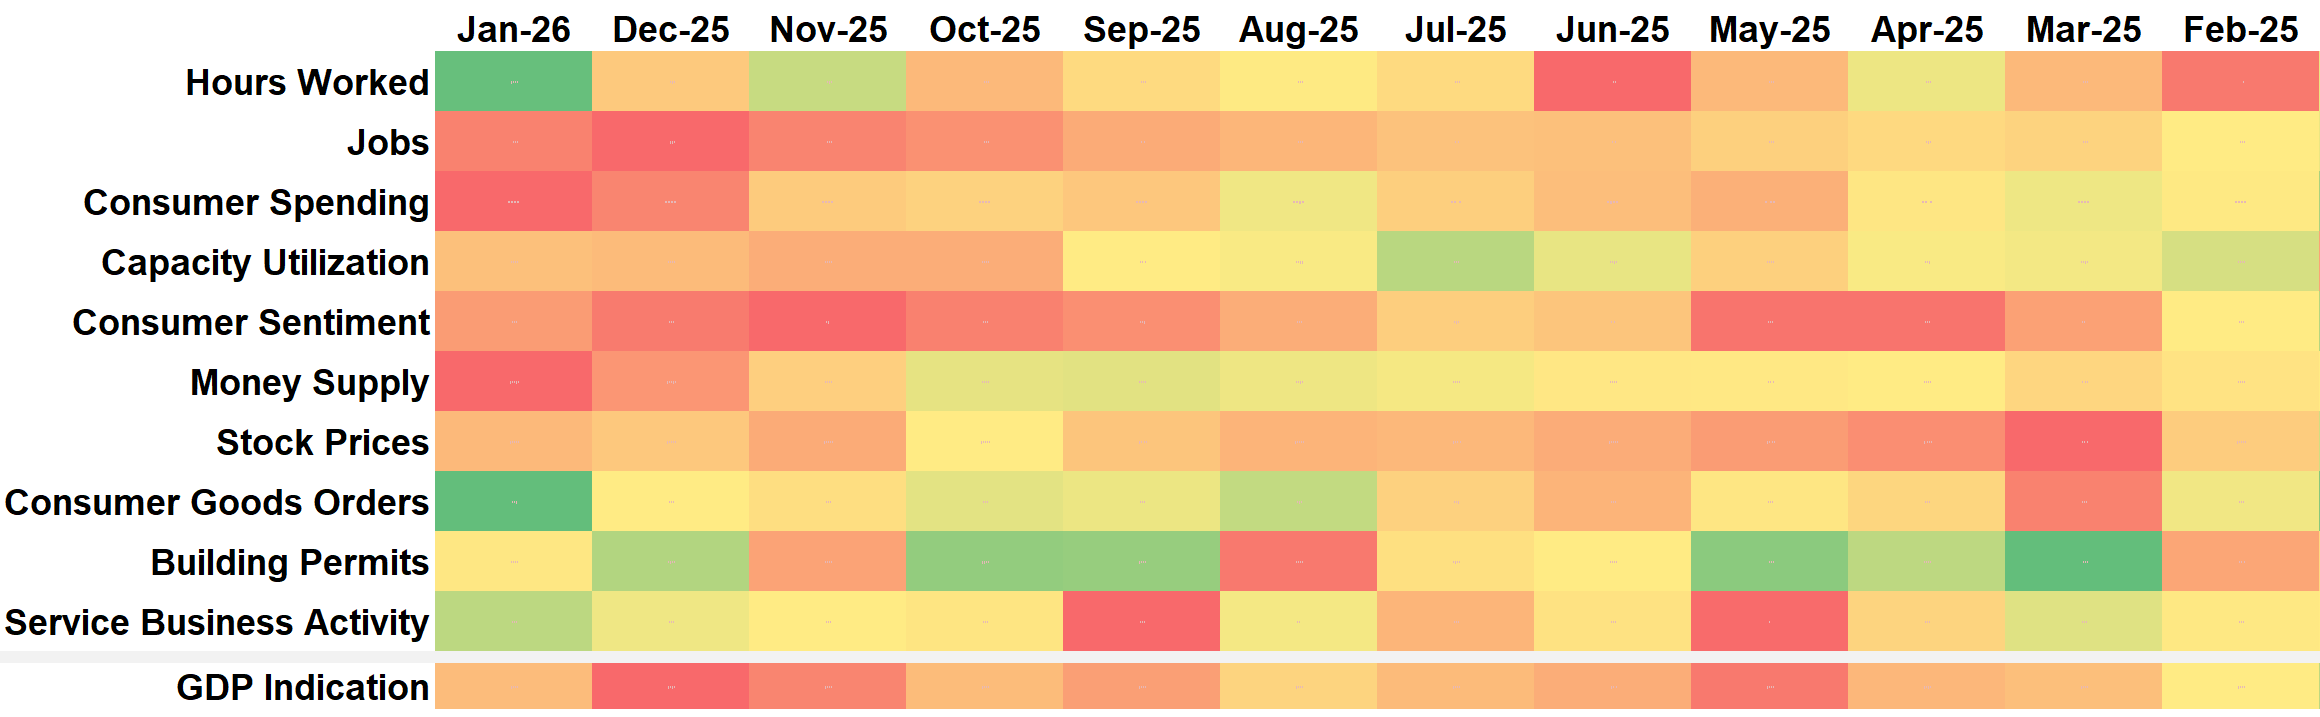
That said, statistically there was just enough improvement for the model to BARELY move off the "bearish" indication. If we do not see a marked improvement in some of the indicators, this could be a one month anomaly. As our signal chart illustrates below, there are times where the model will fluctuate as the economy transitions.
From an investment perspective, Dynamic Aggressive Allocator added 20% small cap exposure and Dynamic Income and Cornerstone Income added a 20% position in dividend growth funds.
AI, Hyperscalers, Data Centers, Software, and Private Credit
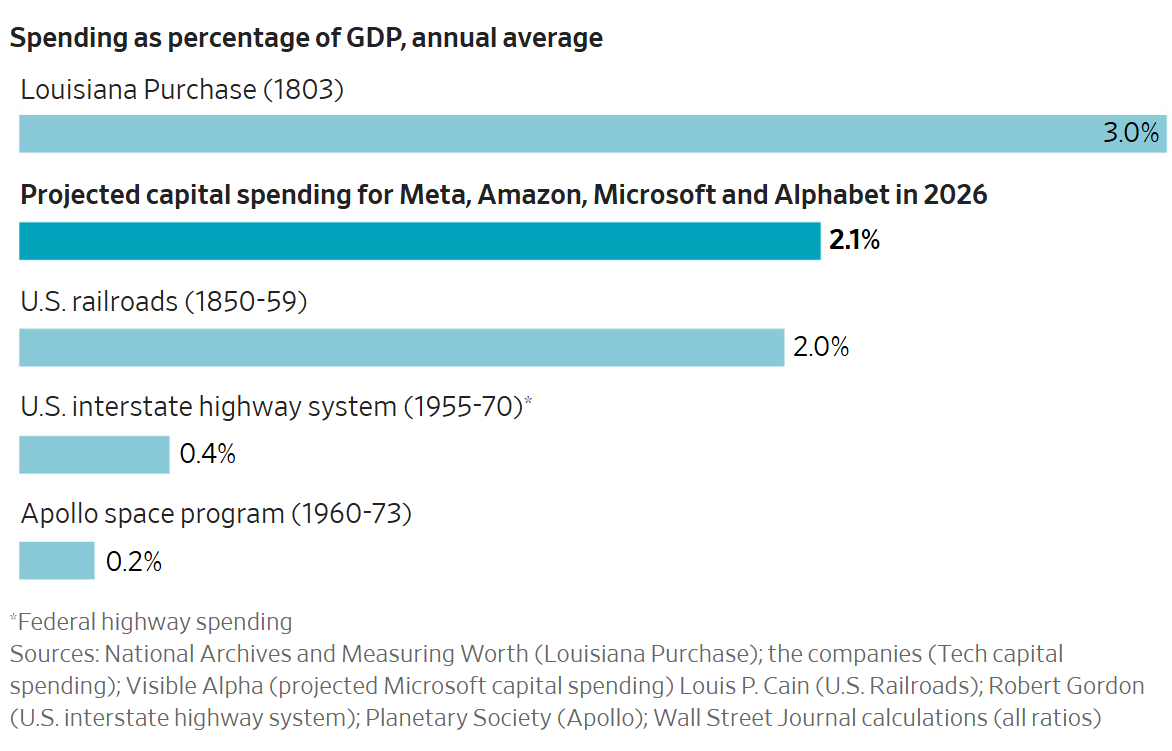
For the better part of 2 years, it seems we've been talking non-stop about "AI". It clearly has impacted many different areas. As I noted above, just over half of our GDP growth in the 4th quarter came from technology spending/investment. A few weeks back I included a chart showing how the projected 2026 spending from the "hyperscalers" as a percentage of GDP will exceed every major investment in our history other than the Louisiana Purchase.
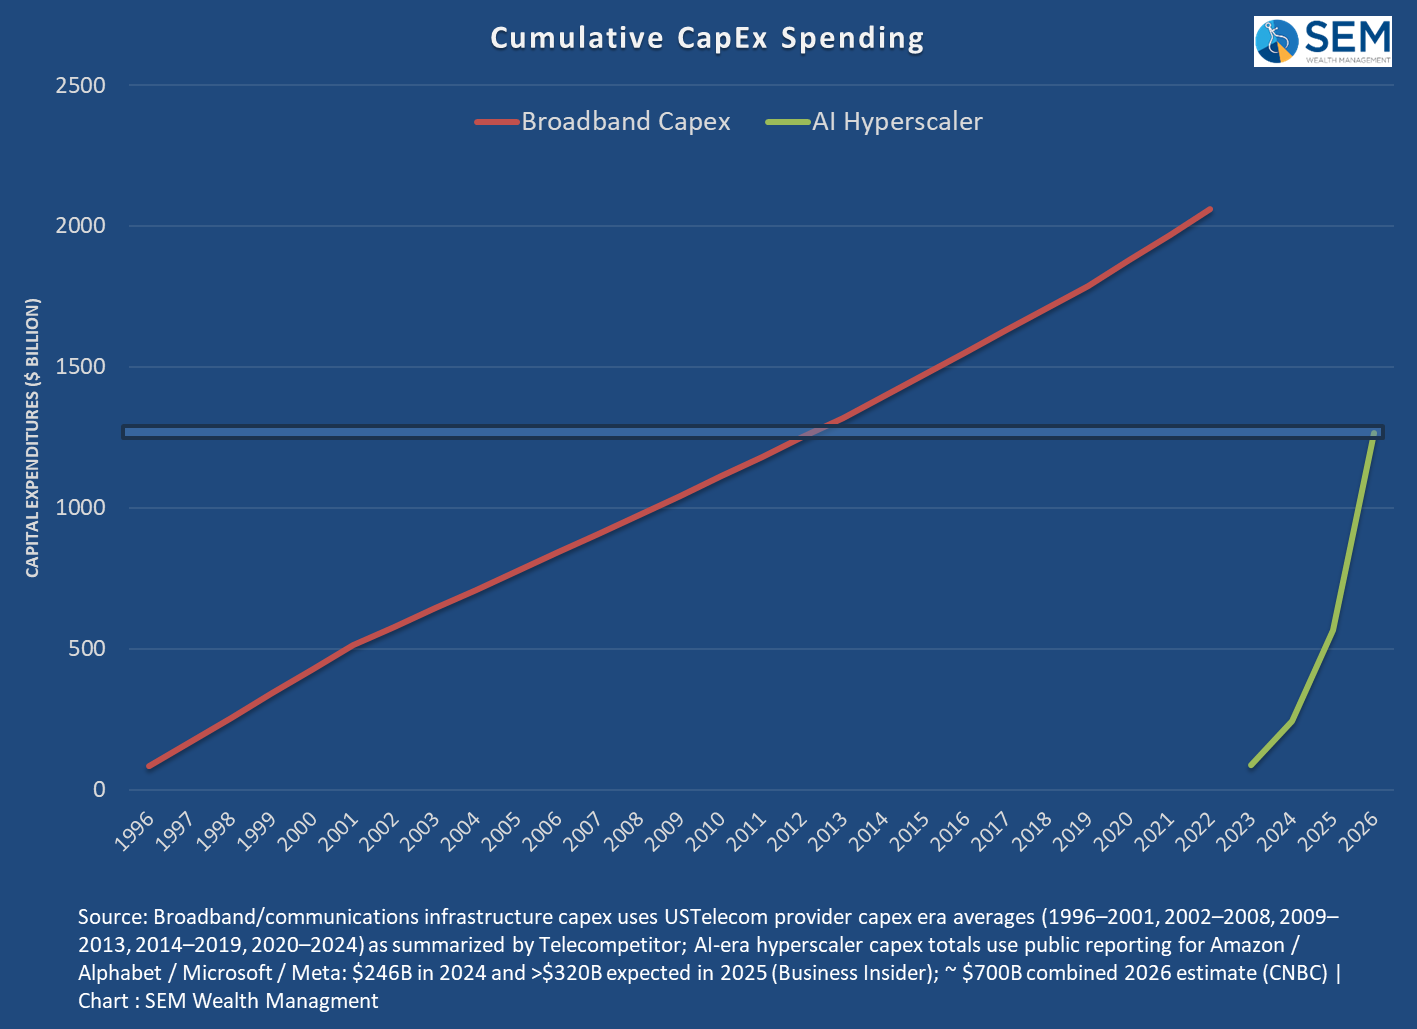
I also included my own chart comparing the "broadband" buildout from the mid-1990s to the AI Hyperscaler spending. The point being none of us have experienced spending anywhere near what was spent the last few years.
During the second part of last year I started expressing the concerns my accounting brain was having with the financing of this buildout. I didn't like the "circular" deal structure, the way stocks were moving after announcing any sort of deal with Open AI, and the "creative" financing deals being used for the buildout.
At the same time, we've seen pension funds, insurance companies, and others flooding into "alternative" assets to enhance their returns. The "volatility" of the returns seems much more calm than liquid, transparent investments in stocks, bonds, ETFs, and mutual funds simply because these "alternatives" do not price every day. Each quarter they guestimate the value of their assets and then report the "returns" for their funds. The reason SEM never recommends these types of vehicles is our focus on data and our experience in the industry. There is very little data on these vehicles and our experience tells us things look "great" until they don't.
We've seen a few deals go bad over the past 3 months. The primary issuer of these deals happens to be publicly traded – Blue Owl. As Blue Owl has written down the value of the assets in some of their vehicles by as much as 25%, restricted redemptions, and forced conversion to a "closed end fund" at a steep discount, their stock has lost over half of its value. This has also brought down other alternative managers such as Apollo, Ares, and Blackstone who have not only been involved in the private credit space, but also the private equity boom we've witnessed the past 5 years.
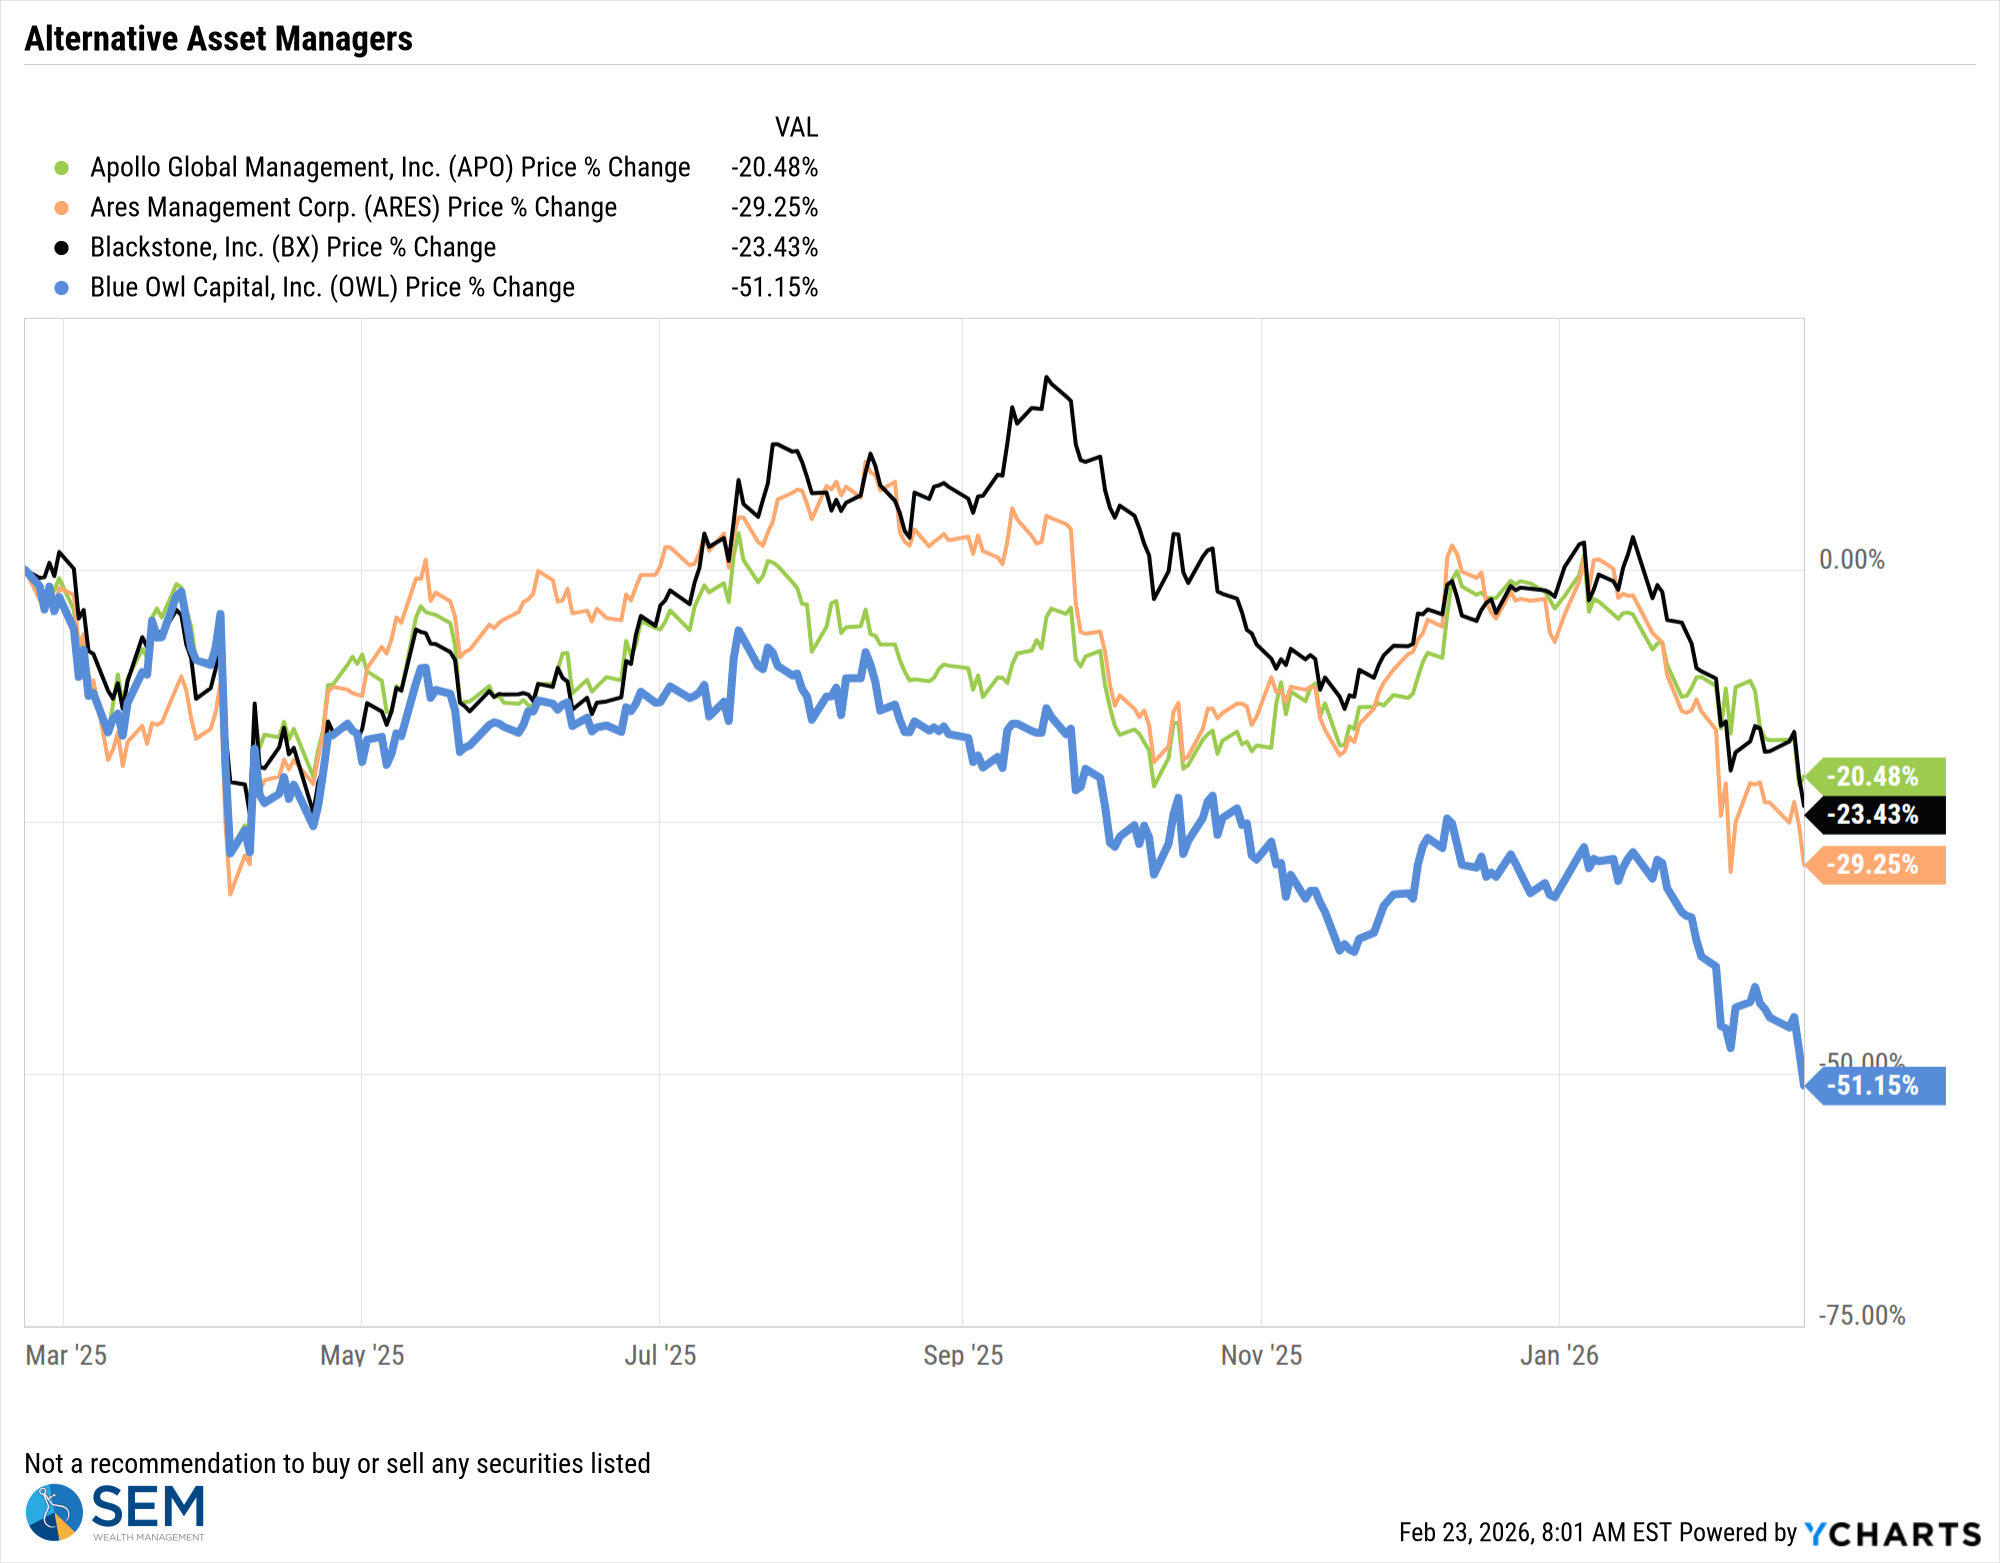
Specifically last week, Blue Owl thought they could mask the fact they were restricting withdrawals from their funds by announcing a sale of some of their assets to "institutional investors" at a "97%" net asset value ($0.97 for every dollar on their books.) Instead investors read the sale as a sign redemptions were accelerating and too high to be covered by normal operations. The sale even caught the attention of the Treasury Secretary Scott Bessent because one of the buyers of the loans was an insurance company. I could not find which insurance company was a buyer in my initial digging. Most likely we will learn this when quarterly reports are filed.
The reason Mr. Bessent is concerned about an insurance company being involved in this asset purchase is because it takes the risk from private investors and puts it into the regulated financial system. There are several insurance companies (and pension funds) which have on-going liquidity needs that have been aggressive in this space. This is an on-going risk that could become a much bigger issue if the Treasury Department starts looking deeper into what the insurance companies are invested in.
As always, we will continue following this and will report any additional information that we feel our advisors and investors should be aware of.
Toby's Take
A look at our intern's top WSJ stories from last week
2/17/2026 - Italian PM Giorgia Meloni’s Mission: Persuading Trump and Europe to Be Friends - WSJ
Italian Prime Minister Giorgia Meloni is trying to be the bridge keeping the United States and Europe friendly. Europe is very unhappy with President Trump's threats to seize Greenland and the trade threats potentially leading to further trade disputes. So, Italy is trying to mend that and keep them together. If Italy isn't successful in that, it could hurt our economy and therefore stock values of certain companies relying on supplies from them.
2/18/2026 - Big Tech Is Buying Up America’s Land—and Home Builders Can’t Compete - WSJ
Housing is a growing problem in the United States causing the prices to go up too high for owners to even sell them. Could AI be one of the big contributors to that problem? In Virginia there were multiple housing developers that sold giant chunks of land to tech giants like Microsoft and Google. Stanley Martin had bought some land for $50 million and sold it for $700 million to Amazon.com. Yes, AI is the backbone of our economy right now, but until another solution can be figured out for these giant datacenters, we need to focus on our citizens getting homes.
2/19/2026 - U.S. Gathers the Most Air Power in the Mideast Since the 2003 Iraq Invasion - WSJ
The United States has been moving lots of air fire power to Iran potentially getting ready for a large attack. There are lots of different attack plans that have been brought to President Trump should he decide that is necessary. He has said that he would prefer for this to end with a diplomatic solution. All of this to say, there is lots of talks surrounding American weapons potentially boosting the Patriot Portfolio.
2/20/2026 - Epstein Files Give Some Prosecutors Plenty to Investigate - WSJ
The Justice Department has said many times that there is nothing in the files that required further investigation. However, multiple European countries have opened their own investigations for different individuals who were involved. Such as, the U.K. investigating Peter Mandelson, the former ambassador to the U.S. Could the Trump appointees in charge of the Justice Department be holding back on their investigations. Depending on what continues to come out leaders of different companies could be involved causing big changes in stock values.
Market Charts
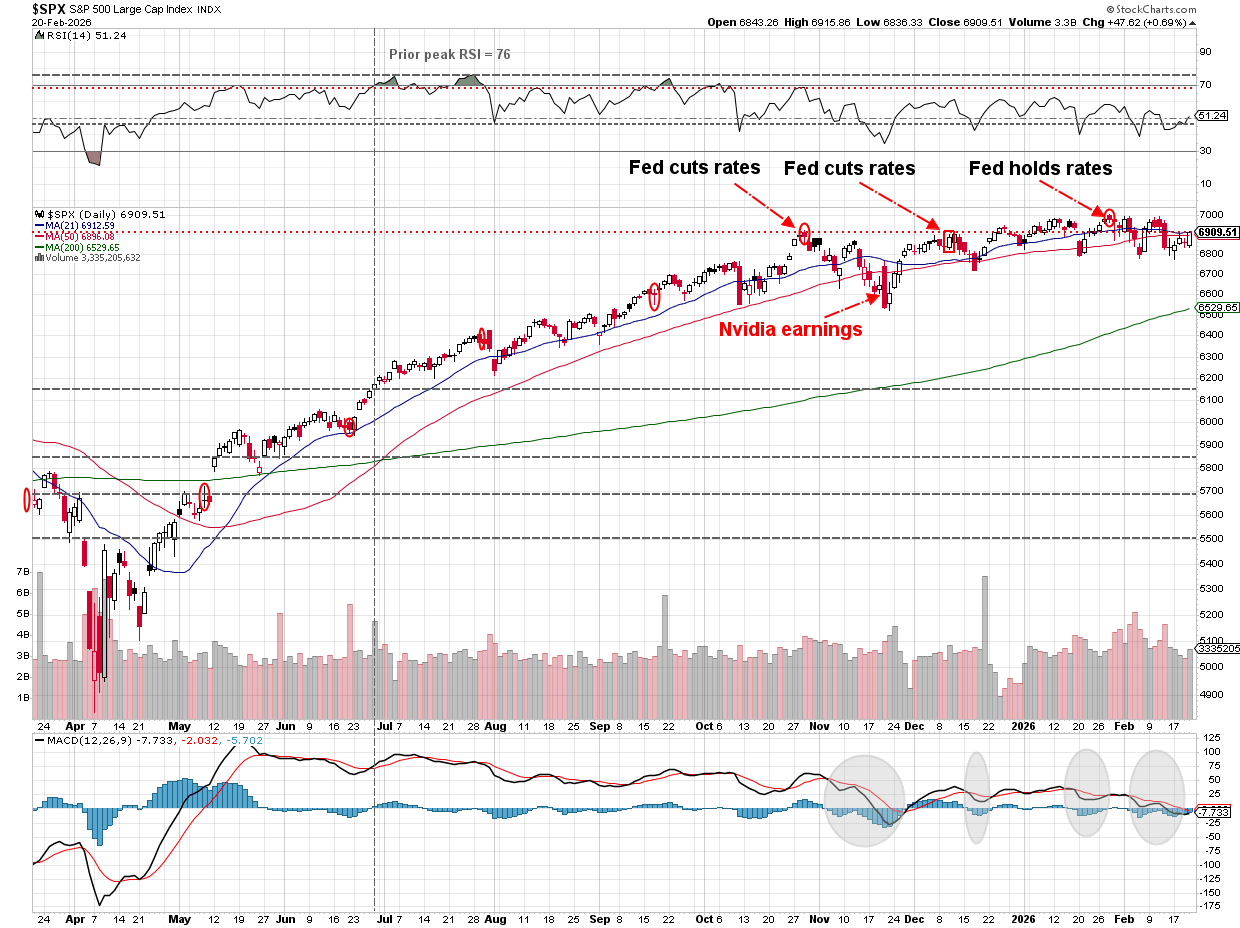
This short-term chart shows the roller coaster we've been on the past 4-5 weeks.
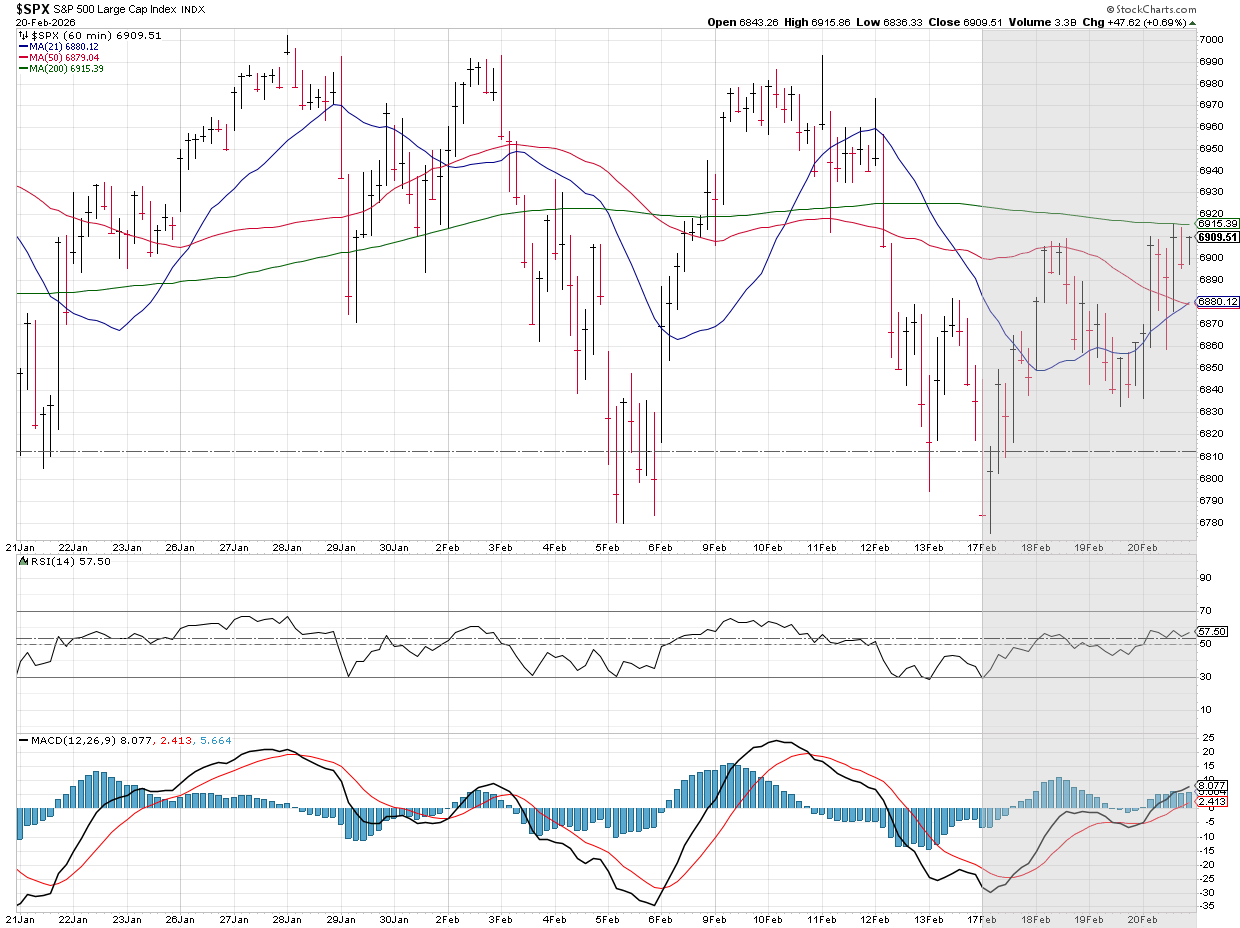
From a bigger picture stand-point, the S&P 500 has been around 6900 since the Fed cut rates back in October.
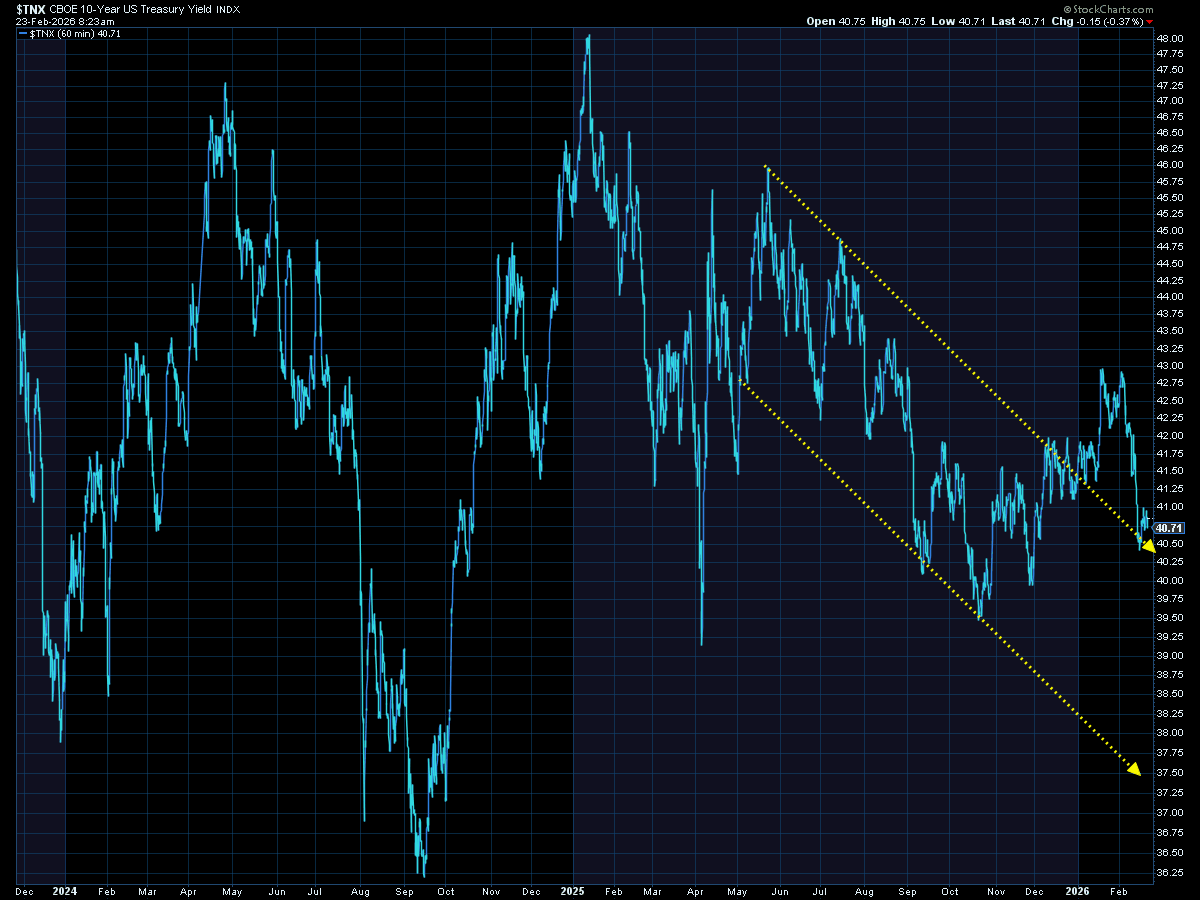
Bonds remain the area we are focused on. Shorter-term rates picked up a bit last week following the Fed's minutes and the PCE inflation data on Friday.
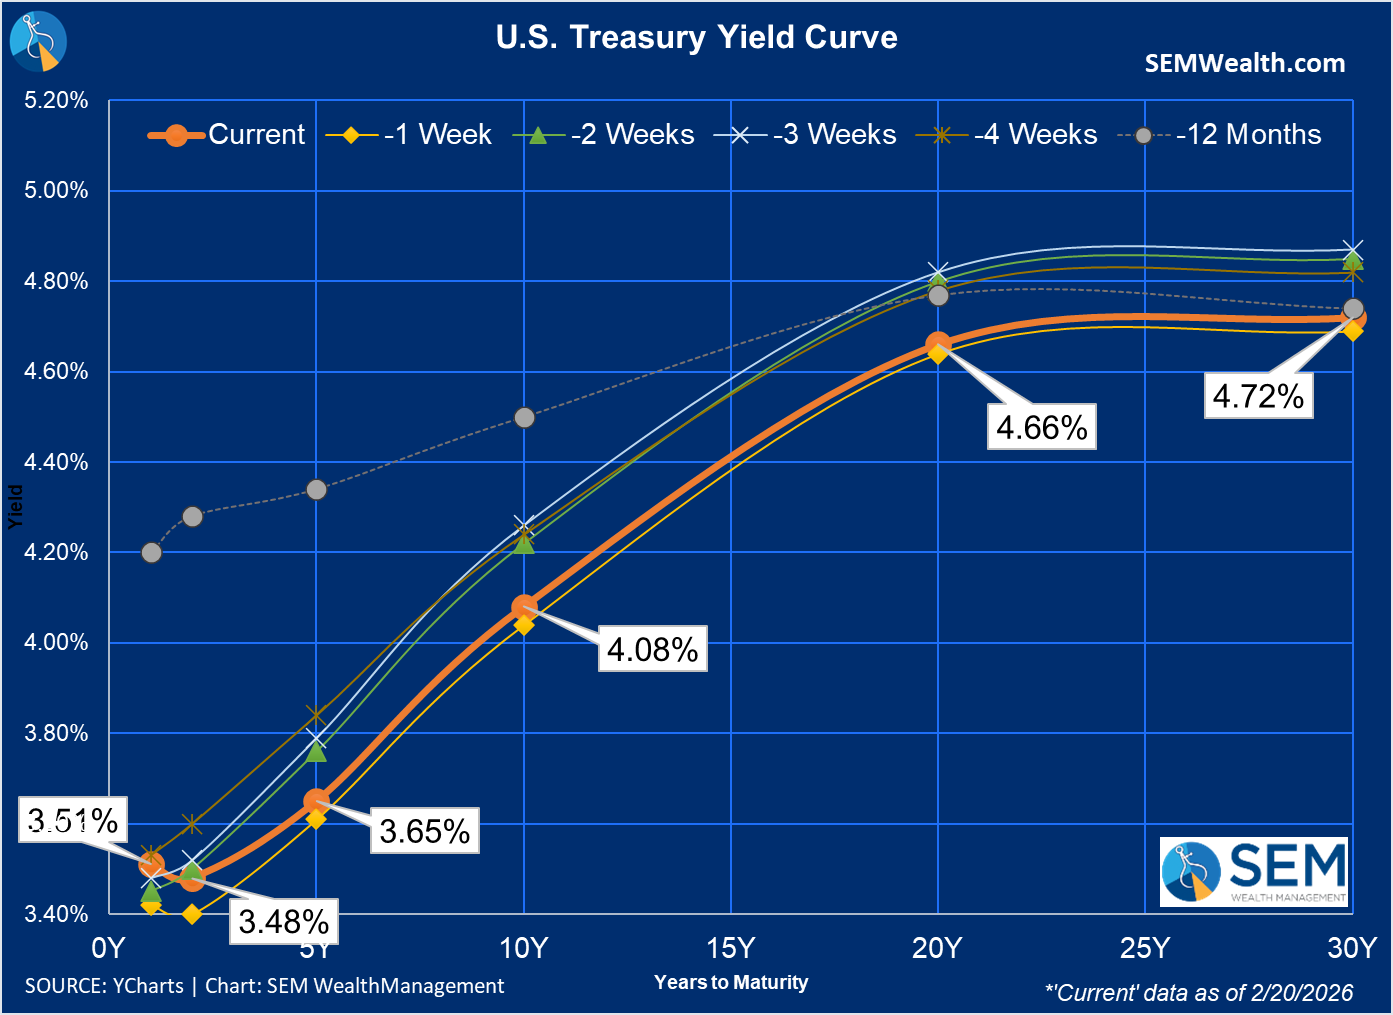
Long-term rates also rose a bit as they were unable to break back below the 4% level many consider to be important especially for the housing market (remember: the free market (mostly) controls long-term rates and mortgages are (mostly) tied to the 10-year Treasury.)
SEM Market Positioning
| Model Style | Current Stance | Notes |
|---|---|---|
| Tactical | 100% high yield | High-yield spreads holding, but trend is slowing-watching closely |
| Dynamic | Neutral | Economic model turned neutral Feb 15 '26' – benchmark weightings |
| Strategic | Fully invested | Trend overlay shaved 10 % equity in April -- added back early July |
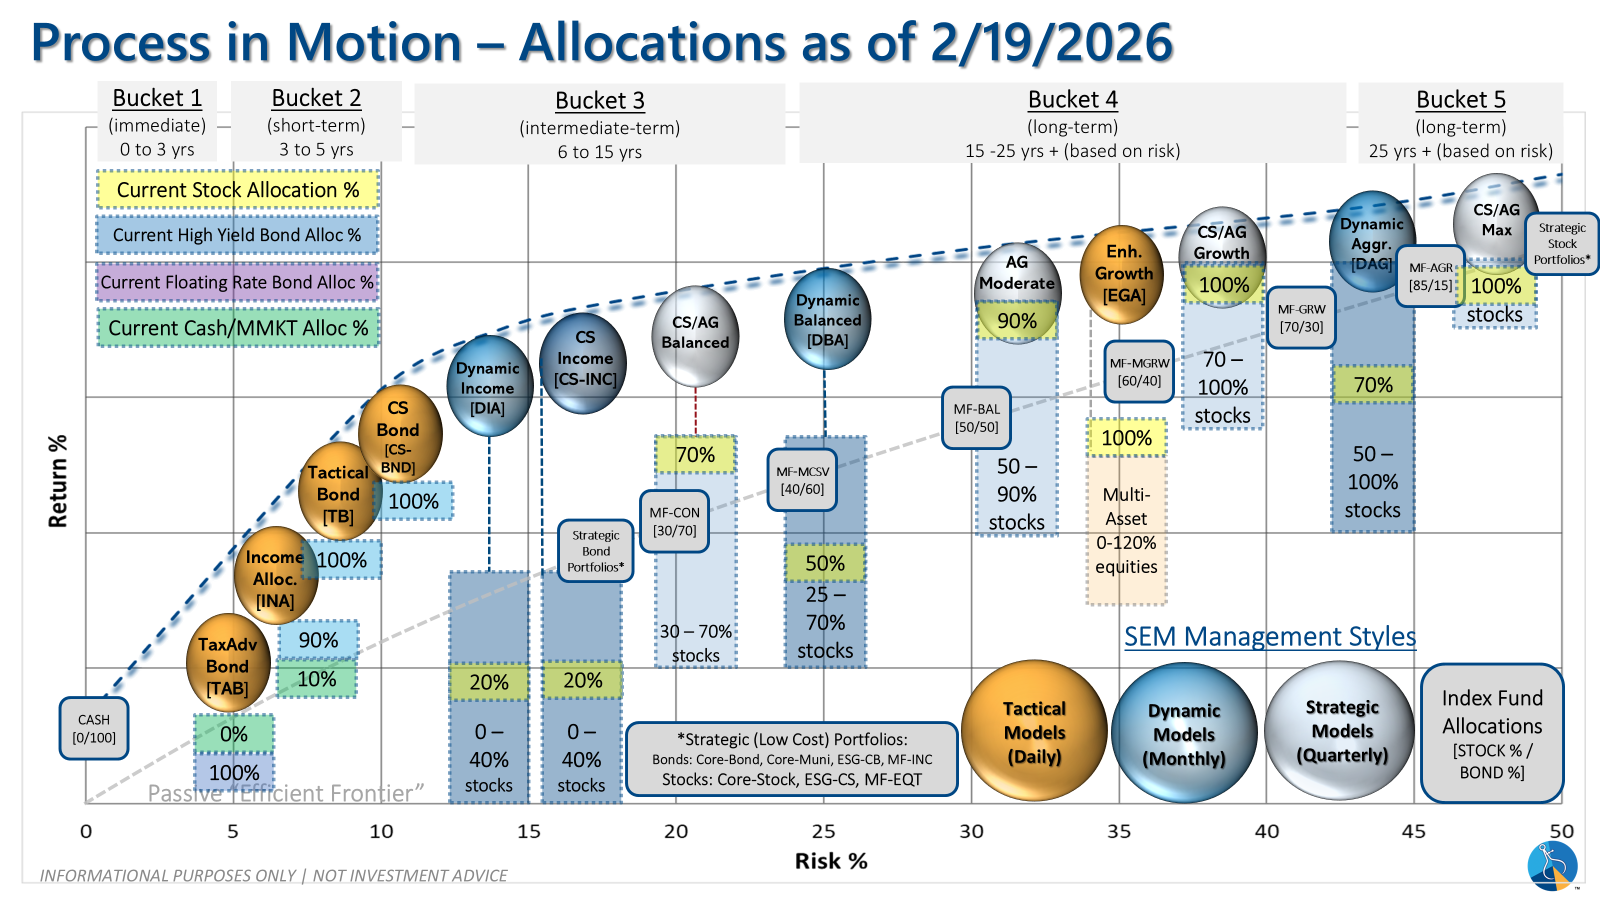
SEM deploys 3 distinct approaches – Tactical, Dynamic, and Strategic. These systems have been described as 'daily, monthly, quarterly' given how often they may make adjustments. Here is where they each stand.
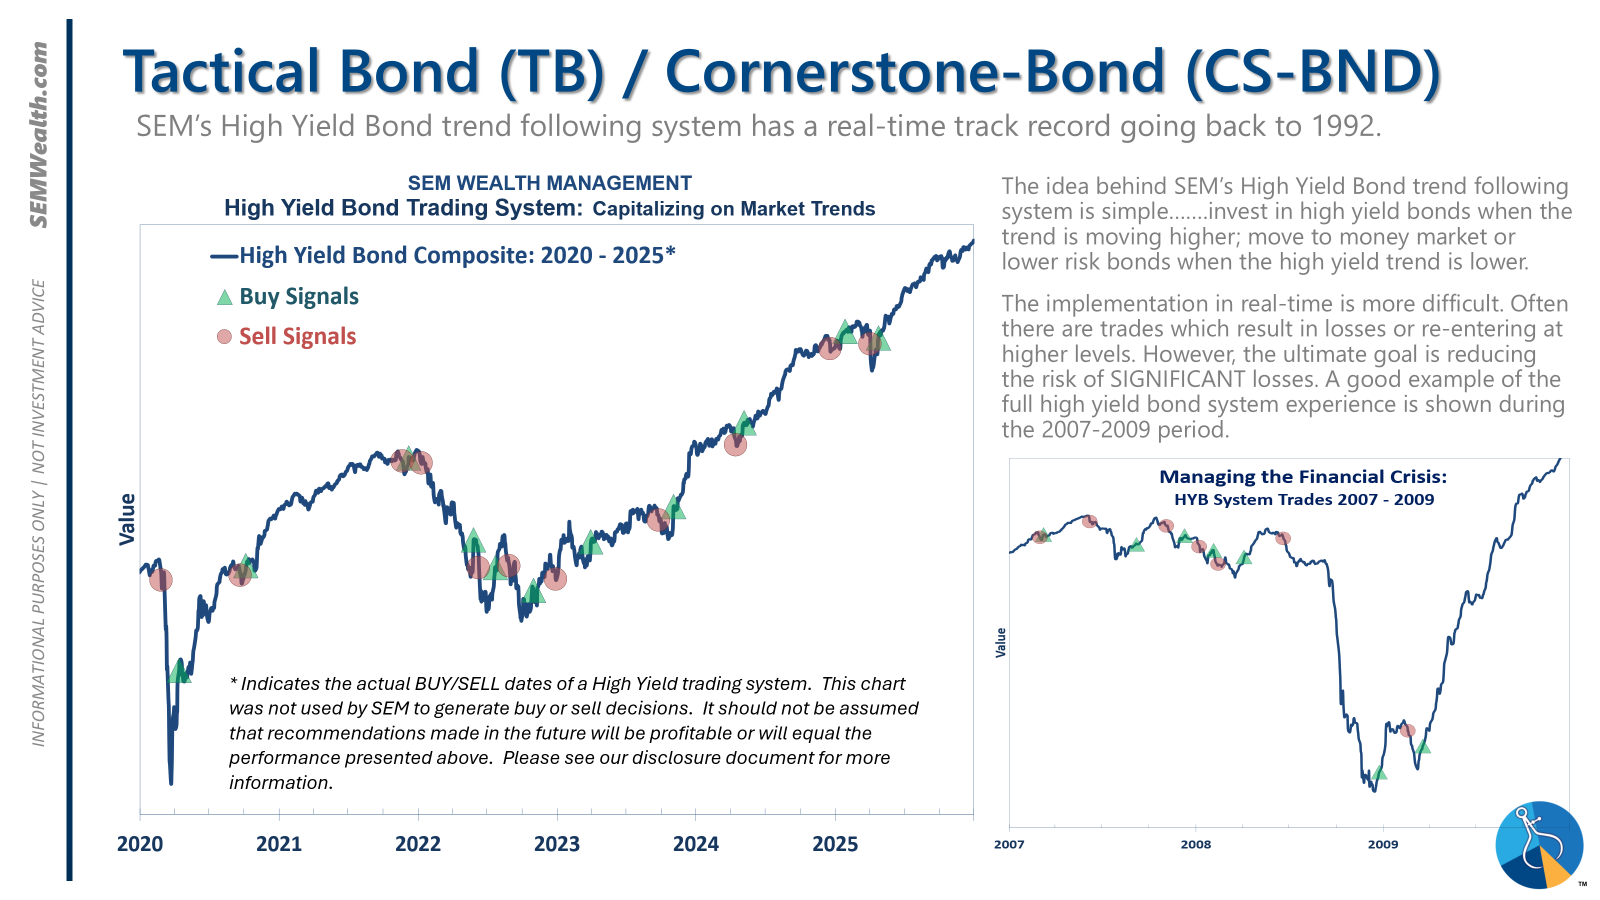
Tactical (daily): The high yield system has been invested since 4/23/25 after a short time out of the market following the sell signal on 4/3/25.
Dynamic (monthly): The economic model went 'bearish' in June 2025 after being 'neutral' for 11 months. This means eliminating risky assets – sell the 20% dividend stocks in Dynamic Income and the 20% small cap stocks in Dynamic Aggressive Growth. The interest rate model is 'bullish' meaning higher duration (Treasury Bond) investments for the bulk of the bonds.
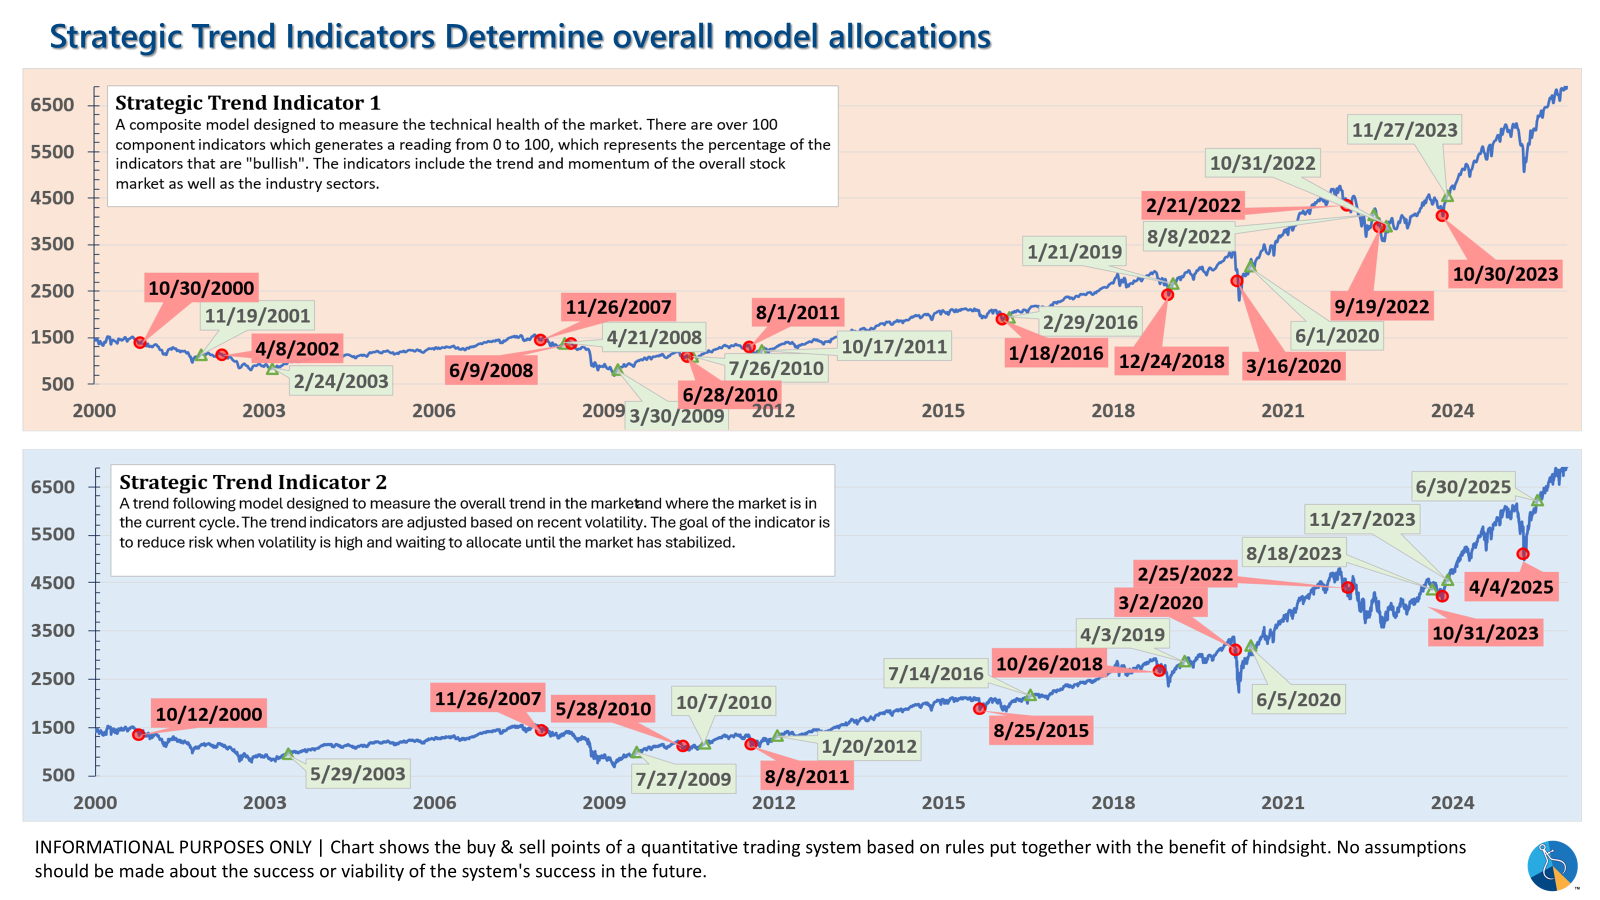
Strategic (quarterly)*: One Trend System sold on 4/4/2025; Re-entered on 6/30/2025
The core rotation is adjusted quarterly. This quarter we saw half of our international positions reduced (we sold developed markets and kept our emerging markets exposure). We also saw the remaining share of mid-cap reduced in favor of more small cap exposure. We remain with a "barbell" core portfolio – about half in large cap and half in small cap as the models expect the market to "broaden".
The * in quarterly is for the trend models. These models are watched daily but they trade infrequently based on readings of where each believe we are in the cycle. The trend systems can be susceptible to "whipsaws" as we saw with the recent sell and buy signals at the end of October and November. The goal of the systems is to miss major downturns in the market. Risks are high when the market has been stampeding higher as it has for most of 2023. This means sometimes selling too soon. As we saw with the recent trade, the systems can quickly reverse if they are wrong.
Overall, this is how our various models stack up based on the last allocation change:
Curious if your current investment allocation aligns with your overall objectives and risk tolerance? Take our risk questionnaire


