The S&P 500 and NASDAQ both closed at all-time highs on Friday. This adds to the already euphoric attitude most market participants had going into 2024. Nothing is on the horizon that can stop the stock train, or at least that's the current perception. For what it's worth, small cap stocks as measured by the Russell 2000 are still 15% below their all-time high and have been quite weak so far this year. That to me is enough to make me skeptical. If everything was so great, small caps would be the place to be.
The current perception is inflation is under control, we won't have a recession, and the Federal Reserve is going to soon be stimulating the economy by cutting interest rates multiple times. The market's perception is our reality over the short-term, but longer-term fundamentals matter.
Before we dig into that, I did want to include a chart from Bloomberg which really calls into question the perception about which political party is better for energy companies.
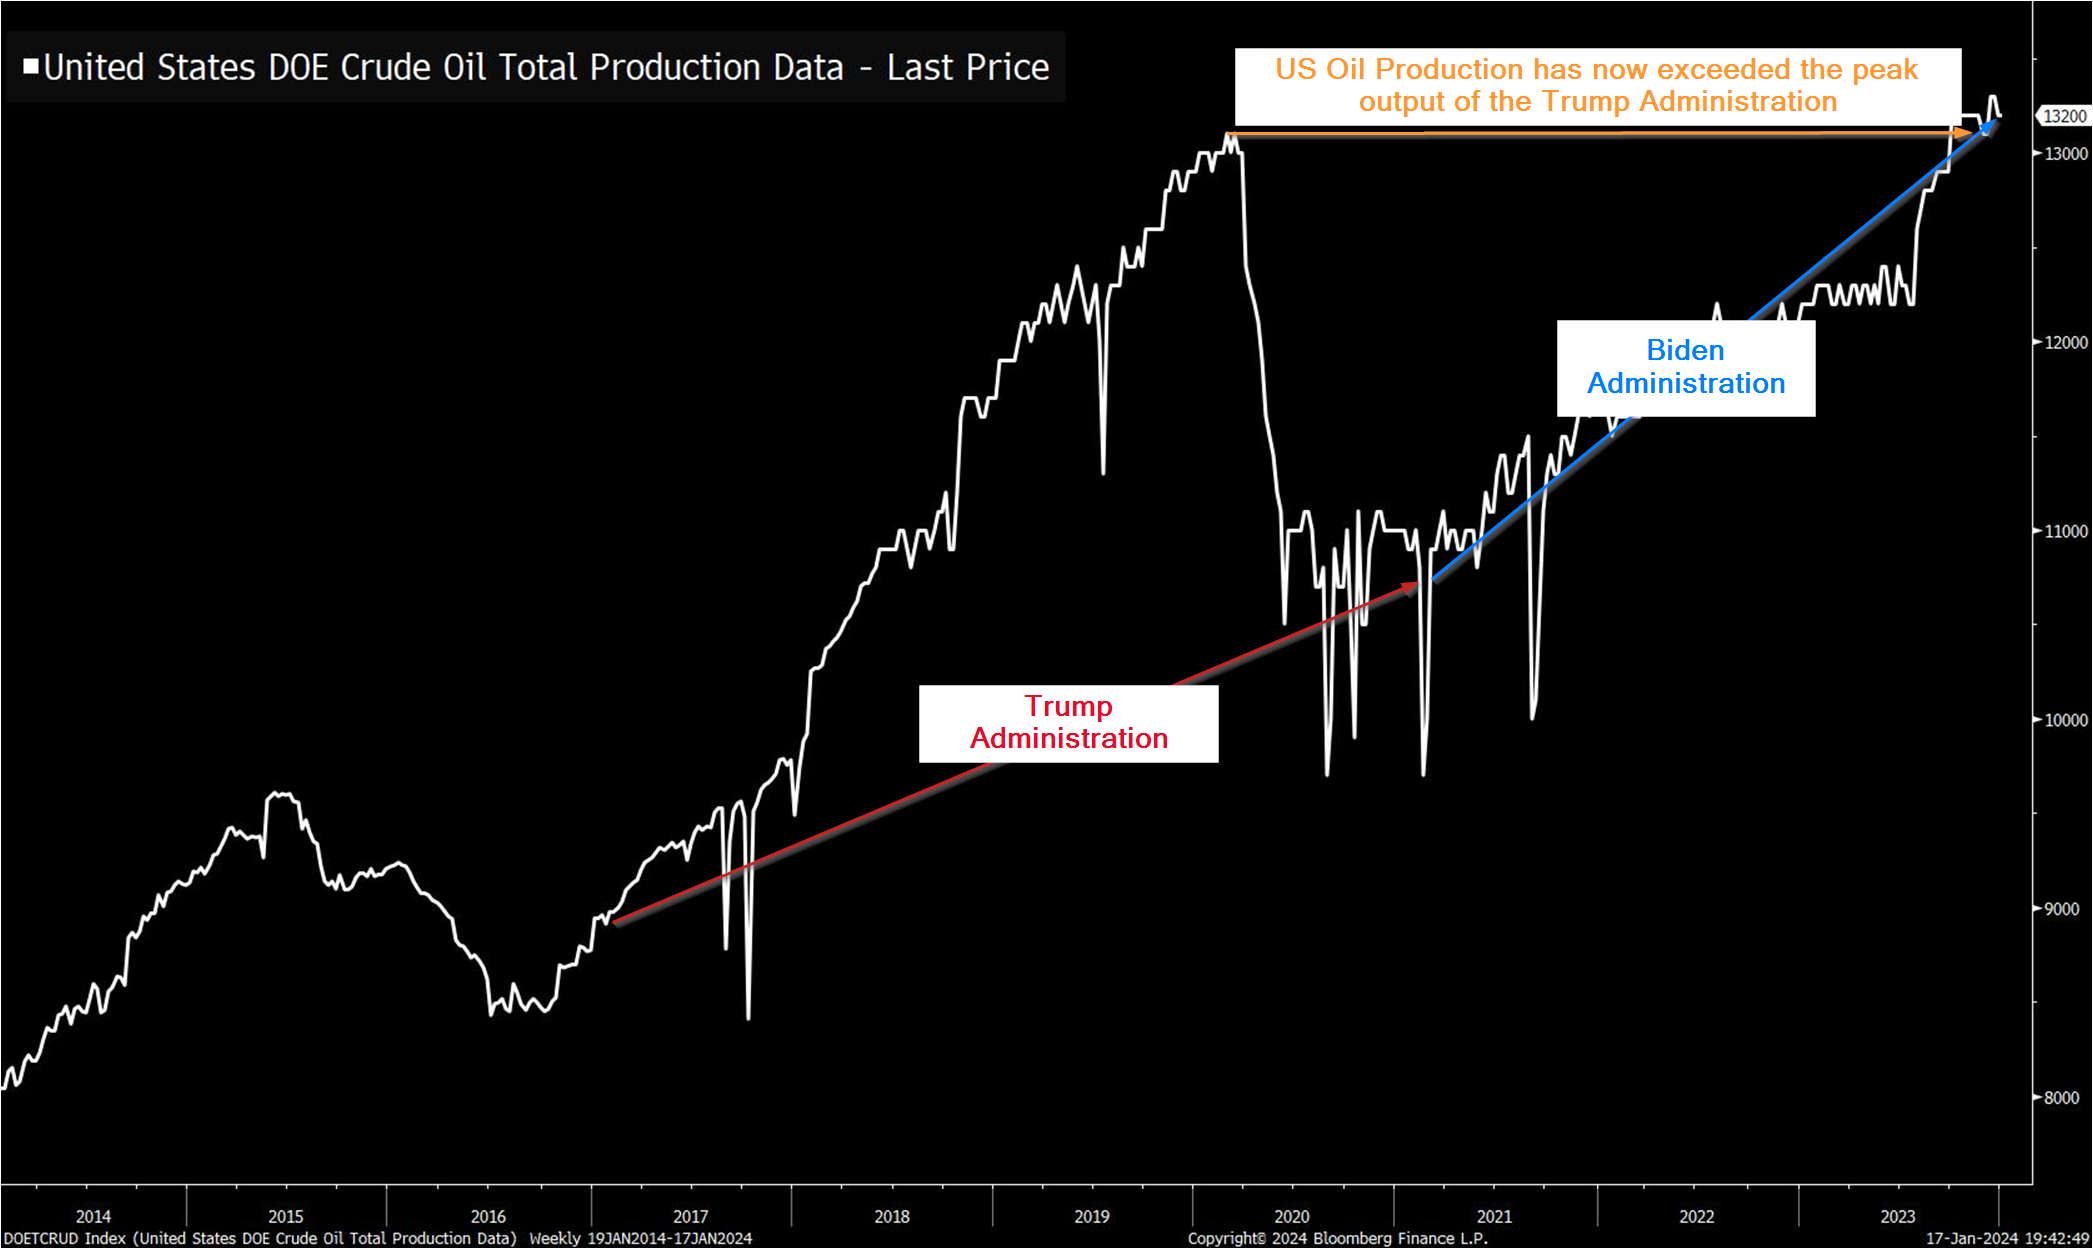
I don't think anybody would have predicted back in 2021 that the Biden Administration would supervise a record high in US oil production, exceeding the pre-COVID peak of the Trump Administration. Data has a funny way of contradicting political narratives as we discussed last week:

We'll have to unfortunately talk politics throughout the year. We'll do our best to let the data speak for itself and constantly remind everyone: 'Do not let your political opinions influence your investment decisions.'
Anyway, back to the current market. Last week I spoke to the Student Asset Management Fund at Liberty University as they kicked off their semester.

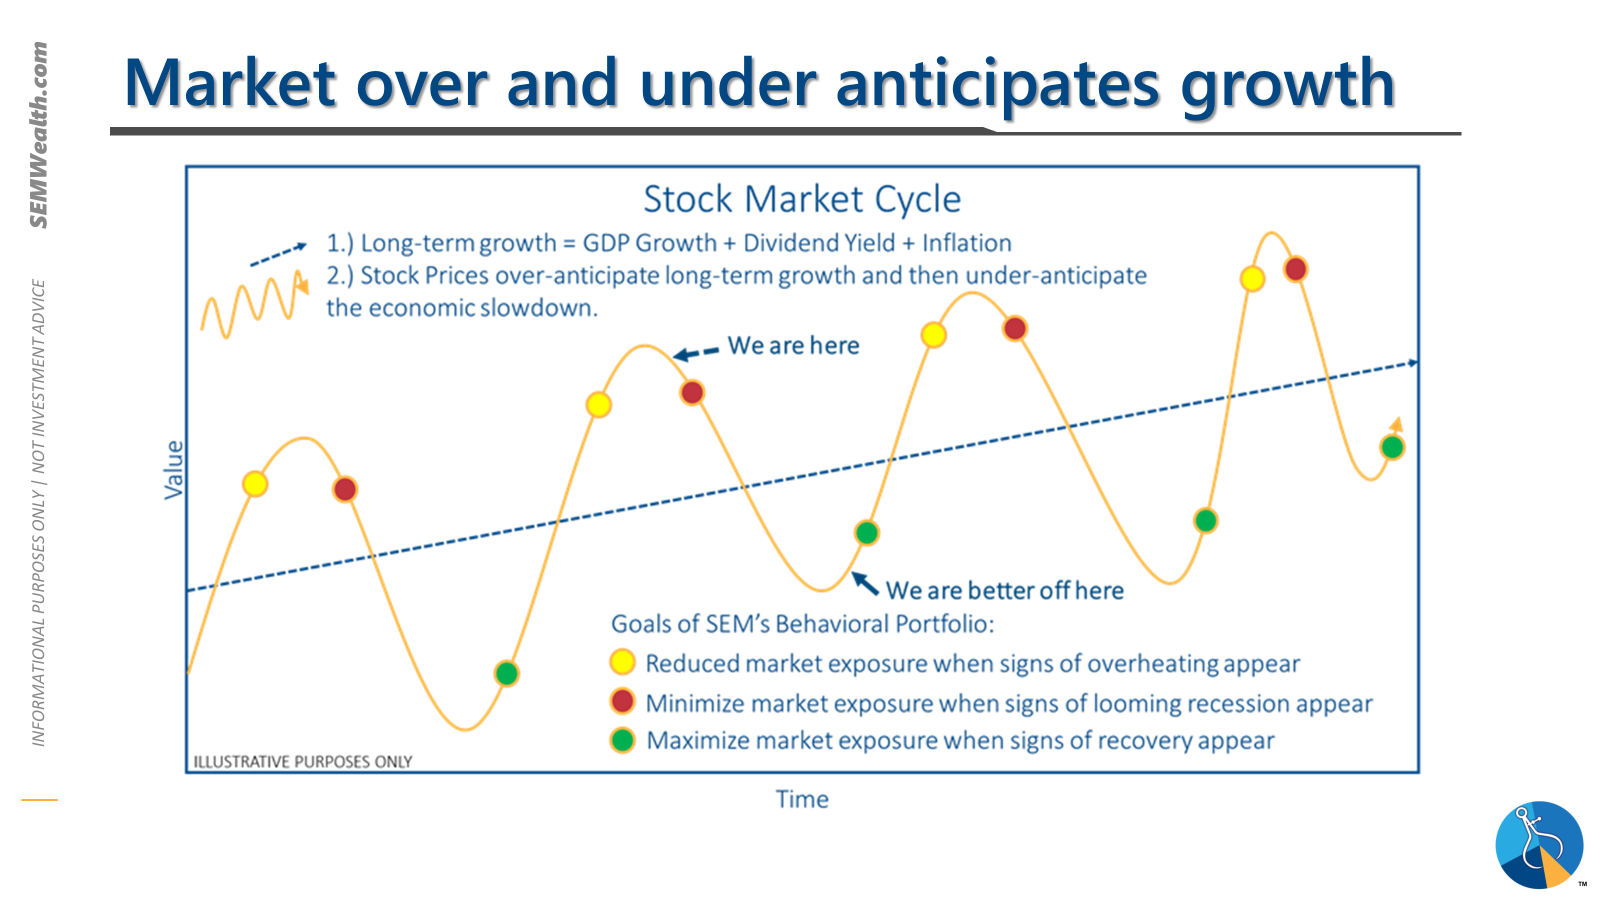
One of the key principles I discussed was market efficiency – does the market fully reflect all known information. My experience and research says eventually it does – great companies add significant value to their shareholders and bad companies take away value, but over the short-term the market is nowhere close to efficient. Human emotions take over and cause cycles of optimism and pessimism which cause big swings in market valuations.
I went through a bunch of different slides and illustrations. I closed with this summary slide:

Some of the charts I used to support this included:
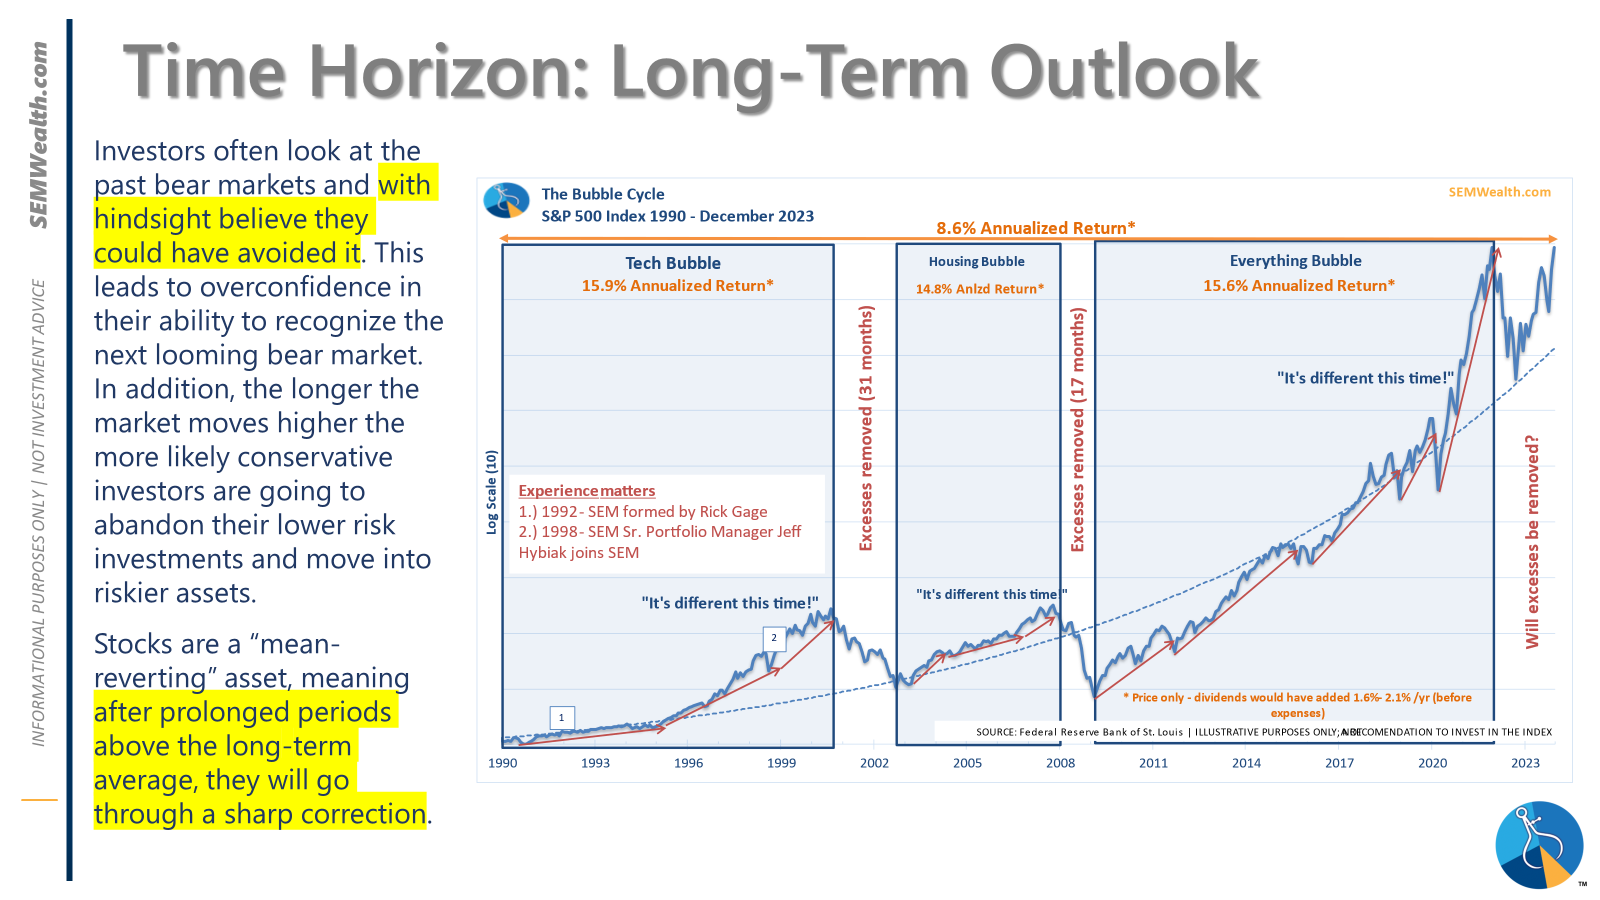
-A reminder of the cycles the market has gone through the past 33 years:
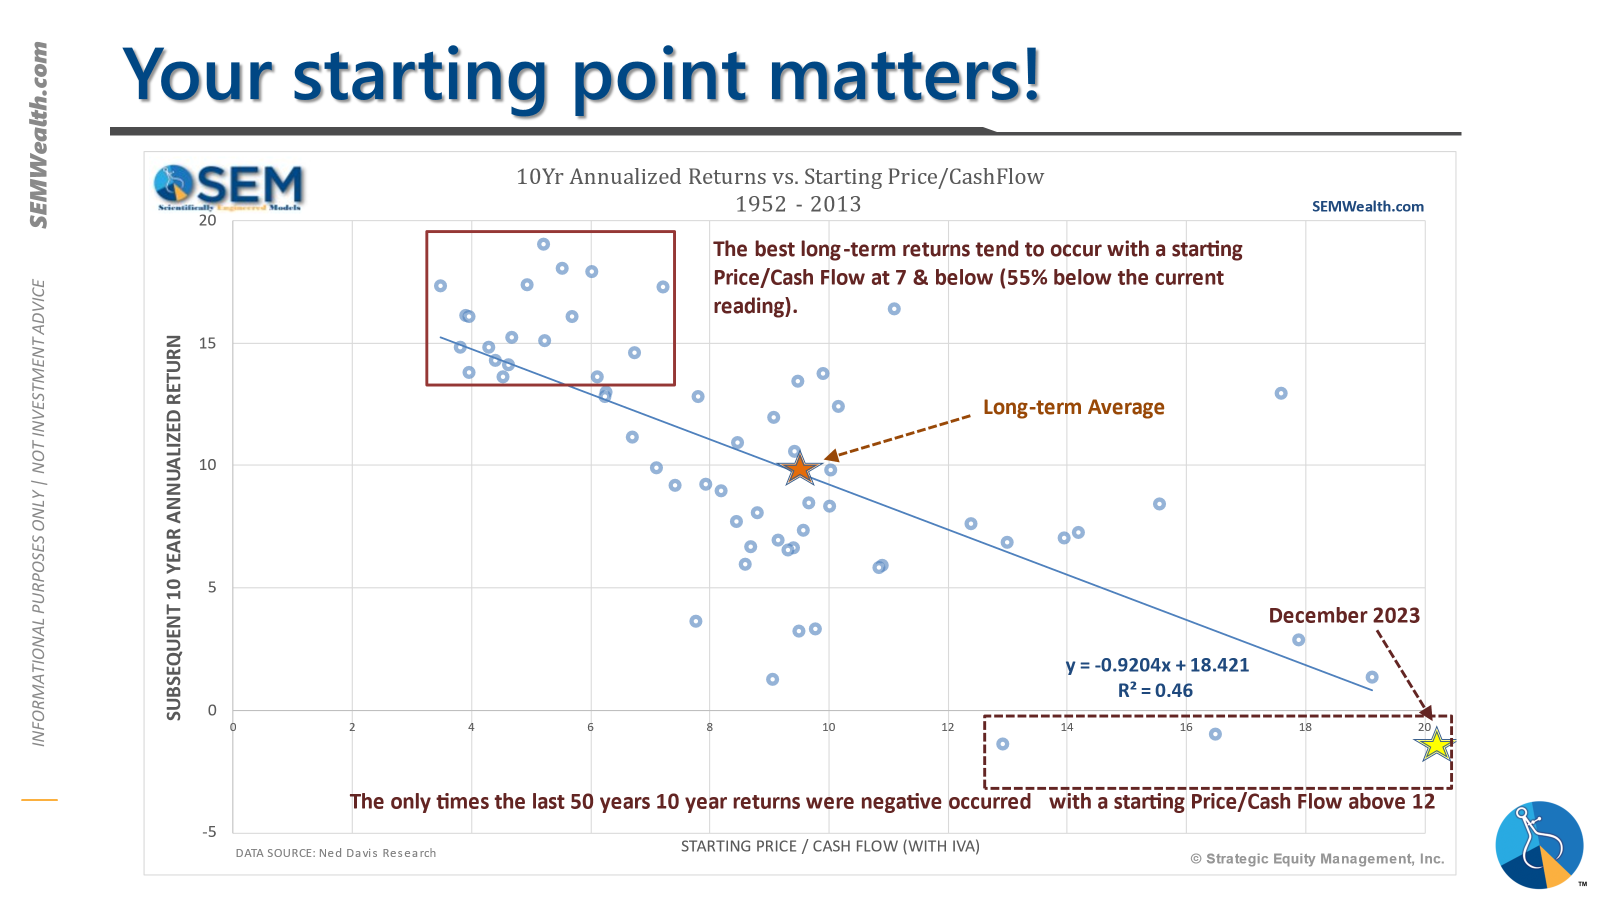
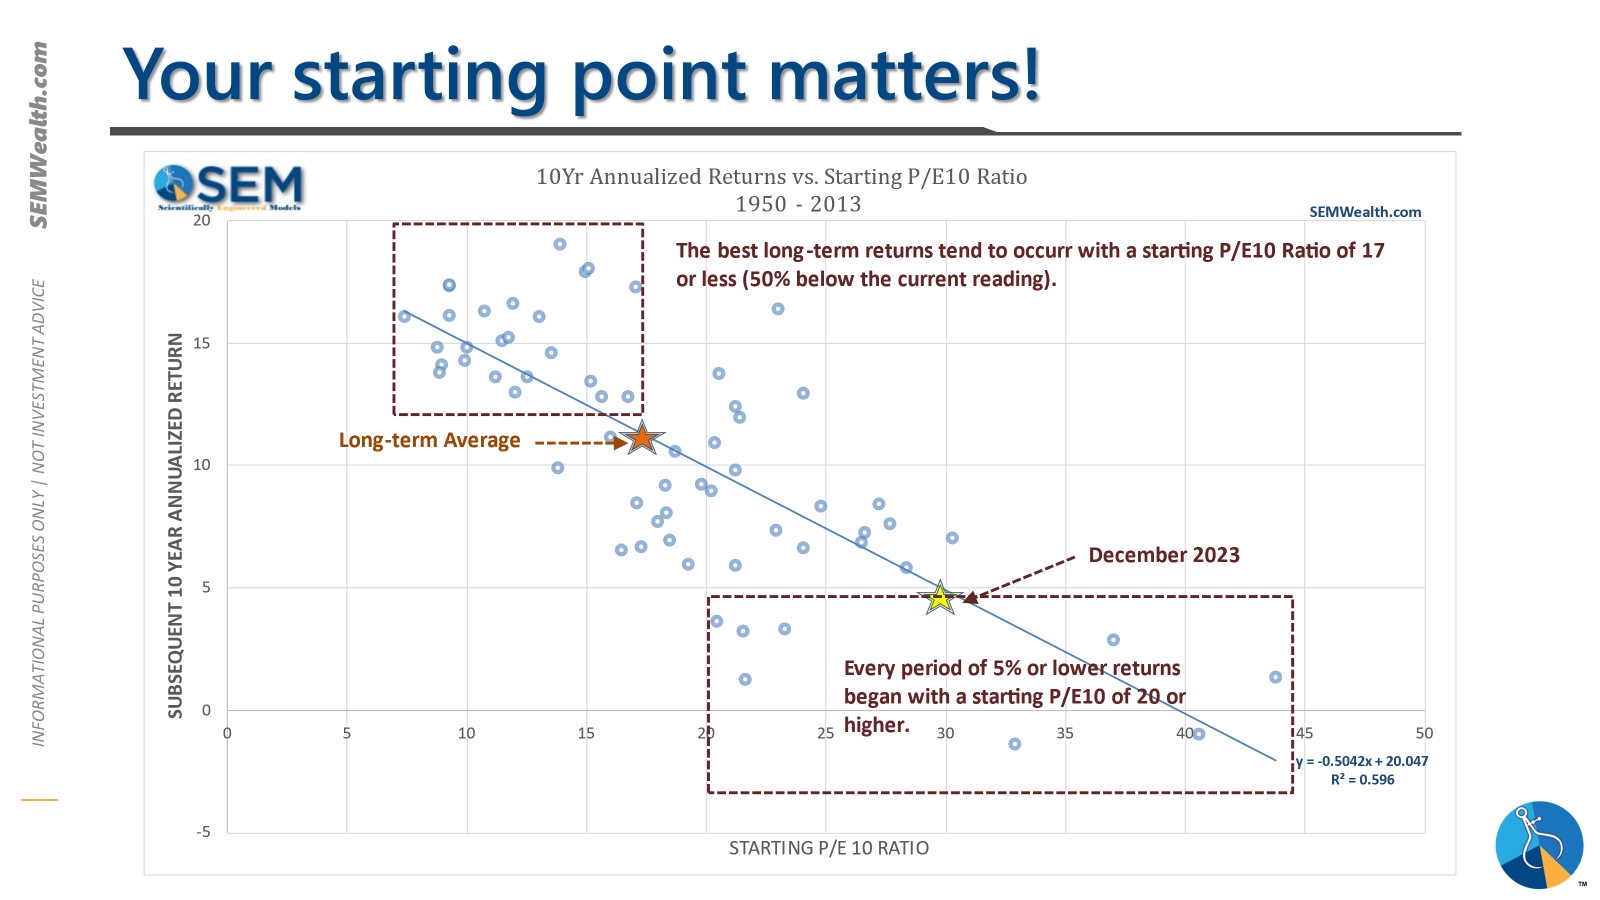
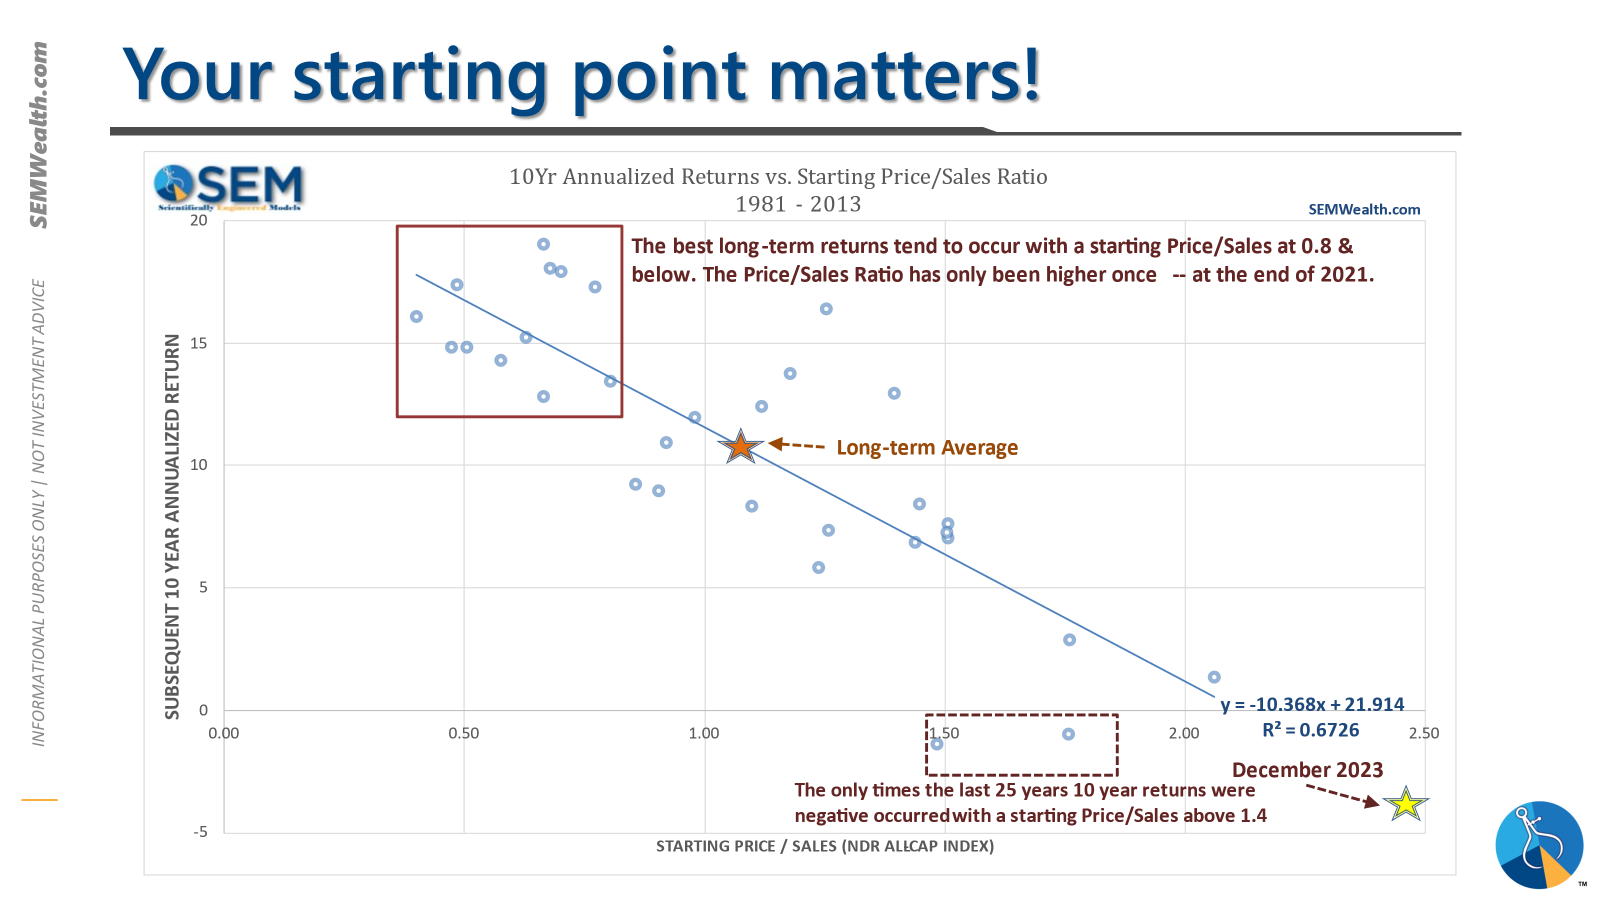
-A walk through the relationship between starting valuations and long-term returns.
-An illustration of the market cycle
-And finally, some sensitivity analysis of some various valuation formulas.
Note how very small changes in the input causes a huge swing in the 'intrinsic value' of the market (or a stock).
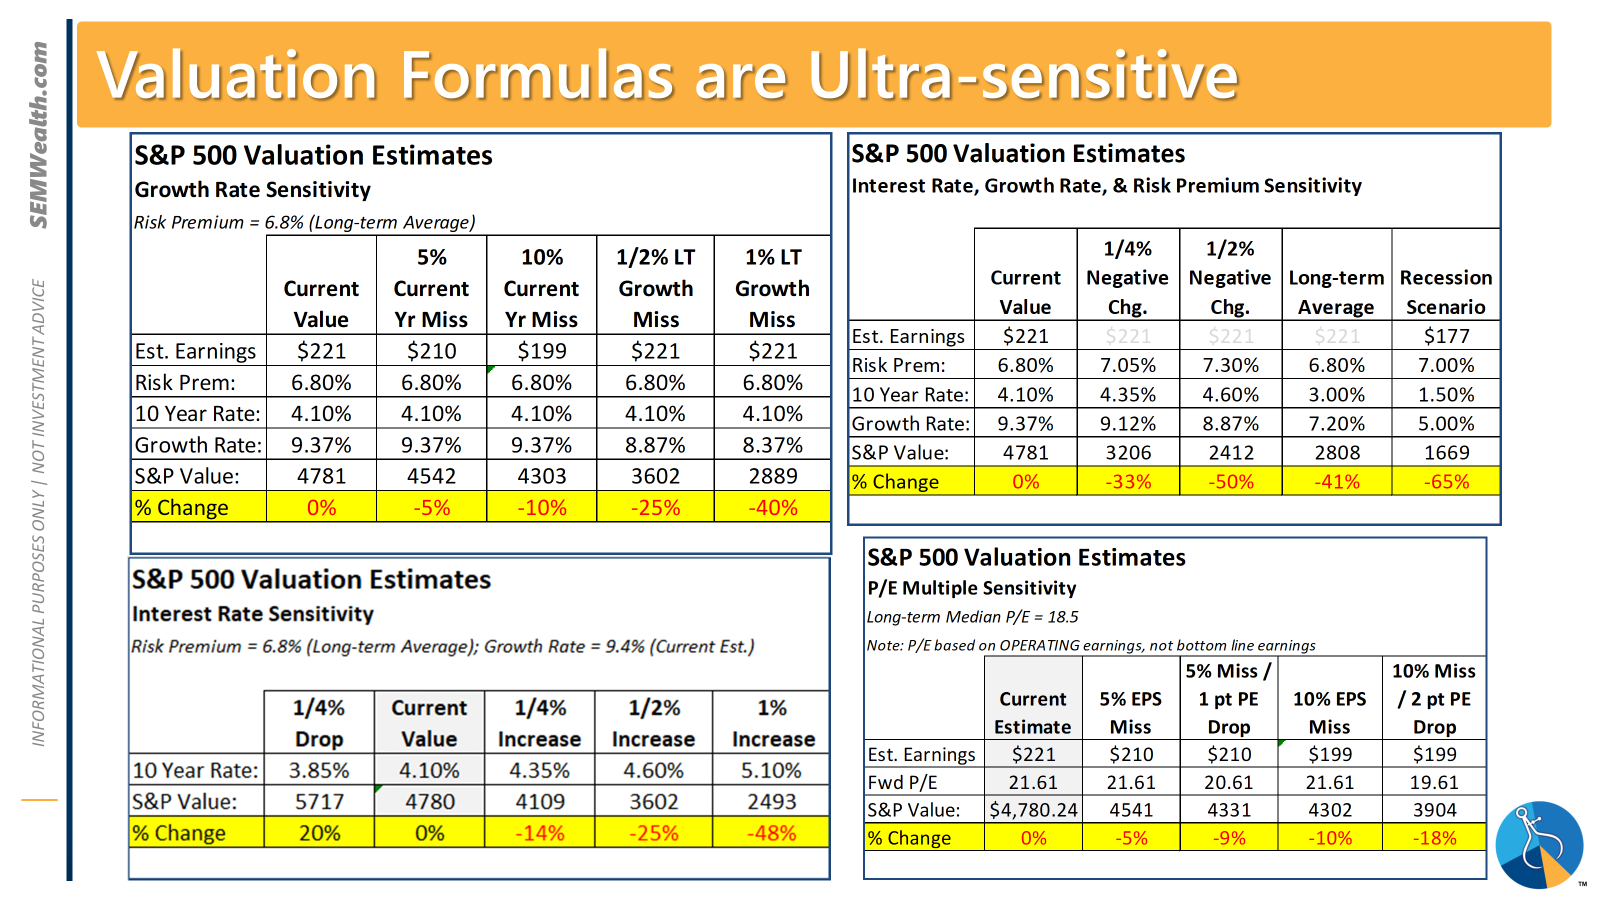
To summarize – the best long-term returns come when the stock market is undervalued. After long periods of time where the market has enjoyed above average returns we see a quick, sharp reversion to the mean. A small change in the perceived long-term growth rate or a small increase in interest rates could lead to a huge (25-48%) drop in stocks.
None of this means stocks are set to go down immediately or that you should sell everything. What it does mean is you have to be extremely careful chasing stocks at these levels. If you're a buy & hold investor you should lower your return expectations for the next 10 years (until we see a 25-48% drop in stocks). Patience will be rewarded and having a plan to navigate the inevitable correction and more importantly cash ready to deploy is extremely important.
Right now investors are buying high hoping to sell higher. That rarely works out.
Enjoy the all-time highs. Over the short-term all time highs tend to breed more all-time highs. This will continue until it doesn't.
Market Charts
The explosion to all-time highs came after a tough start to the year. There really wasn't much news to justify it. The clearance of the 2021 peak means there is nothing overhead to slow the march higher, but it also means people who waited to sell until they got back to 'breakeven' now have an excuse. It should be interesting.
What's baffling about the late week rally was the spike higher in interest rates. As we illustrated above, even a small change in interest rates should lead to a big drop in the 'fair value' of the market. That wasn't the case on Friday, but is something to watch.
SEM Model Positioning
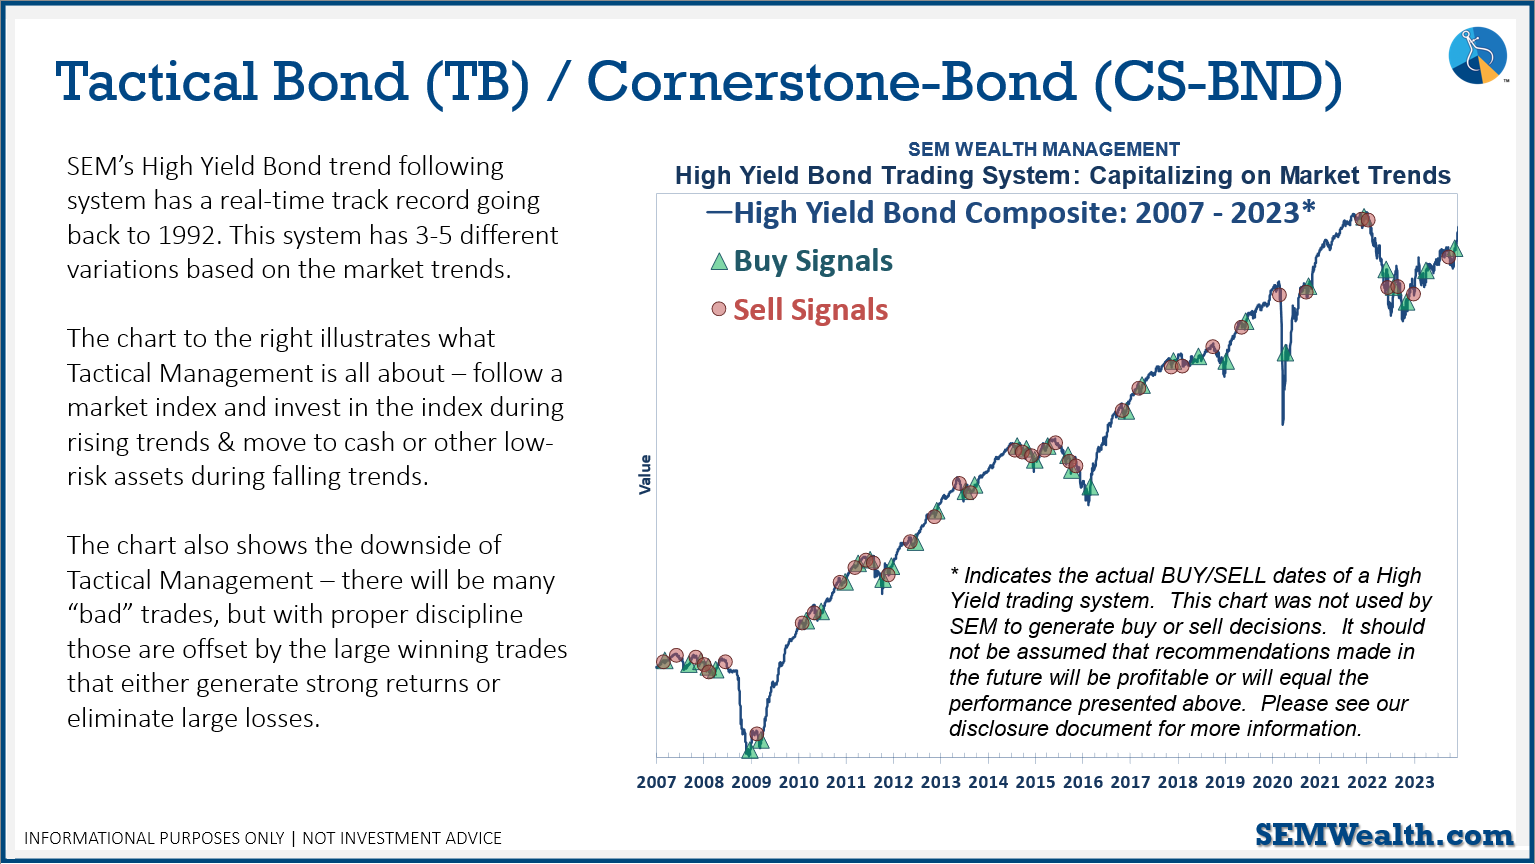
-Tactical High Yield went on a buy 11/3/2023
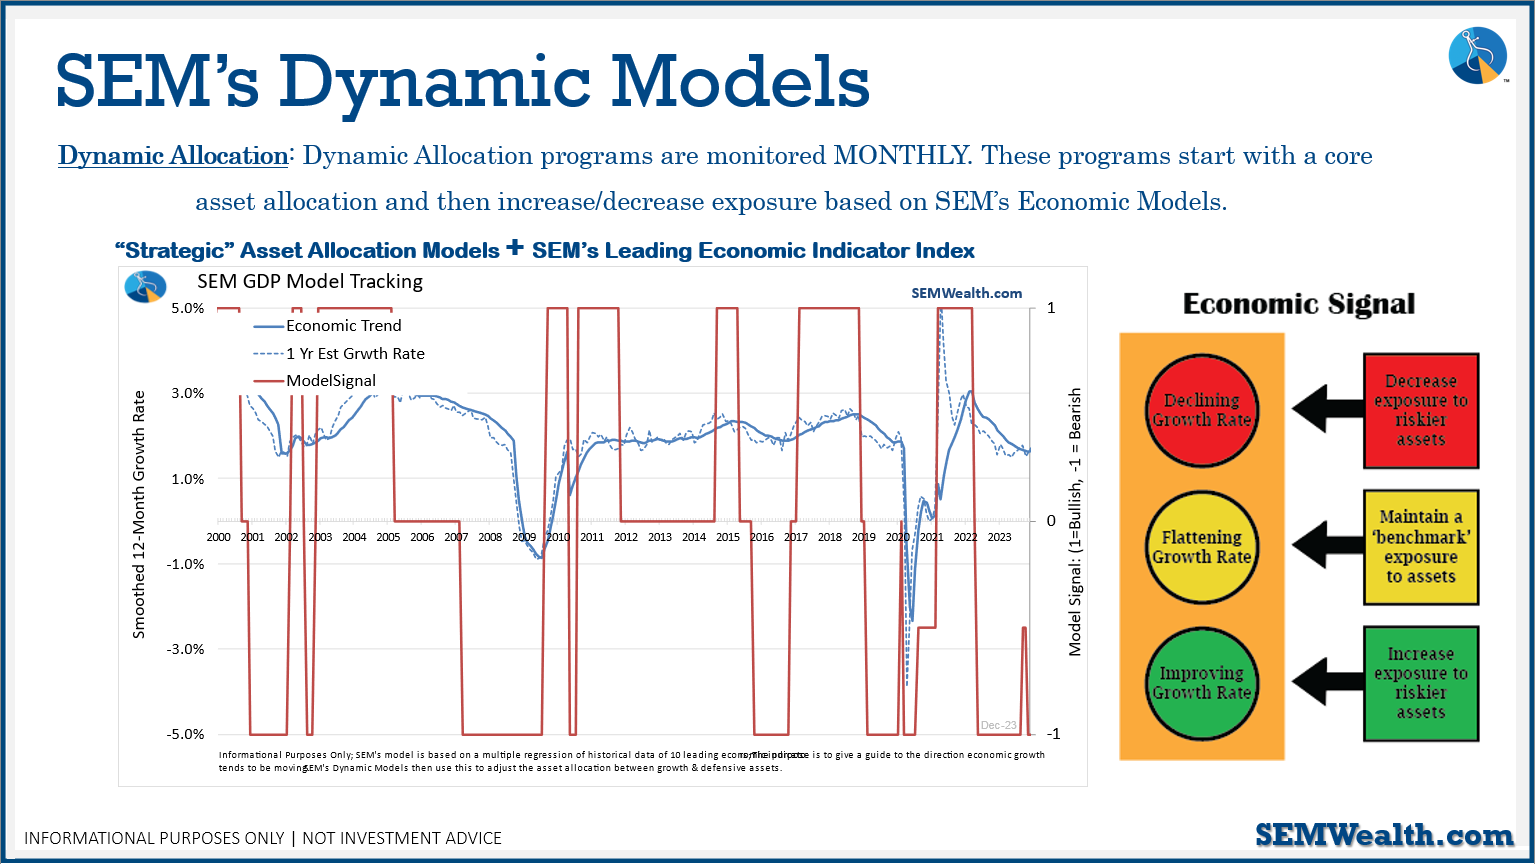
-Dynamic Models reverted back to 'bearish' 12/8/2023
-Strategic Trend Models went on a buy 11/27/2023
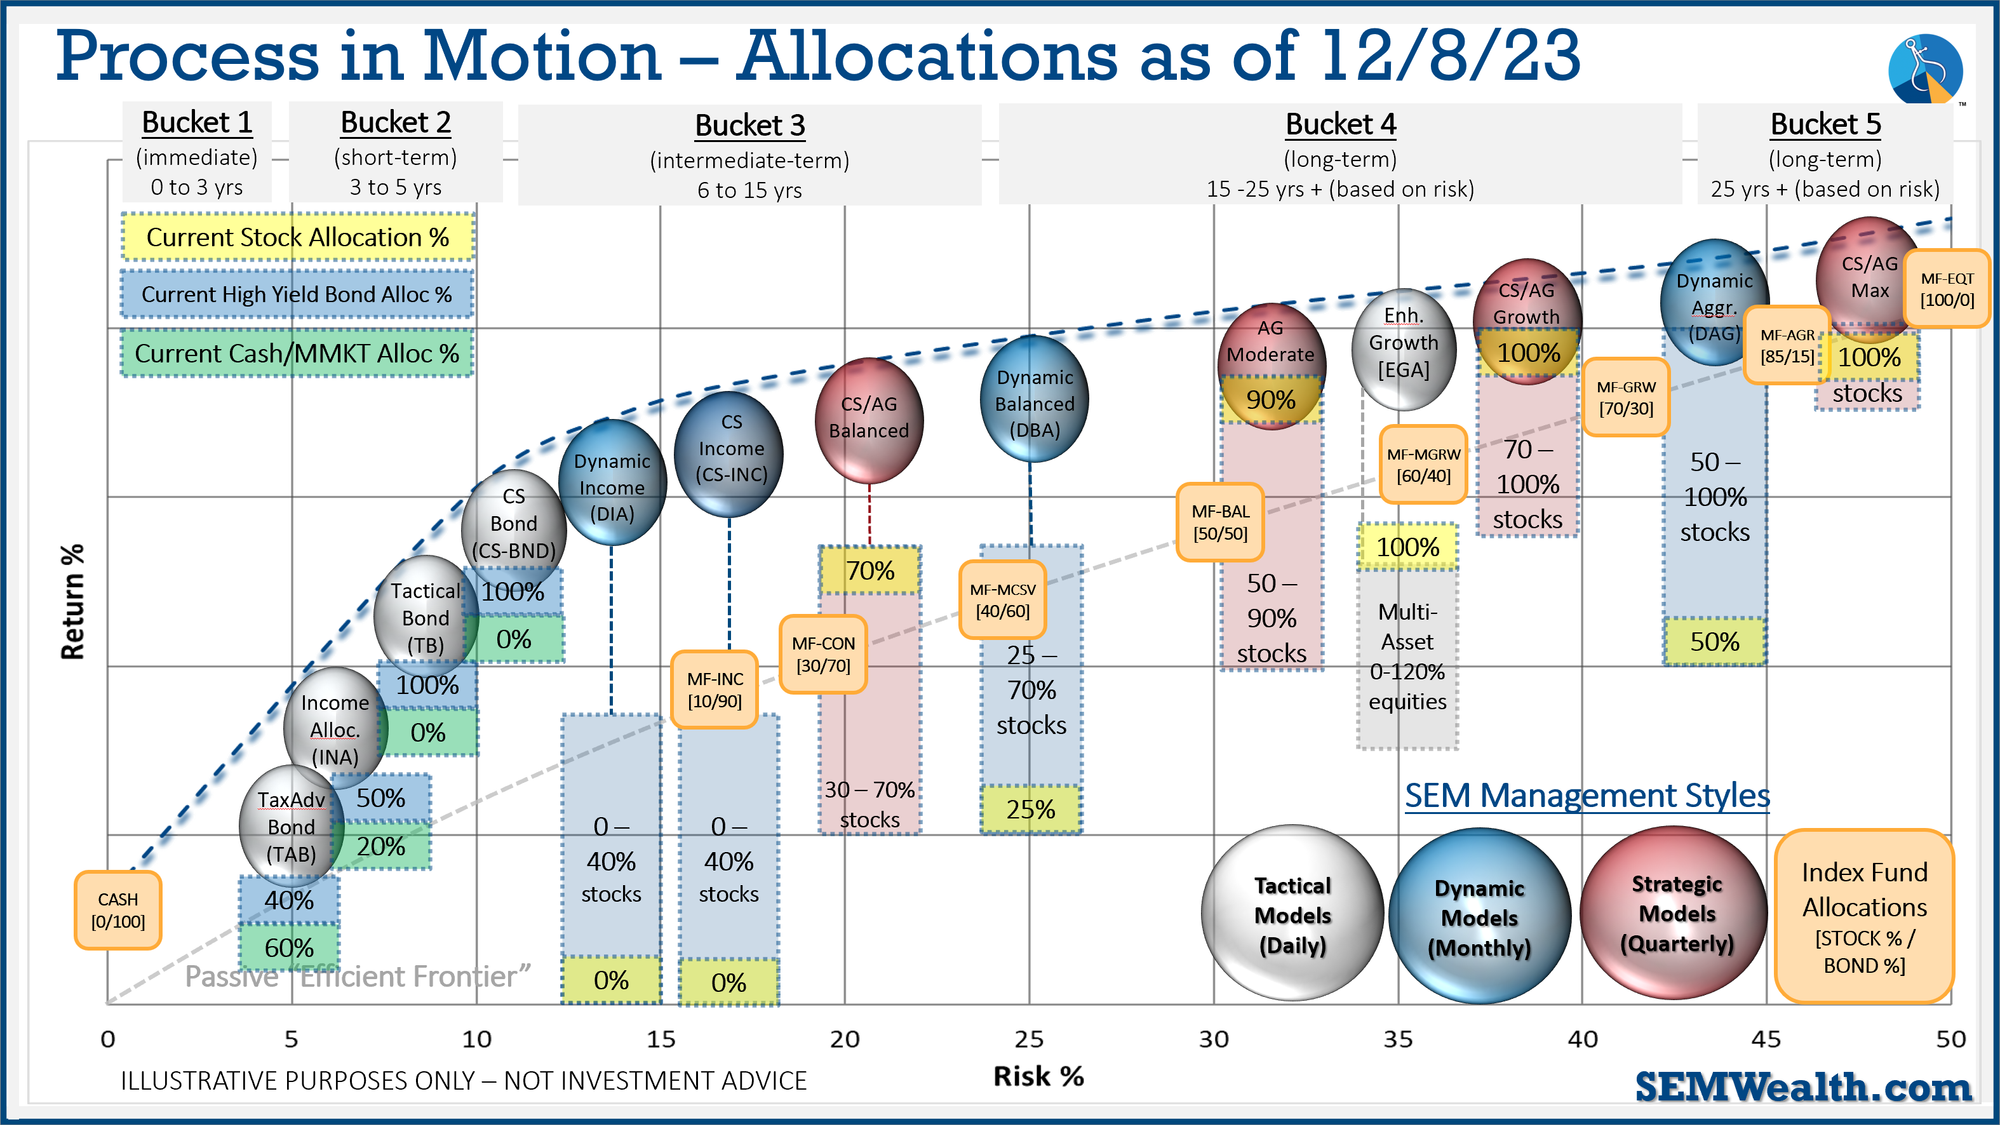
SEM deploys 3 distinct approaches – Tactical, Dynamic, and Strategic. These systems have been described as 'daily, monthly, quarterly' given how often they may make adjustments. Here is where they each stand.
Tactical (daily): The High Yield Bond system bought the beginning of April and issued all 3 sell signals 9/28/2023. All 3 systems were back on buy signals by the close on 11/3/2023. The bond funds we are invested in are a bit more 'conservative' than the overall index, but still yielding between 7.5 -8.5% annually.
Dynamic (monthly): At the beginning of October the model moved slightly off the "bearish" signal we've had since April 2022. At the beginning of December it reverted back to "bearish". This means no positions in dividend stocks (Dynamic Income) or small cap stocks (Dynamic Aggressive Growth).
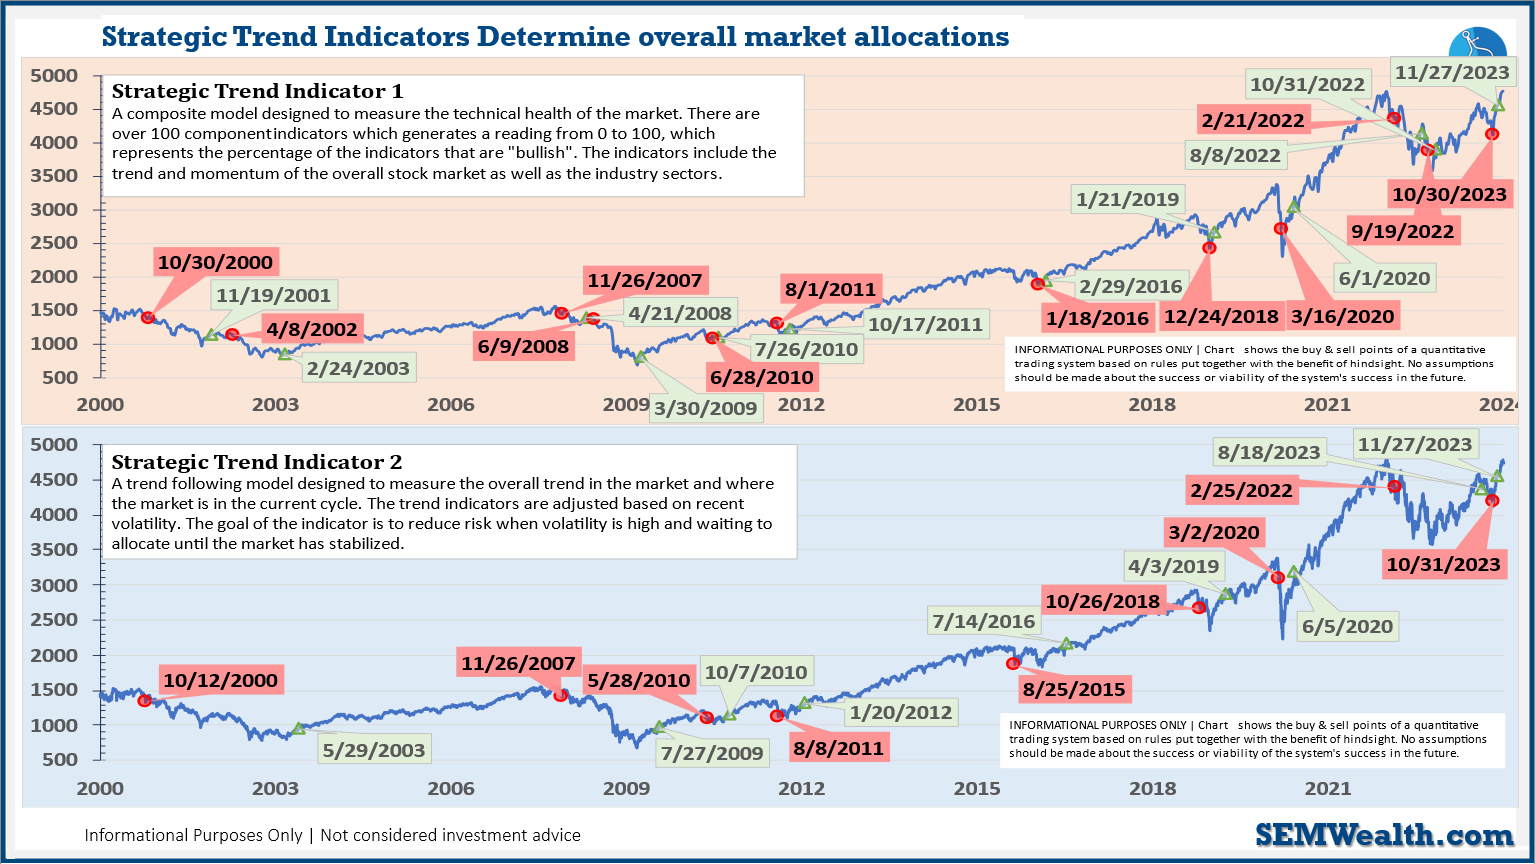
Strategic (quarterly)*:
BOTH Trend Systems reversed back to a buy on 11/27/2023
The core rotation is adjusted quarterly. On August 17 it rotated out of mid-cap growth and into small cap value. It also sold some large cap value to buy some large cap blend and growth. The large cap purchases were in actively managed funds with more diversification than the S&P 500 (banking on the market broadening out beyond the top 5-10 stocks.) On January 8 it rotated completely out of small cap value and mid-cap growth to purchase another broad (more diversified) large cap blend fund along with a Dividend Growth fund.
The * in quarterly is for the trend models. These models are watched daily but they trade infrequently based on readings of where each believe we are in the cycle. The trend systems can be susceptible to "whipsaws" as we saw with the recent sell and buy signals at the end of October and November. The goal of the systems is to miss major downturns in the market. Risks are high when the market has been stampeding higher as it has for most of 2023. This means sometimes selling too soon. As we saw with the recent trade, the systems can quickly reverse if they are wrong.
Overall, this is how our various models stack up based on the last allocation change: