
When evaluating the market, far too often our emotions get in the way of making a clear assessment of what is really happening. The more the market goes up, the more our behavioral biases can cloud our judgement. One of the best ways to overcome our behavioral biases is to use DATA.
The CFA Institute understands how dangerous subjectively making decisions on our investments can be on our long-term financial health. In the Level III Curriculum on Behavioral Biases, they gave us an easy way to identify whether or not a market is in a bubble:
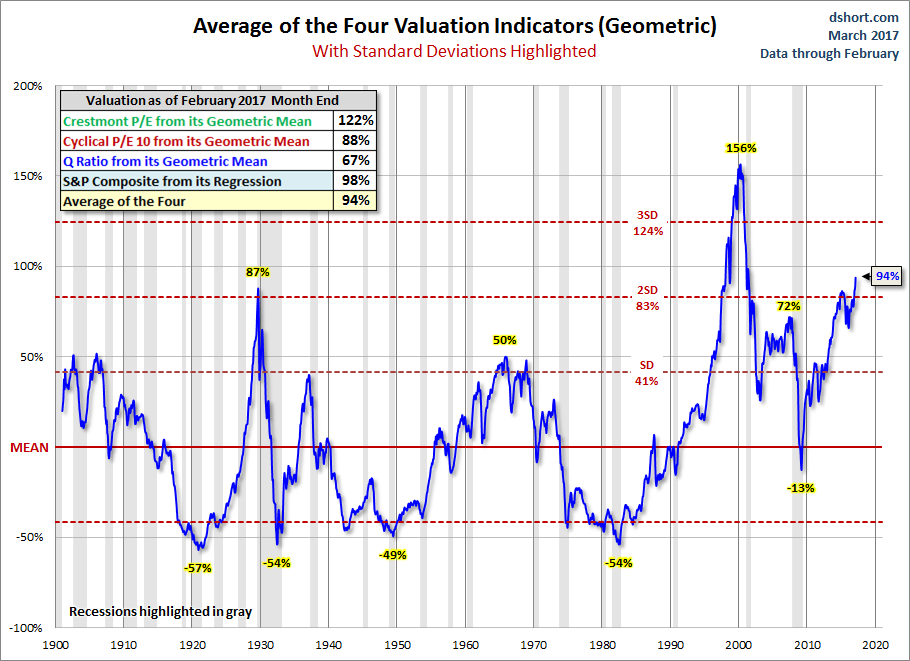
Bubbles and crashes appear to be panics of buying and selling. A continuous rise in an asset price is fueled by investors’ expectations of further increase; asset prices become decoupled from economic fundamentals. A more objective modern definition specifies periods when a price index for an asset class trades more than two standard deviations outside its historic trend.
The chart of the week looks at 4 different valuation indicators and even gives us the standard deviations above or below “normal” for these metrics. While the market has been overvalued even more than it currently is, it meets the objective definition of a bubble. Investors buying now (or holding with money they might need in the next 10 years) are already buying high and are only hoping valuations get as frothy as they did in 1999.
For more on the emotions that come into play during market bubbles, click here.


