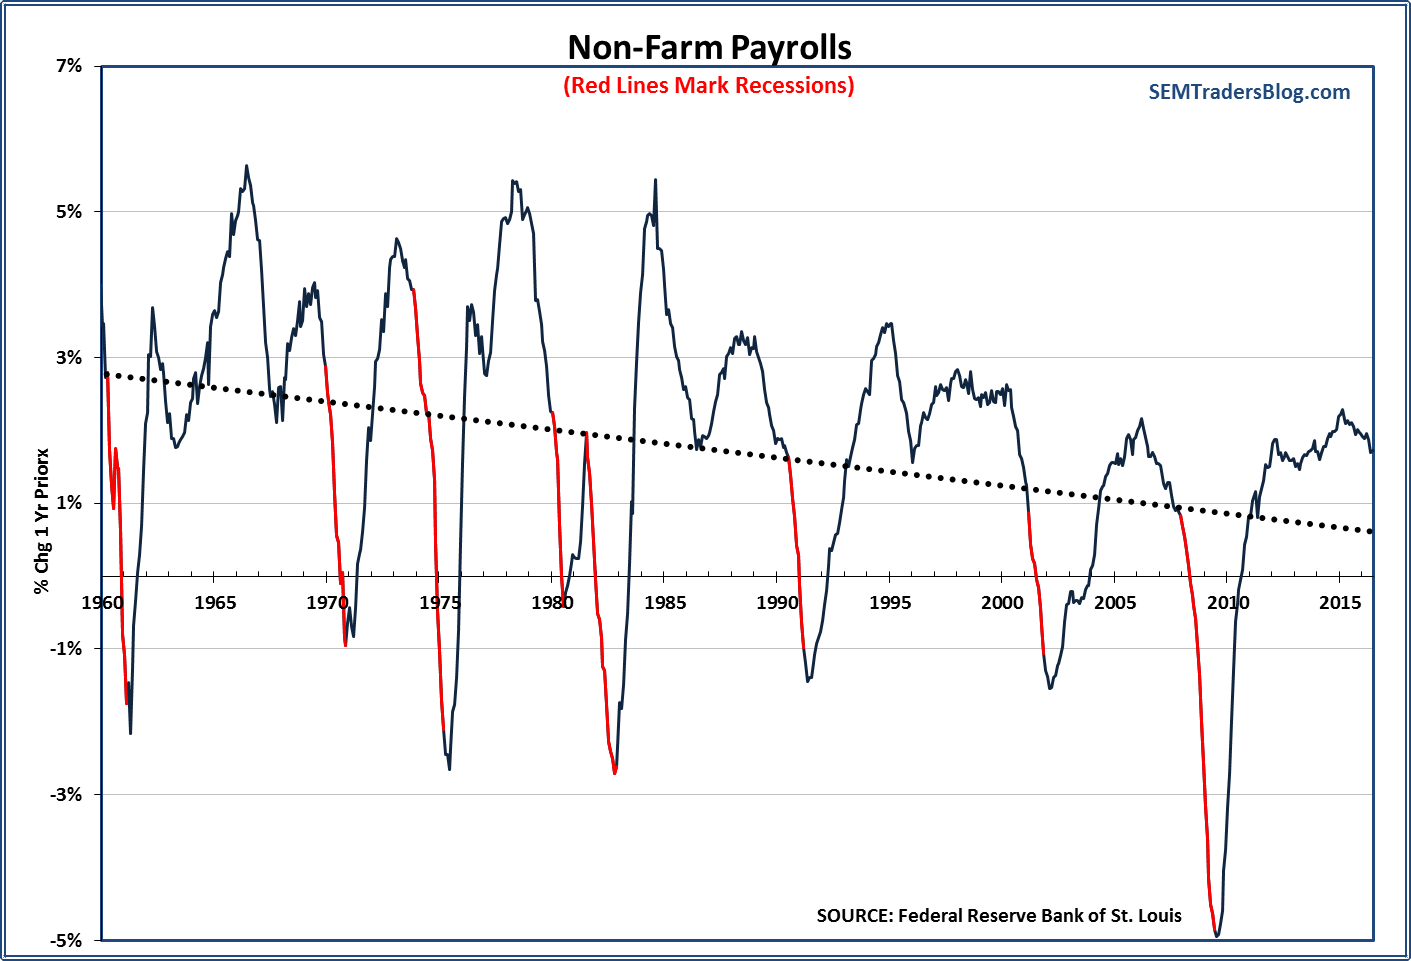
Much debate has been circulating lately about what defines “full employment” or what “normal” growth looks like. The August Payrolls Report was right in line with what economists used to consider “normal” for “normal” economic growth. Looking at my Leading
Tag: Chart of the Week
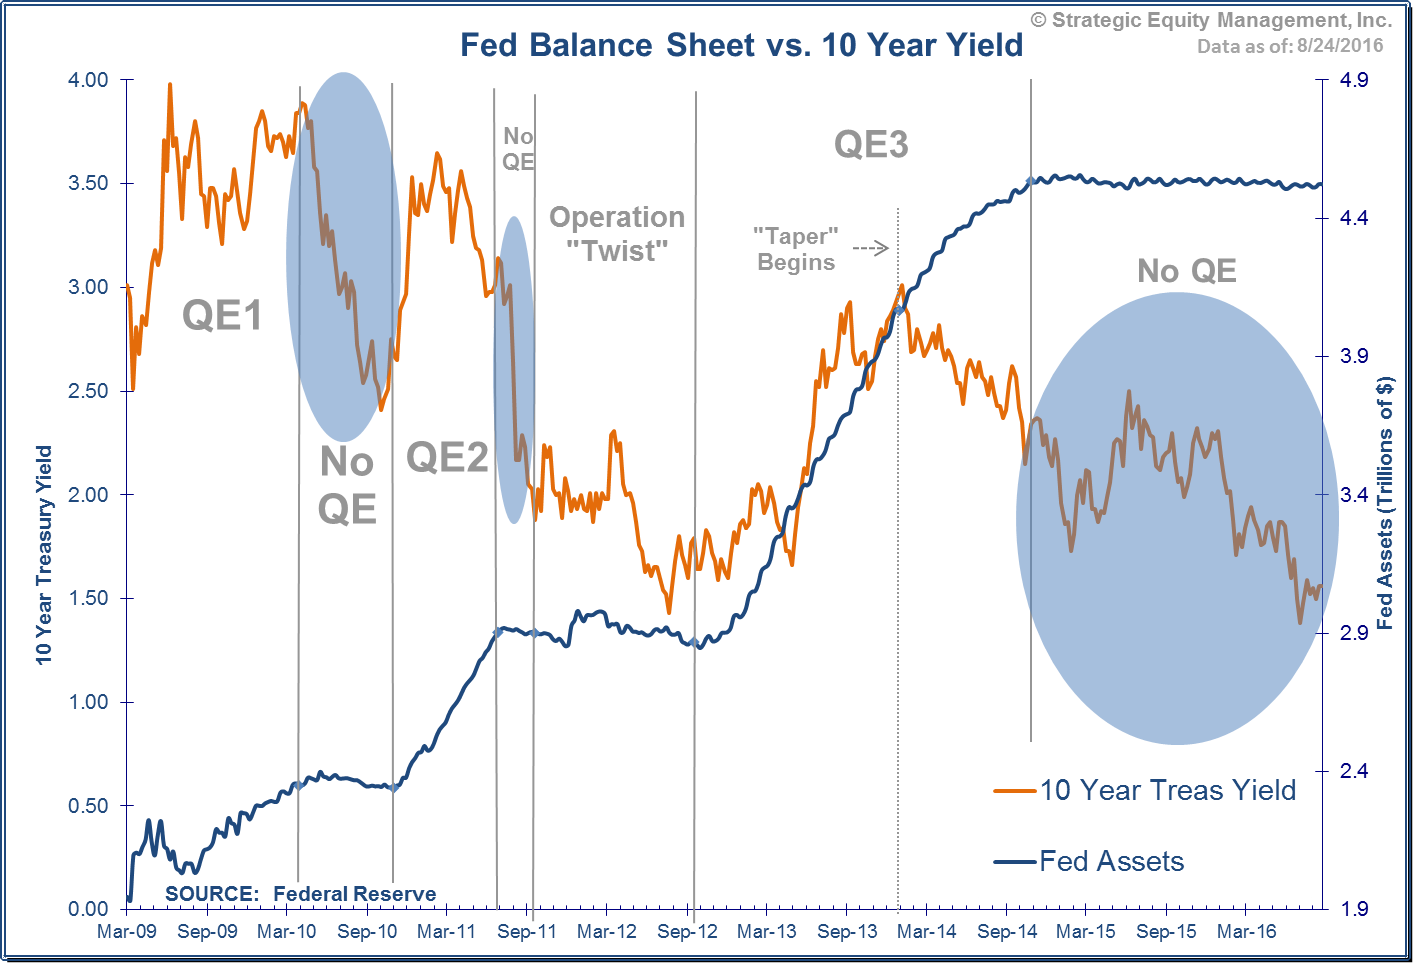
With so many market participants focused on Fed policies and their NEXT move, it is important to understand what the Fed can and cannot control. While the Fed sets SHORT-TERM rates and can use open market operations to control them, the free market sets LONG-TERM rates.
One of
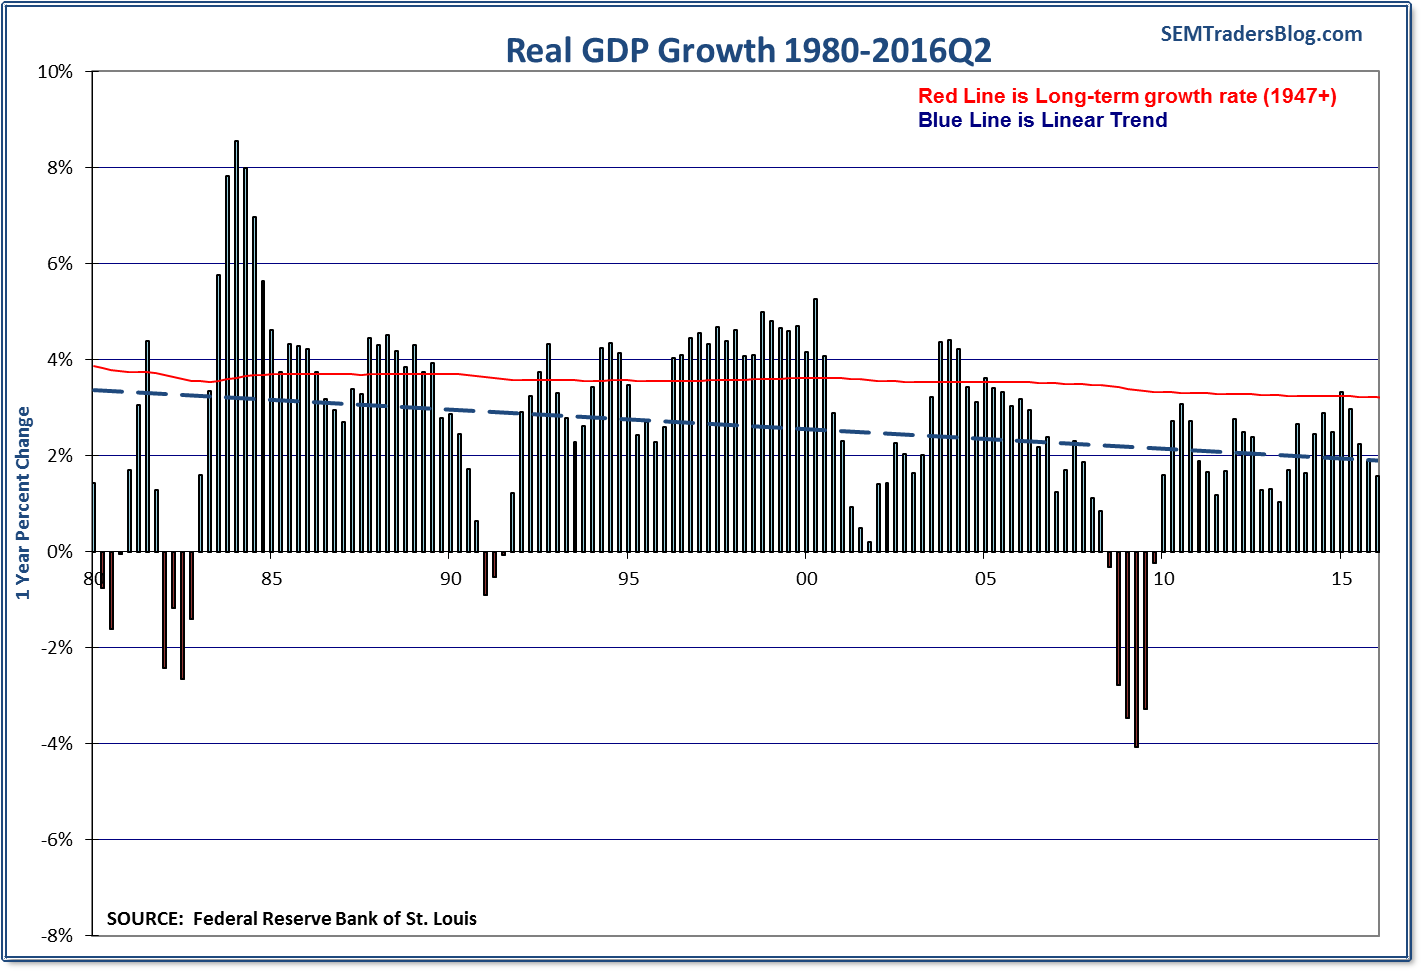
From the Fed, to the Congressional Budget Office, to most mainstream economists, “average”, “trend” , or “normal” growth is assumed to be around 3%. During this economic recovery we’ve only seen GDP growth exceed the “normal” rate once…
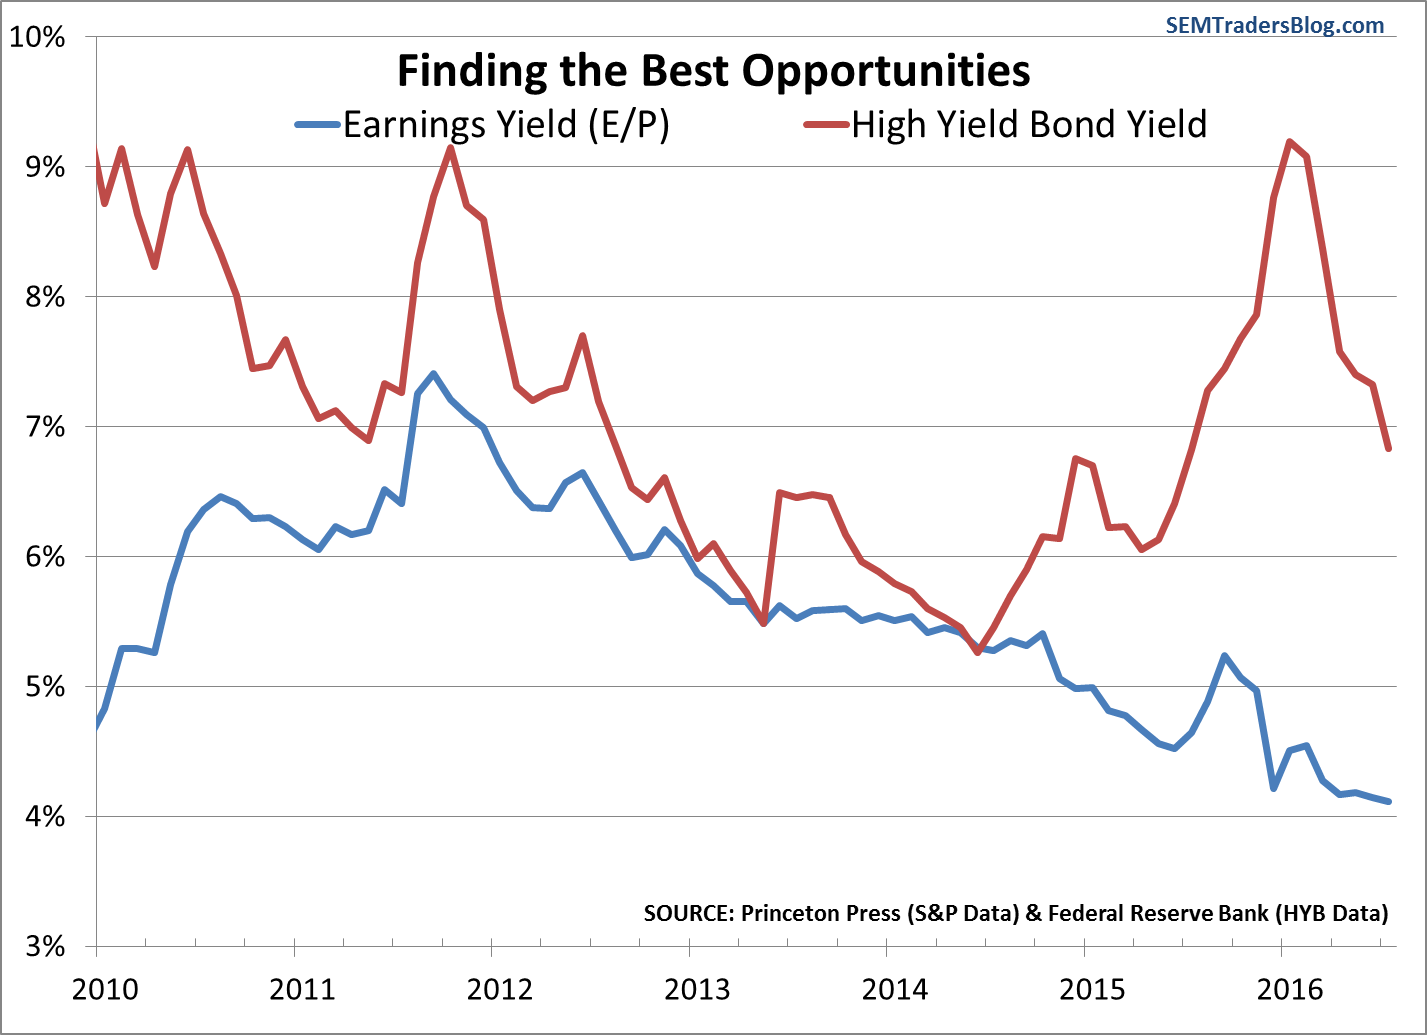
“Stocks are more attractive than bonds.”
The S&P 500 dividend yield is 2.03% compared to the 10-Year Treasury Yield of 1.51%.
This type of comparison drives me crazy. Stocks & bonds are completely different investments with completely different characteristics and roles in
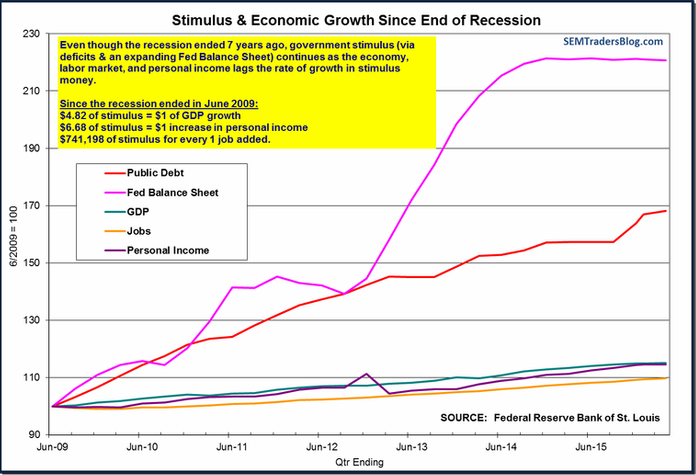
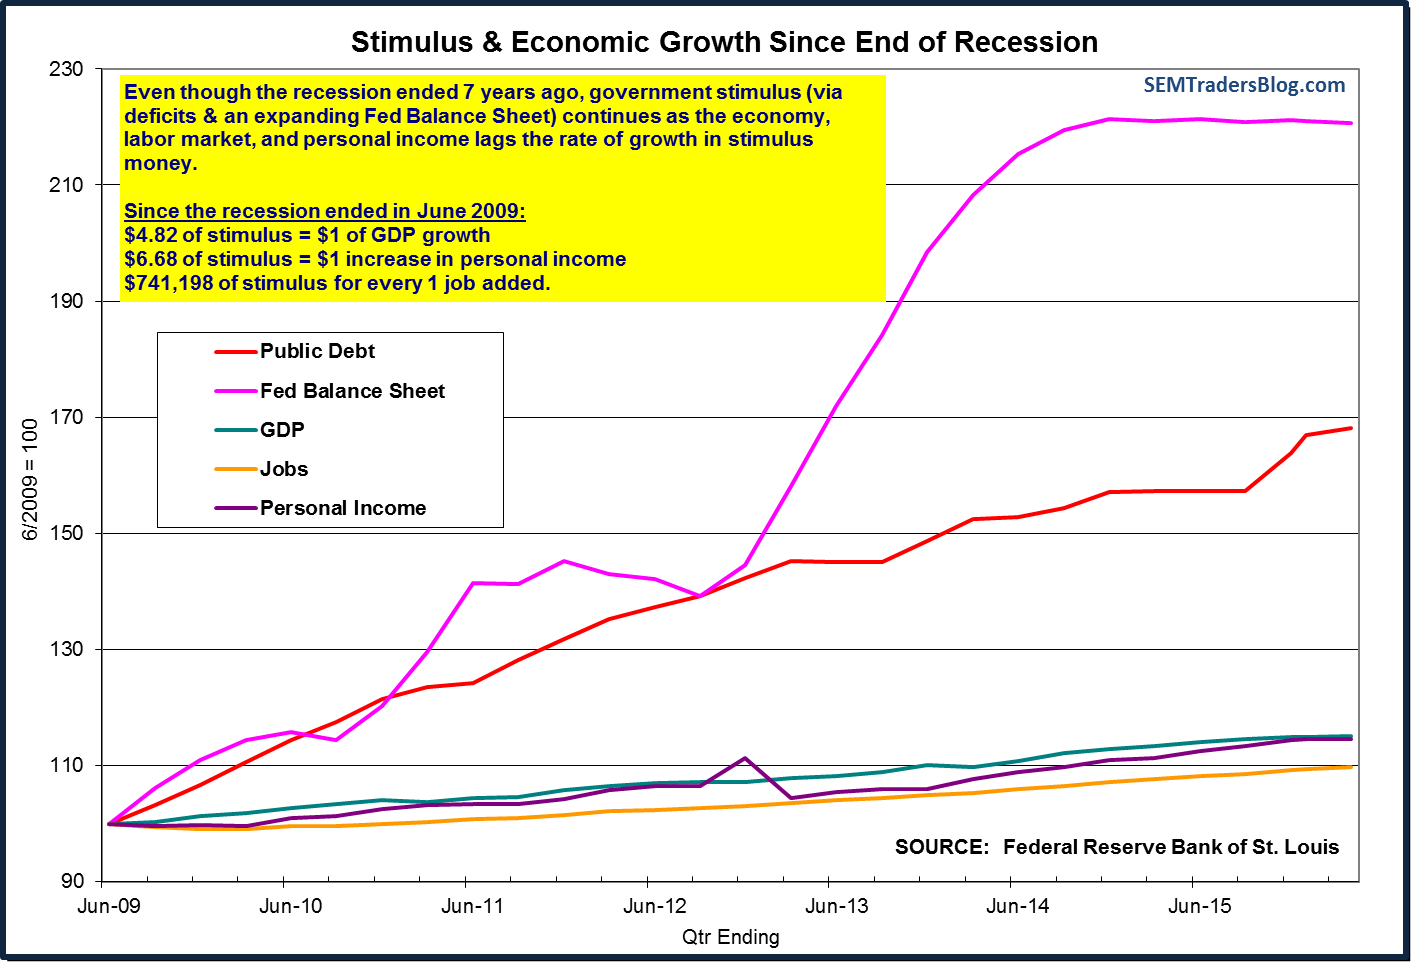
$741,198 spent for every 1 job added.
Assuming those jobs paid the average hourly wage of $25.69 and each worker worked the average 34.5 hours per week, the average annual income would by $46,088.
Not counting interest payments on the debt used to generate

