
Last week I spent quite a bit of time talking about the most common behavioral biases exhibited by investors (as well as professional advisors). I flagged it as both a Presentation & Weekend Reading so it is easy to find for future reference. There are two types of behavioral biases that influence our ability to make sound investing decisions — cognitive errors & emotional biases. Cognitive errors are usually caused by heuristics (mentally short-cuts) used by our brains to quickly process information. I’ve spent a great deal of time discussing these short-cuts this year. Cognitive errors can usually be overcome by a.) acknowledging the fact we are prone to these errors by nature & b.) studying the data from a proper perspective.
Emotional biases are much more difficult to overcome as these are things that are in our DNA. There is nothing wrong with being emotional or having certain biases — that’s what makes each of us unique. With emotional biases it is far easier to develop ways to offset the damage they may cause to our investment portfolios than to change who we are. One thing we’ve told our kids as they grew up — when looking for a future spouse just remember, it is very difficult for a person to change who they are. They may be able to purposefully push down some of their less than desirable traits, but when they get in a high pressure situation their true nature usually comes to the surface. The same is true for us as investors.
We are in the middle (or late stages) of the third bull market bubble of my career. (I call it a bubble based on comparisons of valuations, something we will discuss in the coming days. For a preview of the research, click here.) One of the things I have witnessed in each of these bubbles is the perceived value of active investment strategies. Each time the more the market goes up, the more our emotional biases take over, which leads to irrational behavior from the markets. This makes it more and more difficult for those disciplined active managers to outperform. The longer this goes on the more our emotional biases take over and the more money we see flowing into passive investment strategies.
Ned Davis wrote about this a few weeks back in his hotline, and it was picked up on by Value Walk. Ned included this chart showing both the performance and asset flows in passive versus active strategies.
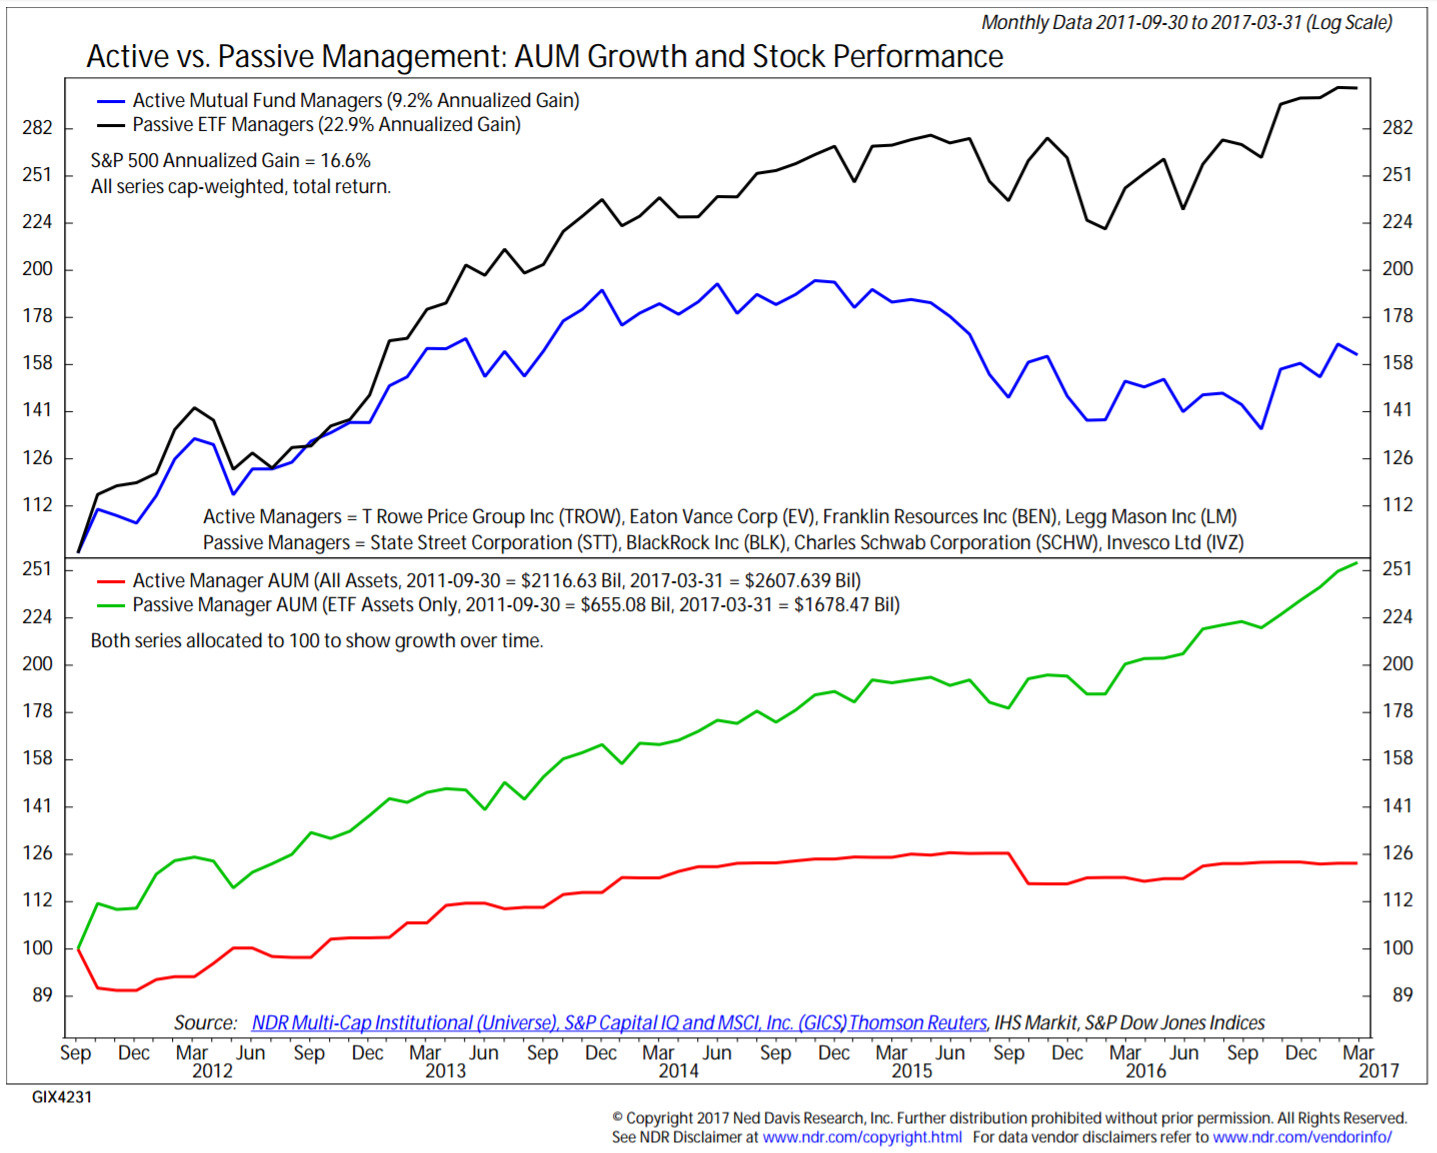
Our human nature is designed to take the most recent performance and to extrapolate that indefinitely into the future (this is called Availability or “Recency” Bias). The more passive strategies have outperformed, the more money we’ve seen move into these strategies. [The consequences of this in the broader sense is far beyond the scope of this blog, but based on some of the white papers I’ve read we all need to be careful with all the money that has flowed into these passively managed ETFs.]
Just looking at the DATA (the best way to overcome behavioral biases), Ned Davis summarizes what he sees.
“We are in the late phases of a passive index bubble. I think over the next five years, there will be a great opportunity for active managers to outperform passive managers.”
This lines up directly with both my research as well as my experience. The real value of active management, especially the mechanical strategies employed by SEM is they prevent us from letting our emotions cloud our decision making.
Tuesday, April 18
Stocks continue to draw investors off the sideline with the allure of higher returns. Yesterday I mentioned a highly thoughtful article by John Mauldin (most of his are in that category). He started it off with a popular quote from Warren Buffett:
One thing Mr. Mauldin pointed out was the fact most people’s eyes glaze over when we talk about the wide range of valuation metrics out there, but if we put valuations in perspective of something we buy often — in Mr. Buffett’s case, hamburgers, people can better understand stock valuations.
“To refer to a personal taste of mine, I’m going to buy hamburgers the rest of my life. When hamburgers go down in price, we sing the ‘Hallelujah Chorus’ in the Buffett household. When hamburgers go up in price, we weep. For most people, it’s the same with everything in life they will be buying — – except stocks. When stocks go down and you can get more for your money, people don’t like them anymore.”
At this point “hamburgers” are quite expensive.
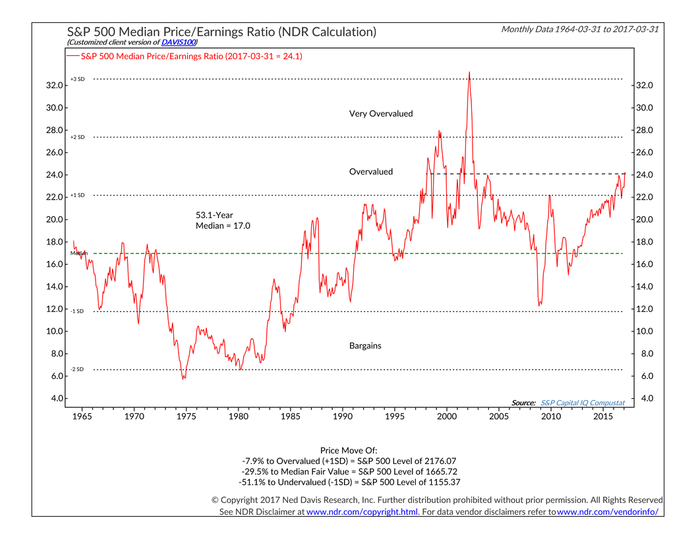
Note the data on the bottom of the page. The S&P 500 would have to drop 8% just to get back to “overvalued” territory. It would take a drop of 30% to get back to the median value. If stocks were looked at like anything else we buy, people would despise buying stocks right now. Instead we see a constant stream of clients leaving active risk management to buy these expensive stocks.
The problem is most people cannot wait patiently for the lower prices. The HAVE to have their “hamburgers” NOW even though deep down they know they are paying too much. This is where the value of active management comes in — we do not mind waiting patiently for better valuations.
Wednesday, April 19
I found it interesting watching the markets sell off on Tuesday because one company missed their earnings estimate. First of all the fact that any big name company missed earnings is highly surprising given all the possible ways companies can tweak their earnings to at least match expectations. We also typically see companies purposely guide earnings estimates down to levels that can be beat. At the same time we see analysts usually start the quarter out with high earnings estimates only to move them lower throughout the quarter. Finally the company that everyone seemed so concerned about missing estimates doesn’t really give us any indication of how the real economy or its participants are doing.
The company that spooked “investors” (speculators) yesterday? Goldman Sachs. This “bank”, which as far as I know still does not have any physical branches does not tell us anything about the underlying economy. The only reason they became a bank in 2008 was to access TARP money to bail themselves out of the bad “loans” they made. They finally got around to creating an actual depository bank last year with the launch of their online bank GS Direct. [I apologize — my long-time readers know I have serious problems with GS due to their involvement in the creation of the financial crisis. Watch/read “The Big Short” and you can see why. Other research into the crisis confirms the author’s assessment of their involvement.]
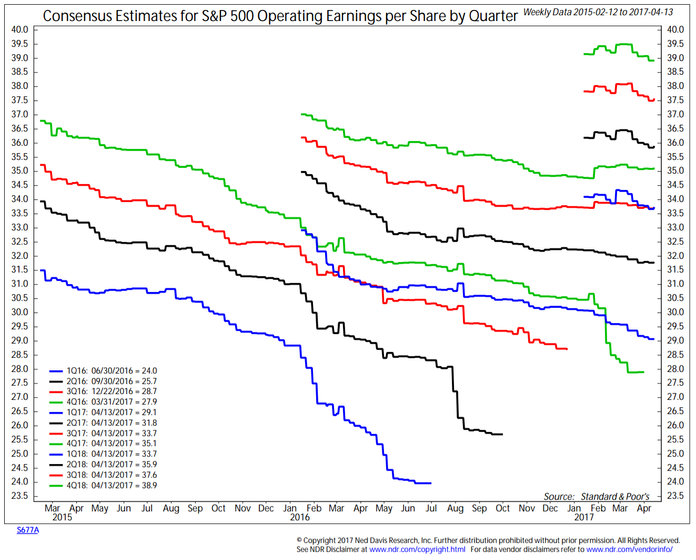
Anyway, back to today…………..I find it laughable how much attention investors (speculators) pay to the earnings announcements and where they fall relative to expectations. For at least the 25 years I’ve followed the markets it has been the same thing — analysts start the quarter with rosy expectations, lower them throughout the quarter, and then companies magically “beat” expectations. Very rarely does a company beat the estimates that were there at the beginning of the quarter. During bull markets the valuation typically goes UP in the face of these lower expectations, meaning “hamburgers” get even more expensive throughout the quarter (you are paying more for each dollar of earnings if expectations go lower and stock prices do not follow.)
This chart from Ned Davis shows the pattern.
I’ve been tracking estimates in my own chart.
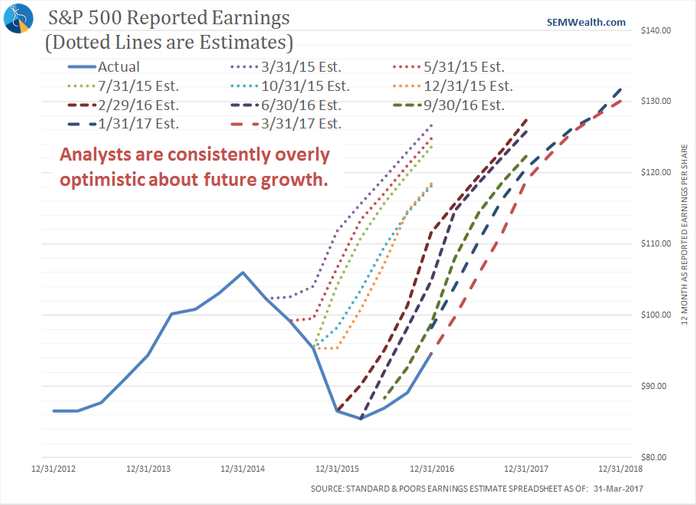
Whichever chart you look at the pattern is clear & shows us why it is so shocking when a big name company actually misses estimates.
Thursday, April 20
When I discuss the earnings charts shown yesterday, most people, whether professional advisor or individual investors have a look on their face that says, “yeah, so what?” Wall Street has done a remarkable job to convince investors and professionals alike that the market is “efficient”, meaning the current price of the market is “right”. They tell us all currently known information is fully priced in. When analysts lower estimates (as they do nearly every quarter) and the market doesn’t go down, the marketing machine tells us it’s because investors are anticipating a big turnaround.
[Side note: If the market were “efficient” we would not see bubbles and crashes or 100 point moves when Goldman Sachs missing earnings estimates. The market isn’t efficient because it’s run by humans, who are by nature emotional. this is why SEM’s behavioral approach to investing is so important.]
What few people ever do is run the math. When earnings come in below the level that was “priced in” at the beginning of the quarter or when an investment was purchased the “hamburgers” mentioned by Warren Buffett become more expensive. When you buy a stock (or a basket of stocks inside an index fund) you are purchasing the present value of all future streams of income. The easiest way to understand the value you are paying is to take the price of the stock (or index) and divide it by the earnings per share. This is known as the P/E ratio and helps us understand how expensive the “hamburgers” are.
The problem is not the numerator in that equation but what earnings number do you put in the denominator. On Tuesday I showed the P/E ratio using the trailing 12 months operating earnings (don’t even get me started on that number and all the normal expenses that are excluded from that number). The S&P 500 would have to fall 30% to get back to median valuation levels. That is a problem for the Wall Street marketing machine, so they have taken to using a “forward” P/E ratio. This takes the current price divided by the expected earnings for the next year. We showed yesterday why you would be a fool to use a forward P/E ratio — the earnings actually achieved are almost always significantly lower than what was expected 12 months ago. When you use a forward P/E to evaluate stocks you end up paying for a 1/2 pound hamburger and only getting a 1/4 pounder.
Figuring out what to use in the denominator of the P/E ratio has always been an issue, especially for true investors. To make more rational decisions Nobel Prize winning economist Robert Shiller (who also proved the market is not efficient) developed the “Cyclically Adjusted Price Earnings” Ratio (CAPE). This is also sometimes known as the PE10 or simply the “Shiller P/E”. Dr. Shiller wanted to remove the economic cycle, short-term fluctuations, and most importantly estimates in evaluating companies. The Shiller P/E uses the last 10 years of earnings as the denominator. Critics have said this ignores the potential for growth to be factored in, which I agree with, but for something like the S&P 500 which is comprised of mature, large companies that will not see long-term growth rates change much, it is highly useful.
The Wall Street marketing machine of course does not like anybody using the Shiller P/E because it makes the “hamburgers” look very expensive.
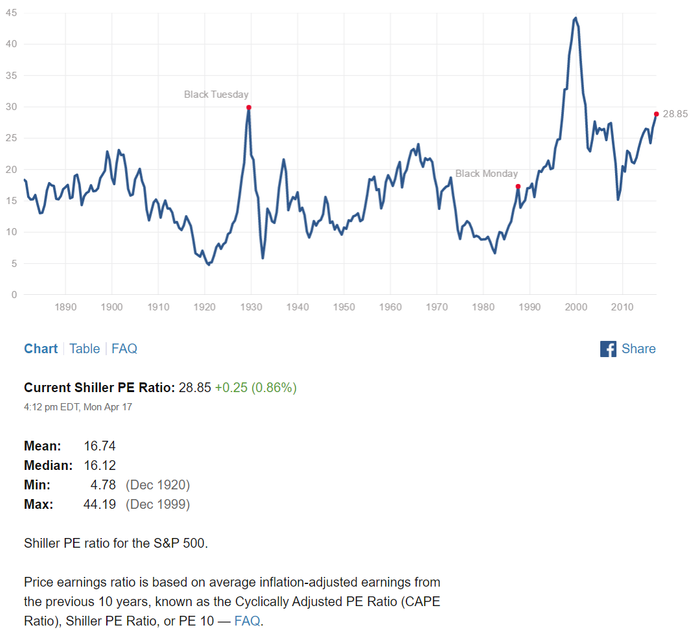
Yes stocks could get more expensive, but that turns into a dangerous game for investors to guess when they should sell. By the way, the very fact the Shiller P/E has shown such large fluctuations is proof the market is not even close to efficient. If it were, the P/E ratio would be a fairly flat line.
Friday, April 21
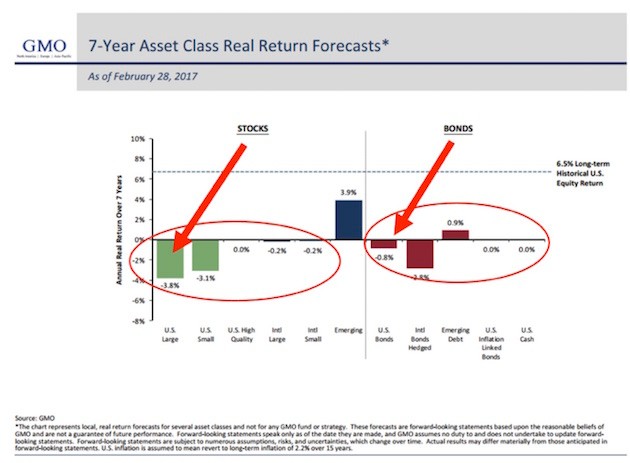
All we we’ve been discussing valuations and what they mean based on an article by John Mauldin . One of the primary reasons valuations are important is if you invest when valuations are high, you should expect significantly lower returns. Conversely, when you invest when valuations are low, your longer-term returns are significantly higher. With valuations in the “overvalued” range, the expected returns are quite low based on the DATA. GMO has run the numbers and their DATA says the next 7 years could see NEGATIVE returns in most asset classes.
The headline for this week’s blog was the “value of active management”. We’ve spend a lot of time talking about value, but not as much about active management. The reason active management is so valuable at this point in time is the ability to adjust asset allocations to and from the various asset classes. During a bull market any sort of risk management strategy is going to underperform a buy & hold strategy. However, during a bear market the value becomes apparent. SEM has been around 25 years because our Scientifically Engineered Models are designed to not get sucked into the emotions of investing. That is the real value of our actively managed models.


