
One of the fundamental laws of investing is the more return you seek, the more risk you must take on. While short periods of time may make it appear this law is no longer in place, over the long-run it always ends up being true. The longer the bull market has continued without even a 3 or 5% correction, the more investors we see believing they can achieve high returns with very little risk.
A simple look back at history tells us this cannot continue forever. Even with solid economic growth in the 1990s and the mid-2000s we still saw a massive correction in stock prices that saw the S&P 500 lose half its value. Now with the economic cycle entering the later stages, it is inevitable at some point in the next few years we will see the end of the expansion and the beginning of a recessionary bear market. With 9+ years of gains behind us now is the time to take a step back and look at the fundamental law of investing.
When I meet with clients & prospective clients I always spend quite a bit of time probing their TRUE risk tolerance — the dollar loss which will make them begin to feel nervous. Studies have shown when we get nervous, we tend to react emotionally, especially when it comes to our money. Our goal is to position their investments in such a way they do not get nervous. I then walk them through the fundamental law of investing by starting with two points —
1.) A CD — virtually no risk, but only 1-2% return potential at current rates.
2.) The S&P 500 — averaging 10% over the last 15 years, but with 50% risk.
With these two points we can draw a straight line to show the possible low-cost investments available to them. The curve can bend a bit by utilizing bonds instead of a CD (or a combination of all 3), but it is still essentially a straight line. I then come back and convert their dollar loss where they become uncomfortable to a percentage loss. I’ve found 80-90% of investors regardless of age or experience land somewhere between 10-20%. I plot their nervous point on the curve and tell them they can find a basket of investments for no-cost that would generate those returns. I point out one critical piece of information — they CANNOT generate the same returns as the S&P 500 at that risk tolerance level.
At SEM, we still are stuck working with the fundamental law of investing, but by combining mechanical trading systems designed to reduce losses during bear markets we can “bend” the curve significantly. The chart below illustrates some combinations of some of our investment models.
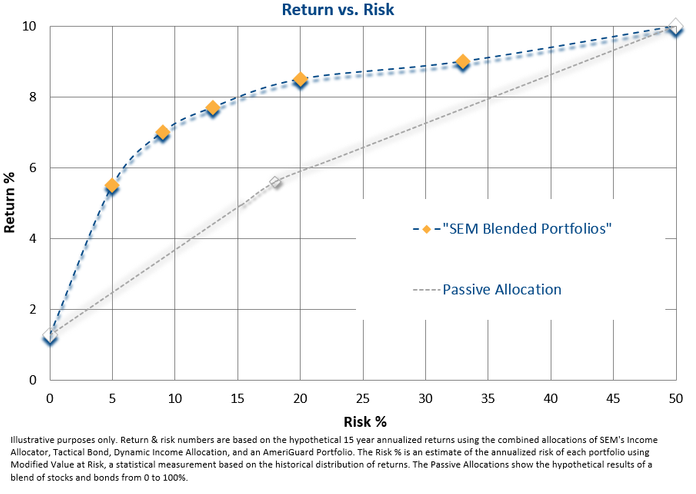
Note where SEM’s Scientifically Engineered Models add the most value — between the 5-20% risk levels, which not by accident are where most investors tend to fall. SEM’s models can still add value as we get closer to the risk level of the S&P 500, but the difference becomes smaller. Note, however, how little extra returns you can get between the “Aggressive” SEM combination (the yellow diamond on the right of the curve) and the S&P 500. Is the additional 15%+ risk really worth eking out another 1% per year in returns? That is an answer each individual can answer for themselves, but in my experience there is a huge difference between losing 35% and 50%.
Regardless of the risk tolerance and objectives, SEM and our advisors should be able to find a portfolio that can “bend the curve” for you somewhere on our TCA Platform. If you’d like a free portfolio evaluation to see where you fall on the curve, drop me an email.


