
For 12 years we've been programmed to "buy the dip", especially whenever the Federal Reserve steps in to provide stimulus. As I went through in great detail yesterday, the Fed does not have the right tools to fight this kind of economic event. (I categorized the post as "Weekend Reading" because it's really something you should take some time to digest outside the heat of the moment.) In fact they may have made things worse in the future with their emergency rate cut. I've often warned we will eventually run into something a.) the Fed will not be able to prevent and b.) nobody saw coming.
While this could be the event I warned about, I'm so far sticking to my assessment from last week that there is no reason to panic at this point, ESPECIALLY if you had already implemented SEM's 3-pronged approach of tactical, dynamic, and strategic models. They are all doing their job. The tactical systems sold into the textbook rally, the dynamic systems, which use our economic model were already in a bearish position, and our strategic models have weathered the storm. Now they all sit and wait.
One of the reasons we follow a quantitative approach using technical rather than fundamental analysis is it removes the guesswork involved. (Fundamental analysis is where you have to project earnings and then determine what those earnings are worth. I walked through the difficulty of doing that in last week's post.) Many people using technical analysis do not do it quantitatively. They study the charts and then determine the best way to proceed. This can be just as dangerous as fundamental analysis. Technical analysis works because the ultimate buy and sell decisions are made by humans. Humans are emotional and have specific biases that become magnified during times of uncertainty. Our quantitative approach removes our own emotions.
One thing that I find fascinating when looking at the markets is the way they tend to follow similar patterns found in nature. Nature, including our emotions move in cycles that can often be predicted by mathematical formulas which see patterns our minds do not. Fibonacci numbers are one way to explain these moves. While not something we specifically use, our models do take into account some of the various support and resistance levels generated by the frantic buying and selling. (They will also then measure the health of the move around those levels -- are they "speculator" or "investor" driven?)
This chart shows the move up from the December 26, 2019 lows (red lines) and the drop over the last week (yellow lines). Interestingly enough the drop took the S&P just past the 50% retracement level and the rally this week took it just past the 50% recovery level. During phone calls last week I said we should expect a recovery of about 50% of the losses. Little did I know it would come in two record setting days this week.
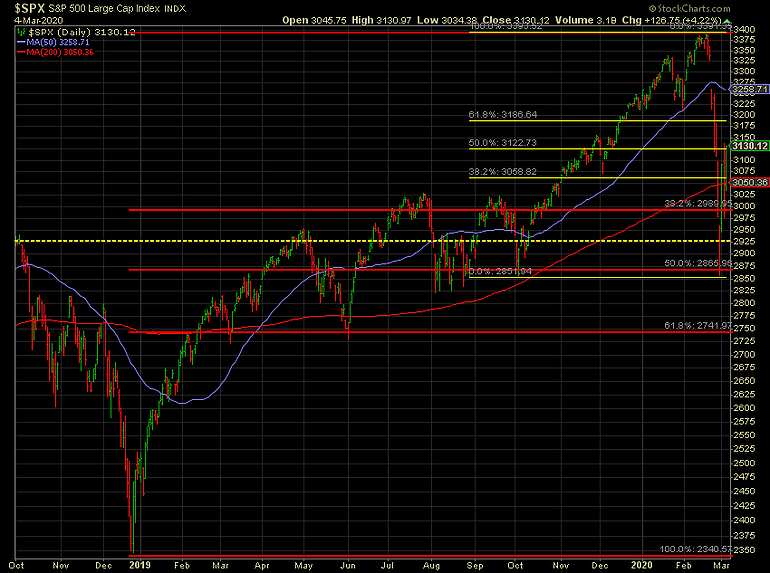
As I said in the post yesterday, the root cause of the problem has not been solved. There is no way a reasonable person could argue stocks should be worth what they were last October. Both earnings will take a hit and the risk around those earnings are high. It would be healthy to see the market fluctuate and volatility to slow down between these two levels. A bottom is a process, not an event. A solid bottom takes time to develop and can serve as a launching point for sustainable gains.
Here's an easier to view way to see the moves the market needs to digest. The S&P 500 essentially gave back 50% of the point gains from the end of December 2019. It then turned around and recovered 50% of the points lost in late February. We now have defined some key turning points in stock prices with very heavy bottom. These are prices we saw a lot of people buying and selling, which means they are "break-even" points which often bring people who regretted not selling (or buying) at those levels back to the market.
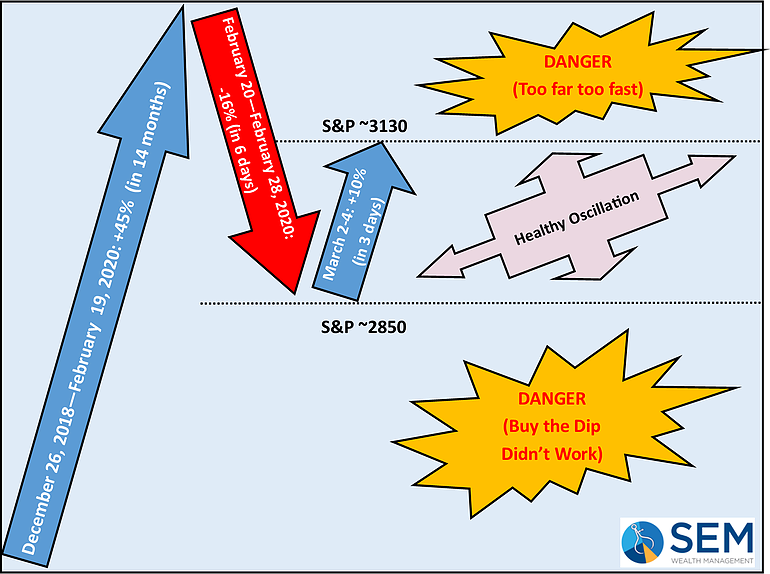
We may see some false breakouts or breakdowns above this band. This will be something our systems will be watching for. If the market shoots up past 3130 it would not be based on any sort of change in fundamentals, which means it is controlled by speculators who can turn to sellers in an instance. If it falls below 2850, all those people who said, "see you should always buy the dip" would have their faith shaken in a strategy that served them well for 12 years.
For the sake of the market, here's to a few weeks of "damped oscillation". Whatever happens next, we'll be ready.


