
Volatility has returned to the markets with full force this year. The financial media continues to point to various culprits every time the stock market makes a major move up or down. This has left investors wondering how one small piece of information can cause the stock market to fall 10% in a couple of months (or weeks).
In order to explain this I wanted to go back to my first investments class in college (Finance 351: Introduction to Investments). What I know now is I could save college students thousands of dollars (and investors a lot of pain) by taking this semester long class down to about 20 minutes. We posted two videos this week to our YouTube Channel. The first video walks through the “Dividend Discount Model.” In it I explain how sensitive the “fair value” of the market can change with just a few small changes to the variables.
Here is a table illustrating the inputs. Remember, as growth expectations slow (perhaps due to a normal economic slowdown or a tariff induced recession) the risk premium also goes up. If interest rates also go up you get a very large drop in the “intrinsic value” of the stock market (what it is worth to investors). Remember, we’re well off the average right now for all of these components. The way you get an average is by spending time above and below it. The market gets above average growth and below average risk premium. A simple reversion to the average would cause the “value” of the market to drop by 19%.
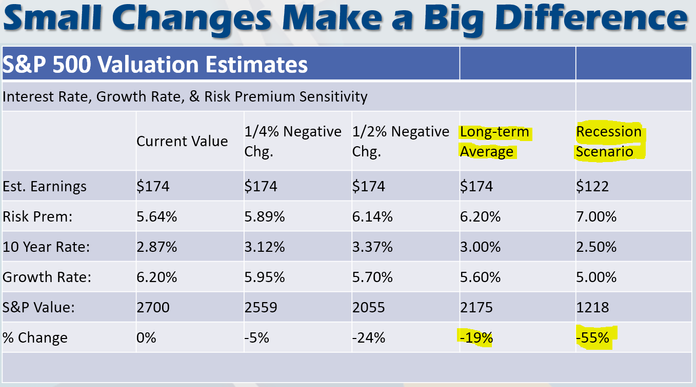
Things get worse if you get a recession scenario where the numerator (dividends, which drop due to a drop in earnings) and the denominator go the wrong way. It is completely reasonable to expect another 50% drop in the market during the next recession.
I started with the Dividend Discount Model because that is the basis for nearly all of Wall Street’s valuation models. We hear a lot about the “value factor” from some big name investment managers. This model is the starting point for their interpretation of value. They of course add many more inputs, which in our experience makes a model worse not better (we call it curve fitting).
It doesn’t need to be that difficult. We can look at the simple Price-Earnings ratio to see once again how quickly the price of the market can drop with just small adjustments in the inputs. This video walks you through those calculations.
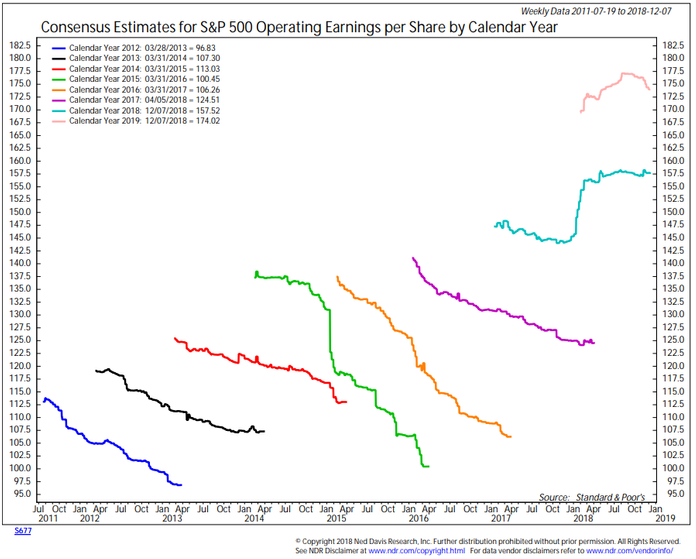
Here are some of the key charts from the video. The first shows the change in Wall Street’s estimates for earnings. Note how the estimates always drop from the initial estimate to the final number.
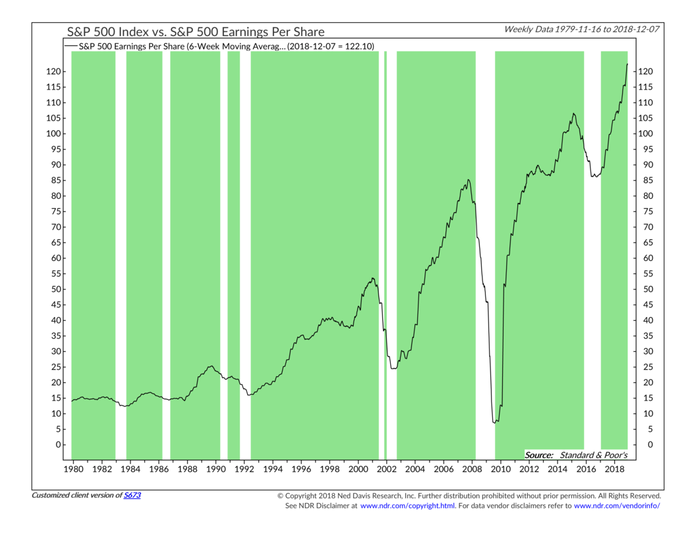
Looking at estimates over time, Wall Street has NEVER forecast a drop in earnings. Few people want to believe earnings can decline. Here’s a chart showing the S&P 500 earnings history. As you can see, earnings can and will go down.
This brings us to the most important chart — what would the “fair value” of the market be under various scenarios.
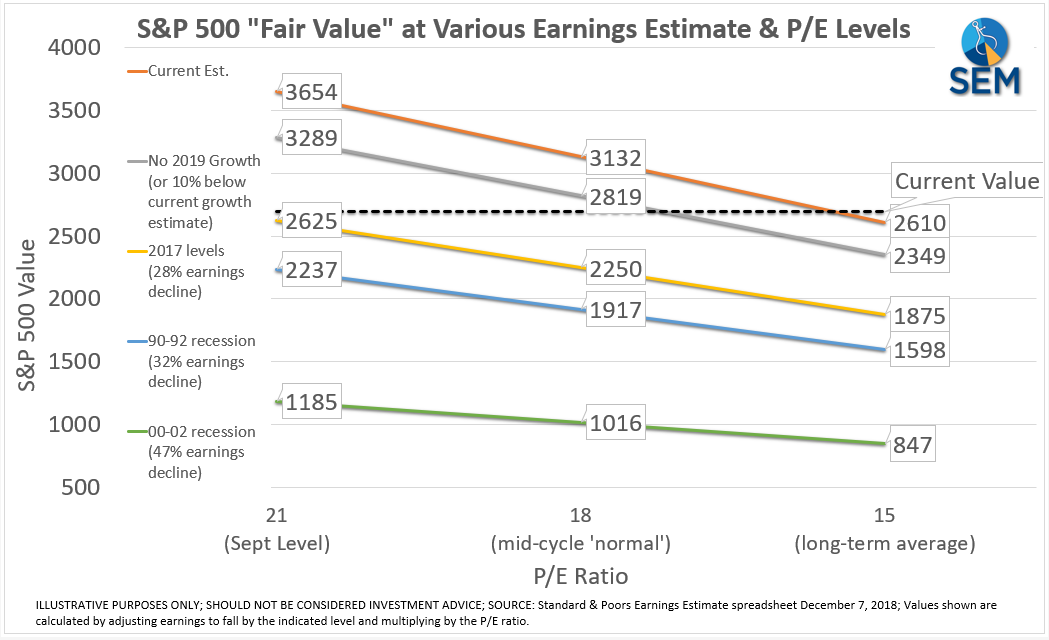
If you believe Wall Street’s estimates are right, earnings are going to constantly keep rising AND investors will keep paying prices for those earnings well above the long-term average, then the market is under-valued. If, however, you understand the markets and economy moves in cycles and there is a good chance earnings will decline, which always leads to a drop in the P/E ratio, then stocks are significantly overvalued.
How far the market falls is really dependent on how bad the next recession is. I can make a case for no recession, a mild recession, or a severe recession. Logic and experience tells me the next recession could be a big one. Our economic models are showing at a minimum the strong growth in 2018 was probably a short-term bump and 2019 at best will be a below average (2 to 3% GDP growth) year at best. This makes it very likely investors will not continue to pay 21 times future earnings.
The most important take away from all of this is the “models” Wall Street uses are highly dependent on human input. Humans are by nature emotional and prone to specific biases that create large swings in the variables and thus large swings in the prices in the market. Understanding this is the first step towards our Behavioral Approach to Investing.


