
Conservatism Bias: A belief preservation bias in which people maintain their prior views or forecasts by inadequately incorporating new information. Conservatism causes individuals to overweight initial beliefs about probabilities and outcomes and under-react to new-information; they fail to modify their beliefs and actions to the extent rationally justified by the new information. Financial Professionals may under-react to or fail to act on new information and continue to maintain beliefs close to those based on previous estimates and information (1).
Many of the common behavioral biases are inter-connected so I have not discussed Conservatism Bias much. This is most closely related to Availability Bias and its subset “recency” bias where individuals tend to take the current trends and project them out into the future.
Since early 2008 market participants have been used to a Federal Reserve in “easing” mode. First they dropped interest rates and when that did not work as rates hit 0% they shifted to Quantitative Easing (QE). It took 3 iterations of QE to jump start the economy. While they ended QE a few years ago and started raising rates in late 2015, they are just now starting to unwind the massive balance sheet they created under the QE programs. Congress, despite being urged by the Fed since 2008 to implement fiscal stimulus did not get around to doing anything significant until late last year. Unfortunately, the tax cut bill they passed could actually create a recession.
The fiscal stimulus passed by Congress is the latest a bill like this has ever been implemented in terms of the market cycle. We are already at or near full employment so any additional stimulus risks sparking inflation. The Fed hates inflation (as should you) and will do anything possible to prevent it. This includes raising interest rates and unwinding their balance sheet at a faster pace (pulling money out of the economic system.) The market is reacting accordingly although few financial professionals seem to have noticed.
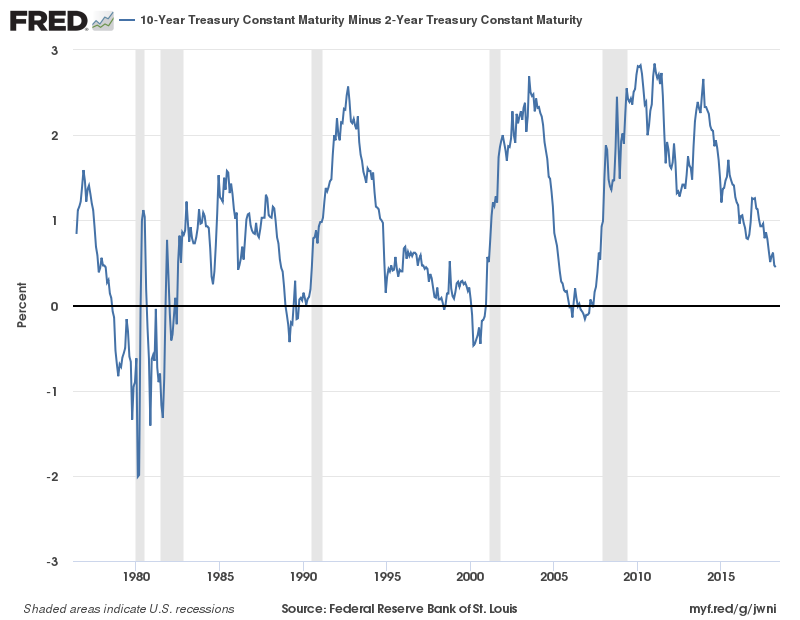
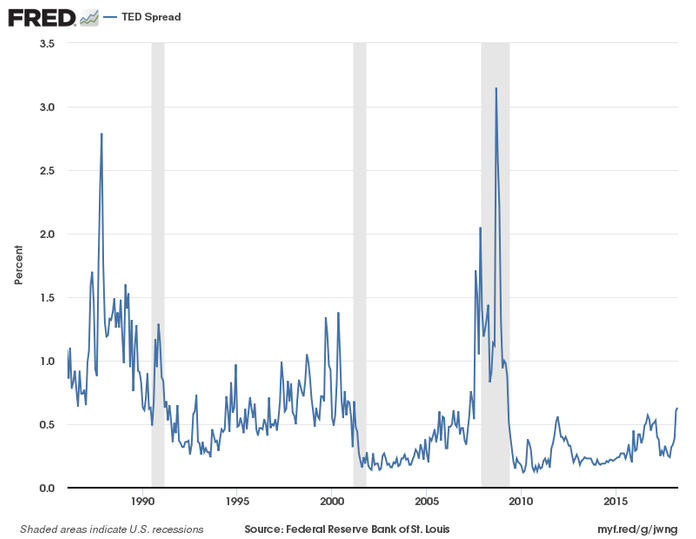
There are two measures that should be watched closely. The Treasury Spread (difference between 10 year and 2 year Treasury yields) and the TED Spread (difference between 3-month LIBOR and 3-month Treasury yields). The former is one of the best predictors of economic growth expectations by the financial markets. If this indicator goes negative it is a sign the financial markets are pessimistic about the short to intermediate-term, which leads to very tight financial conditions (lack of lending & increased risk management in the capital markets). This often first shows up in the TED spread.
Looking at these two measures, we can see financial conditions are the tightest we’ve experienced during the entire economic recovery.
As conditions get tighter all of the positives expected from the tax cuts could quickly go away. Financial professionals and individual investors alike need to understand this is something we have not seen in 10 years. Taking a step back and looking at history we can see the Fed almost always is the cause of a recession. The problem is it takes 9-12 months for changes in Fed policy to filter into the economy, but for whatever reason the Federal Reserve does not understand this. They are forced to make projections based on current data which leads them to push stimulus too far and pull it back too fast. This creates bubbles and the inevitable bursting.
Looking at the charts, notice recessions (the grey bars) do not occur immediately after the Treasury Spread going negative or the Ted spread spiking. However, it is a clear early warning sign that something is CHANGING. Do not fall into the traps of Conservatism Bias. This NEW INFORMATION tells us the approach that worked so well the last 9 years (buy & hold/passive investing) is not going to work for most people in the years ahead.
The best way to combat any behavioral bias is to base decisions on DATA (not your opinion). This is exactly why SEM deploys our Scientifically Engineered Models. It helps us overcome most behavioral biases, including Conservatism Bias. Our economic models are not yet concerned about the change in the Treasury Spread, but this is one of the indicators included in the economic model which runs our Dynamic Allocation programs. However, both our daily monitored tactical systems and our quarterly monitored AmeriGuard models have issued warnings that something is changing in the market.
Both models use price and volume data generated by the market participants. On Wednesday our Price Divergence System, which has been in use since our founding in 1992 gave a warning signal which took our Enhanced Growth (EGA) and Enhanced Portfolio Allocator models to 50% & 35% equity exposure. This was due to a lack of volume as the S&P 500 pushed towards the recent highs with declining volume. This signal may not be right (it has about a 65% winning percentage, which means it is wrong 35% of the time), but like AmeriGuard, it has led us to our lowest allocation since before the 2016 election.
Something is different — if you fail to acknowledge this you are destined to fall into many more behavioral mistakes when the market begins to fall.
SOURCE:
(1) The Behavioral Biases of Individuals; Behavioral Finance, Individual Investors, and Institutional Investors, 2016 CFA Level III Program Curriculum, pg 52-53


